Zeno: An Interactive Framework for Behavioral Evaluation of Machine Learning
Abstract.
Machine learning models with high accuracy on test data can still produce systematic failures, such as harmful biases and safety issues, when deployed in the real world. To detect and mitigate such failures, practitioners run behavioral evaluation of their models, checking model outputs for specific types of inputs. Behavioral evaluation is important but challenging, requiring that practitioners discover real-world patterns and validate systematic failures. We conducted 18 semi-structured interviews with ML practitioners to better understand the challenges of behavioral evaluation and found that it is a collaborative, use-case-first process that is not adequately supported by existing task- and domain-specific tools. Using these findings, we designed zeno, a general-purpose framework for visualizing and testing AI systems across diverse use cases. In four case studies with participants using zeno on real-world models, we found that practitioners were able to reproduce previous manual analyses and discover new systematic failures.
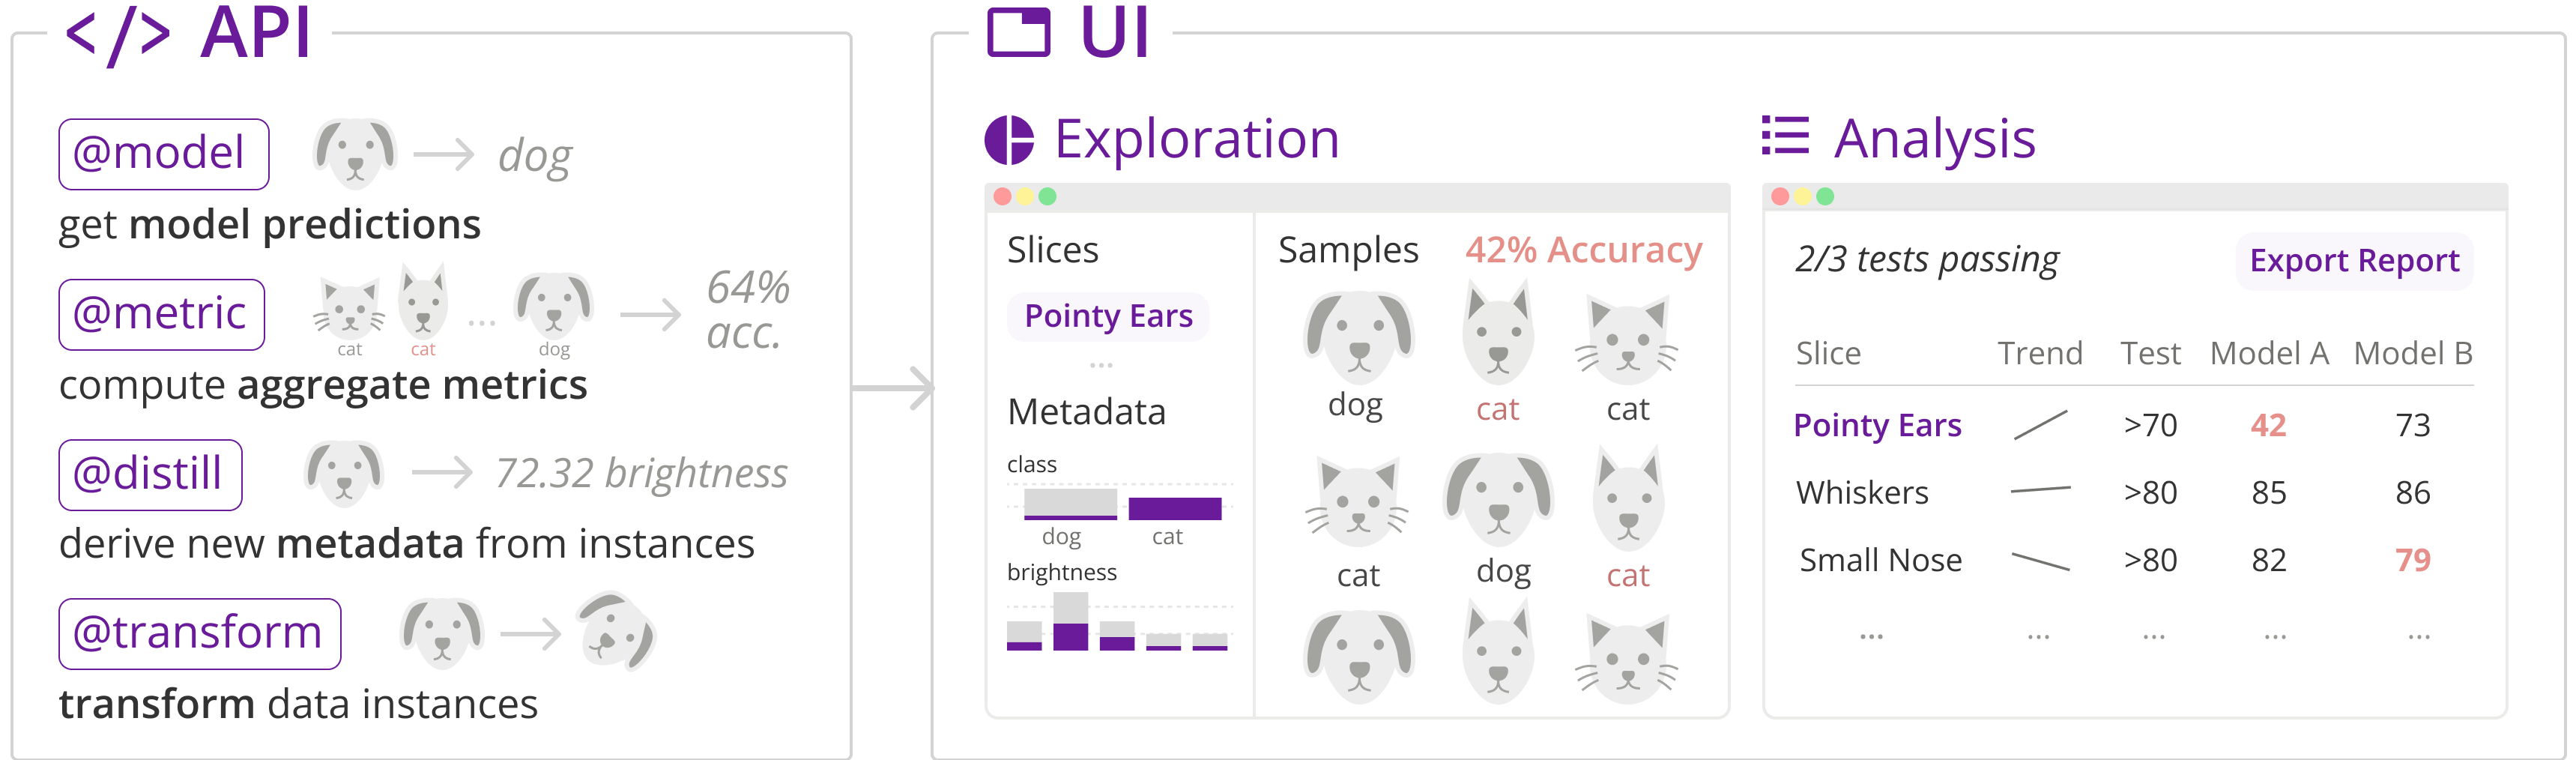
Two images of Zeno, the API and the UI. The API shows examples of python decorators that send important information to the UI. The UI shows that a user can create subsets of the data and create tests for performance for future model iterations.
1. Introduction
Machine learning (ML) systems deployed in the real world can encode problems such as societal biases (Barocas and Selbst, 2018) and safety concerns (National Transportation Safety Board, 2019). Practitioners and researchers continue to discover significant limitations and failures in state-of-the-art models, from systematic misclassification of certain medical images (Oakden-Rayner et al., 2020) to racial biases in pedestrian detection models (Wilson et al., 2019). In one classic example, Buolamwini and Gebru (2018) compared the performance of facial classification models across different demographic groups and found that the models performed significantly worse for darker-skinned women compared to lighter-skinned men.
Discovering and validating model limitations is often termed behavioral evaluation or testing (Rahwan et al., 2019). It requires going beyond measuring aggregate metrics, such as accuracy or F1 score, and understanding patterns of model output for subgroups, or slices, of input data. Enumerating what behaviors a model should have or what types of errors it could produce requires collaboration between stakeholders such as ML engineers, designers, and domain experts (Nahar et al., 2021; Subramonyam et al., 2021). Behavioral evaluation is also a continuous, iterative process, as practitioners update their models to fix limitations or add features while ensuring that new failures are not introduced (Cabrera et al., 2022).
Despite a growing focus on the importance of behavioral evaluation, it remains a challenging task in practice. Models are often developed without practitioners having clear model requirements or a deep understanding of the products or services in which the model will be deployed (Nahar et al., 2021). Furthermore, many behavioral evaluation tools, such as fairness toolkits, often do not support the types of models, data, and behaviors that practitioners work with in the real world (Deng et al., 2022). Practitioners end up manually testing hand-picked examples from users and stakeholders, making it challenging to effectively compare models and pick the best version to deploy (Hopkins and Booth, 2021).
Given the current state of behavioral evaluation for machine learning, this paper asks two guiding research questions: (1) What are the specific real-world challenges for ML evaluation which are shared across different models, data types, and organizations, and (2) Can an evaluation system addressing these challenges help practitioners discover, evaluate, and track behaviors across diverse ML systems. To this end, we make the following contributions:
-
•
Formative study on ML evaluation practices. Through semi-structured interviews with 18 practitioners, we identify common challenges for behavioral evaluation of ML systems and opportunities for future tools.
-
•
zeno, a general-purpose framework for behavioral evaluation of ML systems. We design and implement a framework for evaluating machine learning models across data types, tasks, and behaviors. zeno (Figure 1) combines a Python API and interactive UI for creating data slices, exportable reports, and test suites.
-
•
Case studies applying zeno on diverse models. We present four case studies of practitioners using zeno to evaluate their ML systems. Using zeno, practitioners were able to reproduce existing analyses without code, generate hypotheses of model failures, discover and validate new model behaviors, and come up with actionable next steps for fixing model issues.
2. Background and Related Work
zeno expands upon work on machine learning evaluation from the fields of human-computer interaction and ML. We first explore the current state of machine learning evaluation, including common techniques and approaches. We then describe existing tools for evaluation, and conclude with methods for improving collaboration and shared model understanding in data science and ML.
2.1. Behavioral Evaluation of Machine Learning
Evaluating a machine learning model is the challenge of understanding how well a model can accomplish a given task. The canonical approach to evaluation is to calculate an aggregate performance metric on a held-out sample of data or test set. But just as an IQ test is a rough and imperfect measure of human intellect, aggregate metrics are a rough approximation of model performance. They can, for example, hide systematic failures like societal biases, or fail to encode basic capabilities like correct grammar in NLP systems.
To detect and mitigate these important issues, the ML community uses more fine-grained evaluation approaches, often termed behavioral evaluation (Rahwan et al., 2019; Cabrera et al., 2022). Inspired by requirements engineering in software engineering, behavioral evaluation focuses on defining and testing the capabilities of an ML system, its expected behavior on a specification of requirements (Yang et al., 2022; Pei et al., 2022). For example, a practitioner creating a sentiment classification model might check that the model works for double negatives, is invariant to gender, and is accurate for short text. In addition to aggregate metrics, they would check how their model performs in these specific scenarios.
A central challenge in behavioral evaluation is deciding which capabilities a model should have. There can be a practically infinite number of requirements in complex domains, which would be impossible to list and test. Instead, ML engineers work with domain experts and designers to define the capabilities that a model should have as they iterate on and deploy their ML systems (Subramonyam et al., 2021). As end-users interact with the model in products and services, they also provide feedback on the limitations or expected behaviors that are then used to update the model (Cabrera et al., 2021).
In this work we further explore evaluation in practice through our formative study. We identify common challenges across domains and opportunities for future tools which we apply when designing and building the zeno system.
2.2. Model Evaluation Approaches
There are numerous ML evaluation systems for discovering, validating, and tracking model behaviors (Cabrera et al., 2022; Rahwan et al., 2019). The tools use techniques such as visualizations and data transformations to discover behaviors like fairness concerns and edge cases. zeno complements some of these systems and integrates the approaches of others.
The behavioral evaluation method most related to zeno is subgroup, or slice-based, analysis, calculating metrics on subsets of a dataset. An example tool for slice-based analysis is FairVis (Cabrera et al., 2019), a visual analytics system that allows users to compare subsets of data across metrics to discover intersectional biases. Errudite (Wu et al., 2019) is a similar system for NLP models with which users can create and test subgroups using structured queries. Another common method for behavioral evaluation is metamorphic testing (Chen et al., 2019a), a concept from software engineering that involves checking the outputs of a black-box system for inputs that are perturbed in a specific way. Checklist (Ribeiro et al., 2020) is a metamorphic testing tool for NLP models that perturbs text inputs, for example, switching proper nouns and testing if a model’s output switches. zeno enables users to do slice-based and metamorphic testing for any domain and task.
A central challenge for behavioral evaluation is discovering which behaviors a model has and are important for real-world performance. Various methods using algorithmic or crowdsourced techniques have shown promise in surfacing such behaviors. Algorithmic methods are a common approach for detecting groups of instances with high error, often termed “blindspots”. SliceFinder is one method that uses metadata to find slices with significantly high loss (Chung et al., 2019). Often, there is not enough metadata to define slices with high error, so another family of methods uses model embeddings and clustering to find groups with high error (Eyuboglu et al., 2022; d’Eon et al., 2021). Lastly, there are approaches that use end-user reports or crowd feedback to discover model failures or interesting behaviors (Attenberg et al., 2011; Cabrera et al., 2021; Nushi et al., 2018). zeno complements discovery methods by allowing users to formalize, validate, and track hypotheses of systemic errors over time.
Lastly, there are integrated platforms for model evaluation that combine multiple types of analyses. For instance, Robustness Gym (Goel et al., 2021) is a framework for NLP models that supports multiple types of evaluation, including adversarial attacks and robustness checks. The What-If tool (Wexler et al., 2019) is another interactive framework that focuses on using counterfactuals to understand model behavior and fix fairness concerns. We took a similar approach to these frameworks when designing zeno, but focused on the more general task of behavioral evaluation for any model or data type.
2.3. Collaboration and Reporting
Most ML models are developed by cross-functional teams with stakeholders in technical and non-technical roles. While collaboration is essential for deciding how a model should behave and identifying potential failures, there is often limited communication between stakeholders (Nahar et al., 2021). This can lead to unrealistic expectations of model performance or results that do not match designers’ expectations. Multiple methods have been proposed to improve organizations’ shared understanding of model behavior.
Interactive systems have shown promise for bridging model knowledge between engineering and other roles. One example framework, Symphony (Bäuerle et al., 2022), introduces modular data and model analysis components that can be used in both computational notebooks and standalone dashboards to enable more stakeholders to explore model behavior. Marcelle (Françoise et al., 2021) similarly uses modular components that allow users to modify an ML pipeline without writing code.
Complex models also require robust reporting methods to ensure that information about data and models is recorded and preserved. Datasheets for Datasets (Gebru et al., 2021), FactSheets (Arnold et al., 2019), Nutritional Labels (Stoyanovich and Howe, 2019), and Model Cards (Mitchell et al., 2019) codified the first principles for documenting ML details for future use and reproducibility. Extensions to these reporting methods, namely Interactive Model Cards (Crisan et al., 2022), have aimed to improve their usability by making them more expressive and interactive. zeno is primarily an interactive UI to enable diverse stakeholders to perform model analysis and export results that can be included in reporting methods like model cards.
3. Formative Interviews with machine learning practitioners
| ID | Role | Area |
|---|---|---|
| P1 | AI Software Engineer | AI Consulting |
| P2 | Data Scientist | Clothing Retail |
| P3 | CTO | Speech Training |
| P4 | CTO | Voice Assistant |
| P5 | Senior ML Engineer | Chatbot |
| P6 | Data Scientist | AI Non-profit |
| P7 | Data Scientist | Finance |
| P8 | MS Student | Educational Technology |
| P9 | ML Engineer | Chatbot |
| P10 | VP of Data Science | Business Intelligence |
| P11 | ML Engineer | AI Explainability |
| P12 | Data Scientist, ML | Ridesharing |
| P13 | Data Engineer | Educational Technology |
| P14 | CTO | Health Technology |
| P15 | CEO | Sensing |
| P16 | Data Scientist | Search and Recommendation |
| P17 | ML Research Scientist | Epidemiology |
| P18 | Data Scientist | Video Streaming |
We conducted semi-structured interviews with machine learning practitioners to explore our first research question: What are the common challenges for ML evaluation in practice? In particular, we aimed to understand the specific challenges practitioners face and the tools they use when evaluating ML models. The 18 participants, listed in Table 1, hold various roles related to machine learning development and deployment, from data scientists to CTOs and CEOs of small companies. The initial participants were recruited through posts on social media networks, e.g., Reddit, LinkedIn, and Discord, and through direct contacts at technology companies. Additional participants were then recruited through snowball sampling. Each interview lasted an hour via video call and participants were compensated with $20. The study was approved by our Institutional Review Board (IRB).
Two researchers analyzed the interviews using inductive iterative thematic analysis and affinity diagramming. From the first few interviews, the researchers extracted common themes around model evaluation, debugging, and iteration, grouping similar findings in an affinity diagram. After each subsequent interview, the researchers iterated on and refined the themes as needed. Recruiting for new participants was stopped when no new themes were produced from the last few interviews.
3.1. Aggregate Metrics Do Not Reflect Model Performance in Deployment
All practitioners (18/18) focus on improving aggregate metrics when developing new ML models, but, as P9 admitted, you “can perform very well on a training dataset, but when you go to ship the product, it doesn’t work nearly as well.” To ensure that models perform as expected when they are deployed, all practitioners also evaluate their models on real-world use cases. For example, P16 evaluates their text analysis model on a per-client basis since they had found that their model underperformed for certain types of data, e.g. healthcare notes, that it was not trained on. This type of behavioral analysis is often also called qualitative analysis, looking at specific instances and model outputs to confirm hypotheses of model behavior.
There are various methods practitioners described for discovering model limitations and failures, from end-user reports (see Section 3.3) to automated clustering algorithms. A common technique 11 of the 18 participants mentioned was creating their own data inputs to probe a model and find potential failures, often called “dogfooding” in software development. For example, when selecting an audio transcription service P3 “has some data collected we recorded ourselves, and then we pass it to different services and explore the structure of the output” to decide which service provides the qualitatively “best” output for their task. Two participants are exploring automated error discovery methods such as finding clusters with high error or using foundational models (Bommasani et al., 2022; Ribeiro and Lundberg, 2022) to generate new instances, but still primarily rely on human-generated feedback.
After generating hypotheses of systemic failures, many practitioners craft test sets to validate how prevalent behaviors are (10/18). The participants had different terms for these sets of instances, including “golden test sets”, “dynamic benchmarks”, “regression tests”, and “benchmark integration tests”. Despite the varied terminology, these tests have the same structure: Expectations for model outputs on different subgroups of instances. For example, P4 has multiple sets of text inputs with common human typos paired with valid outputs that they check before model releases.
None of the participants who conduct this type of behavioral evaluation use standardized frameworks. This is primarily because existing behavioral evaluation tools do not work for their data or model types, so they develop their own tools, such as scripts or web interfaces, to monitor model performance. All the participants who do not perform behavioral analyses (8/18) wish to conduct more detailed testing, for example, P1 wants “to do some other testing, but we don’t do anything because there’s not a really easy to set up system to do that”. Overall, bigger companies are able to dedicate more time to detailed evaluation and building customized tools that smaller companies cannot afford despite their need for more comprehensive evaluation (Hopkins and Booth, 2021).
3.2. Challenges in Tracking Continuous Model and Data Updates
All practitioners (18/18) we interviewed update their models as they design better architectures, gather more data, and discover real-world use cases and failures. Participants described this process with different terms, such as “rapid prototyping” or “agile” methods in which they quickly act on user feedback and deploy updated models. P4 and P13 even started with “wizard-of-oz” models with a human emulating an AI or non-ML models to gather data and model requirements before developing more complex models.
Although updating a model can improve the overall performance of an ML system, it can also lead to new failures. This is especially true for stochastic models, such as deep learning, which cannot be deterministically updated. As P5 lamented, “our test set would become so large that if we had to fail for less than 5 [tests] it became super hard to make progress”. Model updates are even more complicated for teams that rely on external AI services, as practitioners do not control when or how services are updated (Chen et al., 2021). For example, P3’s team had to switch their voice-to-text service from Google to Amazon because Google stopped detecting filler words such as ‘um’ after a model update, which was necessary for their product.
Due to these frequent updates, it becomes important to compare models across important behaviors. However, since many model evaluations are run inconsistently and across different tools, the history of past performance is often fragmented or lost, making it difficult to find regressions or new failures.
3.3. Limited Collaboration in Cross-Functional Teams
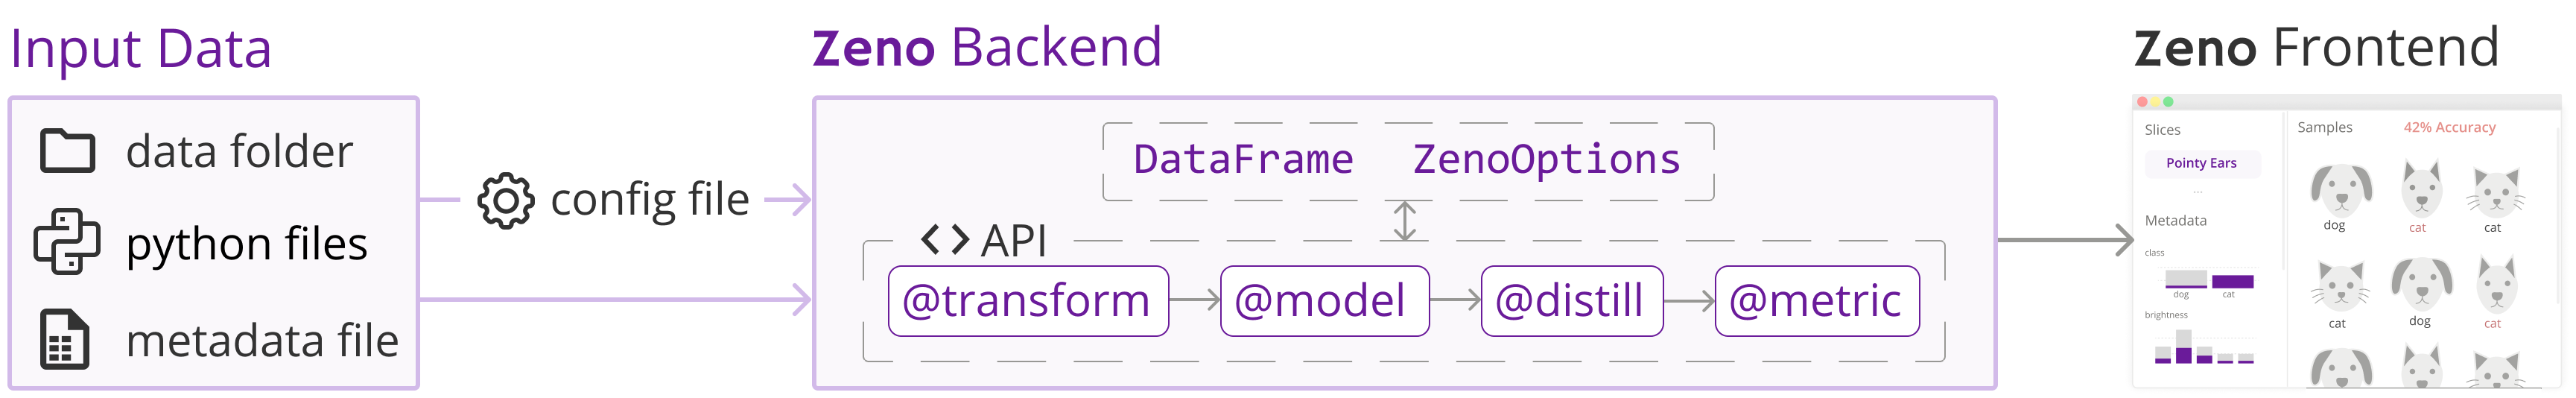
Diagram of the Zeno Backend and the Zeno Frontend. The diagram shows the Zeno Backend taking input data and the API from the user and generating the Zeno Frontend.
Modern machine learning development in practice is a collaborative effort that spans different teams and roles. Each member of a team needs a robust mental model of how an ML system behaves to resolve customer complaints, make management decisions, validate failures, and more.
A common collaboration challenge is making sense of failure reports (Cabrera et al., 2021) from end-users. 12 of the 18 participants’ teams have customer service representatives who parse tickets or complaints from end users and pass them to the engineering teams. These participants found it challenging to reproduce the reports from end users, which were primarily made up of one-off instances and broad descriptions. P4’s team tackles this challenge with an “internal website where anybody can put potential inputs and expected model outputs” which new models are tested on.
Another collaboration challenge described by 14 participants is communicating model performance with managers and other stakeholders. For example, P16’s management team often makes decisions based solely on a high F1 score, while it is often the case that different clients require different trade-offs between precision and recall. Many decisions on whether or not to deploy an updated model requires shared knowledge and conversations between engineers, managers, and customers on whether a new model is holistically better than the existing model.
Since engineers often run analyses in ad-hoc scripts or notebooks, knowledge of model behavior can be isolated. Other stakeholders do not know how a model tends to behave, and can neither make informed decisions on model usage nor provide information about model errors to engineers for debugging.
4. Design Goals
From these interviews and the reviewed studies on ML evaluation, we distilled a set of design goals that a behavioral evaluation system should have. The goals focus on general evaluation challenges identified in the formative study, such as defining behaviors and comparing models. With a system for behavioral evaluation, a user should be able to:
-
D1.
Evaluate models with different architectures, tasks, and data types. Machine learning is a broad field with diverse models and tasks ranging from audio transcription to human pose estimation. To reduce the learning curve and encourage the reuse of analyses, users should be able to use one framework to perform behavioral evaluations on most ML tasks.
-
D2.
Define and measure diverse model behaviors. Model behaviors are varied and complex, from demographic biases to grammatical failures. Users should be able to encode most of the behaviors across which they wish to evaluate their models.
-
D3.
Track model performance over time. Practitioners are continually deploying updated models with new architectures trained on improved data. Users should be able to track performance across models and find potential regressions.
-
D4.
Evaluate model performance without programming. Modern machine learning systems are built by large cross-functional teams with nontechnical users. Users should be able to perform behavioral analyses of models without having to write code.
5. Zeno: An Interactive Evaluation Framework
We used these goals to design and implement zeno, a general-purpose framework for evaluating ML systems across diverse behaviors. zeno is made up of two linked components, a Python API and an interactive user interface (UI). The Python API is used to write functions providing the core building blocks of behavioral evaluation such as model outputs, metrics, metadata, and transformed instances. Outputs from the API are used to scaffold the interactive UI, which is the primary interface for doing behavioral evaluation and testing. The zeno frontend has two primary views: an Exploration UI for discovering and creating slices of data and an Analysis UI for writing tests, authoring reports, and tracking performance over time (D3).
Originally, we explored implementing zeno as either a plugin for computational notebooks or a standalone user interface. We decided on a combined programmatic API and interactive UI as we found it could make zeno both extensible and accessible. The general Python API allows zeno to be applied to diverse models, data types, and behaviors (D1, D2), while the interactive UI allows nontechnical users to run evaluation (D4).
zeno is distributed as a Python program. The Python package includes the compiled frontend which is written in Svelte and uses Vega-Lite (Satyanarayan et al., 2017) for visualizations and Arquero (Heer, 2020) for data manipulation. To run zeno, users specify settings such as test files, data paths, and column names in a TOML configuration file and launch the processing and UI from the command line (Figure 2). Since zeno hosts the UI as a URL endpoint, it can either be run locally or run remotely on a server with more compute and still be accessed by users on local machines. This architecture can scale to large deployed settings and was tested with datasets with millions of instances (e.g. DiffusionDB (Wang et al., 2022), 2 million images (Section 6.4)).
5.0.1. Running example
To explain zeno’s concepts, we walk through an example use case of a data scientist working at a company deploying a new model. In the following sections, we use block quotes to show how zeno’s features would be used in the example.
-
Emma is a data scientist at a startup developing a voice assistant. Her company is using a simple audio transcription model and she has been tasked with understanding how well the model works for their data and what updates they need to make.
5.1. Python API: Extensible Model Analysis
A core component of zeno is an extensible Python API for running model inference and data processing. The ML landscape is fragmented across many frameworks and libraries, especially for different data and model types. Despite this fragmentation, most ML libraries are based on Python, so we designed the backend API for zeno as a set of Python decorator functions that can support most current ML models (D1).
The zeno Python API (Figure 3) consists of four decorator functions: @model, @metric, @distill, and @transform. We found that these four functions support the building blocks of behavioral evaluation. All four functions take the same input, a Pandas DataFrame (McKinney, 2010) with metadata and a ZenoOptions object. We chose Pandas as the API for the metadata table due to its popularity, which lowers the learning curve for writing zeno functions for many data scientists. The ZenoOptions object passes relevant information such as column names and static file paths to the decorated API functions. Since zeno calls API functions dynamically for different models and transformed inputs, ZenoOptions is necessary for a function to access the correct columns of the DataFrame.
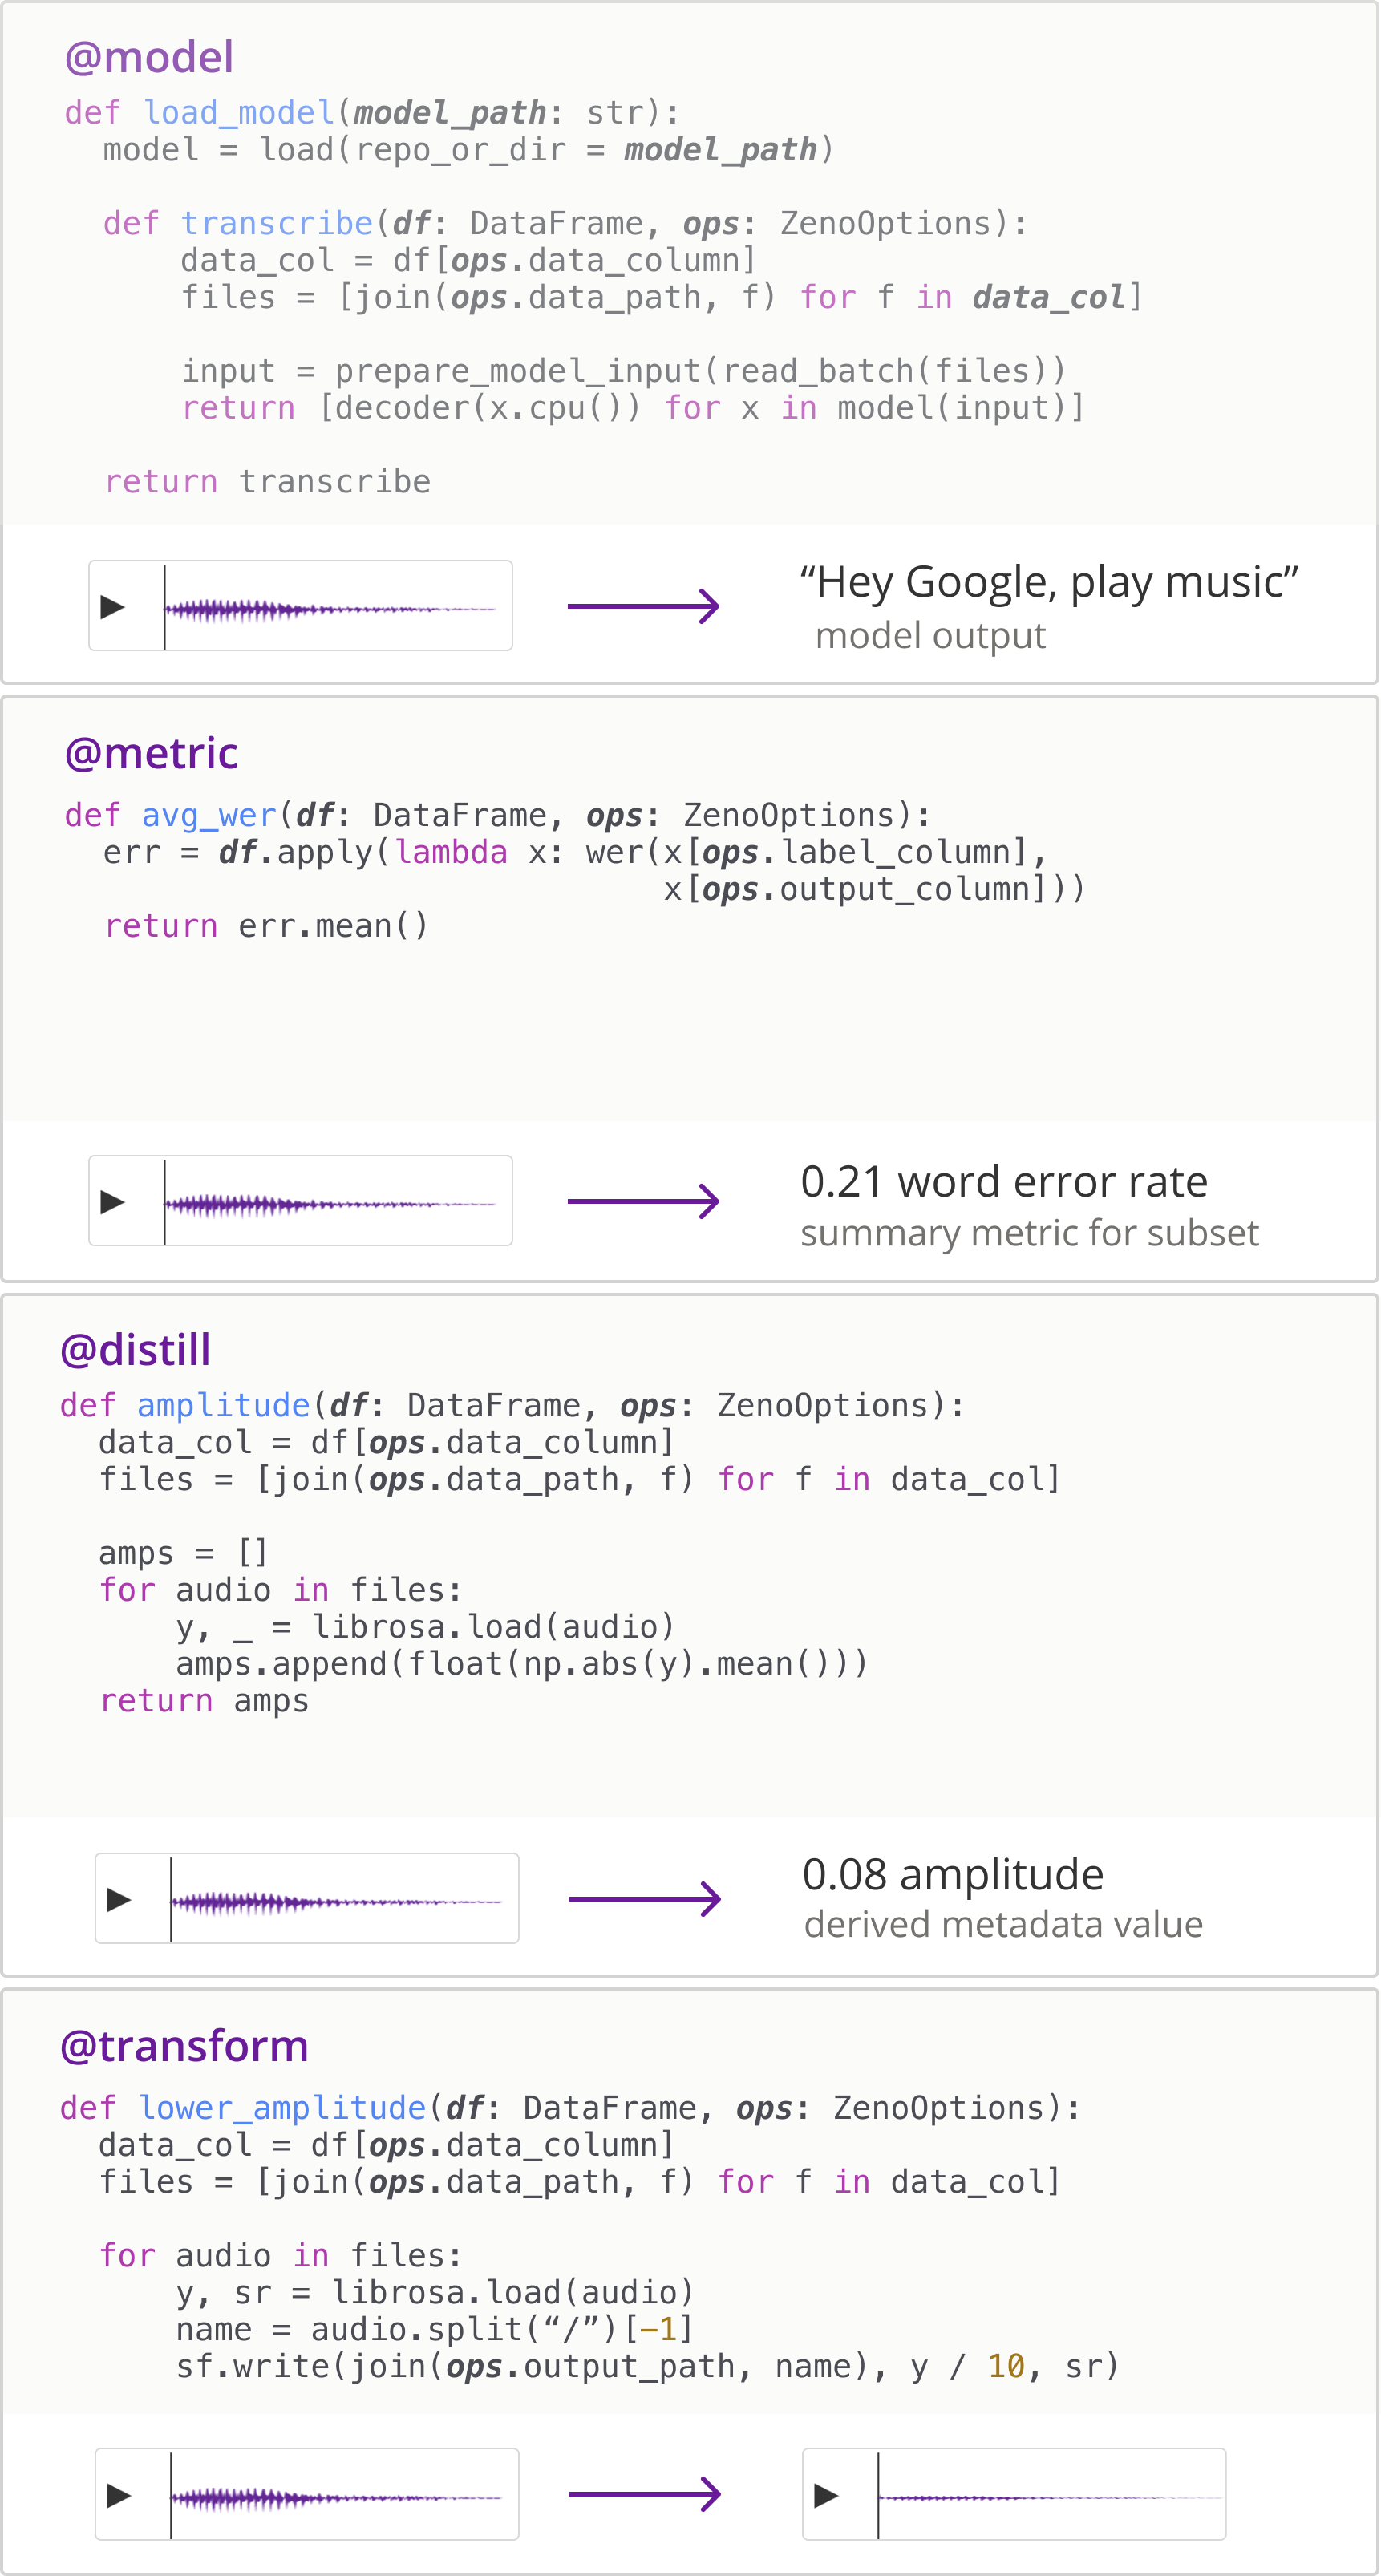
Four images showing the @model, @metric, @distill, and @transform API with code examples for each. Each image example also includes a real application with speech data for a speech-to-text model.
The two core functions that a user must implement to use zeno are the @model and @metric functions. Functions decorated with @model return a new function that returns the outputs for a given model. Since this function is model-agnostic, any ML framework or AI service can be evaluated using zeno (D1). The @metric decorated functions return a summary number given a subset of data. @metric functions can return classic metrics such as accuracy or F1 score, but can also be used for specific tests such as calculating the percentage of changed outputs after data transformations (D2).
-
Emma writes a @model function which calls her transcription model and returns the transcribed text. She then uses a Python library to implement various @metric functions for common transcription metrics such as word error rate (WER).
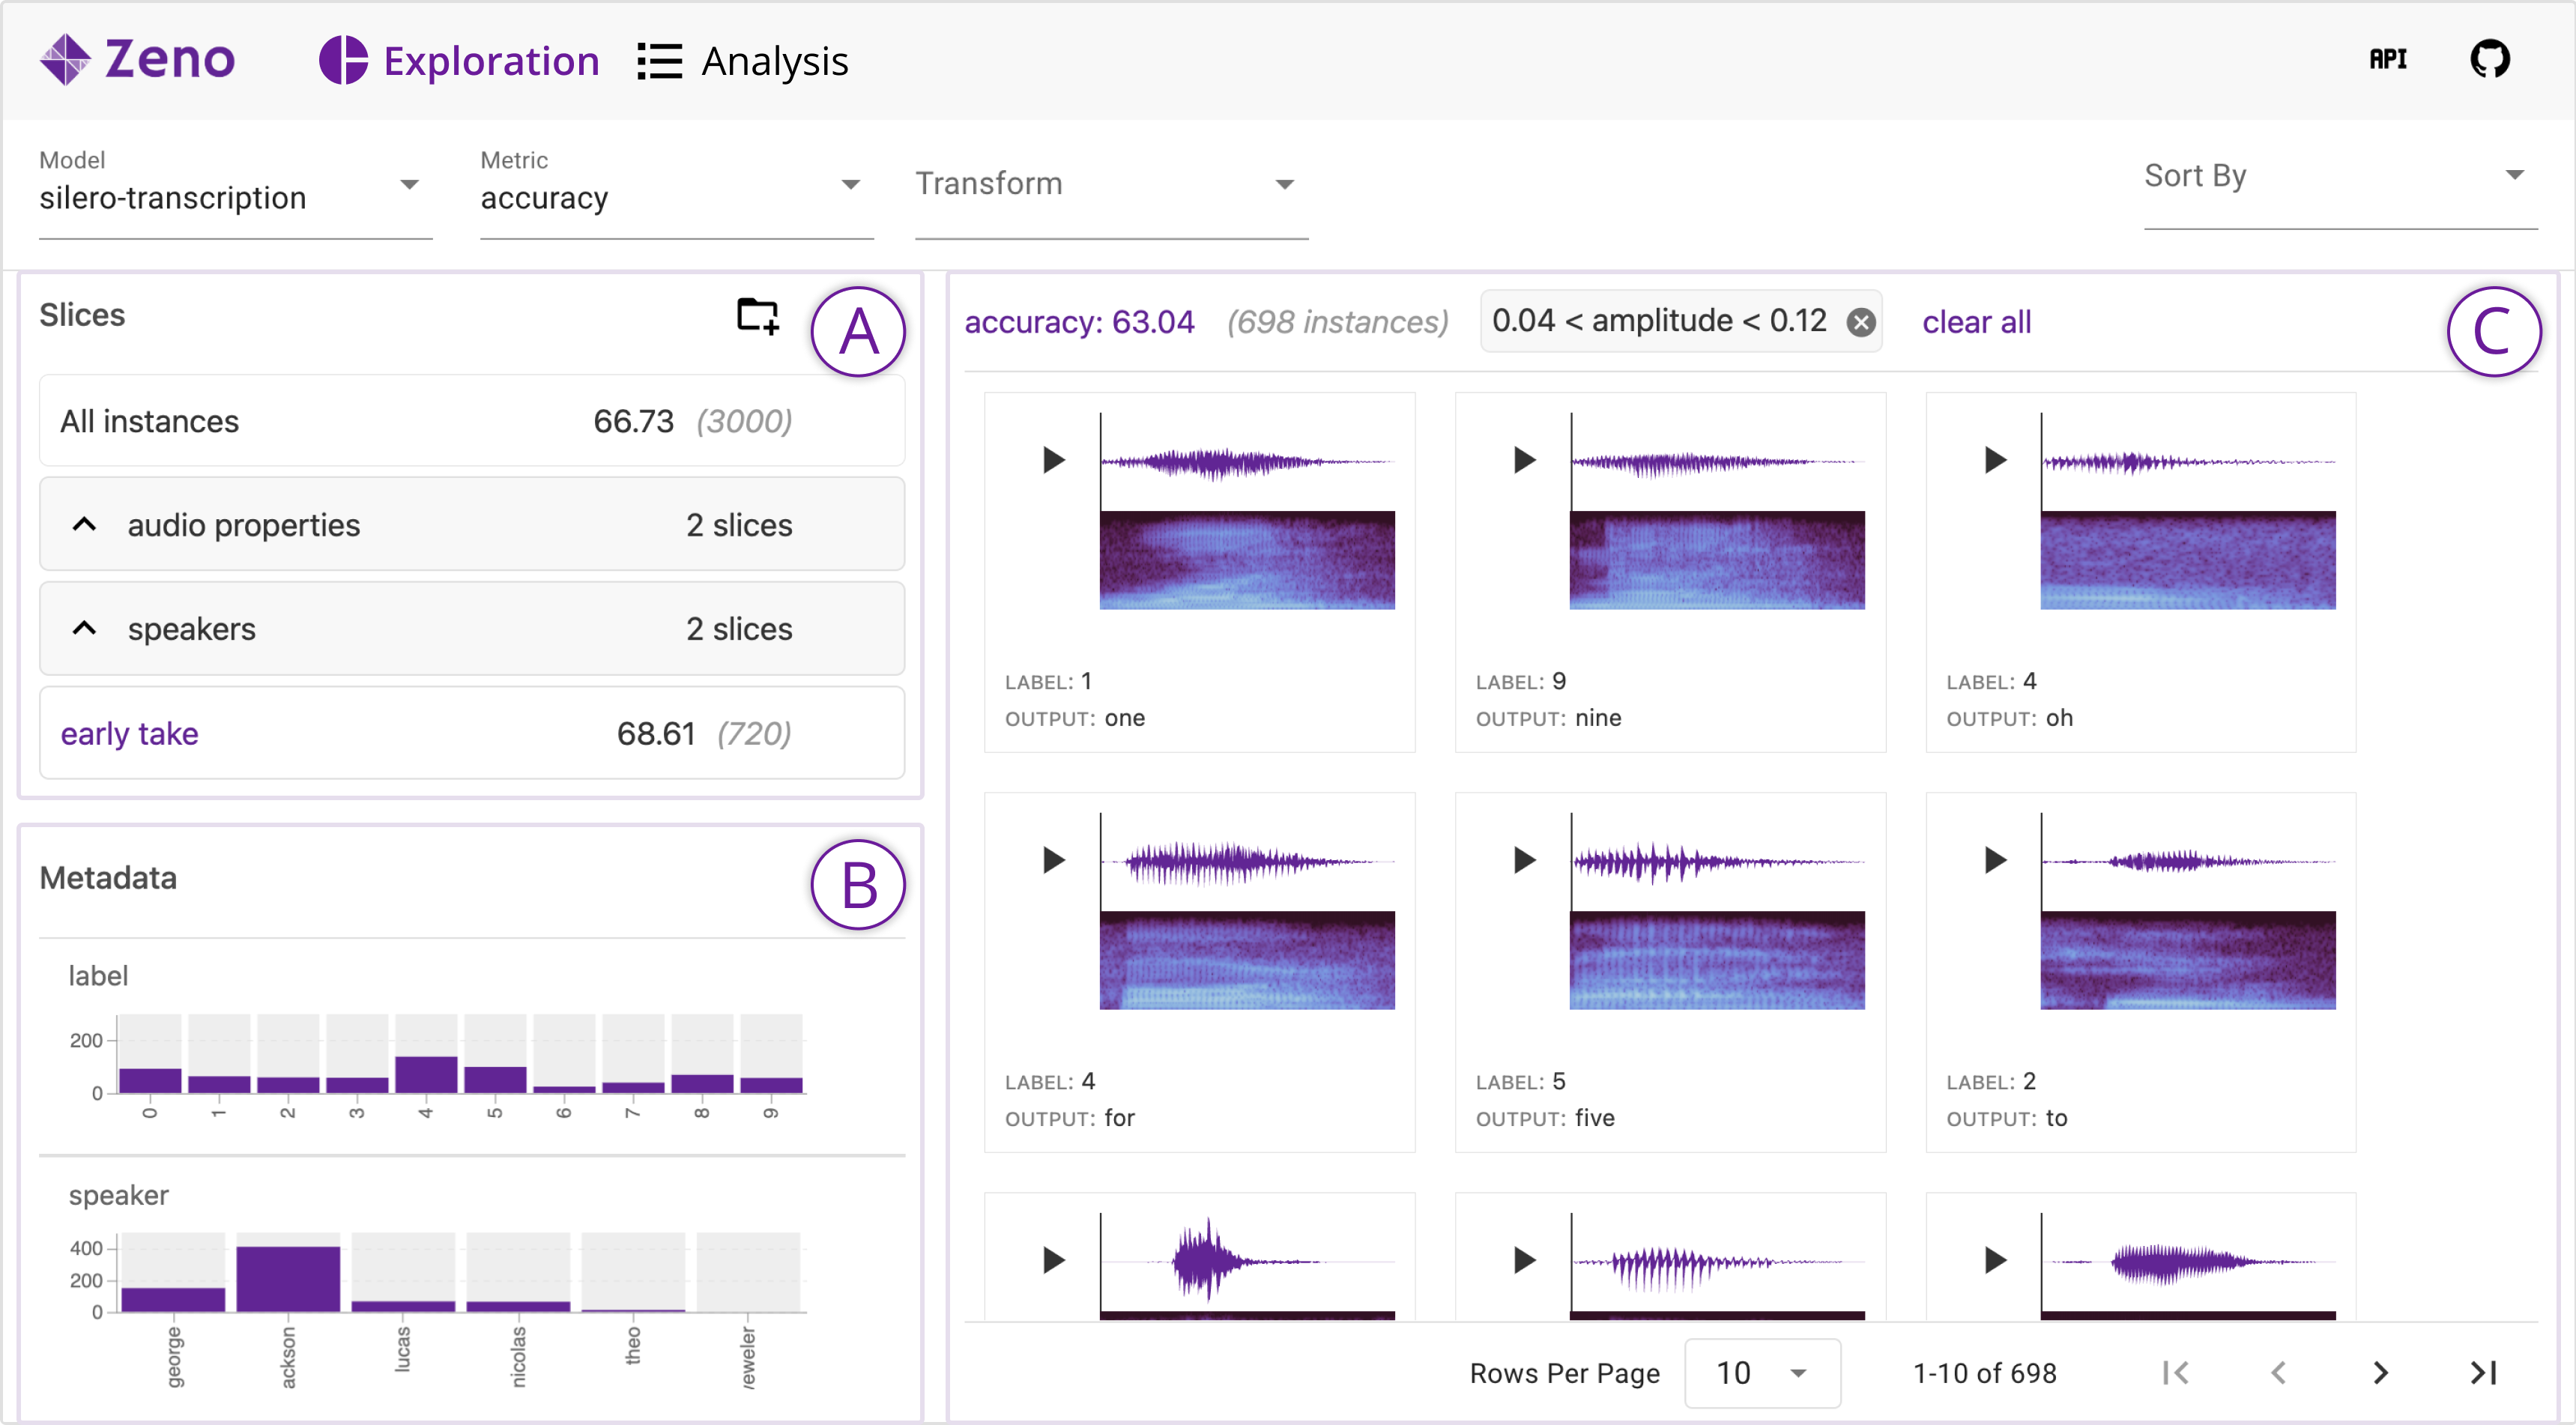
Image of the Zeno Exploration tab in the UI. This image shows a main data instance view that shows the data itself with its label and prediction. Next to it is a sidebar with histograms for each metadata and created data slices.
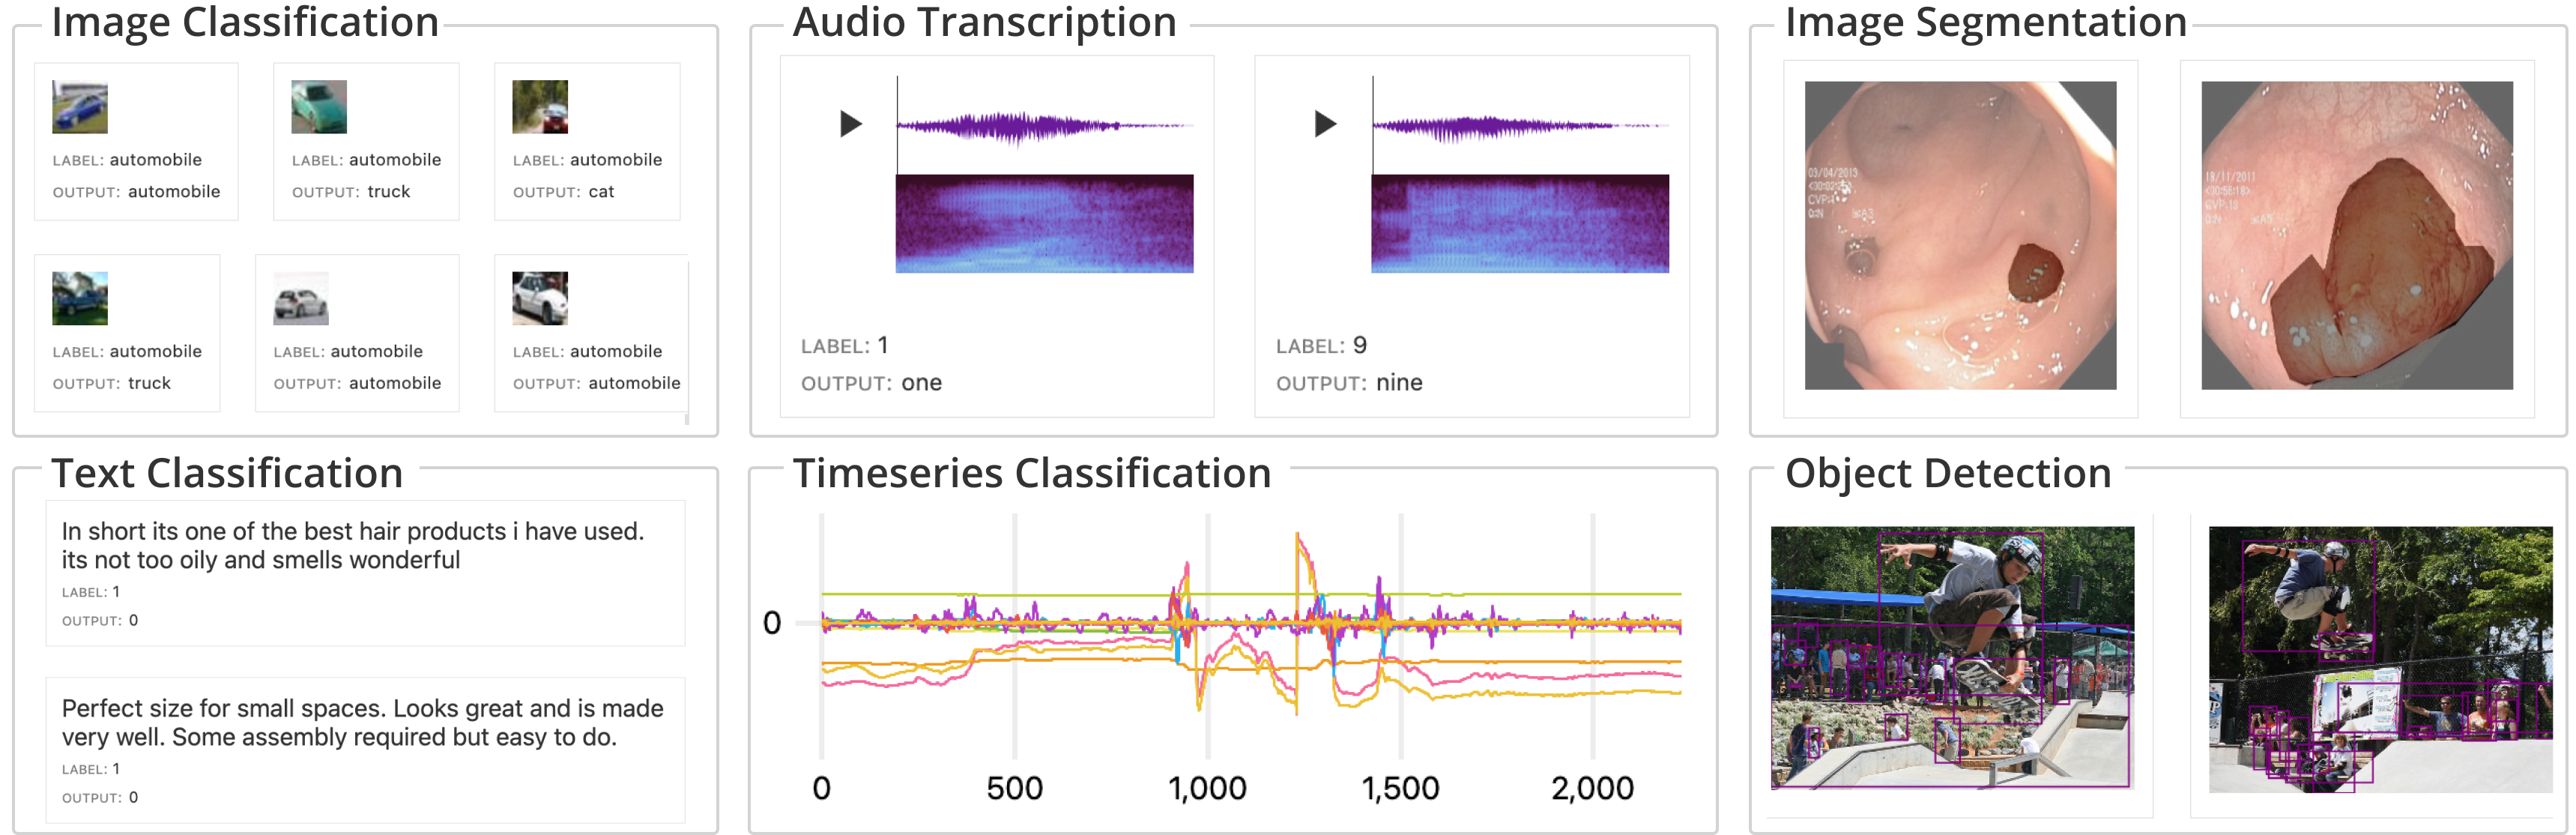
Six examples of data views that visualize a specific data instance to be used in Zeno. One for each different type of application: Image Classification, Audio Transcription, Image Segmentation, Text Classification, and Object Detection.
The two other zeno decorator functions provide additional functionalities that support behavioral evaluation. Datasets often do not have sufficient metadata for users to create the specific slices across which they wish to evaluate their models. For example, a user may want to create a slice for images with low exposure, but most image datasets do not have the exposure level of an image in the metadata. @distill decorated functions return a new DataFrame column for a dataset, extracting additional metadata from instances, and allowing users to define more specific slices (D2). Users may also want to check the output of their model on modified instances, especially for robustness analyses or metamorphic tests. The @transform function returns a new set of modified instances from a subset of instances. For the image exposure example above, a user could write a transformation function that darkens images to check how a model performs for different exposures.
-
Emma knows her users have a range of microphones across which she wants her audio transcription model to work well. To test these types of scenarios, she writes a @distill function that calculates the amplitude of the sound inputs and a @transform function that adds different types of noise.
The zeno backend builds a data processing pipeline to run the decorated functions and calculate the outputs for the frontend. For example, zeno parses the code of each @distill function to decide whether it depends on model outputs and must be run for each model. Additionally, zeno runs the processing and inference functions in parallel, which is especially helpful for transform functions, since each @distill and @model function needs to be run on each transformed instance. Lastly, all zeno function outputs are cached so any runs after the initial processing are instant.
5.2. Exploration UI: Create and Track Slices
To empower nontechnical stakeholders to perform behavioral analyses, the main interface of zeno is an interactive UI (D4). Although the initial @model and @metric functions are required to initially set up zeno, the core behavioral evaluation steps can all be done in the frontend UI by nontechnical users.
The primary tasks in behavioral evaluation are creating subsets of data and calculating relevant metrics. The Exploration page is the initial interface for zeno and allows users to explore, filter, and create slices of data. It is divided into two sections, the instance view and the metadata panel.
The instance view (Figure 4, C) is a grid display of data instances, ground truth labels, and model outputs. Users can select which model output they wish to see, which metric is calculated, and which transformation is applied to the data using the drop-down menus at the top of the UI. A key feature of the instance view is that it is a modular Python package that supports any model and data type (D1). Each view is a separate Python package that implements a JavaScript function to render a subset of data. While views are JavaScript functions, they are packaged as Python libraries so users can install the views they need the same way they install the zeno package. There are currently 6 views implemented (Figure 5), and additional views can be created using a cookiecutter template.
The metadata panel (Figure 4, A & B) provides summary visualizations of the metadata columns and previews of user-generated data slices. Each metadata column is shown as a row in the metadata panel, displayed with a different widget depending on what type of metadata it is. zeno supports 5 main metadata types: continuous, nominal, boolean, datetime, and string. Each metadata widget is interactive and can be filtered to reactively update the instance view and other metadata widgets. When a metadata column is filtered, the filter is shown above the instance view and the selected metric is calculated for the current subset.
When a user finds an interesting or significant subset of data, they can save the current filters as a formal slice. Slices can also be created in the slicing panel, which allows users to visually define and join filter predicates on metadata columns. These slices are displayed at the top of the metadata panel with their size and the selected metric, providing a quick look at the performance for each slice. Users can also create folders to organize their slices.
-
Emma runs zeno to analyze her transcription model in the Exploration UI. First, she filters the amplitude metadata widget and finds that the model is significantly worse at transcribing quiet audio. To track this subset, she creates a slice and puts it in the audio properties folder (Figure 4, A). She then selects the white noise transformation and sees that the error rate increases significantly. She notes that they may want to augment their training data with noisy instances.
5.3. Analysis UI: Track and Test Slices Across Models
Once users have created the slices they wish to track using the Exploration UI, they are faced with the challenge of comparing models and slices. The Analysis UI (Figure 6) provides visualizations, reporting tools, and testing features to help users better understand and compare the performance of multiple models (D3).
At the bottom of the Analysis page (Figure 6, F) is a table showing the slices created in the Exploration page. To help users navigate the slices, folders are shown as tabs above the table and can be used to filter which slices are shown. Users can also select which metric and transform is applied to each slice, and the resulting metric is shown as a column for each model. To make it easier to detect trends in slice performance over time, zeno shows a sparkline of the selected metric across models for each slice (D3).
A common phenomenon for models deployed in the real world is domain shift, where the real-world data distribution changes over time and model performance degrades (Moreno-Torres et al., 2012). To alert users of potential regressions in model performance, zeno detects slices with performance that decreases between models. For each slice, zeno fits a simple linear regression of the selected metric across models, and users are alerted of slices with significant negative slope by a downward arrow next to the sparkline (D3). zeno also highlights slices with high variance, indicating potential unexpected behavior, with a red up-and-down arrow next to the sparkline.
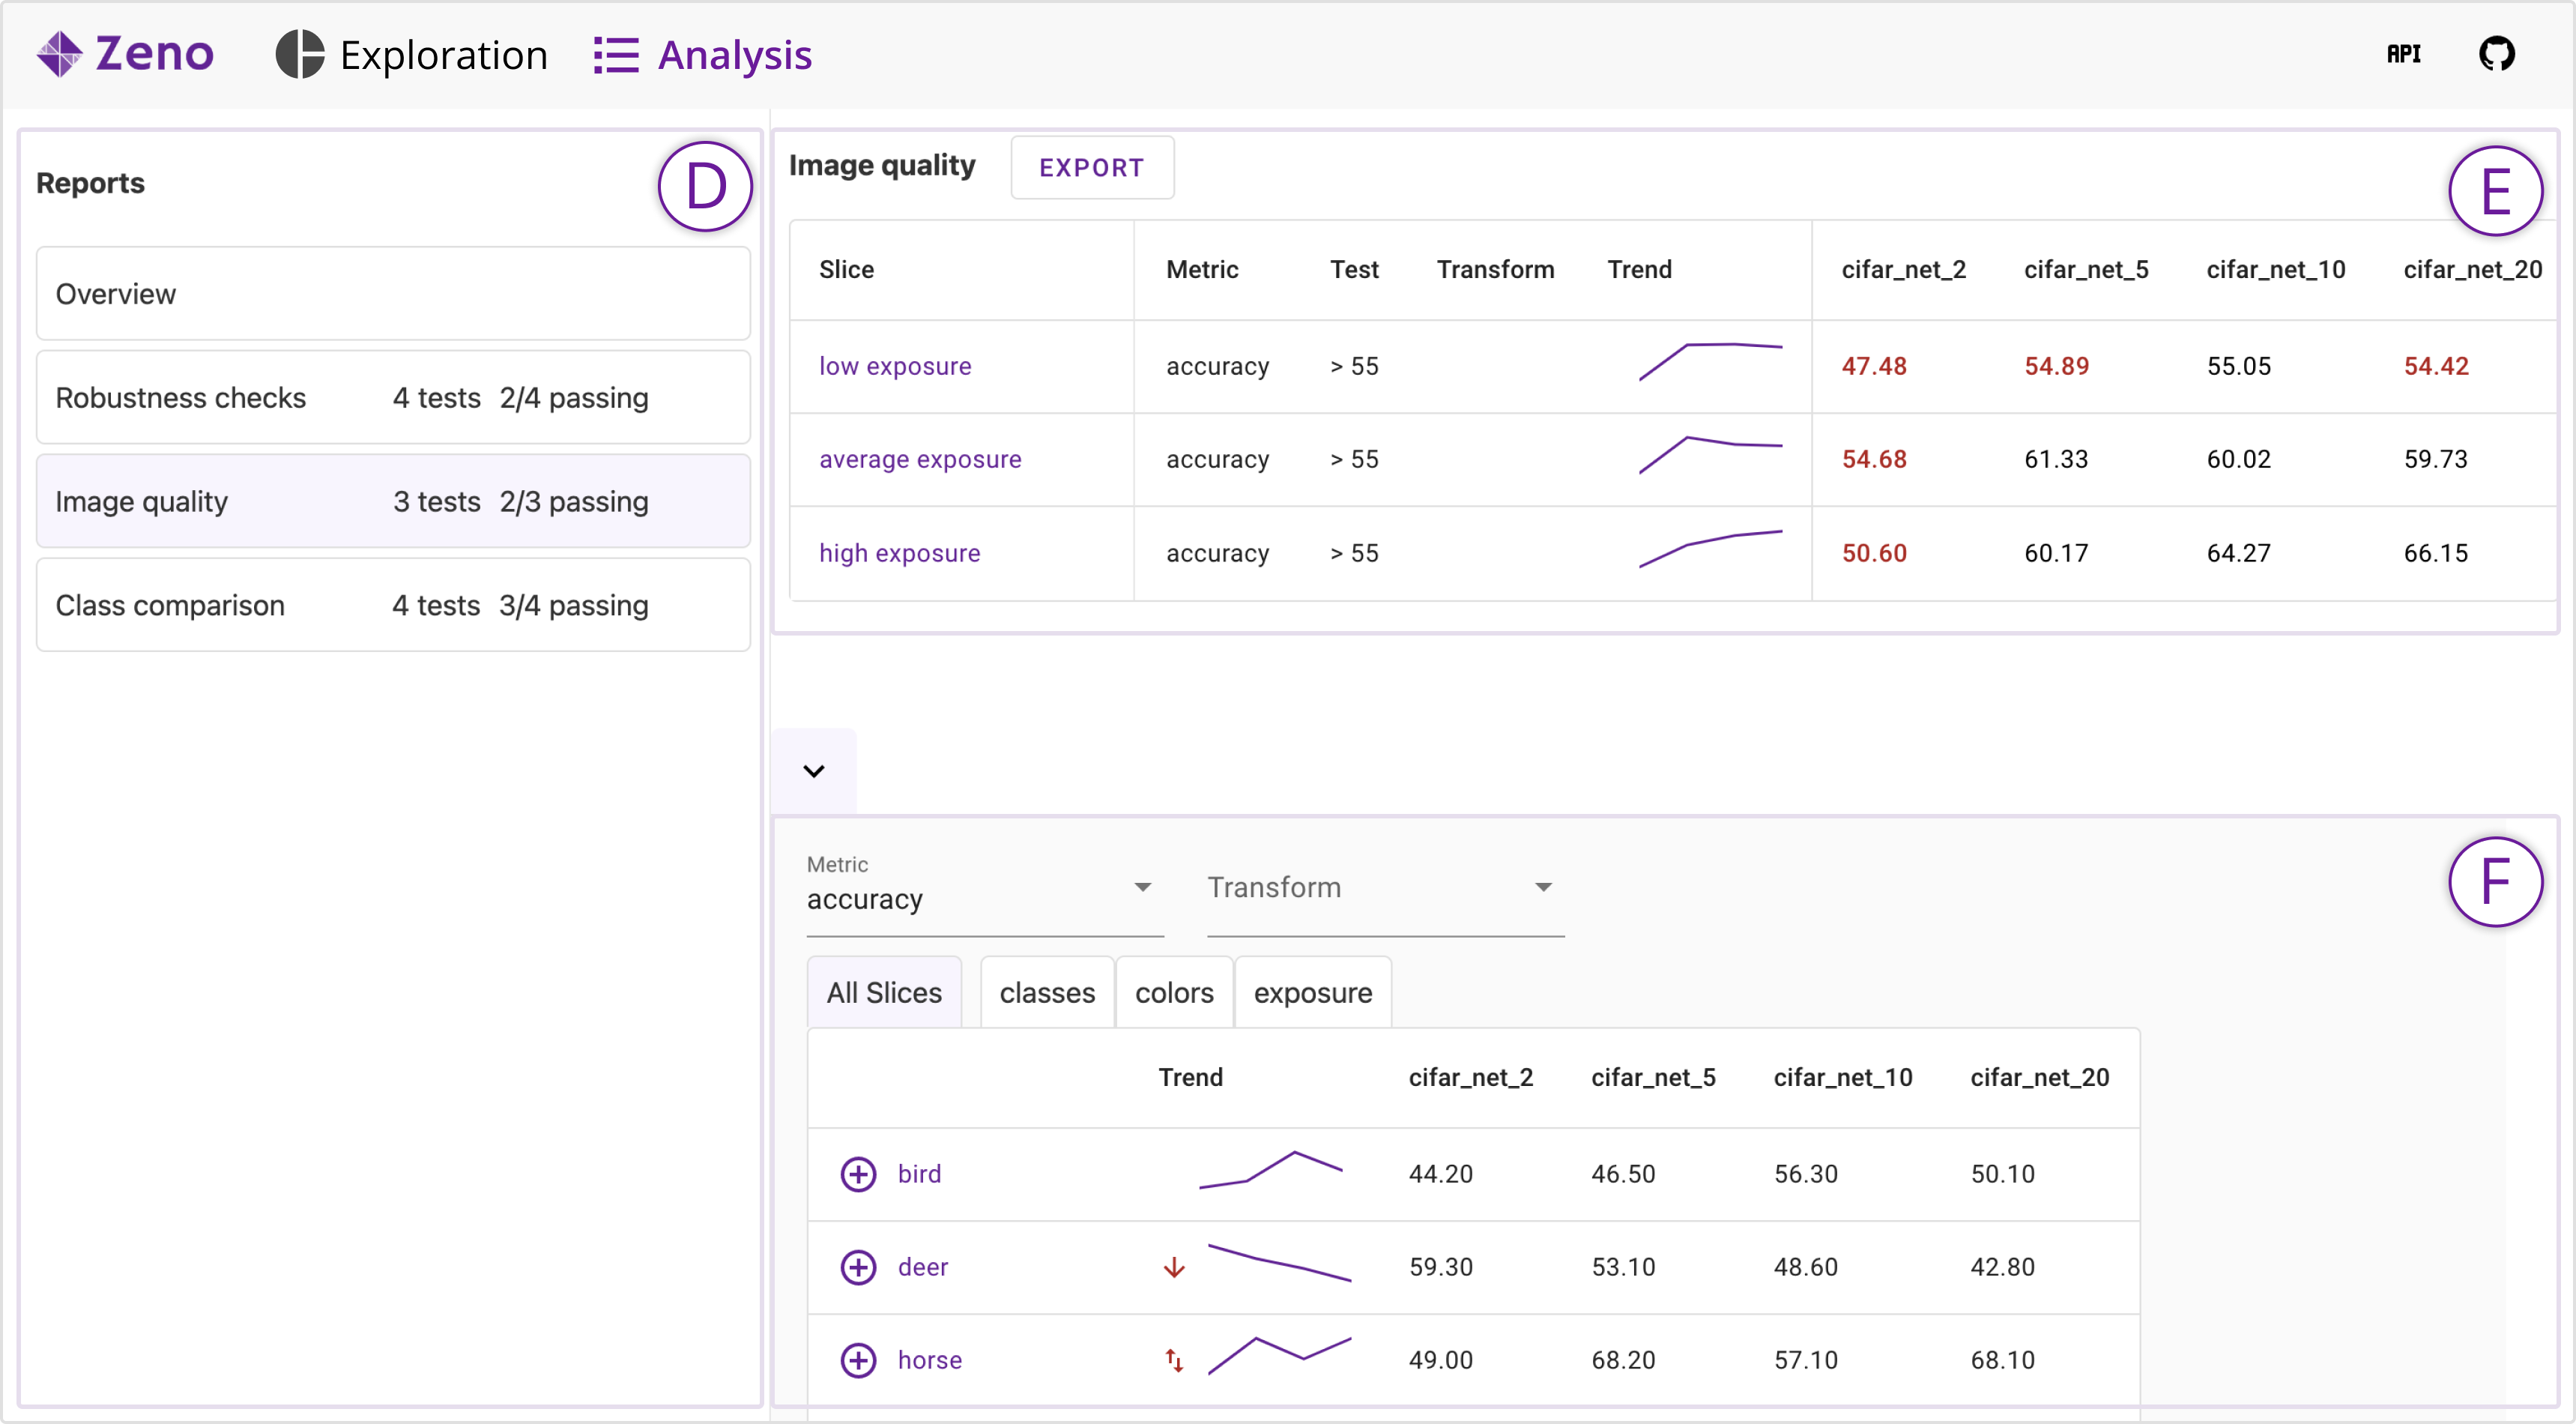
Image of the Zeno Analysis tab in the UI. The image shows performance on created subsets of data. It visually shows in red where the model is failing a behavioral test specified by the user.
Since domain shift and model updates can lead to unexpected changes in model performance, users may want to set tests for expected slice metrics. We term these behavioral unit tests, functions that determine whether a metric for a slice is in an expected range, such as . To create tests, users first create a new report (Figure 6, D), a collection of slices, and add to it the slices they wish to test. They can then set an expectation for a certain metric on each slice using boolean predicates on the metric value. Models for which the test fails are highlighted in red in the report table, with the overall number of tests that failed for the most recent model shown next to each report in the report panel. Reports can be exported as PDFs to be shared externally from Zeno (D4).
-
Emma uses the insights from the Exploration UI to train a few new models with new and augmented data. In the Analysis UI she sees that her new models are performing better for noisy input audio, but there is a decreasing trend for instances with lower amplitude. To ensure that this trend does not continue, she creates a new report and adds slices for different levels of amplitude. She then creates behavioral unit tests expecting each slice to have an accuracy of over 65%.
6. Case Studies
We collaborated with four ML practitioners to set up zeno on models they developed or audited in their work. The goal of these case studies was to answer our second research question, whether zeno can help practitioners working on diverse ML tasks effectively evaluate their models and discover important behaviors. We chose these case studies as they represented a wide range of tasks (binary classification, multi-class classification, image generation) and data types (text, images, audio), testing how well zeno generalizes.
Before each study, we met with the case study participant to understand the types of ML systems they use and decide which model(s) they wished to evaluate using zeno. We then worked with them asynchronously to set up an instance of zeno, with their model, which they could access on their computer. Finally, we conducted a one-hour study with an interview and think-aloud session (two in-person, two virtual). During the study’s first 15-30 minutes, we asked participants about their existing approaches to model evaluation and the challenges they face. For the remainder of the study, participants shared their screen and used zeno to evaluate the ML model, describing their thought process and findings while mentioning limitations and desired features. Our Institutional Review Board (IRB) approved this as a separate study from the formative interviews. In each of the following sections, we introduce the problem, describe the participant’s existing evaluation approach, and detail their findings from using zeno.
6.1. Case 1: UI Classification
For the first case study, we worked with a researcher developing a model to classify smartphone screenshots using a CNN-based deep learning model, which they were evaluating on 10,000 images. The model aims to make UIs more accessible to people with visual impairments by informing them of the type of interface they are looking at. The participant was looking to expand their system to screenshots from other devices, e.g., tablets, and wanted to understand their model’s current performance and generalizability. Uniquely for this case study, the participant ran zeno on a cloud server that hosted their data and models and they accessed the zeno UI remotely on their laptop.
6.1.1. Existing evaluation approach.
The first participant primarily uses computational notebooks for both qualitative and quantitative evaluation of their models. For qualitative analyses, they select “some test cases that I hypothesized are hard and easy for the model”, instances for which they check the model’s output to understand how it is behaving. For example, for this model they check a specific screenshot of a login screen with a list structure that they expect the model to misclassify as a list view. For every new domain in which they train a model, the participant spends significant time creating dedicated Python notebooks to display data instances and model outputs for this type of qualitative analysis.
The participant also uses quantitative metrics for evaluation, especially for more complex domains such as object detection where they use a combination of metrics such as mean Average Precision (mAP) at different scales. As with the qualitative analyses, the participant authors specific Python notebooks to calculate these metrics. They also make an effort to write evaluation code that is distinct from the training code to ensure that they avoid any bugs such as data leakage in the training process.
6.1.2. Findings with zeno.
The participant found zeno’s interactive instance view and metadata distributions extremely useful for discovering new failures, systematically validating qualitative analyses, and sharing results with others. Just from the initial Exploration UI, the participant found the ability to quickly browse dozens of instances much more valuable than the static notebooks they used previously. Within a few seconds, they found new model failures they noted to validate later and add as new qualitative test examples. The participant wished to filter the instance view to only see failures or have the system suggest slices to make it easier to quickly find model errors.
With the metadata distributions in the Exploration UI the participant was also able to validate some of their existing qualitative hypotheses more systematically. For example, they confirmed their hypothesis that the model would perform worse for underrepresented classes in the dataset by filtering for the most underrepresented classes using the class histogram (see Figure 7). They found the ability to save such slices of data to share with others to be a powerful feature and wished to “take a very well known dataset such as ImageNet, find slices that are questionable and share them” to help others test their own model for such issues.
Lastly, the participant found that the code for the zeno API was similar to what they used in notebooks and that they “could totally get used to the zeno API”. While they were able to copy and paste their existing code into zeno, they wished for a more streamlined setup process, for example, with automatically generated zeno configuration files for common data types and ML libraries.
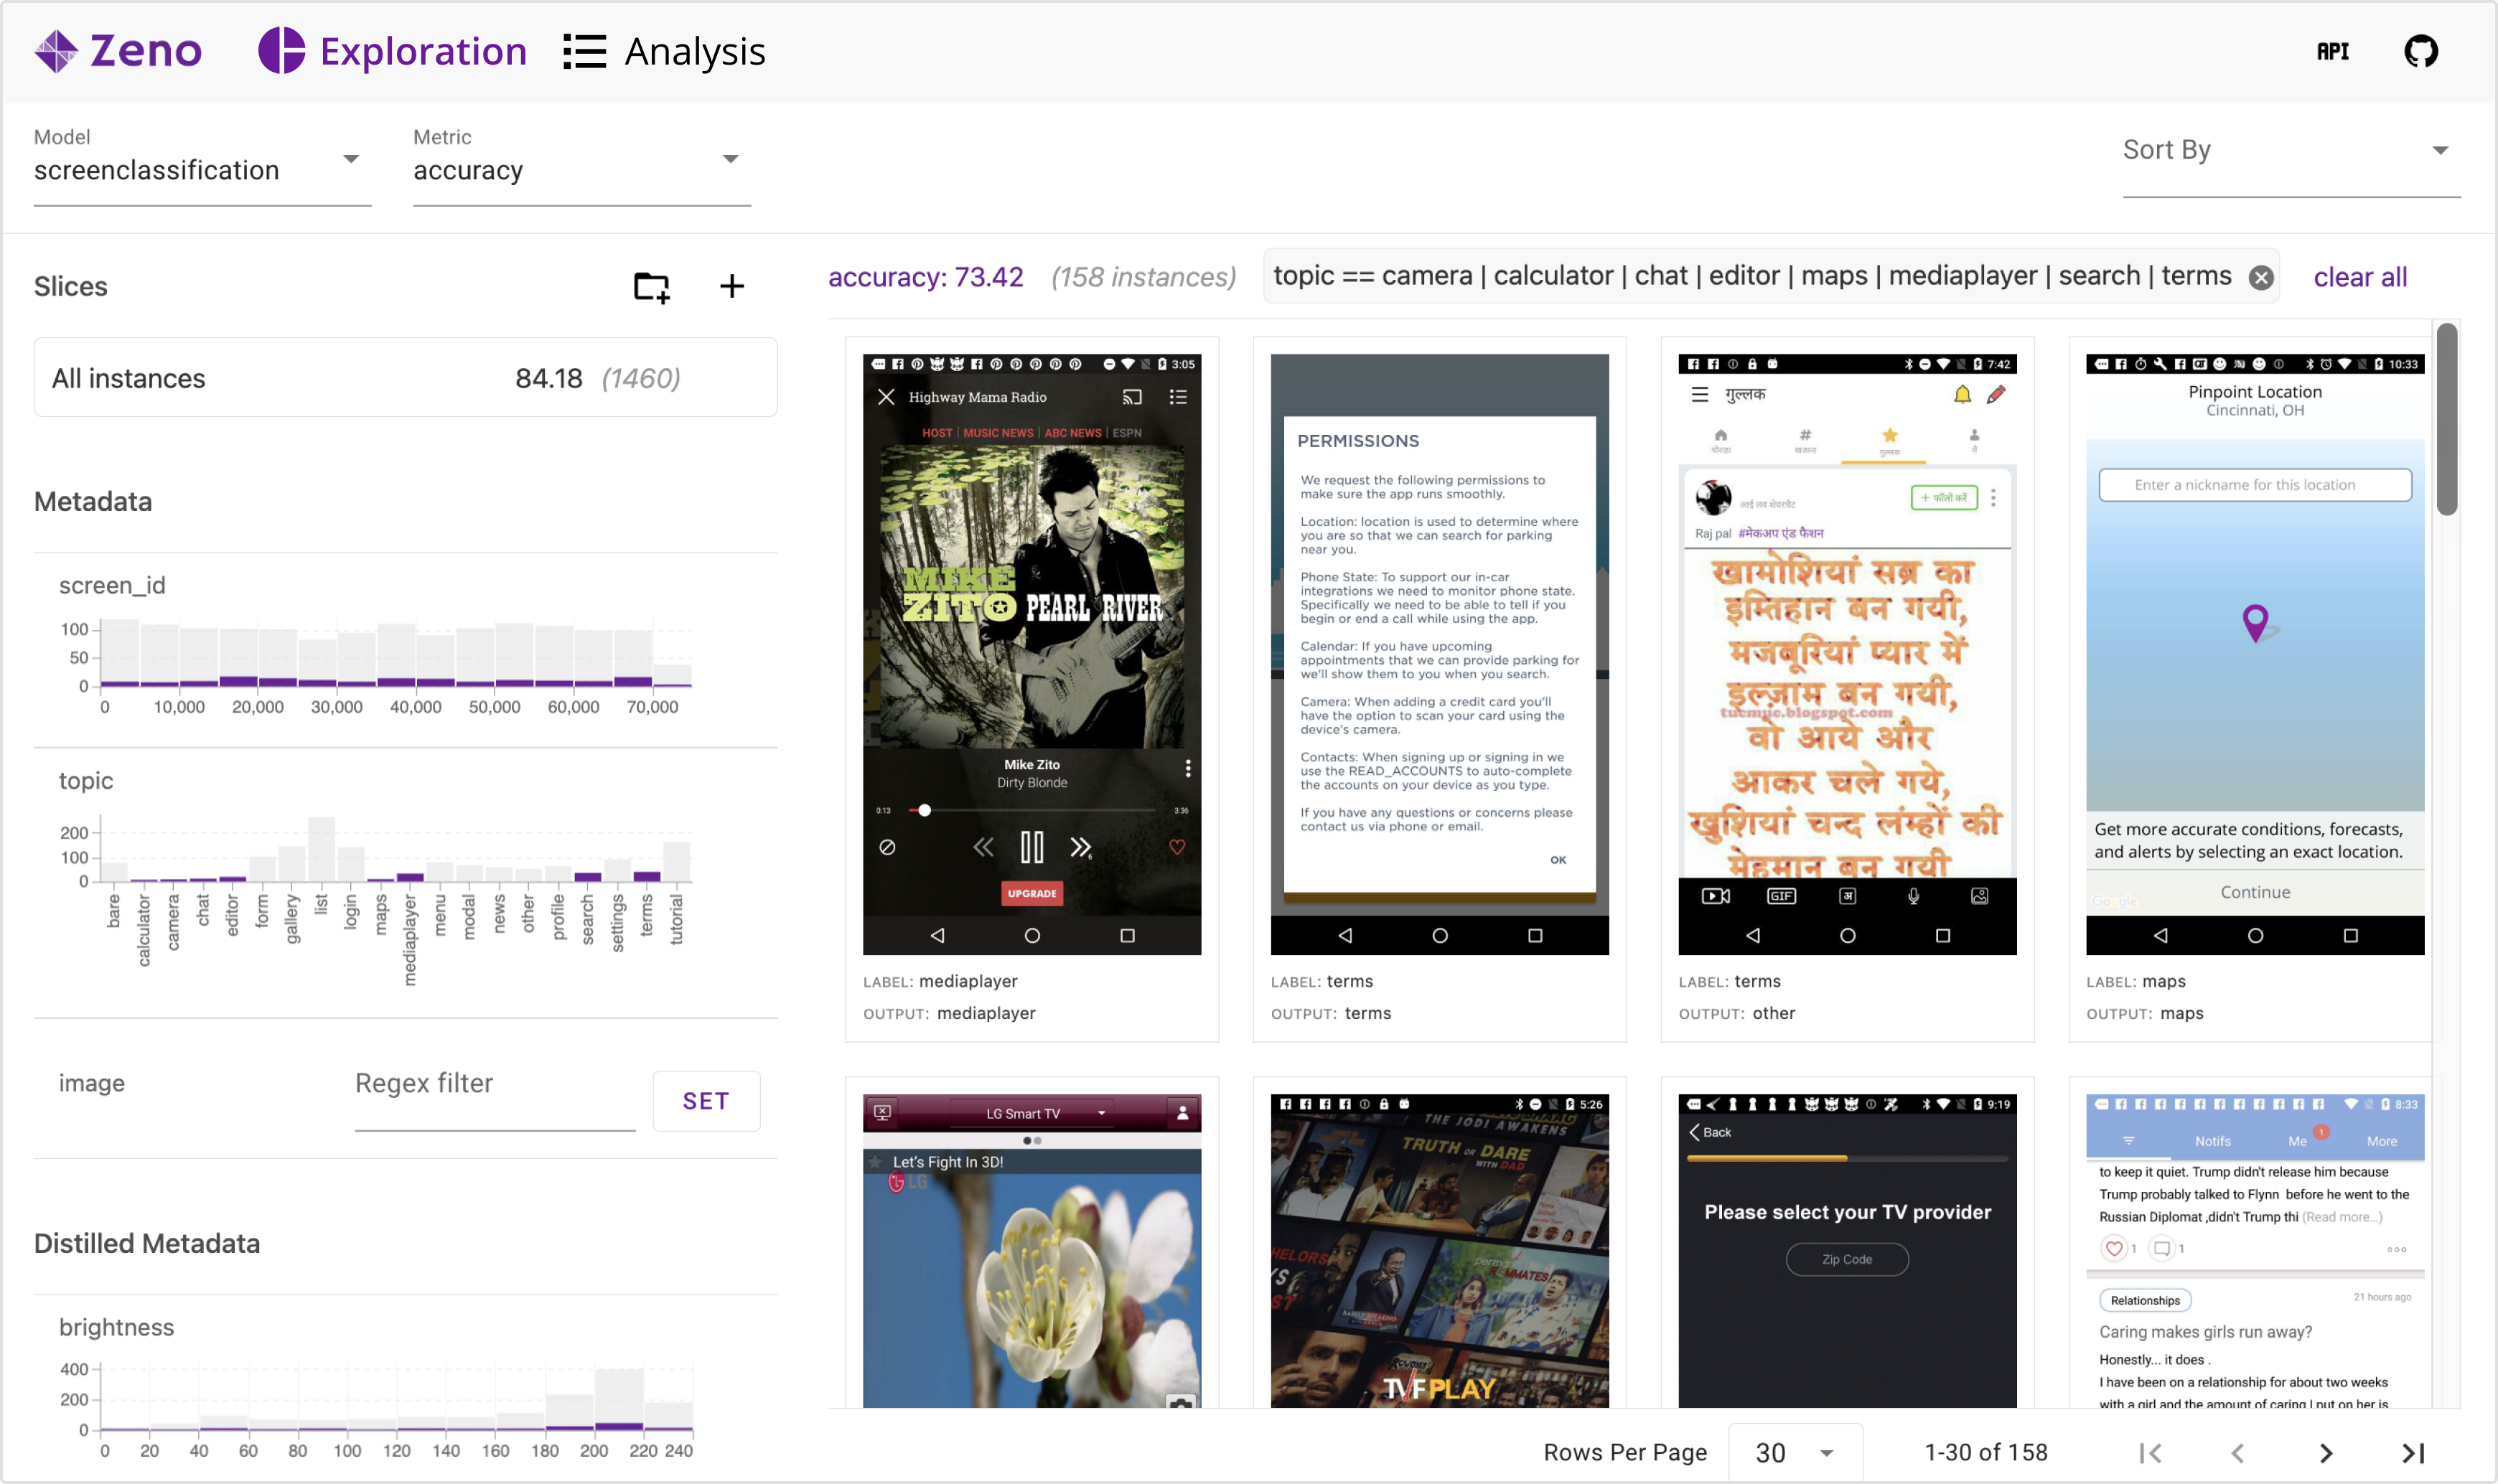
An image of the Zeno Exploration UI showing the case study for UI classification. The image shows metadata on the sidebar and data consisting of UI screenshots in the main view.
6.2. Case 2: Breast Cancer Detection
In the second case study, we worked with a researcher who was auditing a breast cancer classification model on a dataset of 6,635 images. The model, also a CNN-based deep learning model, divides mammogram images into small patches and detects whether there is a lesion present in each patch. The model was trained on a dataset provided by a collaboration with clinical researchers at an academic hospital system in the United States. Although the model had a reasonably high accuracy of 80%, the developers had difficulty understanding the failure modes of the model, especially since the dataset was de-identified and had minimal metadata. The participant in our case study wanted to discover meaningful dimensions across which the model failed in order to guide model updates.
6.2.1. Existing evaluation approach
Unlike the first case study participant, the participant in the second study had only used quantitative aggregate metrics when evaluating models. They “had not used any platform or framework to understand how a model performed on specific features of the metadata”, and fully relied on aggregate metrics as a measure for model quality. This involved creating Python scripts to load a model and data and calculate metrics such as AUC and F1 score. Attempting to improve the breast cancer classification model led to their first foray into behavioral evaluation.
6.2.2. Findings with zeno
The participant found that the combination of the extensible @distill functions and metadata distributions was essential for finding slices with significant areas of error. Since the participant was not a domain expert, they consulted with medical imaging researchers that recommended a Python library, pyradiomics (van Griethuysen et al., 2017), to extract physiologically relevant characteristics from medical images. The participant implemented dozens of @distill functions using pyradiomics functions that encoded important regional information, such as grey-level values, that was not captured by their original features. They also wrote a couple more @distill functions to encode the position of each image patch, a hypothesis they had from looking at model failures in the instance view. The participant only had to add a couple of lines of Python to use all of these functions in zeno.
Since the dataset had minimal existing metadata, interactively filtering the @distilled distributions was the primary way the participant found patterns of failure. By interactively cross-filtering the @distilled metadata histograms, they found that the model performed significantly worse for images with higher tissue density, a phenomenon that also occurs with human radiologists (Kolb et al., 2002). They also found that the model was trained on many background patches of image that did not include part of the breast, which also impacted the aggregate metrics. The participant noted that they may want to clean the data and upsample instances relevant to the classification task. Due to the quantity and complexity of these analyses, the participant wished for more expressive slice comparisons, such as comparing multiple slices at a time in the Exploration UI. Otherwise, using zeno the participant found significant failures which they had not been able to find using Python scripts.
6.3. Case 3: Voice Commands
The third case study was with a participant who was developing a decision-tree model to detect the direction in which a person is speaking using an array of microphones, which they were evaluating on 11,520 recordings. The goal of the model is to predict to which microphone, often a smart speaker, a person is talking in order to respond from the right speaker. The participant had collected data from diverse setups to understand the performance of their model in the different scenarios.
6.3.1. Existing evaluation approach
Most of the models the participant works on are sensor-based systems highly impacted by the physical nature of the data signals, for example, echoes and noise in sound data. Thus, in addition to calculating classic aggregate metrics, the participant generates and tests inputs with diverse physical properties. For example, in the model described above, the participant collected audio from speakers next to a wall and in the middle of the room to since they thought the rebounding sound from the wall might confuse the model.
To evaluate such scenarios, the participant collects data in dozens of configurations, and so often has extensive metadata for behavioral analysis. Like the other participants, they use computational notebooks to manually split the data across different metadata features and print out multiple metrics. Due to their high quantity of metadata, the participant only looks at simple slices of data, and does not often explore intersectional slices of multiple features.
6.3.2. Findings with zeno
Using zeno, the participant was both able to validate all of their hypotheses significantly faster and discovered potential causes for systematic model failures. For example, they confirmed a finding from previous analyses where a “model worked very well at 1, 2, and 3 meters, but there was a sharp dropoff at 5 meters” by simply looking at the metadata distributions. They also used the spectrogram visualization of instances in each slice to look for potential reasons for the steep dropoff in performance, for example, signals with lower amplitude. Additionally, they found the cross-filtering between metadata histograms to be useful to find potential interactions between physical features, such as audio both at a distance and a speaker against a wall. Cross-filtering combined with expressive instance visualizations of the audio data was essential for both confirming their hypothesis and ideating potential causes for model failures.
Much of the participant’s work is focused on collecting new data, so they suggested data-related improvements for zeno. Since the participant often tests their model with their own inputs, they wished for a direct way to add new instances to zeno. They also mentioned having more interactive transformations, for example, having a slider to gradually apply a transformation such as reducing the amplitude of an audio file.
6.4. Case 4: Text-to-Image Generation
For our last case study, we worked with a non-technical researcher who explores biases in deployed ML systems, in this case, the text-to-image generation model Stable Diffusion (Rombach et al., 2022). To audit this model they used zeno with the DiffusionDB Dataset (Wang et al., 2022), which consists of 2 million prompt-image pairs generated using the Stable Diffusion model. The participant wanted to explore potential systematic biases in the images generated by Stable Diffusion.
6.4.1. Existing evaluation approach
The participant’s work is primarily focused on auditing public-facing algorithmic systems such as search engine results and social media ads. They exclusively conduct manual, ad-hoc audits, testing a range of specific inputs such as search queries and individually checking the model’s outputs. The inputs they test are often guided by existing knowledge of model biases, for example, the participant has “used some lingustic discrimination knowledge […] such as knowing that certain words tend to be gendered” to test inputs with likely biased results.
The participant also works with end users of algorithmic systems to understand how they audit models and what biases they are able to find. They found that “people often found issues in searches that none of the researchers, including me, had even thought of”. Having diverse users test models is essential for finding issues, and the participant works with end-users to surface new limitations.
6.4.2. Findings with zeno
When auditing the DiffusionDB dataset with zeno, the participant took a similar approach to their previous audits but was able to come up with more systematic and validated conclusions of model biases. Their primary interaction with zeno was using the string search metadata cell to look for certain prompt inputs. Similar to how they approached debugging search engines, they used prior knowledge of likely biased prompts but were able to see dozens of examples instead of one prompt at a time. For example, when searching for prompts with the “scientist” in them, every generated image was male, encoding a typical gender bias. By seeing dozens of prompts the participant was able to gather more evidence that the model produced this pattern systematically and was not due to a one-off prompt.
The DiffusionDB dataset also includes a measure of toxicity, or “NSFW” level, for both the input prompts and generated images. These numbers were represented as histogram distributions in zeno, and the participant found it invaluable to filter by and find potential biases. One interesting experiment the participant tried was to see if the average distribution of the NSFW tag would go up for certain terms. For example, they saw small increases in the distribution when searching for certain gendered terms, including the word “girl”, which reflected that the images generated of women were more sexualized than those of men. They could only see this dataset-level pattern using the combination of zeno’s metadata distribution and instance view.
Lastly, the participant reflected on how usable zeno would be for everyday users of algorithmic systems. They mentioned that technical terms such as “metadata” may be too niche for everyday users and could be renamed. Otherwise, they found the system intuitive and usable if set up for use by diverse end users.
7. Discussion
Our case studies showed that zeno’s complementary API and UI empowered practitioners to find significant model issues across datasets and tasks. More generally, we found that a framework for behavioral evaluation can be effective across diverse data and model types (D1). This generalizability can be seen by comparing two of the case studies, the malignant tumor detection (Section 6.2) and audio classification (Section 6.3) cases. The two cases differed significantly in their data type (image vs. audio), task (binary vs. multi-class classification), model (CNN vs. decision tree), and end goal (model development vs. auditing). Despite these differences, both participants could effectively discover and encode model behaviors they wished to test and found limitations ranging from robustness to domain shift (D2).
zeno’s different affordances made the behavioral evaluation process easier, quicker, and more effective, depending on the user’s goals and the challenges of each particular task. For example, in Case 2, the participant found the extensible API essential for creating metadata to analyze their model across (D2), while in case 3, the participant found the interactive visualizations more useful given the extensive metadata already present in their dataset. zeno also supports users’ particular strengths and skillsets - without using the API, our non-technical case study participant (Case 4) was still able to find significant model biases by using their domain knowledge to interact with the UI (D4).
Participants in the case studies found that zeno was easily integrated into their workflows, requiring minimal effort to adapt their code to work with the zeno API (D1). For example, the participant in case study 1 only modified a few lines of their inference code to work with zeno, and the participant in the second case study was able to use a radiomics library in zeno with minimal setup. The participants also suggested ways in which zeno could be made even easier to use, such as automatically generating zeno API functions and configuration files for common ML libraries.
While we validated that most of the design goals were met by zeno, our case studies did not thoroughly explore how zeno could be used over longer periods (D3). All four participants worked with early-stage models and only used zeno for a limited time. Longer-term, in-situ studies would provide more nuanced feedback for the utility of zeno’s model comparison features. A benefit of zeno’s ease of use, both with the API and UI, is that users can immediately start using zeno’s model tracking and comparison features as models move from research to deployment.
8. Limitations and Future Work
zeno provides a general and extensible framework for the behavioral evaluation of ML, but leaves significant room to better address the challenges in the evaluation process.
Slice discovery. A central challenge for behavioral evaluation is knowing which behaviors are important to end users and encoded by a model. To directly encourage the reuse of model functions to scaffold discovery, we are currently designing ZenoHub, a collaborative repository where people can share their zeno functions and find relevant analysis components more easily. Including slice discovery methods directly in zeno could also help users find important behaviors. zeno provides the common medium of representing metadata and slices that practitioners can use to interact with and use the results of these discovery methods.
Improved visualizations. Defining and testing metrics on data slices is the core of zeno, but it only provides a few simple visualizations of data and slices in a grid and table view. There are many more powerful visualization types that could improve the usability of zeno. Instance views that encode semantic similarity, such as DendroMap (Bertucci et al., 2022), Facets (Pushkarna et al., 2017), or AnchorViz (Chen et al., 2018), could improve users’ ability to find patterns and new behaviors in their data. zeno can also adapt existing visualizations of ML performance, such as ML Cube (Kahng et al., 2016), Neo (Görtler et al., 2022), or ConfusionFlow (Hinterreiter et al., 2020), to better visualize model behaviors. For example, grid views showing the intersections of slices could highlight important subsets of data.
Scaling. zeno has a few optimizations for scaling to large datasets, including parallel computation and caching, but machine learning datasets are continuously growing and additional optimizations could speed up processing considerably. A potential update would be to support processing in distributed computing clusters using a library such as Ray (Moritz et al., 2018). Another bottleneck is the cross-filtering of dozens of histograms on tables with millions of rows. zeno could implement an optimization strategy like Falcon (Moritz et al., 2019) to support live cross-filtering on large datasets.
Model improvement. zeno is focused exclusively on evaluation and does not include methods to update models and fix discovered failures. Future work can explore how to directly use the insights from zeno to improve model performance. For example, there are promising results in using data slices to improve model performance, such as slice-based learning (Chen et al., 2019b) and group distributionally robust optimization (GDRO) (Sagawa et al., 2020; Liu et al., 2021).
Further evaluation. The case studies evaluated zeno on real-world ML systems, but further evaluations could better elucidate the affordances and limitations of zeno. Future evaluations could explore how usable zeno is for additional non-technical users and how well it works for continually updated deployed systems.
9. Conclusion
Behavioral evaluation of machine learning is essential to detect and fix model behaviors such as biases and safety issues. In this work, we explored the challenges of ML evaluation and designed a general-purpose tool for evaluating models across behaviors.
To identify specific challenges for ML evaluation, we conducted formative interviews with 18 ML practitioners. From the interview results we derived four main design goals for an evaluation system, including supporting comparison over time and no-code analysis. We used these goals to design and implement zeno, a general-purpose framework for defining and tracking diverse model behaviors across different ML tasks, models, and data types. zeno combines a Python decorator API for defining core building blocks with an interactive UI for creating slices and reports.
We showed how zeno can be applied to diverse domains through four case studies with practitioners evaluating real-world models. Participants in the case studies confirmed existing findings, hypothesized new failures, and validated and discovered behaviors using zeno. As a general framework for behavioral evaluation, zeno can incorporate future features, such as error discovery methods and visualizations, to support the growing complexity of models and encourage the deployment of responsible ML systems.
Acknowledgements.
We would like to thank Fred Hohman, Alex Baüerle, Will Epperson, and Dominik Moritz for their feedback. This material is based upon work supported by a Mozilla Technology Fund grant, a Cisco Research Grant, an Amazon Research Award, a National Science Foundation grant under No. IIS-2040942, and the National Science Foundation Graduate Research Fellowship Program under grant No. DGE-1745016. Any opinions, findings, and conclusions or recommendations expressed in this material are those of the authors and do not necessarily reflect the views of the grantors.References
- (1)
- Arnold et al. (2019) M. Arnold, D. Piorkowski, D. Reimer, J. Richards, J. Tsay, K. R. Varshney, R. K. E. Bellamy, M. Hind, S. Houde, S. Mehta, A. Mojsilovic, R. Nair, K. Natesan Ramamurthy, and A. Olteanu. 2019. FactSheets: Increasing trust in AI services through supplier’s declarations of conformity. IBM Journal of Research and Development 63, 4/5 (July 2019), 6:1–6:13. https://doi.org/10.1147/JRD.2019.2942288
- Attenberg et al. (2011) Josh Attenberg, Panagiotis G. Ipeirotis, and Foster Provost. 2011. Beat the Machine: Challenging Workers to Find the Unknown Unknowns.
- Barocas and Selbst (2018) Solon Barocas and Andrew D Selbst. 2018. Big Data’s Disparate Impact. SSRN Electronic Journal 671 (2018), 671–732. https://doi.org/10.2139/ssrn.2477899
- Bertucci et al. (2022) Donald Bertucci, Md Montaser Hamid, Yashwanthi Anand, Anita Ruangrotsakun, Delyar Tabatabai, Melissa Perez, and Minsuk Kahng. 2022. DendroMap: Visual Exploration of Large-Scale Image Datasets for Machine Learning with Treemaps. IEEE Transactions on Visualization and Computer Graphics (TVCG) (2022). https://div-lab.github.io/dendromap/ Publisher: IEEE.
- Bommasani et al. (2022) Rishi Bommasani, Drew A. Hudson, Ehsan Adeli, Russ Altman, Simran Arora, Sydney von Arx, Michael S. Bernstein, Jeannette Bohg, Antoine Bosselut, Emma Brunskill, Erik Brynjolfsson, Shyamal Buch, Dallas Card, Rodrigo Castellon, Niladri Chatterji, Annie Chen, Kathleen Creel, Jared Quincy Davis, Dora Demszky, Chris Donahue, Moussa Doumbouya, Esin Durmus, Stefano Ermon, John Etchemendy, Kawin Ethayarajh, Li Fei-Fei, Chelsea Finn, Trevor Gale, Lauren Gillespie, Karan Goel, Noah Goodman, Shelby Grossman, Neel Guha, Tatsunori Hashimoto, Peter Henderson, John Hewitt, Daniel E. Ho, Jenny Hong, Kyle Hsu, Jing Huang, Thomas Icard, Saahil Jain, Dan Jurafsky, Pratyusha Kalluri, Siddharth Karamcheti, Geoff Keeling, Fereshte Khani, Omar Khattab, Pang Wei Koh, Mark Krass, Ranjay Krishna, Rohith Kuditipudi, Ananya Kumar, Faisal Ladhak, Mina Lee, Tony Lee, Jure Leskovec, Isabelle Levent, Xiang Lisa Li, Xuechen Li, Tengyu Ma, Ali Malik, Christopher D. Manning, Suvir Mirchandani, Eric Mitchell, Zanele Munyikwa, Suraj Nair, Avanika Narayan, Deepak Narayanan, Ben Newman, Allen Nie, Juan Carlos Niebles, Hamed Nilforoshan, Julian Nyarko, Giray Ogut, Laurel Orr, Isabel Papadimitriou, Joon Sung Park, Chris Piech, Eva Portelance, Christopher Potts, Aditi Raghunathan, Rob Reich, Hongyu Ren, Frieda Rong, Yusuf Roohani, Camilo Ruiz, Jack Ryan, Christopher Ré, Dorsa Sadigh, Shiori Sagawa, Keshav Santhanam, Andy Shih, Krishnan Srinivasan, Alex Tamkin, Rohan Taori, Armin W. Thomas, Florian Tramèr, Rose E. Wang, William Wang, Bohan Wu, Jiajun Wu, Yuhuai Wu, Sang Michael Xie, Michihiro Yasunaga, Jiaxuan You, Matei Zaharia, Michael Zhang, Tianyi Zhang, Xikun Zhang, Yuhui Zhang, Lucia Zheng, Kaitlyn Zhou, and Percy Liang. 2022. On the Opportunities and Risks of Foundation Models. http://arxiv.org/abs/2108.07258 arXiv:2108.07258 [cs].
- Buolamwini and Gebru (2018) Joy Buolamwini and Timnit Gebru. 2018. Gender Shades: Intersectional Accuracy Disparities in Commercial Gender Classification. In Proceedings of the 1st Conference on Fairness, Accountability and Transparency (Proceedings of Machine Learning Research, Vol. 81), Sorelle A. Friedler and Christo Wilson (Eds.). PMLR, 77–91. Buolamwini2018.
- Bäuerle et al. (2022) Alex Bäuerle, Ángel Alexander Cabrera, Fred Hohman, Megan Maher, David Koski, Xavier Suau, Titus Barik, and Dominik Moritz. 2022. Symphony: Composing Interactive Interfaces for Machine Learning. In CHI Conference on Human Factors in Computing Systems. ACM, New Orleans LA USA, 1–14. https://doi.org/10.1145/3491102.3502102
- Cabrera et al. (2021) Ángel Alexander Cabrera, Abraham J. Druck, Jason I. Hong, and Adam Perer. 2021. Discovering and Validating AI Errors With Crowdsourced Failure Reports. Proceedings of the ACM on Human-Computer Interaction 5, CSCW2 (Oct. 2021), 1–22. https://doi.org/10.1145/3479569
- Cabrera et al. (2019) Ángel Alexander Cabrera, Will Epperson, Fred Hohman, Minsuk Kahng, Jamie Morgenstern, and Duen Horng Chau. 2019. FairVis: Visual Analytics for Discovering Intersectional Bias in Machine Learning. In 2019 IEEE Conference on Visual Analytics Science and Technology (VAST). 46–56. https://doi.org/10.1109/VAST47406.2019.8986948
- Cabrera et al. (2022) Ángel Alexander Cabrera, Marco Tulio Ribeiro, Bongshin Lee, Rob DeLine, Adam Perer, and Steven M. Drucker. 2022. What Did My AI Learn? How Data Scientists Make Sense of Model Behavior. ACM Transactions on Computer-Human Interaction (June 2022), 3542921. https://doi.org/10.1145/3542921
- Chen et al. (2021) Lingjiao Chen, Tracy Cai, Matei Zaharia, and James Zou. 2021. Did the Model Change? Efficiently Assessing Machine Learning API Shifts. arXiv:2107.14203 [cs, stat] (July 2021). http://arxiv.org/abs/2107.14203 arXiv: 2107.14203.
- Chen et al. (2018) Nan-Chen Chen, Jina Suh, Johan Verwey, Gonzalo Ramos, Steven Drucker, and Patrice Simard. 2018. AnchorViz: Facilitating Classifier Error Discovery through Interactive Semantic Data Exploration. In 23rd International Conference on Intelligent User Interfaces. ACM, Tokyo Japan, 269–280. https://doi.org/10.1145/3172944.3172950
- Chen et al. (2019a) Tsong Yueh Chen, Fei-Ching Kuo, Huai Liu, Pak-Lok Poon, Dave Towey, T. H. Tse, and Zhi Quan Zhou. 2019a. Metamorphic Testing: A Review of Challenges and Opportunities. Comput. Surveys 51, 1 (Jan. 2019), 1–27. https://doi.org/10.1145/3143561
- Chen et al. (2019b) Vincent S. Chen, Sen Wu, Zhenzhen Weng, Alexander Ratner, and Christopher Ré. 2019b. Slice-based Learning: A Programming Model for Residual Learning in Critical Data Slices. NeurIPS (2019). http://arxiv.org/abs/1909.06349
- Chung et al. (2019) Yeounoh Chung, Tim Kraska, Neoklis Polyzotis, Ki Hyun Tae, and Steven Euijong Whang. 2019. Slice Finder: Automated Data Slicing for Model Validation. In 2019 IEEE 35th International Conference on Data Engineering (ICDE). IEEE, Macao, Macao, 1550–1553. https://doi.org/10.1109/ICDE.2019.00139
- Crisan et al. (2022) Anamaria Crisan, Margaret Drouhard, Jesse Vig, and Nazneen Rajani. 2022. Interactive Model Cards: A Human-Centered Approach to Model Documentation. In 2022 ACM Conference on Fairness, Accountability, and Transparency. ACM, Seoul Republic of Korea, 427–439. https://doi.org/10.1145/3531146.3533108
- Deng et al. (2022) Wesley Hanwen Deng, Manish Nagireddy, Michelle Seng Ah Lee, Jatinder Singh, Zhiwei Steven Wu, Kenneth Holstein, and Haiyi Zhu. 2022. Exploring How Machine Learning Practitioners (Try To) Use Fairness Toolkits. In 2022 ACM Conference on Fairness, Accountability, and Transparency. ACM, Seoul Republic of Korea, 473–484. https://doi.org/10.1145/3531146.3533113
- d’Eon et al. (2021) Greg d’Eon, Jason d’Eon, James R. Wright, and Kevin Leyton-Brown. 2021. The Spotlight: A General Method for Discovering Systematic Errors in Deep Learning Models. arXiv:2107.00758 [cs, stat] (Oct. 2021). http://arxiv.org/abs/2107.00758 arXiv: 2107.00758.
- Eyuboglu et al. (2022) Sabri Eyuboglu, Maya Varma, Khaled Saab, Jean-Benoit Delbrouck, Christopher Lee-Messer, Jared Dunnmon, James Zou, and Christopher Ré. 2022. Domino: Discovering Systematic Errors with Cross-Modal Embeddings. arXiv:2203.14960 [cs] (April 2022). http://arxiv.org/abs/2203.14960 arXiv: 2203.14960.
- Françoise et al. (2021) Jules Françoise, Baptiste Caramiaux, and Téo Sanchez. 2021. Marcelle: Composing Interactive Machine Learning Workflows and Interfaces. In The 34th Annual ACM Symposium on User Interface Software and Technology. ACM, Virtual Event USA, 39–53. https://doi.org/10.1145/3472749.3474734
- Gebru et al. (2021) Timnit Gebru, Jamie Morgenstern, Briana Vecchione, Jennifer Wortman Vaughan, Hanna Wallach, Hal Daumé Iii, and Kate Crawford. 2021. Datasheets for datasets. Commun. ACM 64, 12 (Dec. 2021), 86–92. https://doi.org/10.1145/3458723
- Goel et al. (2021) Karan Goel, Nazneen Rajani, Jesse Vig, Samson Tan, Jason Wu, Stephan Zheng, Caiming Xiong, Mohit Bansal, and Christopher Ré. 2021. Robustness Gym: Unifying the NLP Evaluation Landscape. (2021), 1–34. http://arxiv.org/abs/2101.04840
- Görtler et al. (2022) Jochen Görtler, Fred Hohman, Dominik Moritz, Kanit Wongsuphasawat, Donghao Ren, Rahul Nair, Marc Kirchner, and Kayur Patel. 2022. Neo: Generalizing Confusion Matrix Visualization to Hierarchical and Multi-Output Labels. In CHI Conference on Human Factors in Computing Systems. ACM, New Orleans LA USA, 1–13. https://doi.org/10.1145/3491102.3501823
- Heer (2020) Jeffrey Heer. 2020. Arquero: Query processing and transformation of array-backed data tables. https://uwdata.github.io/arquero/
- Hinterreiter et al. (2020) Andreas Hinterreiter, Peter Ruch, Holger Stitz, Martin Ennemoser, Jurgen Bernard, Hendrik Strobelt, and Marc Streit. 2020. ConfusionFlow: A model-agnostic visualization for temporal analysis of classifier confusion. IEEE Transactions on Visualization and Computer Graphics (2020), 1–1. https://doi.org/10.1109/TVCG.2020.3012063
- Hopkins and Booth (2021) Aspen Hopkins and Serena Booth. 2021. Machine Learning Practices Outside Big Tech: How Resource Constraints Challenge Responsible Development. In AIES 2021 - Proceedings of the 2021 AAAI/ACM Conference on AI, Ethics, and Society. Association for Computing Machinery, Inc, 134–145. https://doi.org/10.1145/3461702.3462527
- Jackson et al. (2018) Zohar Jackson, César Souza, Jason Flaks, Yuxin Pan, Hereman Nicolas, and Adhish Thite. 2018. Jakobovski/Free-Spoken-Digit-Dataset: V1.0.8. https://doi.org/10.5281/ZENODO.1342401
- Jha et al. (2020) Debesh Jha, Pia H. Smedsrud, Michael A. Riegler, Pål Halvorsen, Thomas de Lange, Dag Johansen, and Håvard D. Johansen. 2020. Kvasir-SEG: A Segmented Polyp Dataset. In MultiMedia Modeling, Yong Man Ro, Wen-Huang Cheng, Junmo Kim, Wei-Ta Chu, Peng Cui, Jung-Woo Choi, Min-Chun Hu, and Wesley De Neve (Eds.). Vol. 11962. Springer International Publishing, Cham, 451–462. https://doi.org/10.1007/978-3-030-37734-2_37 Series Title: Lecture Notes in Computer Science.
- Kahng et al. (2016) Minsuk Kahng, Dezhi Fang, and Duen Horng (Polo) Chau. 2016. Visual Exploration of Machine Learning Results Using Data Cube Analysis. In Proceedings of the Workshop on Human-In-the-Loop Data Analytics - HILDA ’16. ACM Press, San Francisco, California, 1–6. https://doi.org/10.1145/2939502.2939503
- Kolb et al. (2002) Thomas M. Kolb, Jacob Lichy, and Jeffrey H. Newhouse. 2002. Comparison of the Performance of Screening Mammography, Physical Examination, and Breast US and Evaluation of Factors that Influence Them: An Analysis of 27,825 Patient Evaluations. Radiology 225, 1 (Oct. 2002), 165–175. https://doi.org/10.1148/radiol.2251011667
- Krizhevsky et al. (2009) Alex Krizhevsky, Geoffrey Hinton, and others. 2009. Learning multiple layers of features from tiny images. (2009). Publisher: Citeseer.
- Lin et al. (2014) Tsung-Yi Lin, Michael Maire, Serge Belongie, James Hays, Pietro Perona, Deva Ramanan, Piotr Dollár, and C. Lawrence Zitnick. 2014. Microsoft COCO: Common Objects in Context. In Computer Vision – ECCV 2014, David Fleet, Tomas Pajdla, Bernt Schiele, and Tinne Tuytelaars (Eds.). Vol. 8693. Springer International Publishing, Cham, 740–755. https://doi.org/10.1007/978-3-319-10602-1_48 Series Title: Lecture Notes in Computer Science.
- Liu et al. (2021) Evan Zheran Liu, Behzad Haghgoo, Annie S. Chen, Aditi Raghunathan, Pang Wei Koh, Shiori Sagawa, Percy Liang, and Chelsea Finn. 2021. Just Train Twice: Improving Group Robustness without Training Group Information. arXiv:2107.09044 [cs, stat] (Sept. 2021). http://arxiv.org/abs/2107.09044 arXiv: 2107.09044.
- Malekzadeh et al. (2019) Mohammad Malekzadeh, Richard G. Clegg, Andrea Cavallaro, and Hamed Haddadi. 2019. Mobile Sensor Data Anonymization. In Proceedings of the International Conference on Internet of Things Design and Implementation (IoTDI ’19). ACM, New York, NY, USA, 49–58. https://doi.org/10.1145/3302505.3310068 event-place: Montreal, Quebec, Canada.
- McKinney (2010) Wes McKinney. 2010. Data Structures for Statistical Computing in Python. Austin, Texas, 56–61. https://doi.org/10.25080/Majora-92bf1922-00a
- Mitchell et al. (2019) Margaret Mitchell, Simone Wu, Andrew Zaldivar, Parker Barnes, Lucy Vasserman, Ben Hutchinson, Elena Spitzer, Inioluwa Deborah Raji, and Timnit Gebru. 2019. Model Cards for Model Reporting. In Proceedings of the Conference on Fairness, Accountability, and Transparency. ACM, Atlanta GA USA, 220–229. https://doi.org/10.1145/3287560.3287596
- Moreno-Torres et al. (2012) Jose G. Moreno-Torres, Troy Raeder, Rocío Alaiz-Rodríguez, Nitesh V. Chawla, and Francisco Herrera. 2012. A unifying view on dataset shift in classification. Pattern Recognition 45, 1 (2012), 521–530. https://doi.org/10.1016/j.patcog.2011.06.019
- Moritz et al. (2019) Dominik Moritz, Bill Howe, and Jeffrey Heer. 2019. Falcon: Balancing Interactive Latency and Resolution Sensitivity for Scalable Linked Visualizations. In Proceedings of the 2019 CHI Conference on Human Factors in Computing Systems. ACM, Glasgow Scotland Uk, 1–11. https://doi.org/10.1145/3290605.3300924
- Moritz et al. (2018) Philipp Moritz, Robert Nishihara, Stephanie Wang, Alexey Tumanov, Richard Liaw, Eric Liang, Melih Elibol, Zongheng Yang, William Paul, Michael I. Jordan, and Ion Stoica. 2018. Ray: A Distributed Framework for Emerging AI Applications. http://arxiv.org/abs/1712.05889 arXiv:1712.05889 [cs, stat].
- Nahar et al. (2021) Nadia Nahar, Shurui Zhou, Grace Lewis, and Christian Kästner. 2021. Collaboration Challenges in Building ML-Enabled Systems: Communication, Documentation, Engineering, and Process. arXiv:2110.10234 [cs] (Dec. 2021). http://arxiv.org/abs/2110.10234 arXiv: 2110.10234.
- National Transportation Safety Board (2019) National Transportation Safety Board. 2019. Collision Between Vehicle Controlled by Developmental Automated Driving System and Pedestrian. https://www.ntsb.gov/news/events/Pages/2019-HWY18MH010-BMG.aspx
- Ni et al. (2019) Jianmo Ni, Jiacheng Li, and Julian McAuley. 2019. Justifying Recommendations using Distantly-Labeled Reviews and Fine-Grained Aspects. In Proceedings of the 2019 Conference on Empirical Methods in Natural Language Processing and the 9th International Joint Conference on Natural Language Processing (EMNLP-IJCNLP). Association for Computational Linguistics, Hong Kong, China, 188–197. https://doi.org/10.18653/v1/D19-1018
- Nushi et al. (2018) Besmira Nushi, Ece Kamar, and Eric Horvitz. 2018. Towards Accountable AI: Hybrid Human-Machine Analyses for Characterizing System Failure. In Proceedings of the AAAI Conference on Human Computation and Crowdsourcing, Vol. 6. 10.
- Oakden-Rayner et al. (2020) Luke Oakden-Rayner, Jared Dunnmon, Gustavo Carneiro, and Christopher Re. 2020. Hidden stratification causes clinically meaningful failures in machine learning for medical imaging. In Proceedings of the ACM Conference on Health, Inference, and Learning. ACM, Toronto Ontario Canada, 151–159. https://doi.org/10.1145/3368555.3384468
- Pei et al. (2022) Zhongyi Pei, Lin Liu, Chen Wang, and Jianmin Wang. 2022. Requirements Engineering for Machine Learning: A Review and Reflection. In 2022 IEEE 30th International Requirements Engineering Conference Workshops (REW). IEEE, Melbourne, Australia, 166–175. https://doi.org/10.1109/REW56159.2022.00039
- Pushkarna et al. (2017) Mahima Pushkarna, James Wexler, and Jimbo Wilson. 2017. Facets: An Open Source Visualization Tool for Machine Learning Training Data. https://pair-code.github.io/facets/
- Rahwan et al. (2019) Iyad Rahwan, Manuel Cebrian, Nick Obradovich, Josh Bongard, Jean-François Bonnefon, Cynthia Breazeal, Jacob W. Crandall, Nicholas A. Christakis, Iain D. Couzin, Matthew O. Jackson, Nicholas R. Jennings, Ece Kamar, Isabel M. Kloumann, Hugo Larochelle, David Lazer, Richard McElreath, Alan Mislove, David C. Parkes, Alex ‘Sandy’ Pentland, Margaret E. Roberts, Azim Shariff, Joshua B. Tenenbaum, and Michael Wellman. 2019. Machine Behaviour. Nature 568, 7753 (April 2019), 477–486. https://doi.org/10.1038/s41586-019-1138-y
- Ribeiro and Lundberg (2022) Marco Tulio Ribeiro and Scott Lundberg. 2022. Adaptive Testing and Debugging of NLP Models. In Proceedings of the 60th Annual Meeting of the Association for Computational Linguistics (Volume 1: Long Papers). Association for Computational Linguistics, Dublin, Ireland, 3253–3267. https://doi.org/10.18653/v1/2022.acl-long.230
- Ribeiro et al. (2020) Marco Tulio Ribeiro, Tongshuang Wu, Carlos Guestrin, and Sameer Singh. 2020. Beyond Accuracy: Behavioral Testing of {NLP} Models with {C}heck{L}ist. In Proceedings of the 58th Annual Meeting of the Association for Computational Linguistics. Association for Computational Linguistics, Online, 4902–4912. https://doi.org/10.18653/v1/2020.acl-main.442
- Rombach et al. (2022) Robin Rombach, Andreas Blattmann, Dominik Lorenz, Patrick Esser, and Björn Ommer. 2022. High-Resolution Image Synthesis with Latent Diffusion Models. http://arxiv.org/abs/2112.10752 arXiv:2112.10752 [cs].
- Sagawa et al. (2020) Shiori Sagawa, Pang Wei Koh, Tatsunori B. Hashimoto, and Percy Liang. 2020. Distributionally Robust Neural Networks for Group Shifts: On the Importance of Regularization for Worst-Case Generalization. http://arxiv.org/abs/1911.08731 arXiv:1911.08731 [cs, stat].
- Satyanarayan et al. (2017) Arvind Satyanarayan, Dominik Moritz, Kanit Wongsuphasawat, and Jeffrey Heer. 2017. Vega-Lite: A Grammar of Interactive Graphics. IEEE Transactions on Visualization and Computer Graphics 23, 1 (2017), 341–350. https://doi.org/10.1109/TVCG.2016.2599030
- Stoyanovich and Howe (2019) Julia Stoyanovich and Bill Howe. 2019. Nutritional Labels for Data and Models. IEEE Data Eng. Bull. 42 (2019), 13–23.
- Subramonyam et al. (2021) Hariharan Subramonyam, Colleen Seifert, and Eytan Adar. 2021. Towards A Process Model for Co-Creating AI Experiences. In DIS 2021 - Proceedings of the 2021 ACM Designing Interactive Systems Conference: Nowhere and Everywhere. Association for Computing Machinery, Inc, 1529–1543. https://doi.org/10.1145/3461778.3462012
- van Griethuysen et al. (2017) Joost J.M. van Griethuysen, Andriy Fedorov, Chintan Parmar, Ahmed Hosny, Nicole Aucoin, Vivek Narayan, Regina G.H. Beets-Tan, Jean-Christophe Fillion-Robin, Steve Pieper, and Hugo J.W.L. Aerts. 2017. Computational Radiomics System to Decode the Radiographic Phenotype. Cancer Research 77, 21 (Nov. 2017), e104–e107. https://doi.org/10.1158/0008-5472.CAN-17-0339
- Wang et al. (2022) Zijie J. Wang, Evan Montoya, David Munechika, Haoyang Yang, Benjamin Hoover, and Duen Horng Chau. 2022. DiffusionDB: A Large-scale Prompt Gallery Dataset for Text-to-Image Generative Models. http://arxiv.org/abs/2210.14896 arXiv:2210.14896 [cs].
- Wexler et al. (2019) James Wexler, Mahima Pushkarna, Tolga Bolukbasi, Martin Wattenberg, Fernanda Viegas, and Jimbo Wilson. 2019. The What-If Tool: Interactive Probing of Machine Learning Models. IEEE Transactions on Visualization and Computer Graphics (2019), 1–1. https://doi.org/10.1109/TVCG.2019.2934619
- Wilson et al. (2019) Benjamin Wilson, Judy Hoffman, and Jamie Morgenstern. 2019. Predictive Inequity in Object Detection. http://arxiv.org/abs/1902.11097 arXiv:1902.11097 [cs, stat].
- Wu et al. (2019) Tongshuang Wu, Marco Tulio Ribeiro, Jeffrey Heer, and Daniel Weld. 2019. {E}rrudite: Scalable, Reproducible, and Testable Error Analysis. Proceedings of the 57th Conference of the Association for Computational Linguistics (2019), 747–763. https://www.aclweb.org/anthology/P19-1073
- Yang et al. (2022) Chenyang Yang, Rachel Brower-Sinning, Grace A. Lewis, Christian Kästner, and Tongshuang Wu. 2022. Capabilities for Better ML Engineering. http://arxiv.org/abs/2211.06409 arXiv:2211.06409 [cs].