Estimate of a nonflow baseline for the chiral magnetic effect in isobar collisions at RHIC
Abstract
Recently, STAR reported the isobar (, ) results for the chiral magnetic effect (CME) search. The Ru+Ru to Zr+Zr ratio of the CME-sensitive observable , normalized by elliptic anisotropy (), is observed to be close to the inverse multiplicity () ratio. In other words, the ratio of the observable is close to the naive background baseline of unity. However, nonflow correlations are expected to cause the baseline to deviate from unity. To further understand the isobar results, we decompose the nonflow contributions to (isobar ratio) into three terms and quantify each term by using the nonflow in measurement, published STAR data, and HIJING simulation. From these studies, we estimate a nonflow baseline of the isobar ratio of for the CME and discuss its implications.
1 Introduction
Quantum chromodynamics (QCD) predicts vacuum fluctuations, rendering nonzero topological charge in a local domain. As a result, there would be more particles with one certain chirality than the other, which is called the chirality anomaly. This effect may happen in heavy-ion collisions. If there is a strong magnetic field created by the spectator protons in heavy-ion collisions, the particles would have their spins aligned either parallel or anti-parallel to the magnetic field direction depending on their charges. Then, with the same chirality preference but opposite spins, the positive and negative charged particles would have opposite momenta. This charge separation phenomenon is called the chiral magnetic effect (CME).
To search for the CME, STAR conducted the isobar collisions in 2018, and recently published their isobar results STAR:2021mii . The two isobar species, and , were expected to have similar background in CME sensitive observables due to the same nucleon number, while Ru was expected to have larger CME signal due to more protons and therefore stronger magnetic field. If so, this CME observable over elliptic flow would be measured to be larger in Ru+Ru than Zr+Zr. However, from the recent STAR isobar paper, the Ru+Ru/Zr+Zr ratio of this observable is below unity, which is on the contrary to the initial expectation. The main reason is the multiplicity difference between the two isobars. If we include the multiplicity scaling, namely , then the background baseline would be naively unity. The isobar results with the multiplicity scaling are above unity. In order to conclude whether this is an evidence for CME, one needs to consider other background contributions to from nonflow effects.
2 observable and its nonflow backgrounds
The CME-sensitive observable is defined by
| (1) |
where , indicate particles of interest (POI), and is a reference particle as an estimate of the event plane whose resolution is equal to the elliptic flow . We use an asterisk (∗) on to indicate that it is the measured containing nonflow. The superscripts indicate the sign of particle charge. The subscripts OS, SS stand for opposite-sign and same-sign pairs, respectively. Their difference is taken to cancel charge-independent backgrounds.
The measurement contains flow and nonflow, respectively:
| (2) |
where denotes their ratio. is composed of a flow-induced background (major), a three-particle nonflow correlation (minor), and the possible CME signal Feng:2021pgf . Since we mainly focus on the backgrounds, the CME signal term is not written out:
| (3) |
is the two-particle (2p) nonflow correlations, such as resonance decay daughters with respect to their parent azimuthal angle (). is the three-particle (3p) nonflow correlations, such as jets where all the three particles are correlated. Thus,
| (4) |
where and are short-hand notations. With approximations to leading order, we get the nonflow contributions to the isobar ratio:
| (5) |
In the above expression the quantities with are the differences between Ru+Ru and Zr+Zr, while the others refer to those from Zr+Zr (or similarly Ru+Ru). We need those -terms for an improved background estimate.
3 Nonflow estimates
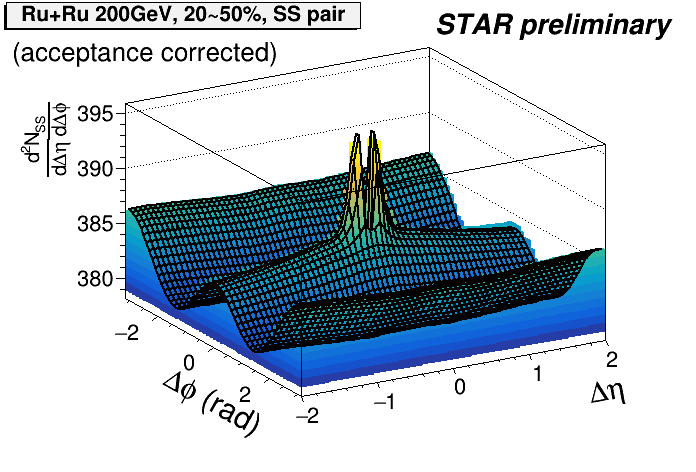
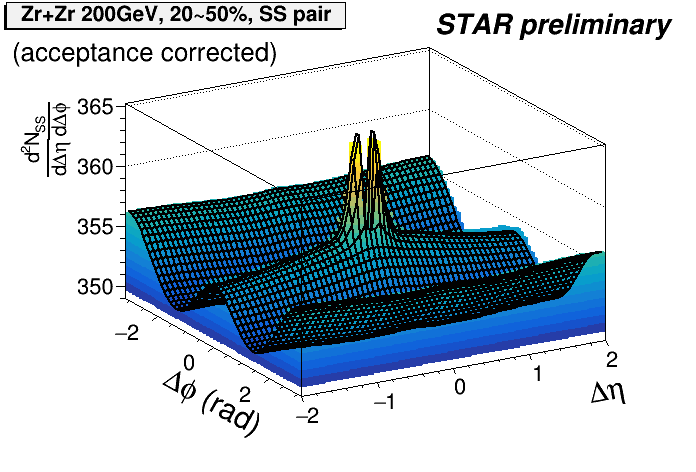
To get the nonflow in measurement, , we perform fit on the two-particle (, ) 2D distribution for mid-central collisions (Fig. 1). The fit function is given by:
| (6) |
where is Gaussian functions. The first three terms in Eq. (6) are 2D Gaussian functions (-terms) for the nearside (NS) correlations. The fourth term is for the awayside (AS) correlations (-term), whose projection is an error function divided by (), and whose projection is a Gaussian with mean value fixed to . The fifth term (-term) is a Gaussian centering at and independent of (referred to as the ridge, RG). The sixth term is the flow pedestal (-term), where is the squared “true flows” assumed to be -independent. Some of the fit results are listed in Table 1. By comparing the “true flow” from fit () with the inclusive measurement ( with a -gap), we estimate to be approximately . The dominant contribution is from the -term; we take half of this term as the systematic uncertainty for , and obtain , , .


| STAR preliminary | Ru+Ru | Zr+Zr | |
| SS | fit parameter | ||
| fit parameter | |||
| inclusive | |||
| nonflow | |||

Due to the large gap between TPC and ZDC, there is no 3p nonflow correlation between POI and ZDC event plane, so the can be obtained from ZDC measurements STAR:2021mii : (where the tracking efficiency is assumed to be 80%). For the isobar difference, however, the precision of measurements with the ZDC is too poor: . If we assume two isobars have similar , then , where the pair multiplicity difference is precisely measured STAR:2021mii . Thus, the isobar difference can be estimated as , which has better precision.
The 3p nonflow is hard to estimate from data, so we use HIJING model. HIJING does not have flow, so the only term left should be just the 3p nonflow. From this simulation, we get , while the isobar difference is small (consistent with zero) (Fig. 2). We assumed systematic uncertainty for .
With all the estimates above, we finally get by using Eq. (5):
| (7) |
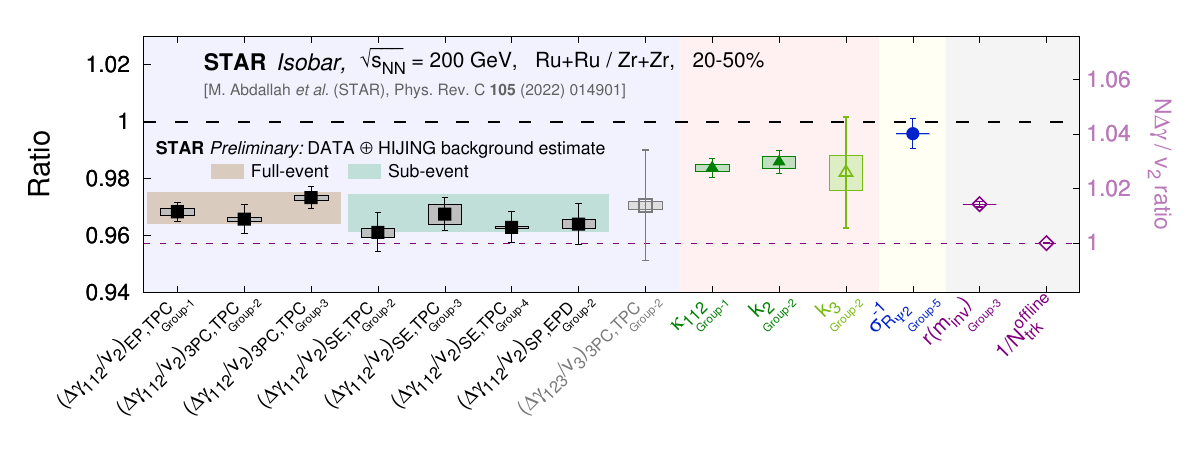
All the above estimates are for the full-event method STAR:2021mii . Following the above procedure for sub-events, we estimate the equivalent of Eq. (7) as . We plot those nonflow background estimates together with the STAR isobar data in Fig. 3.

4 Summary
This study estimates nonflow contribution in by fitting two-particle distribution, and 2p nonflow in using STAR isobar data STAR:2021mii . The 3p nonflow in is evaluated by HIJING simulation. Using the above information, we obtain an improved background estimate of isobar ratio for full-event, and for sub-event.
References
- (1) M. Abdallah et al. (STAR Collaboration), Phys. Rev. C 105, 014901 (2022)
- (2) Y. Feng, J. Zhao, H. Li, H. j. Xu and F. Wang, Phys. Rev. C 105, 024913 (2022)
- (3) D. E. Kharzeev, L. D. McLerran and H. J. Warringa, Nucl. Phys. A 803, 227-253 (2008)
- (4) S. Choudhury et al. Chin. Phys. C 46, 014101 (2022)