Physical Characterization of 2015 JD1: A Possibly Inhomogeneous Near-Earth Asteroid
Abstract
The surfaces of airless bodies such as asteroids are exposed to many phenomena that can alter their physical properties. Bennu, the target of the OSIRIS-REx mission, has demonstrated how complex the surface of a small body can be. In 2019 November, the potentially hazardous asteroid 2015 JD1 experienced a close approach of 0.0331 au from the Earth. We present results of the physical characterization of 2015 JD1 based on ground-based radar, spectroscopy, and photometric observations acquired during 2019 November. Radar polarimetry measurements from the Arecibo Observatory indicate a morphologically complex surface. The delay-Doppler images reveal a contact-binary asteroid with an estimated visible extent of 150 m. Our observations suggest that 2015 JD1 is an E-type asteroid with a surface composition similar to aubrites, a class of differentiated enstatite meteorites. The dynamical properties of 2015 JD1 suggest it came from the resonance with Jupiter, and spectral comparison with major E-type bodies suggest that it may have been derived from a parental body similar to the progenitor of the E-type (64) Angelina. Significantly, we find rotational spectral variation across the surface of 2015 JD1 from red to blue spectral slope. Our compositional analysis suggests that the spectral slope variation could be due to the lack of iron and sulfides in one area of the surface of 2015 JD1 and/or differences in grain sizes.
1 Introduction
Small rocky bodies in the solar system are a type of planetary library – they have existed since planetary formation, undergoing minor geochemical alterations and recording information of processes that occurred ever since. Comprehending the nature (i.e., physical and dynamical properties) of small objects in the solar system has been of vital importance to understand their formation and evolution (Bottke et al., 2002; DeMeo & Carry, 2014; Granvik et al., 2018; Binzel et al., 2019).
Wide-area asteroid surveys (i.e., the Near-Earth Object Wide-field Infrared Survey Explorer (NEOWISE, (Mainzer et al., 2011)), the Panoramic Survey Telescope and Rapid Response System (Pan-STARRS; (Chambers et al., 2016)), Spacewatch (Rabinowitz, 1991), the Lincoln Near-Earth Asteroid Research (LINEAR; (Stokes et al., 2000)), the Catalina Sky Survey (CSS; (Larson et al., 1998)), and others; see Jedicke et al. 2015 and references therein) have been one of the principal asteroidal science data providers in the past 30 years. These surveys have significantly increased the number of detected and characterized near-Earth asteroids (NEAs), with notable implications for planetary defense. Asteroid detection and characterization (i.e., optical surveys) has provided mission support by identifying spacecraft mission targets and has enabled population studies to refine our understanding of past and future interactions among a variety of different sized objects in our solar system. However, surveys are not intended to provide a detailed characterization of individual NEAs, which is commonly achieved with subsequent ground-based telescopic follow-up.
The recent spacecraft-visited potentially hazardous asteroids (PHAs) Bennu (DellaGiustina et al., 2021) and Ryugu (Sugimoto et al., 2021) have revealed spectrally distinct bright boulders on their surfaces. Furthermore, these spacecrafts observations raise the question of whether it is common for NEAs to possess heterogeneous surfaces. Examples of some asteroids that have shown spectral variability include (4) Vesta (Gaffey, 1983; Reddy et al., 2012) ( km; Russell et al. (2012)), (16) Psyche (Sanchez et al., 2017) ( km; Shepard et al. (2017)), 3200 Phaethon (Lazzarin et al., 2019) ( km; Taylor et al. (2019)), and the active asteroid (6478) Gault (Marsset et al., 2019) ( km; Devogèle et al. (2021)). Radar circular polarization ratio variation was also observed across the surface of 2006 AM4 (Virkki et al., 2014) ( km).
Multi-wavelength rotationally-resolved ground-based observations are key for detecting, confirming, and characterizing unique surface features (i.e., longitudinal spectral variability on asteroids). Identifying asteroids with particular regolith properties would be crucial to pin down targets for future space missions and planning and to develop accurate mitigation strategies (i.e., planning an orbit deflection to a highly porous rubble-pile versus a monolith asteroid would require special considerations of the regolith nature).
Here, we present results from our parallel multi-wavelength and multi-facility observational campaign of the NEA 2015 JD1 (hereafter JD1). JD1 is an Apollo-like NEA, classified as a PHA by having an Earth Minimum Orbit Intersection Distance (MOID) of 0.023 au and an absolute magnitude, , of 20.62 (asteroids with MOID 0.05 au and 22 are classified as PHAs)111https://cneos.jpl.nasa.gov/about/neo_groups.html. Previous observations of JD1 found a rotation period of 0.0006 hours (Warner & Stephens, 2020) and an L-type taxonomic classification (Perna et al., 2018) based on visible spectra.
2 Observations and Data Reduction
We performed near-simultaneous observations of JD1 using the Lowell Discovery Telescope and Arecibo Observatory in November 2019. Observations from Las Cumbres Observatory during the 2019 apparition are also presented in this work. This multi-wavelength approach allows us to use complementary techniques to constrain a range of physical properties for this object including its apparent shape, size, scattering properties, composition, taxonomic classification, density, and geometric albedo. Observational circumstances for Arecibo data are provided in Table 1 and for Lowell Discovery Telescope and Las Cumbres Observatory in Table 2.
2.1 Arecibo Radar Observations

| Arecibo | |||||||
|---|---|---|---|---|---|---|---|
| Start Date | Observation | Duration | Power | B | Visible Range | Runs | |
| and Time (UT) | Types | t [min] | [kW] | [au] | [Hz] | Extent [m] | [CW, Ranging] |
| 2019-11-01 22:31:55 | CW, 1s | 90.85 | 311 | 0.035 | 0.9 | 150 | 10, 9 |
| 2019-11-02 22:53:49 | CW, 1s, 0.2 s, 0.05s | 147.72 | 299 | 0.034 | 1.0 | 150, 100, 150 | 20, 94 |
| 2019-11-03 23:31:27 | CW, 0.05s | 24.82 | 327 | 0.033 | 0.9 | 75 | 7, 10 |
Radar observations of JD1 were carried out using the Arecibo Observatory S-band (2380 MHz; 12.6 cm) planetary radar system from 2019 November 1 to November 3, including when JD1 was at its closest approach of 0.0331 au from the Earth on November 3. Both Doppler echo power spectra and delay-Doppler imaging were collected during the three days.
A typical Arecibo radar observation of an NEA consists of transmitting a monochromatic, circularly polarized signal either unmodulated (continuous wave, CW) or modulated (ranging or images). The transmit-receive cycle consists of transmitting for one light round-trip time (RTT) to the target, then receiving the echo for an equal time. The transmitted power was 300-400 kW during the observations. For a detailed description of radar procedure see Ostro (1993).
The received echo was recorded in the same-circular (SC) and opposite-circular (OC) polarizations. For an ideally smooth mirror-like surface, the reflected signal is expected to be returned in OC only. The returned depolarized signal indicates the presence of both quasi-specular and diffusive scattering properties from the surface. Hence, the ratio of the SC to the OC polarization, so-called circular polarization ratio (CPR), was computed to understand the degree of possible surface undulation and composition.
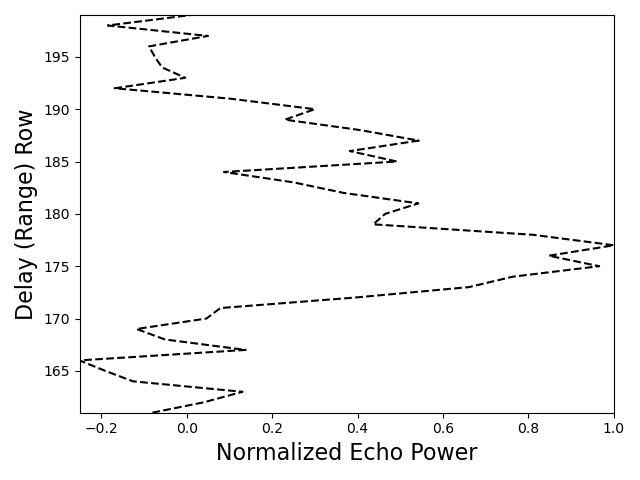
A total of 37 transmit-receive cycles on the CW setup were acquired during the scheduled radar observations (see Figure 1 for visualization of the weighted sum CW spectra per day). Delay-Doppler imaging was performed at 7.5-meter range resolution during the three days of observations. To obtain the radar images, we converted the echo power into z-score normalized images (see Figure 6). For each observation, we performed CW scan-by-scan verification and selected those with robust signal-to-noise ratio. Table 1 provides a detailed summary of the radar observations. A a detailed description of the radar observations of JD1 (i.e., systematic issues and observation methods) will be provided in Virkki et al. (in revision).
2.2 Lowell Discovery Telescope: near-infrared spectroscopy
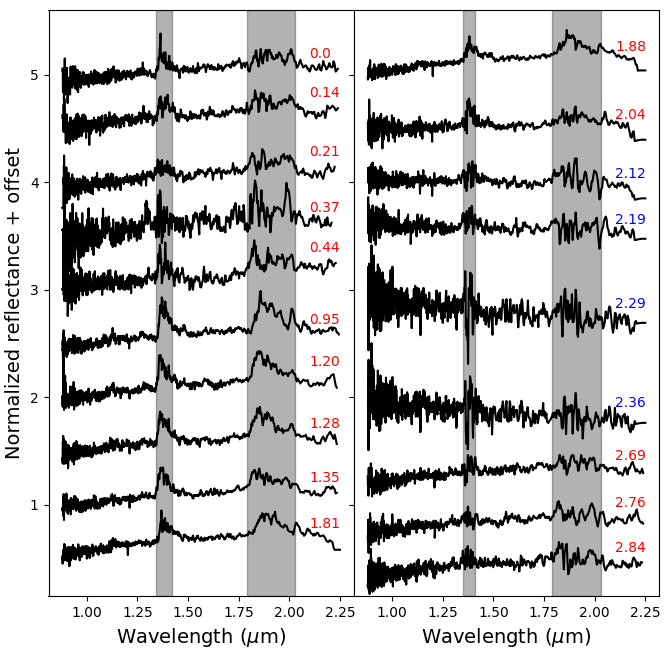
Near-infrared (NIR) observations of JD1 were conducted at the 4.3-meter Lowell Discovery Telescope (LDT) in Happy Jack, AZ, on 2019 November 1, while the asteroid was 0.037 au (14.7 lunar distances) from Earth and with a brightness of (Table 2). We used the Near-Infrared High Throughput Spectrograph (NIHTS) at LDT. NIHTS is a low resolution NIR spectrograph that covers the wavelength range from 0.86 to 2.4 microns in a single order (Dunham et al., 2018; Gustafsson et al., 2021). The LDT instrument cube is equipped with a dichroic fold mirror that transmits the visible wavelengths and reflects the NIR, allowing for simultaneous visible imaging with the Large Monolith Imager (LMI) and NIR spectroscopy with NIHTS.
| Date (UTC) | Time of Observations | Telescope | Phase Angle (∘) | V Magnitude |
|---|---|---|---|---|
| 2019 November 1 | 01:39:32 | LDT | 68 | 15.9 |
| 2019 November 7 | 10:24:26 | LCO | 40 | 15.3 |
| 2019 November 21 | 15:04:33 | LCO | 50 | 18.1 |
The NIR spectra of JD1 were obtained with NIHTS in the low-resolution () slit, oriented North to South. At the beginning of the observation, we performed dome flats and arcs lamp calibrations. Dome flats were collected with dome lamps of 4700 K and 12 V inside the dome. We used the Xenon arc lamp mounted inside the instrument to generate spectral calibrations lines (see Gustafsson et al. (2021) for more details on NIHTS observing procedure). We tracked JD1 at its sky motion rate near the meridian while the airmass ranged from 1.01 to 1.04 to minimize atmospheric dispersion. The data were acquired by nodding the object with 5′′ offsets along the spatial direction of the slit between the A and B positions in an ABBA pattern. We used a s exposure time to optimize both signal and wavelength coverage. The ABBA nod pattern with s exposures was repeated for 2.8 h of observation resulting in a total of nineteen spectra shown in Figure 2. The conditions during the observation remained relatively clear with some wind and thin clouds (seeing ranged from 14 to 17). The precipitable water value was approximately mm 222http://weather.uwyo.edu/upperair/sounding.html. To correct for telluric absorption and to obtain relative reflectance, the solar analog star SA113-276 was observed at similar airmass to the asteroid. The standard data reduction procedures were performed using the IDL Spextool package (Cushing et al., 2004) which has been adapted for NIHTS. Figure 2 shows the whole spectral data set covering 56% of the JD1 period (0.0006 hours; Warner & Stephens (2020)).
2.3 Lowell Discovery Telescope: photometry
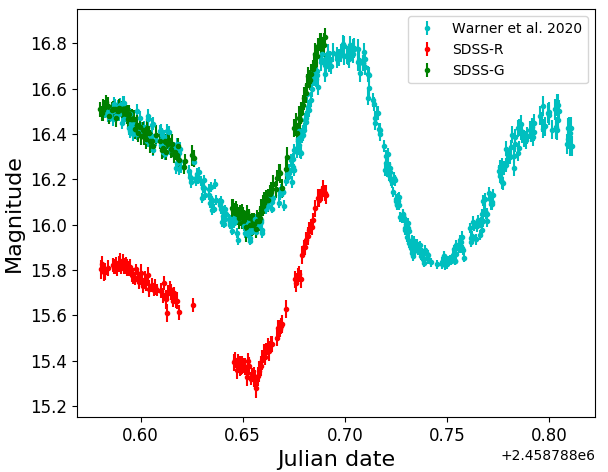
We obtained simultaneous visible photometry of JD1 with LMI through the dichroic fold mirror (Massey et al., 2013). Observations were conducted in Sloan Digital Sky Survey (SDSS) - and -band filters. The full LMI field of view captures 125 125 with a pixel CCD camera with an unbinned pixel scale of 012/pixel. The transmitted optical beam through the dichroic fold mirror creates a roughly oval-shaped unvignetted field of view of 65 40. Within this field, the throughput loss on and filters is 10% (Gustafsson et al., 2021). Images were obtained in 22 binning mode (024/pixel) with exposure times ranging between 4 s and 5 s. Flat-field images were taken for and filters during astronomical twilight on 2019 November 1. All data were bias subtracted and flat-field corrected for their corresponding filters.
The reduced LMI imaging data were analyzed using the automated Photometry Pipeline (PP) (Mommert, 2017). PP first utilizes Source Extractor (Bertin & Arnouts, 1996) to identify objects within each field, then SCAMP (Bertin, 2006) is called to match all sources with the selected photometry catalog. The astrometry was performed using data from the Gaia (DR1) mission (Gaia Collaboration et al., 2016). Pan-STARRS (Chambers et al., 2016) and SDSS (Ahn et al., 2012) catalogs were individually used to perform the photometry. Astrometry and photometry catalog queries were executed via PP using the Vizier Catalog Service (Ochsenbein et al., 2000). We performed manual and visual identification of the target for the whole set of images to discard images where the target was passing over or nearby a star or cosmic ray and to ensure correct target identification during the automated process. We manually verified a random sampling of results using Aperture Photometry Tool (Laher et al., 2012). We performed another PP calibration using only stars with solar-like colors to compare with the automated photometric analysis and to obtain a more reliable photometric reduction. Ultimately, 115 and 105 data points were obtained for the - and -band filters, respectively. We interpolated the lightcurves in Figure 3 using the interp routine of the numpy Python package to obtain the respective and magnitudes at equal times.
2.4 Las Cumbres Observatory: visible spectroscopy
In this paper, we also present visible spectroscopic observations obtained by Las Cumbres Observatory (LCO) using the FLOYDS333https://lco.global/observatory/instruments/floyds/ spectrographs located on the 2.0 m telescopes in Haleakala, Hawaii, and Siding Springs, Australia, on 2019 November 7 and November 21 at UTC 10:24:26.7 and 15:04:33.1, respectively. The data shown in Figure 4 are the smoothed, reduced spectra which were scheduled, observed, and reduced via a fully remote and automated process using the NEOExchange observation portal (Lister et al., 2021) and the LCO automated pipeline444https://lco.global/documentation/data/floyds-pipeline/. Exposure times of 1800 s and 3600 s were used while airmass ranged from 1.4 to 1.6 and 1.1 to 1.3 for the November 7 and November 21 observations. The solar analogs HD60298 and SA93 were observed near the target for November 7 and November 21 observations. On November 21, JD1 Vmag was 18.1, resulting in a poorer-quality observation.
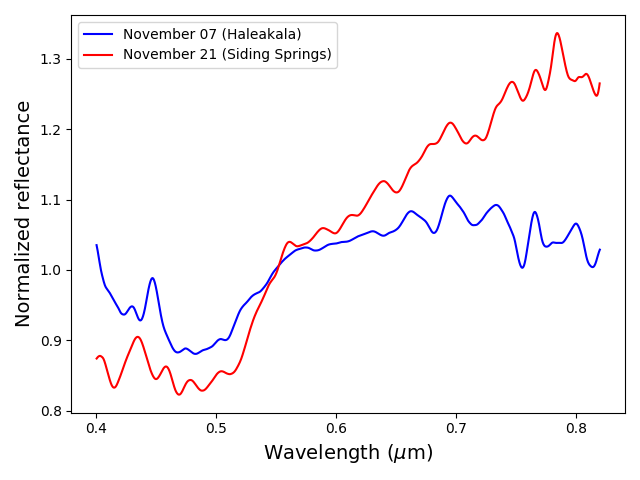
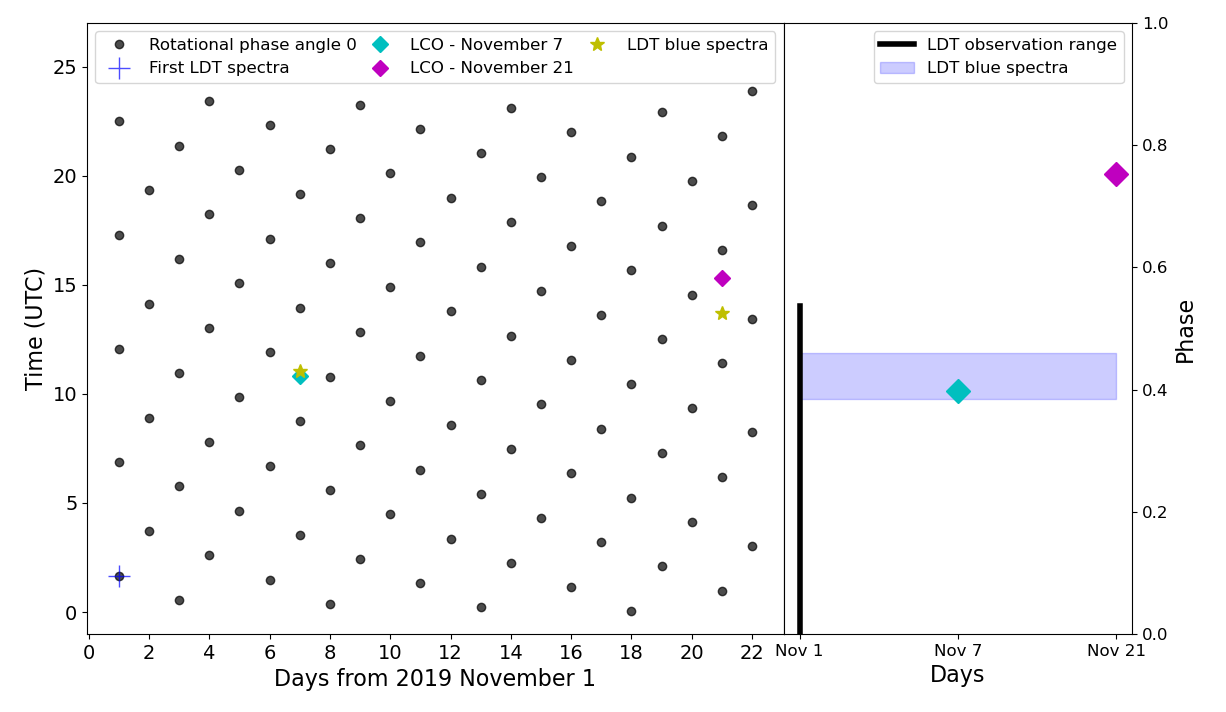
We phased the LCO observations to our LDT observation to check if we were likely observing the same object geometry. In Figure 5 we present the tracking of the zero (0∘) rotational phase angle (, beginning at UTC 01:39:32.37 on November 1) or the orientation that we were observing on the first scan obtained at LDT-NIHTS by adding JD1’s rotation period (0.0006 hours; Warner & Stephens (2020)). Because LCO observations were performed several days after our LDT observation, we also considered the relative offset induced by sky motion when phasing these observations. On November 7 and November 21, we find that LCO observations were and , respectively, different in phase angle from where we were looking with LDT on November 1 (68∘). The difference in phase angles imposes an offset of 25 and 15 minutes to the derived for November 7 and November 21, assuming a prograde rotation. We find that the LCO spectrum from November 7 (see the cyan diamonds in Figure 5) corresponds to the orientation we were observing for JD1 at the LDT around 2.360.02 hours after (see the yellow star in the left panel or the blue shaded area in the right panel). The observation from November 21 (see the magenta diamonds) covered an orientation not observed by the LDT observations, specifically 4.860.06 hours after or 2.02 hours after the last spectrum presented in Figure 2. In summary, the bluer LCO visible spectrum from November 7 coincides with the orientation we were observing for the blue sloped NIR spectra at LDT on November 1, while the steeper red LCO spectrum corresponds to an orientation that we did not cover at LDT (see the right panel of Figure 5 for better data visualization). Furthermore, both LCO and LDT observations support spectral variability in a similar near-surface region on JD1.
3 Results
3.1 Constraining Composition and Physical Properties
Arecibo delay-Doppler images reveal a contact-binary asteroid with an elongated projection, as expected from the 0.9 mag lightcurve amplitude (Warner & Stephens, 2020). The bi-lobed structure presented in Figure 6 shows a body and a head of approximately 100 and 50 m, respectively, or around 150 m in visible extent (see Figure 7). Radar images and CW experiments show no evidence of separate binary structure, which usually appears as a delta peak in the Doppler-only echo power spectra (Naidu et al., 2020).

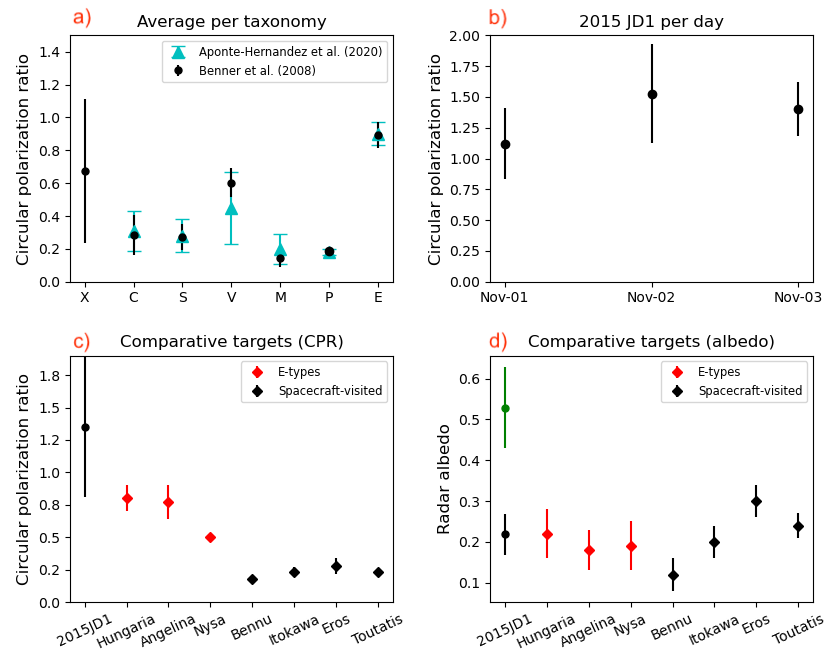
The disk-integrated CPR, the quotient of the diffuse and the quasi-specular integrated echo power (SC/OC) is 1.35 0.54 on average and 1.12 0.29, 1.52 0.40, and 1.4 0.22 on November 1, November 2, and November 3, respectively (see Figure 1 for data visualization). JD1 has one of the highest and consistent disk-integrated CPR values ever reported among other radar NEAs (Benner et al., 2008; Aponte-Hernandez et al., 2020). We should point out that the system temperature of the Arecibo S-band radar system suffered of some issues due to the low-noise amplifier (LNA) degradation after April 2019. The LNA issue could have produced lower measurements of OC cross-sections, thus yielding additional uncertainty on the CPR values. We attempted to address this issue in the data reduction. It seems statistically unlikely that JD1’s high CPR measurements were affected by this issue because of the consistency over the three days of radar observations. More discussion about the LNA issue and how it may have affected Arecibo’s S-band radar observations is soon to be published by Virkki et al. (in revision).
The measured total radar cross-section , given by the sum of the geometric OC and SC cross-sections, of JD1 on November 2 and November 3 is 6356146 m2 and 11911158 m2, respectively, with a systematic calibration uncertainty of 25%. In other words, for example, if JD1 were a perfectly isotropically reflecting metal sphere of 6356m2 geometric cross-section it would return the same amount of power if observed under similar circumstances. Assuming JD1 is a sphere of 0.15 km its upper limit OC () and SC () radar albedo (the ratio of the radar cross-section, of a given polarization, by the derived effective projected area) would be 0.220.05 and 0.310.08, respectively, or a total radar albedo = 0.530.10. Additional uncertainty in radar albedo could arise from deviation in the projected area (i.e., highly elongated asteroids), which can add an offset of 25% to the radar albedo computed above.
3.2 Sub-radar point
The spin-axis of a celestial body can be constrained from radar by measuring the change in the sub-radar latitude point. As the asteroid rotates, one limb approaches the line-of-sight while the other rotates away such that the transmitted monochromatic signal is broadened in Doppler. For a spherical with rotation rate , the broadened received signal in an echo bandwidth is given by
| (1) |
where () is the breadth of the asteroid at rotation phase , is the wavelength of the transmitted signal (0.126 m), and is the sub-radar latitude on the asteroid as viewed by the observer. Although JD1 is not a spherical object, this expression holds for any irregular (non-spherical) object. We modeled JD1’s Doppler dispersion bandwidth (shown in Figure 1) using equation 1.
In Eq. 1, the sub-radar latitude variability is limited by the change of Doppler dispersion when the rotation period and the sphere diameter is well-established. Figure 1 shows small Doppler dispersion differences at each observation, which will induce negligible sub-radar latitude changes. We found that an effective diameter of 150 m with a rotation period of 5.2116 h yield a Doppler dispersion of 0.9 Hz if JD1 was observed at or near its equator (around 70 degrees from the pole). The largest observed bandwidth of 1.2 Hz on November 3 requires an effective diameter of around 190 m also suggesting a near-equator sub-radar latitude point. Furthermore, our solutions support the rotation period derived by Warner & Stephens (2020). In addition, Figure 6 shows the smaller lobe disappearing as the body rotates, which is evidence of a sub-radar latitude near the equator (i.e., if the sub-radar point were far off the equator, both lobes would be visible the whole time).
3.3 Spectroscopic variation and photometric color
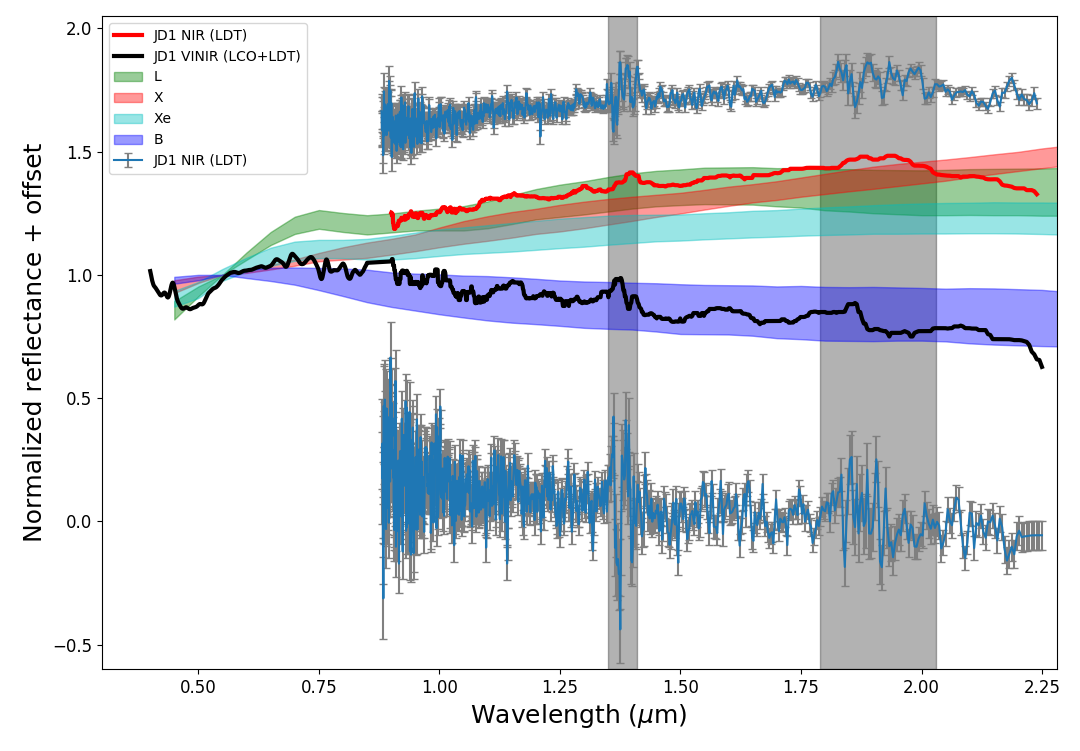
In Figure 8, we present two of nineteen featureless NIR spectra of JD1: a positive-slope (top) and a negative-slope (bottom) spectrum. These spectra were selected to illustrate the differences between their slopes. The negative-sloped (blue) and positive-sloped (red) NIR spectra correspond to the spectra obtained at 2.29 and 2.69 hours at LDT with NIHTS shown in Figure 2. In the black solid lines we show the visible and NIR spectra of JD1. The NIR spectra were smoothed using a median filter from Scipy Python package and offset to match the normalized visible reflectance from LCO. The non-smoothed red and blue NIR spectra (blue line) are plotted above and below to their respective smoothed spectra. The most likely Bus-Demeo spectral classifications are plotted in Figure 8 as red, cyan, green, and blue shaded area for X-, Xe-, L-, and B-type, respectively, and suggest spectroscopic similarities between these taxonomies: X-complex and B-type classification for the red and blue spectrum of JD1, respectively.
Perna et al. (2018) classified JD1 as an L-type asteroid. L-type spectra are characterized by the positively sloped visible spectra with a gentle concave curvature around 1.5 m. The red visible and NIR spectra of JD1 appear like an L-type but also are not too different from an Xe-type. Distinguishing between these two taxonomies is often very complicated because of the spectral similarities. JD1’s NIR spectra lack concave and convex curvatures around 1.5 and 2.0 m, respectively (see Figure 2), which are characteristic features of L-types (Devogèle et al., 2018). Additionally, the absorption band feature of JD1 around 0.5 m (see Figure 4) is typical of sulfide minerals such as oldhamite, seen on E-types (Clark et al., 2004). This spectral analysis combined with our radar measurements suggest that JD1 is likely an X-complex/E-type. Although our observations suggest an E-type taxonomy, the red spectra of JD1 is closely resembled to L-types. It is critical to mention that L-types are extremely rare primitive asteroids which constitute a very small fraction of objects in the main belt of asteroids (Devogèle et al., 2018).
Laboratory and telescopic studies have proved NIR spectral variability due to differences in phase angles, atmospheric dispersion, grain sizes, surface refreshing, observational circumstances (i.e., instrumental failure, target out of slit, or stellar interference), space weathering, and/or mineralogical composition.
The NIR spectral slope variability observed in JD1 (bottom panel, Figure 9) is transitional: a consistent positive-slope observed for about 2 hours after the first measurement, changing to a blue negative-slope for 0.5 hours and eventually transitioning back to red positive-sloped spectra. The variability suggests that any of the previous factors could be affecting our spectroscopic result. However, we can conservatively discard some of them.
Spectroscopic studies (i.e., Reddy et al. (2012); Nathues (2010); Sanchez et al. (2012)) have shown the increase/decrease of spectral slope and band depth when the phase angle g, increase between 0∘ 120∘. JD1’s phase angle decreased from 68∘ to 67∘ from the beginning to the end of the observation at the LDT. The change in phase angle is about 0.5∘, too small to be responsible for the observed spectral variability. Thus, we can confidently discard the phase angle factor.
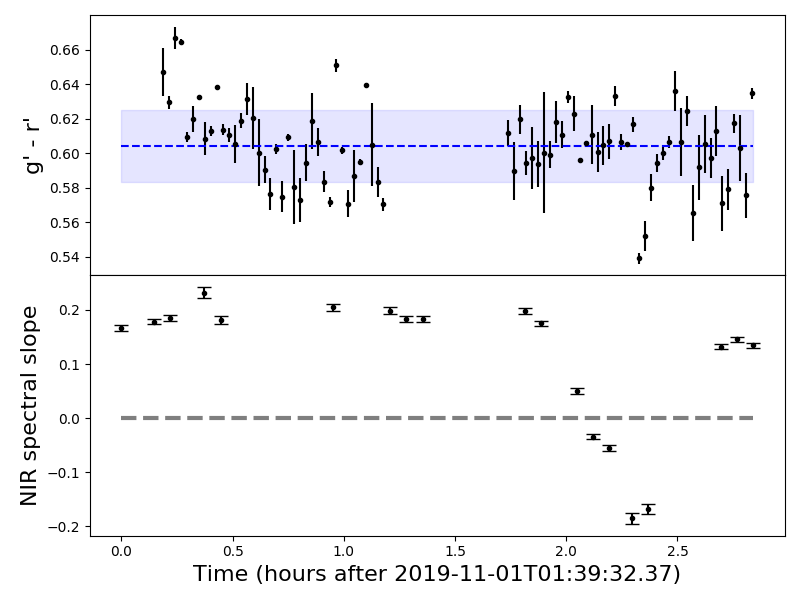
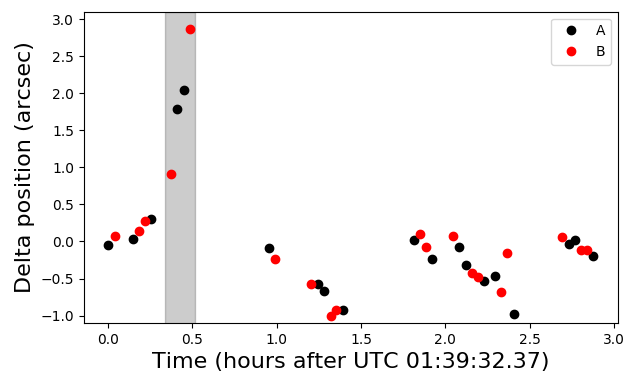
The observed spectral variability (bottom panel, Figure 9), does not suggest a phase-angle-like variability, but opens the possibility of an observational failure, i.e., the asteroid moving out of the slit. If the slit was not consistently aligned in the same way for every exposure either in position A or B, then, in theory, there could be a shift in intensity that is wavelength dependent. If the slit was fixed, as during our observation, any fraction of light lost due to a finite slit is the same for every exposure at each wavelength. We used Spextool to measure the central aperture slit position as a function of time. Figure 10 shows JD1’s aperture shift in the slit as a function of time. The timing of the largest drift does not line up with the change in NIR spectral slope we found in JD1. At the time of observing spectral variability, we found a drift of (9 pixels) between the asteroid and the slit. Thus, the possibility that the asteroid was moving out of the slit during the time of spectral slope change can be rejected.
Another factor that we considered is the atmospheric dispersion. However, this could be easily discarded, given that JD1 was observed at relatively low airmasses between 1.01 to 1.04. We verified the standard star slopes and found similar normalized spectral slopes with no difference larger than 2% in continuum. We found consistency in our data reduction (i.e., no correlation between standard star slopes and JD1’s variability). We performed an inspection of our spectral data and found no stellar interference contaminating JD1’s flux within the slit in our dataset.
With the provided overview, it does not seem feasible that our data was affected by observational artifacts. We explore other possibilities that could be causing such spectral variabilities in the next Sections. However, such possibilities support the position that the observed variability truly reflects surface properties of JD1.
The average - color of JD1 is 0.60 0.03, shown in top panel of Figure 9 in the blue dashed line. This color, within errors, falls in the range of - colors (0.4-0.6) for X-types (Ivezić et al., 2001). It is well known that asteroid colors reflect properties of their composition. We also look for visible color variation in order to validate any spectral variation seen in the NIR. The color variation, shown in black dots at the top panel of Figure 9, support color blueing from 0-0.7 hours and around 2.35 hours. While there is a visible color change in JD1 around 2.35 hours, it is statistically of low significance to support the NIR spectral slope variability, also considering the noisy rotational color distribution. The largest visible color drop occurs around the bluer NIR spectra, while no color decrease is observed at 1.9 hours when the NIR slope changes. This could be due to a non-simultaneous spectroscopic variability between the visible and NIR region or to the noise in the photometric color distribution.
While the completeness and reliability of JD1 NIR spectral variation are supported by a single observation night of 60% of JD1’s period, and thus not confirmed, independent observations from LCO also suggest visible spectral variability. We demonstrated in Section 2.4 that the geometry observed with the blue NIR spectra from LDT coincide with that of the blue visible LCO spectrum. Therefore, we interpret the NIR slope variability as a true reflection of particular surface properties of JD1 and not as artifacts in the observations. Still, further observational validation is needed.
4 Analysis
4.1 Visible albedo
We investigated the propagation of visible albedo solutions considering two different diameters and three absolute magnitudes (H) for each diameter (see below the details of the adopted methodology).
It is known that H mag is the main driver to derive the albedo uncertainty because of the difficulty in measuring the entire asteroids’ phase curve (Masiero et al., 2021). We used the H-G (Bowell et al., 1989) system to calculate the absolute magnitude at a given photometric filter f. We used our measured visible magnitudes at the SDSS and band filters, V16.25 and V15.65, a G slope value of 0.15, and phase angle =68∘. We obtained g and r bands absolute magnitudes H and H, respectively. In our visible albedo analysis, we also considered the Minor Planet Center absolute magnitude H. We used the (Fowler & Chillemi, 1992) empirical expression which relates the absolute magnitude H, diameter, and visible albedo of an asteroid. By using a fixed diameter of 150 m we obtained a visible albedo ranging from 0.30 to 0.56 and 0.19 to 0.35 assuming a 190 m effective diameter (see table 3 for detailed solutions). The range of possible visible albedo solutions gives an average albedo of 0.350.12. The average visible albedo, within the standard deviation, falls in the range of albedo for enstatite-like asteroids (0.4 to 0.6) (Zellner et al., 1977, 1985; Clark et al., 2004; Thomas et al., 2011) and with the 0.50 derived by Trilling et al. (2016) for JD1.
| Absolute magnitudes | |||
|---|---|---|---|
| Hg | HMPC | Hr | |
| 21.03 | 20.62 | 20.36 | |
| Visible albedo | |||
| p() | 0.30 | 0.44 | 0.56 |
| p | 0.19 | 0.28 | 0.35 |
| p(average) | 0.35 0.12 | ||
4.2 Meteorite and asteroid connections
We have presented evidence that supports a relationship between JD1 and E-types asteroids, such as the high albedo of JD1, high CPR, spectral shape similarities, and near-surface bulk density. We performed a search through the Reflectance Experiment Laboratory (RELAB)555http://www.planetary.brown.edu/relab/ database to constrain the composition and trace the possible meteorite connection with JD1. We searched for enstatite achondrites meteorites (aubrites) and common minerals usually present on these meteorites, in which NIR spectral properties were mostly featureless (Cloutis et al., 1990).
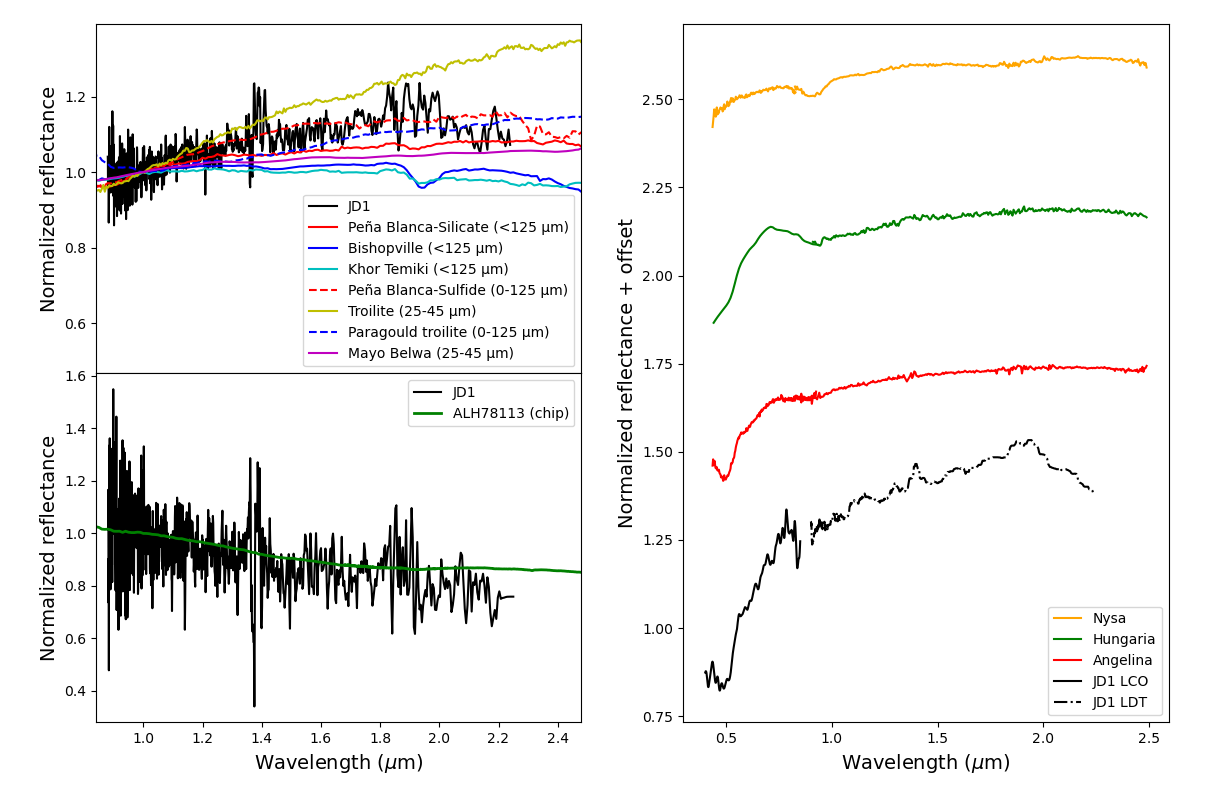
Aubrites are well-known brecciated meteorites chemically dominated by low-iron enstatite (75-98 vol%), with relatively small amount of plagioclase (4.3 vol% on average), and nearly FeO-free diopside (2.2 vol% on average) and forsterite (3.5 vol% on average) (Watters & Prinz, 1979; Gaffey, 1983; Keil, 2010). Bulk chemical analysis indicates that oxides such as MgO and SiO2 are the most abundant, while CaO, Na2O, and Al2O3 are less abundant. Other metallic elements (Fe and Ni) and sulfides (Ti, Mn, Cr) are also found to be less abundant. The chemical composition overview of aubrites gives an idea of what elements should be expected on E-types. In Figure 11 (left panel), we show the reflectance of well-known aubrites and common minerals on them. By visible inspection, spectral slopes similarities can be noticed between JD1 red and blue spectrum and aubrites such as Peña Blanca and ALH78113.
We have implemented the E-type sub-classification techniques developed by Gaffey & Kelley (2004) and Clark et al. (2004) to investigate the composition of JD1. Gaffey & Kelley (2004) proposed three sub classes for E-types: E[I], E[II], and E[III]. The E[I] show a slightly curved spectrum with no clear mineral absorption feature. The E[II] are distinguished by the strong absorption features near 0.5 m and a weaker one near 0.9 m. These absorptions are characteristic of oldhamite. The E[III] are characterized by having an almost-flat spectrum which turns to a red slope with a unique absorption feature near 0.9 m, attributed to enstatite pyroxene with some Fe2+. In addition, Fornasier et al. (2008) found that E[II] asteroids had the highest spectral slopes while E[III] asteroids had flat or negative visible spectral slopes. The Clark et al. (2004) sub-classification technique is based on mineralogical compositional similarities to the E-types asteroids (44) Nysa, (64) Angelina, and (434) Hungaria. The Nysa-like are those whose compositional analysis suggests silicate mineralogy with higher iron content than enstatite and absorption features at 0.9 m and 1.8 m. The Angelina-like are characterized by having absorption features at 0.5 m and 0.9 m, attributed to silicate mineralogy plus the presence of sulfide and olivine. The Hungaria-like are asteroids whose compositional analysis revealed some olivine and a typical reflectance feature near 0.9 m.
The Gaffey & Kelley (2004) classification suggests that JD1, having a possible absorption feature centered at 0.507 m and lacking the 0.9 m feature, is consistent with an E[II] classification. In Figure 11 (right panel), JD1 red spectrum is plotted with the E-types (434) Hungaria, (64) Angelina, and (44) Nysa for comparison. JD1 has a red spectra among the E-types with a particular spectral similarity to (64) Angelina. Using both Clark et al. (2004) and Gaffey & Kelley (2004) classifications, we suggest that JD1 corresponds to the Angelina-like group, given their spectral similarities observed in Figure 11. The presented spectral connection implies that JD1 mineralogy should be similar to that of aubrite meteorites plus oldhamite and troilite (Clark et al., 2004).
4.3 Grain sizes
Spacecraft-visited asteroids (i.e., Itokawa, Bennu, Eros, and Ryugu) have shown that the surfaces of small bodies are highly diverse, with particles ranging from dust-like to boulder-like sizes. Such particle variability could affect the deduced spectral composition by making spectra appear distinct at different phase orientations. Meteorite reflectance as a function of composition and grain-sizes would provide crucial information on whether a spectral variation is due to different grain-sizes or different mineralogical composition or a combination of both.
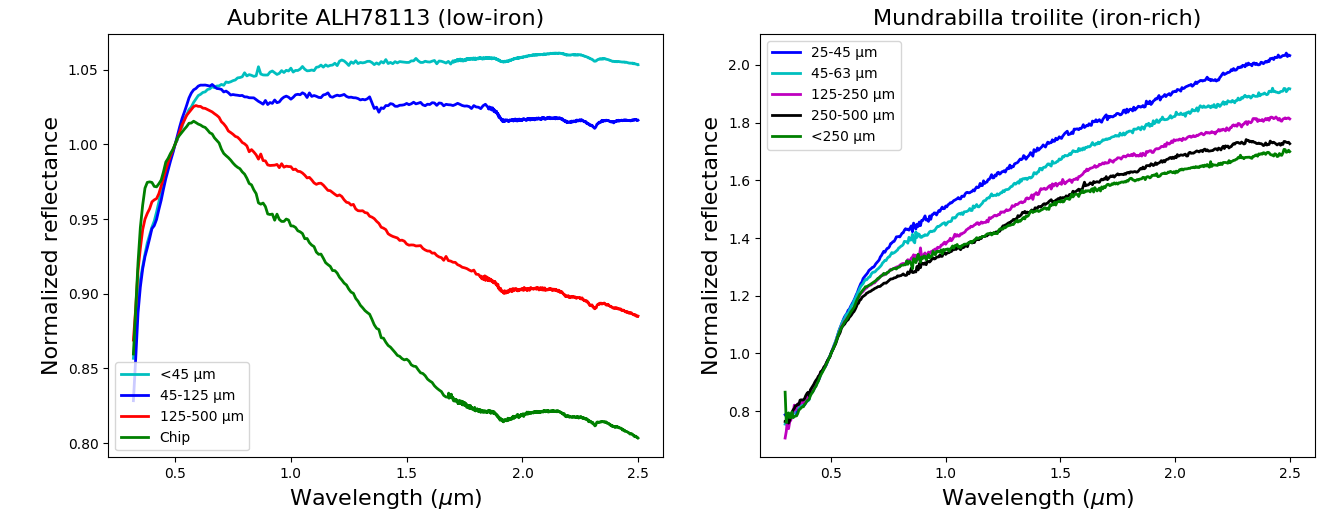
If the JD1 variation is only due to a change in grain-sizes under a similar composition, we should be able to validate this by looking at the reflectance variation as a function of wavelength and grain-sizes. Figure 9 bottom panel, shows that much of the JD1 surface is spectrally red. We then considered whether different grain sizes on NIR spectral red meteorites could lead to negative-blue spectra. The effect of grain-sizes on iron-sulfide (Mundrabilla) and enstatite-achondrite (ALH78113) spectra are illustrated in Figure 12. The reflectance of the aubrite ALH78113 shows a flat NIR spectral slope for small grain-sizes (45m) and a drastic decline in the NIR slope as the grain-sizes increase up to chip-size grains. Similar behavior can be observed for the reflectance of Mundrabilla meteorite as a function of wavelength. The NIR slopes of ALH78113 ranges from -6% to 0.6% m-1, while the NIR slopes of Mundrabilla meteorite ranges from 26% to 33% m-1. In other words, the grain sizes of ALH78113 and Mundrabilla contributed a slope difference (redder slope minus bluest slope) of 6.6% m-1 and 7% m-1, respectively. JD1 has a NIR slope difference of 41.710.01% m-1 (most-positive to most-negative spectral slope difference). It is clear that grain sizes do have a strong influence on the NIR slope and visible color. However, we have demonstrated that is unlikely to explain the NIR slope variation of JD1 with the size range of grains in RELAB. More laboratory work needs to be done on aubrites meteorites or simulant material at a larger range of grain to test the feasibility of the grain size hypothesis. Thus, the scenario where JD1’s spectral variation could be due to a compositional and grain sizes heterogeneity seems feasible.
4.4 Color and Albedo: Hints for Mineralogical Composition
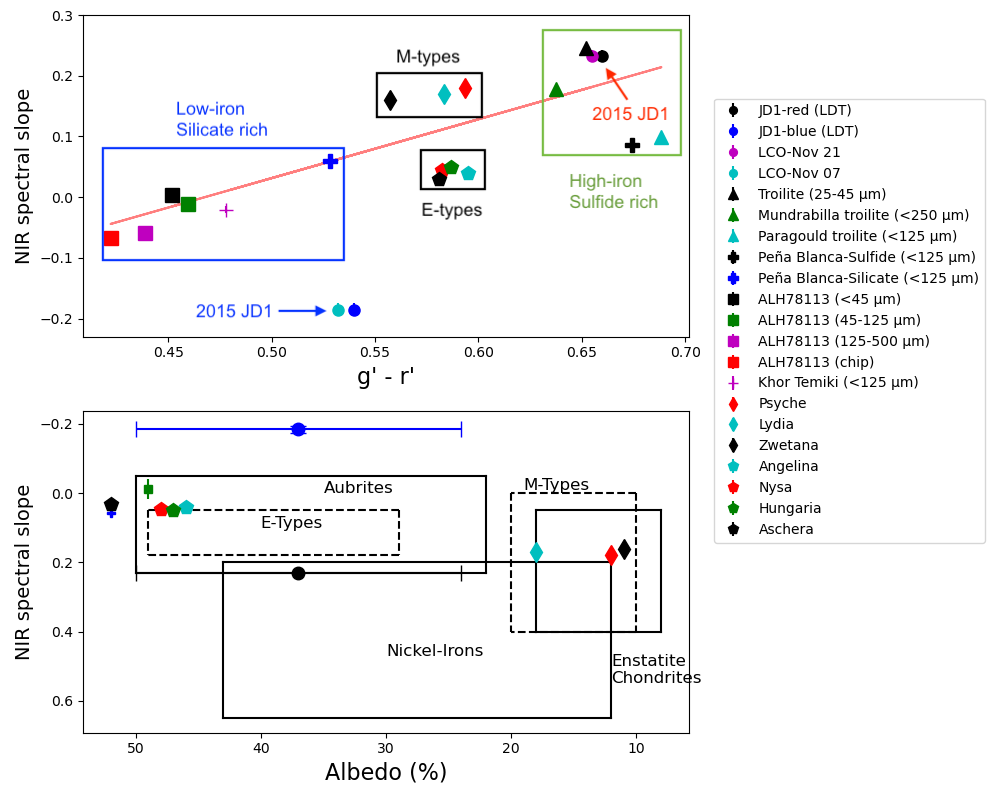
The colors of asteroids reflect information about their mineralogical composition since they can contain diagnostic features of the spectral bands. We developed an analysis to compare JD1’s visible colors and NIR slopes with meteorites and asteroids presented in Section 4.2. This would help to explore the possible mineralogical composition of the spectral variability. Similarly, we provide a NIR spectral slope and albedo study to investigate possible compositional connections.
To obtain the Sloan - color, we retrieved the visible spectra of ALH78113, Mundrabilla troilite, Paragould troilite, troilite mineral, Peña Blanca silicate and sulfide samples, and Khor Temiki from RELAB. We convolved each spectrum with the bandpasses for Sloan and filters (Gunn et al., 1998; Doi et al., 2010). From the ratio of these integrated reflectances, we derived the intrinsic visible reflectance color, in magnitudes, for each meteorite. Finally, we add in the - Solar color of Willmer (2018) to produce the apparent color that each meteorite would have if observed in space (that is, as illuminated by the Sun). The LCO intrinsic visible reflectance color of JD1 was also determined using the same methodology. The LDT-LMI colors were selected based on the measured color at the corresponding time of the respective NIR spectra presented in Figure 8. To obtain the - color of the M- and E-types, we used their B-V colors given by Tedesco (2005) and the color transformations between the Johnson-Cousins and Sloan system (Castro et al., 2018).
Figure 13 top panel, illustrates the NIR spectral slope as a function of the - color of the selected RELAB meteorites, minerals, M- and E-types, and JD1’s colors. The NIR spectral slope was measured from 0.8 to 2.5 m region. The solid circles in Figure 13 correspond to the observed colors of JD1 from LDT and LCO. The black and blue circles represent the redder and bluer photometric color from LDT. We adopted the same NIR spectral slopes from the LDT spectroscopic observations to the retrieved colors from LCO visible spectra given that there is no NIR spectra from LCO. However, such assumption will not affect the purpose of this analysis because when comparing LCO and LDT we only refer to the visible colors. The retrieved LCO visible colors of JD1 (magenta and cyan circles in Figure 13) support a color variation, similar to the obtained from the photometric observation at LDT. The bottom panel, illustrates the NIR spectral slope as a function of albedo. The black boxes (aubrites, nickel-iron, and ensatite chondrite) indicates possible meteorites analog ranges from Gaffey (1976), and the dashed black boxes are the ranges derived from observation of M- and E-types from Bell et al. (1988). The M- and E-types asteroids albedos were obtained from Masiero et al. (2014), while aubrites Peña Blanca and ALH78113 from Fornasier et al. (2008). We assumed the same albedo for the red and blue regions of JD1. A complete discussion of these results is provided in Section 6.2.
5 Dynamical Study
Pairing the spectroscopic analysis from Section 4 to a dynamical study would provide constraints on JD1’s origin and possible connection to a parent body. We used the NEO dynamical model of Granvik et al. (2018) to calculate where JD1 came from based on its current eccentricity, inclination, and semimajor axis of 0.222, 19.139∘, and 1.216 au, respectively.
According to the Granvik et al. (2018) model, which takes into account high-inclination orbits, JD1 has an % probability of coming from the secular resonance or other resonances close by, % chance of coming from the 3:1 mean-motion resonance (MMR) with Jupiter or other resonances close by, % chance of coming from the Hungaria group, and % chance of coming from the Phocaea group. Based on these probabilities, the most likely sources of origin of JD1 would be regions in the asteroid belt feeding the complex or the 3:1 complex.
In Section 4, we presented compositional connection between JD1 and E[II] types or Angelina-like bodies. (64) Angelina’s orbit (e,i,a) = (0.125, 1.309∘, 2.68 au) does not appear to agree with JD1’s high orbital inclination. However, the relatively low semimajor axis of JD1 suggests that it has spent a relatively long time in the NEO region and has therefore also endured a non-negligible number of close planetary encounters. These planetary encounters may have changed JD1’s inclination dramatically. Hence, while (64) Angelina has not been linked as a possible parental body of E-type asteroids, we find it plausible that JD1 may be genetically related to (64) Angelina, and have entered NEO region through the 3:1 MMR. Given its small size and hence rapid drift in semimajor axis caused by the Yarkovsky effect, it may also be possible that JD1 has moved across the 3:1 MMR rapidly enough not to be ejected from the asteroid belt, and only been ejected when it reached the resonance (see Fig. 17 in Granvik et al., 2017).
On the other hand, (434) Hungaria (e,i,a) = (0.073, 22.509∘, 1.94 au) has similar orbital parameters to that of JD1 and the dynamical model suggests 5% probability of coming from the Hungaria group. However, the compositional analysis of JD1 does not agree with an origin in the Hungaria group as well as it does for Angelina-like bodies (see Sect. 4.2).
Dynamical considerations suggest that both the resonance complex and the 3:1 resonance complex are potential escape routes for JD1. Assessing whether JD1 reached the or the 3:1 resonance complexes after being ejected from an E-type family member (i.e., the Hungaria family or a non-Hungaria family), requires extensive dynamical modeling, so we leave it for future work. We do suggest, from compositional evidence, that JD1 falls within the Angelina-like group Clark et al. (2004) given the strong evidence for sulfide on its surface, which is not detected in the spectra of (434) Hungaria.
6 Discussion
6.1 Circular polarization ratio and radar albedo
The SC/OC ratio or CPR has commonly been used as a single-parameter study for surface composition and near-surface roughness (Ostro, 1993; Benner et al., 2008). Radar scattering modeling have manifest the non-linear behaviour of SC/OC ratios with composition and surface roughness mainly due to variable near-surface electric properties among different taxonomies (Virkki & Muinonen, 2016). Although attempts from both observational and modeling approaches have intended to understand the behaviour of the radar scattering properties of asteroids surfaces with respect its composition and particle size distribution, the area remain substantially unexplored and inconclusive. Future laboratory and modeling works would help to pivot our understanding regarding SC/OC ratio including the identification of near-surface elements controlling radar scattering properties.
Benner et al. (2008) published average CPR values for NEAs ranging from 0.143 0.055 for M-type asteroids to 0.892 0.079 for E-type asteroids. Recently, Aponte-Hernandez et al. (2020) also found similar trends among taxonomic classes. Aponte-Hernandez et al. (2020) found that asteroids with CPR 0.75 can be statistically, within 2-, characterized as E-types. E-types have presented robust statistical consistency on high CPR values (Benner et al., 2008; Busch et al., 2008; Reddy et al., 2012; Aponte-Hernandez et al., 2020). Such a tendency might be illustrating characteristic properties of their mineralogical composition and surface properties. Based on this CPR review, we argue that JD1’s composition should be similar to those E-types asteroids (see Figure 14). Although no spacecraft has visited an E-type asteroid to do a direct comparison with JD1, valuable information can be extracted from other spacecraft-visited asteroids that have radar observations. Comparatively, the CPR value of JD1 exceeds all of those CPR of spacecraft-visited asteroids including S- and C-complex: (433) Eros (0.28 0.06; Magri et al. (2001)), (25143) Itokawa (0.26 0.04; Ostro et al. (2004)), (4179) Toutatis (0.23 0.03; Magri et al. (2001)), and (101955) Bennu (0.18 0.03; Nolan et al. (2013)). Given the uniqueness of the JD1 scattering properties and lack of interpretation of such high CPR value, it it not possible to make connection with those spacecraft-observed asteroids (i.e, Bennu (Lauretta et al., 2019), Toutatis (Jiang et al., 2015), Eros (Robinson et al., 2002), and Itokawa (Susorney et al., 2019)) surface properties.
Radar albedo can be used to infer surface properties (i.e., metallicity and density) of asteroids (Shepard et al., 2008a, 2010). From radar data compilation (Neese et al., 2012), the average of asteroids is 15.7 11.1% (including near-Earth and main belt asteroids). The total power (SC + OC = ) of radar observed E-types asteroids (i.e., (64) Angelina (Shepard et al., 2011), (434) Hungaria (Shepard et al., 2008b), (44) Nysa (Shepard et al., 2008b), and 1998 (Busch et al., 2008)) range from 0.18 to 0.42, 0.24 to 0.32 for the M-type (16) Psyche (Shepard et al., 2017), and 0.12 to 0.3 for the spacecraft-visited asteroids shown in Figure 14 panel d. Comparatively, JD1’s total power (=0.530.10) radar albedo exceeds all those reported for E-types. Moreover, JD1’s OC radar albedo is indistinguishable between the selected comparative objects, but higher than Bennu’s total power. Bennu has a radar albedo of 0.12 and a bulk density of 1.19 g/cm3 (Lauretta et al., 2019) and comets have typical radar albedo ranging from 0.4 to 0.1 and densities below 1 g/cm3 (Harmon et al., 1999, 2004, 2011), thus we can reject a low near-surface density for JD1.
The comparison between JD1’s disk-integrated radar albedo with those of E- and M-types, suggest some metal content near the surface. Adopting Shepard et al. (2010) relationship, we obtained an approximate upper-limit density of for a 30% porosity using typical aubrites grain densities of from Britt & Consolmagno (2003).
6.2 Compositional Analysis of the Surface
Figure 13 top panel has four boxes indicating either regions with similar composition or similar taxonomies, i.e., black boxes indicates E- and M-types, the green box shows meteorites and minerals rich in iron and sulfide, and the blue box indicates meteorites rich in enstatite silicate with low iron abundances. The first fact to notice is the mineralogical composition effect. This analysis shows that meteorites with higher iron and sulfide abundances have redder spectral slope and color while bluer colors and spectral slopes are observed for meteorites whose mineralogical composition is shown to be richer in enstatite silicates and lower in iron. M-types have steeper spectral slopes than E-types due to the higher iron content, which can also be observed in our sample of well-known EM-types asteroids. Second, JD1’s negative NIR spectral slope and blue colors deviate from the positive NIR spectral slope and red colors suggesting that such a blue region is compositionally distinct. JD1’s spectral-red surface has a steeper slope and redder Sloan colors than EM-types and is mineralogically consistent with the spectral properties of iron sulfides (i.e., the mineral troilite and Peña Blanca sulfide region). Similarly, the red NIR spectral slope of JD1 as a function of its geometric albedo place it between the aubrites and nickel-iron regions, suggesting as well some iron composition. The spectral-blue region has a bluer slope than the selected aubrites and than the aubrites slopes ranges presented in the bottom panel. The blue Sloan colors of JD1 are similar to that of Peña Blanca silicate region. Such spectral similarities with aubrites ALH78113, Peña Blanca silicate region, and Khor Temiki suggest a composition abundant in enstatite-silicate and low iron content. The blue region could still preserve some sulfide end-members since both LCO spectra shows the 0.5 m feature.
In Figure 11 left panel, two spectra of Peña Blanca meteorite are shown. The steeper reflectance (red dashed line) is from the sulfide-rich region while the other one is from an enstatite-silicate region. The NIR similarity between JD1 red-sloped spectra and Peña Blanca-sulfide region suggest a common mineralogical composition, while JD1’s blue Sloan colors support a Peña Blanca silicate-like composition. Peña Blanca Spring is a fragmental breccia of particular interest since it contains large crystals of enstatite (10 cm in diameter from the largest extension), which has been attributed to an igneous formation (Lonsdale, 1947). The bulk analysis of Peña Blanca Spring, which correspond to the silicate-region spectra referred in this work, revealed a high abundance of enstatite (95 wt.%) with low iron, plagioclase (2.1 wt.%), diopside (2.7 wt.%), forsterite (0.3 wt.%) and sulfide end-members in lower abundances (0.2 wt.%) (Watters & Prinz, 1979; Lonsdale, 1947). The chemical analysis of the Peña Blanca sulfide region mentioned here, yielded a high iron abundance and a Fe:Ni of 22.68 (Lodders et al., 1993). This comparison between Peña Blanca chemical analysis and JD1 is in agreement with the analysis of NIR spectral slope and Sloan colors.
ALH78113 is another fragmental breccia with chondritic-like inclusions, similar to Cumberland Falls, with large enstatite fragments (5 cm in diameter). Based on those inclusions, Lipschutz et al. (1988) concluded that ALH78113 is a representative of foreign primitive fragments, not necessarily formed under the same conditions as enstatite achondrites meteorites, that collided with the aubrite parent body. The bulk chemical analysis indicate that enstatite is the most abundant mineral (Kimura et al., 1993). Their silicate phases shows feldspar, olivine, glass, diopside, enstatite, and silica mineral (Lipschutz et al., 1988; Kimura et al., 1993). The bluest spectral slope of JD1 is 10% more negative than the bluer spectral slope of ALH78113 (see the green spectrum with grains chip-size in Figure 12 left panel). It is likely, as indicated by the comparison with Peña Blanca and from the slope-color analysis, that the blue (spectral) region on JD1 contains lower abundances of Fe/Ni and larger grain sizes than ALH78113 and than the rest of its surface.
6.3 Possible explanations for the spectral variability
In Section 6.2, we investigated the spectral slope and color variation of JD1. However, it is difficult to explain the nature of JD1’s spectral variability with the available data. Therefore, we provide the following hypotheses that could yield the observed variability.
-
1.
Space weathering: Several active comets are known to show longitudinal spectral variations in their surfaces in a relatively limited time-frame (Luk’yanyk et al., 2019) due to the sublimation of icy grains. The NIR spectra of (6478) Gault, which is known to be an active asteroid, showed a slope variation of 22.6% m-1 (Marsset et al., 2019). They hypothesized that the NIR spectral variation was likely due to a loss of regolith, resulting in the exposure of newer material. As mentioned in section 5, the low semimajor axis of JD1 suggest considerable number of close planetary encounters. It could be possible that these planetary encounters played a role resurfacing the body (i.e., near its neck) yielding the exposure of unweathered or fresher (bluer) material.
-
2.
Accretion: JD1 could have been formed through the accretion of heterogeneous fragments. This could be the case where the parent body of JD1 was disrupted by a compositionally different impactor or the progenitor itself possessed heterogeneity.
-
3.
Exogenous material: The recent spacecraft-visited asteroids Ryugu and Bennu revealed bright boulders spectrally distinct from the dark ones on their surfaces. Recent studies suggest that such bright boulders represent remnants of exogenous compositionally different material (Tatsumi et al., 2021; DellaGiustina et al., 2021). In the case of JD1, partial surface blanketing by exogenous material could have created a spectrally blue surface ‘patch’ covering a notable portion of its surface. In addition, our compositional analysis shows spectral similarities between JD1’s blue spectra and the aubrite ALH781113. Lipschutz et al. (1988) suggested that ALH78113 could have been a surviving fragment from an external igneous body that collided with the E-type progenitor/s. Furthermore, the exogenous material on Bennu and Ryugu made up a tiny fraction of their surfaces (¡0.1%). While the likelihood of having a significant portion of JD1’s surface contaminated by exogenous material seems very low, this hypothesis may still be plausible.
7 Conclusions
Through the combination of ground-based telescopic observations covering the visible, near-infrared, and radar wavelengths, we physically characterized the NEA 2015 JD1, finding interesting and possibly unique surface features of this small airless body. In summary, we found that JD1 has a contact binary nature with a head of 50 m and a body of m across the longest visible axis projection, or approximately between 150 and 190 m in diameter. JD1 has a high circular-polarization ratio between 1.12 to 1.52, one of the highest values measured for NEAs, and also a high total radar albedo of 0.530.01. We measured a high geometric albedo of that is consistent with an E-type taxonomy (Thomas et al., 2011). We derived a g′ - r′ color of 0.6 0.03. Our dynamical study suggests that both the resonance complex and the 3:1 resonance complex are potential escape routes for JD1. Spectral comparison suggest a compositional link between JD1 and the Angelina-like group from Clark et al. (2004).
Our rotationally-resolved spectroscopy revealed red and blue NIR spectra in the surface of JD1. Our comprehensive analysis of the observed rotational spectral variability allows us to draw the following conclusion: JD1 is likely an E-type asteroid rich in sulfides and iron with a portion of its surface that could consist of larger grain sizes and/or mineralogically richer in silicates and deficient in iron, responsible for the spectral variability observed. JD1 could be one of the first sub-km NEA to show spectral variability likely associated with an heterogeneous composition and grain sizes.
We plan to continue this investigation in order to validate spectral heterogeneity in the surface of JD1 using spectrophotometry and spectroscopy observations. The next close approach of JD1 will take place around 2023 April with a predicted -band magnitude of 19.8. The next radar apparition at a comparable distance to that in 2019 () will occur near 2058 November when JD1 is expected to have a magnitude of 15.1.
References
- Ahn et al. (2012) Ahn, C. P., Alexandro, R., Allende Prieto, C., et al. 2012, ApJS, 203, 21, doi: 10.1088/0067-0049/203/2/21
- Aponte-Hernandez et al. (2020) Aponte-Hernandez, B., Rivera-Valentín, E. G., & Taylor, P. A. 2020, in Lunar and Planetary Science Conference, Lunar and Planetary Science Conference, 2940
- Astropy Collaboration et al. (2013) Astropy Collaboration, Robitaille, T. P., Tollerud, E. J., et al. 2013, A&A, 558, A33, doi: 10.1051/0004-6361/201322068
- Bell et al. (1988) Bell, J. F., Owensby, P. D., Hawke, B. R., & Gaffey, M. J. 1988, in Lunar and Planetary Science Conference, Vol. 19, Lunar and Planetary Science Conference, 57
- Benner et al. (2008) Benner, L. A., Ostro, S. J., Magri, C., et al. 2008, Icarus, 198, 294 , doi: https://doi.org/10.1016/j.icarus.2008.06.010
- Berthier et al. (2006) Berthier, J., Vachier, F., Thuillot, W., et al. 2006, Astronomical Society of the Pacific Conference Series, Vol. 351, SkyBoT, a new VO service to identify Solar System objects, ed. C. Gabriel, C. Arviset, D. Ponz, & S. Enrique, 367
- Bertin (2006) Bertin, E. 2006, in Astronomical Society of the Pacific Conference Series, Vol. 351, Astronomical Data Analysis Software and Systems XV, ed. C. Gabriel, C. Arviset, D. Ponz, & S. Enrique, 112
- Bertin & Arnouts (1996) Bertin, E., & Arnouts, S. 1996, A&AS, 117, 393, doi: 10.1051/aas:1996164
- Binzel et al. (2001) Binzel, R. P., Harris, A. W., Bus, S. J., & Burbine, T. H. 2001, Icarus, 151, 139, doi: 10.1006/icar.2001.6613
- Binzel et al. (2019) Binzel, R. P., DeMeo, F. E., Turtelboom, E. V., et al. 2019, Icarus, 324, 41, doi: 10.1016/j.icarus.2018.12.035
- Bottke et al. (2002) Bottke, W. F., Morbidelli, A., Jedicke, R., et al. 2002, Icarus, 156, 399, doi: 10.1006/icar.2001.6788
- Bowell et al. (1989) Bowell, E., Hapke, B., Domingue, D., et al. 1989, in Asteroids II, ed. R. P. Binzel, T. Gehrels, & M. S. Matthews, 524–556
- Britt & Consolmagno (2003) Britt, D. T., & Consolmagno, G. J. 2003, Meteoritics and Planetary Science, 38, 1161, doi: 10.1111/j.1945-5100.2003.tb00305.x
- Bus & Binzel (2002) Bus, S. J., & Binzel, R. P. 2002, Icarus, 158, 106, doi: 10.1006/icar.2002.6857
- Busch et al. (2008) Busch, M. W., Benner, L. A. M., Ostro, S. J., et al. 2008, Icarus, 195, 614, doi: 10.1016/j.icarus.2008.01.020
- Castro et al. (2018) Castro, P., Payne, T., Moody, J., et al. 2018, in The Advanced Maui Optical and Space Surveillance Technologies Conference, 36
- Chambers et al. (2016) Chambers, K. C., Magnier, E. A., Metcalfe, N., et al. 2016, arXiv e-prints, arXiv:1612.05560. https://arxiv.org/abs/1612.05560
- Clark et al. (2004) Clark, B. E., Bus, S. J., Rivkin, A. S., et al. 2004, J. Geophys. Res.(Planets), 109, E02001, doi: 10.1029/2003JE002200
- Cloutis et al. (1990) Cloutis, E. A., Gaffey, M. J., Smith, D. G. W., & Lambert, R. S. J. 1990, J. Geophys. Res., 95, 8323, doi: 10.1029/JB095iB06p08323
- Cushing et al. (2004) Cushing, M. C., Vacca, W. D., & Rayner, J. T. 2004, PASP, 116, 362, doi: 10.1086/382907
- DellaGiustina et al. (2021) DellaGiustina, D. N., Kaplan, H. H., Simon, A. A., et al. 2021, Nature Astronomy, 5, 31, doi: 10.1038/s41550-020-1195-z
- DeMeo et al. (2009) DeMeo, F. E., Binzel, R. P., Slivan, S. M., & Bus, S. J. 2009, Icarus, 202, 160, doi: 10.1016/j.icarus.2009.02.005
- DeMeo & Carry (2014) DeMeo, F. E., & Carry, B. 2014, Nature, 505, 629, doi: 10.1038/nature12908
- Devogèle et al. (2018) Devogèle, M., Tanga, P., Cellino, A., et al. 2018, Icarus, 304, 31, doi: 10.1016/j.icarus.2017.12.026
- Devogèle et al. (2021) Devogèle, M., Ferrais, M., Jehin, E., et al. 2021, MNRAS, doi: 10.1093/mnras/stab1252
- Doi et al. (2010) Doi, M., Tanaka, M., Fukugita, M., et al. 2010, AJ, 139, 1628, doi: 10.1088/0004-6256/139/4/1628
- Dunham et al. (2018) Dunham, E. W., Bida, T. A., Chylek, T., et al. 2018, in Ground-based and Airborne Instrumentation for Astronomy VII, ed. C. J. Evans, L. Simard, & H. Takami, Vol. 10702, International Society for Optics and Photonics (SPIE), 1094 – 1105, doi: 10.1117/12.2313948
- Fornasier et al. (2008) Fornasier, S., Migliorini, A., Dotto, E., & Barucci, M. A. 2008, Icarus, 196, 119, doi: 10.1016/j.icarus.2008.02.015
- Fowler & Chillemi (1992) Fowler, J. W., & Chillemi, J. R. 1992, The IRAS Minor Planet Survey 17, 43, Phillips Laboratory, Hanscom AF Base, MA
- Gaffey (1976) Gaffey, M. J. 1976, J. Geophys. Res., 81, 905, doi: 10.1029/JB081i005p00905
- Gaffey (1983) Gaffey, M. J. 1983, in 14th Lunar and Planetary Science Conference, Vol. 497, 14
- Gaffey & Kelley (2004) Gaffey, M. J., & Kelley, M. S. 2004, in Lunar and Planetary Science Conference, ed. S. Mackwell & E. Stansbery, Lunar and Planetary Science Conference, 1812
- Gaia Collaboration et al. (2016) Gaia Collaboration, Prusti, T., de Bruijne, J. H. J., et al. 2016, A&A, 595, A1, doi: 10.1051/0004-6361/201629272
- Granvik et al. (2017) Granvik, M., Morbidelli, A., Vokrouhlický, D., et al. 2017, A&A, 598, A52, doi: 10.1051/0004-6361/201629252
- Granvik et al. (2018) Granvik, M., Morbidelli, A., Jedicke, R., et al. 2018, Icarus, 312, 181, doi: 10.1016/j.icarus.2018.04.018
- Gunn et al. (1998) Gunn, J. E., Carr, M., Rockosi, C., et al. 1998, AJ, 116, 3040, doi: 10.1086/300645
- Gustafsson et al. (2021) Gustafsson, A., Moskovitz, N., Cushing, M. C., et al. 2021, PASP, 133, 035001, doi: 10.1088/1538-3873/abe2f4
- Harmon et al. (1999) Harmon, J. K., Campbell, D. B., Ostro, S. J., & Nolan, M. C. 1999, Planet. Space Sci., 47, 1409, doi: 10.1016/S0032-0633(99)00068-9
- Harmon et al. (2011) Harmon, J. K., Nolan, M. C., Howell, E. S., Giorgini, J. D., & Taylor, P. A. 2011, ApJ, 734, L2, doi: 10.1088/2041-8205/734/1/L2
- Harmon et al. (2004) Harmon, J. K., Nolan, M. C., Ostro, S. J., & Campbell, D. B. 2004, in Comets II, ed. M. C. Festou, H. U. Keller, & H. A. Weaver, 265
- Harris et al. (2020) Harris, C. R., Millman, K. J., van der Walt, S. J., et al. 2020, Nature, 585, 357, doi: 10.1038/s41586-020-2649-2
- Hunter (2007) Hunter, J. D. 2007, Computing in Science and Engineering, 9, 90, doi: 10.1109/MCSE.2007.55
- Ivezić et al. (2001) Ivezić, Ž., Tabachnik, S., Rafikov, R., et al. 2001, AJ, 122, 2749, doi: 10.1086/323452
- Jedicke et al. (2015) Jedicke, R., Granvik, M., Micheli, M., et al. 2015, Surveys, Astrometric Follow-Up, and Population Statistics, 795–813, doi: 10.2458/azu_uapress_9780816532131-ch040
- Jiang et al. (2015) Jiang, Y., Ji, J., Huang, J., et al. 2015, Scientific Reports, 5, 16029, doi: 10.1038/srep16029
- Joye & Mandel (2003) Joye, W. A., & Mandel, E. 2003, Astronomical Society of the Pacific Conference Series, Vol. 295, New Features of SAOImage DS9, ed. H. E. Payne, R. I. Jedrzejewski, & R. N. Hook, 489
- Keil (2010) Keil, K. 2010, Chemie der Erde / Geochemistry, 70, 295, doi: 10.1016/j.chemer.2010.02.002
- Kimura et al. (1993) Kimura, M., Lin, Y.-T., Ikeda, Y., et al. 1993, Antarctic Meteorite Research, 6, 186
- Laher et al. (2012) Laher, R. R., Gorjian, V., Rebull, L. M., et al. 2012, PASP, 124, 737, doi: 10.1086/666883
- Larson et al. (1998) Larson, S., Brownlee, J., Hergenrother, C., & Spahr, T. 1998, in Bulletin of the American Astronomical Society, Vol. 30, 1037
- Lauretta et al. (2019) Lauretta, D. S., Dellagiustina, D. N., Bennett, C. A., et al. 2019, Nature, 568, 55, doi: 10.1038/s41586-019-1033-6
- Lazzarin et al. (2019) Lazzarin, M., Petropoulou, V., Bertini, I., et al. 2019, Planetary and Space Science, 165, 115, doi: https://doi.org/10.1016/j.pss.2018.11.006
- Lipschutz et al. (1988) Lipschutz, M. E., Verkouteren, R. M., Sears, D. W. G., et al. 1988, Geochim. Cosmochim. Acta, 52, 1835, doi: 10.1016/0016-7037(88)90007-5
- Lister et al. (2021) Lister, T. A., Gomez, E., Chatelain, J., et al. 2021, arXiv e-prints, arXiv:2102.10144. https://arxiv.org/abs/2102.10144
- Lodders et al. (1993) Lodders, K., Palme, H., & Wlotzka, F. 1993, Meteoritics, 28, 538, doi: 10.1111/j.1945-5100.1993.tb00277.x
- Lonsdale (1947) Lonsdale, J. 1947, Am. Mineral., 32, 354–364
- Luk’yanyk et al. (2019) Luk’yanyk, I., Zubko, E., Husárik, M., et al. 2019, MNRAS, 485, 4013, doi: 10.1093/mnras/stz669
- Magri et al. (2001) Magri, C., Consolmagno, G. J., Ostro, S. J., Benner, L. A. M., & Beeney, B. R. 2001, Meteoritics and Planetary Science, 36, 1697, doi: 10.1111/j.1945-5100.2001.tb01857.x
- Mainzer et al. (2011) Mainzer, A., Grav, T., Bauer, J., et al. 2011, ApJ, 743, 156, doi: 10.1088/0004-637X/743/2/156
- Marsset et al. (2019) Marsset, M., DeMeo, F., Sonka, A., et al. 2019, AJ, 882, L2, doi: 10.3847/2041-8213/ab32ee
- Masiero et al. (2014) Masiero, J. R., Grav, T., Mainzer, A. K., et al. 2014, ApJ, 791, 121, doi: 10.1088/0004-637X/791/2/121
- Masiero et al. (2021) Masiero, J. R., Wright, E., & Mainzer, A. 2021, PSJ, 2, 32, doi: 10.3847/PSJ/abda4d
- Massey et al. (2013) Massey, P., Dunham, E. W., Bida, T. A., et al. 2013, in American Astronomical Society Meeting Abstracts, Vol. 221, American Astronomical Society Meeting Abstracts #221, 345.02
- Mommert (2017) Mommert, M. 2017, Astronomy and Computing, 18, 47, doi: 10.1016/j.ascom.2016.11.002
- Naidu et al. (2020) Naidu, S., Benner, L., Brozovic, M., et al. 2020, Icarus, 348, 113777, doi: https://doi.org/10.1016/j.icarus.2020.113777
- Nathues (2010) Nathues, A. 2010, Icarus, 208, 252, doi: 10.1016/j.icarus.2010.02.011
- Neese et al. (2012) Neese, C., Benner, L. A. M., & Ostro, S. J. 2012, NASA Planetary Data System, EAR
- Nolan et al. (2013) Nolan, M. C., Magri, C., Howell, E. S., et al. 2013, Icarus, 226, 629, doi: 10.1016/j.icarus.2013.05.028
- Ochsenbein et al. (2000) Ochsenbein, F., Bauer, P., & Marcout, J. 2000, A&AS, 143, 23, doi: 10.1051/aas:2000169
- Ostro (1993) Ostro, S. J. 1993, Reviews of Modern Physics, 65, 1235, doi: 10.1103/RevModPhys.65.1235
- Ostro et al. (2004) Ostro, S. J., Benner, L. A. M., Nolan, M. C., et al. 2004, Meteoritics and Planetary Science, 39, 407, doi: 10.1111/j.1945-5100.2004.tb00102.x
- Perna et al. (2018) Perna, D., Barucci, M. A., Fulchignoni, M., et al. 2018, Planet. Space Sci., 157, 82, doi: 10.1016/j.pss.2018.03.008
- Rabinowitz (1991) Rabinowitz, D. L. 1991, AJ, 101, 1518, doi: 10.1086/115785
- Reddy et al. (2012) Reddy, V., Nathues, A., Le Corre, L., et al. 2012, Science, 336, 700, doi: 10.1126/science.1219088
- Reddy et al. (2012) Reddy, V., Sanchez, J. A., Nathues, A., et al. 2012, Icarus, 217, 153, doi: 10.1016/j.icarus.2011.10.010
- Robinson et al. (2002) Robinson, M. S., Thomas, P. C., Veverka, J., Murchie, S. L., & Wilcox, B. B. 2002, Meteoritics and Planetary Science, 37, 1651, doi: 10.1111/j.1945-5100.2002.tb01157.x
- Russell et al. (2012) Russell, C. T., Raymond, C. A., Coradini, A., et al. 2012, Science, 336, 684, doi: 10.1126/science.1219381
- Sanchez et al. (2012) Sanchez, J. A., Reddy, V., Nathues, A., et al. 2012, Icarus, 220, 36, doi: 10.1016/j.icarus.2012.04.008
- Sanchez et al. (2017) Sanchez, J. A., Reddy, V., Shepard, M. K., et al. 2017, AJ, 153, 29, doi: 10.3847/1538-3881/153/1/29
- Shepard et al. (2008a) Shepard, M. K., Clark, B. E., Nolan, M. C., et al. 2008a, Icarus, 195, 184, doi: https://doi.org/10.1016/j.icarus.2007.11.032
- Shepard et al. (2008b) Shepard, M. K., Kressler, K. M., Clark, B. E., et al. 2008b, Icarus, 195, 220, doi: https://doi.org/10.1016/j.icarus.2007.12.018
- Shepard et al. (2010) Shepard, M. K., Clark, B. E., Ockert-Bell, M., et al. 2010, Icarus, 208, 221, doi: https://doi.org/10.1016/j.icarus.2010.01.017
- Shepard et al. (2011) Shepard, M. K., Harris, A. W., Taylor, P. A., et al. 2011, Icarus, 215, 547, doi: https://doi.org/10.1016/j.icarus.2011.07.027
- Shepard et al. (2017) Shepard, M. K., Richardson, J., Taylor, P. A., et al. 2017, Icarus, 281, 388, doi: https://doi.org/10.1016/j.icarus.2016.08.011
- Stokes et al. (2000) Stokes, G. H., Evans, J. B., Viggh, H. E. M., Shelly, F. C., & Pearce, E. C. 2000, Icarus, 148, 21, doi: 10.1006/icar.2000.6493
- Sugimoto et al. (2021) Sugimoto, C., Tatsumi, E., Cho, Y., et al. 2021, Icarus, 369, 114591, doi: https://doi.org/10.1016/j.icarus.2021.114591
- Susorney et al. (2019) Susorney, H. C. M., Johnson, C. L., Barnouin, O. S., et al. 2019, Icarus, 325, 141, doi: 10.1016/j.icarus.2019.01.021
- Tatsumi et al. (2021) Tatsumi, E., Sugimoto, C., Riu, L., et al. 2021, Nature Astronomy, 5, 39, doi: 10.1038/s41550-020-1179-z
- Taylor et al. (2019) Taylor, P. A., Rivera-Valentin, E. G., Benner, L. A. M., et al. 2019, Planet. Space Sci., 167, 1, doi: 10.1016/j.pss.2019.01.009
- Tedesco (2005) Tedesco, E. F. 2005, NASA Planetary Data System, EAR
- Thomas et al. (2011) Thomas, C. A., Trilling, D. E., Emery, J. P., et al. 2011, AJ, 142, 85, doi: 10.1088/0004-6256/142/3/85
- Trilling et al. (2016) Trilling, D., Mommert, M., Hora, J., et al. 2016, NEOLegacy: The ultimate Spitzer survey of Near Earth Objects, Spitzer Proposal ID 13006
- van der Walt et al. (2011) van der Walt, S., Colbert, S. C., & Varoquaux, G. 2011, Computing in Science and Engineering, 13, 22, doi: 10.1109/MCSE.2011.37
- Virkki & Muinonen (2016) Virkki, A., & Muinonen, K. 2016, Icarus, 269, 38, doi: 10.1016/j.icarus.2016.01.011
- Virkki et al. (2014) Virkki, A., Nolan, M., Taylor, P., et al. 2014, in Asteroids, Comets, Meteors 2014, ed. K. Muinonen, A. Penttilä, M. Granvik, A. Virkki, G. Fedorets, O. Wilkman, & T. Kohout, 568
- Virtanen et al. (2020) Virtanen, P., Gommers, R., Oliphant, T. E., et al. 2020, Nature Methods, 17, 261, doi: 10.1038/s41592-019-0686-2
- Warner & Stephens (2020) Warner, B. D., & Stephens, R. D. 2020, Minor Planet Bulletin, 47, 105
- Watters & Prinz (1979) Watters, T. R., & Prinz, M. 1979, in Lunar and Planetary Science Conference, Lunar and Planetary Science Conference, 1319–1321
- Willmer (2018) Willmer, C. N. A. 2018, ApJS, 236, 47, doi: 10.3847/1538-4365/aabfdf
- Zellner et al. (1977) Zellner, B., Leake, M., Morrison, D., & Williams, J. G. 1977, Geochim. Cosmochim. Acta, 41, 1759, doi: 10.1016/0016-7037(77)90208-3
- Zellner et al. (1985) Zellner, B., Tholen, D. J., & Tedesco, E. F. 1985, Icarus, 61, 355, doi: 10.1016/0019-1035(85)90133-2