Surface-directed and bulk spinodal decomposition compete to decide the morphology of bimetallic nanoparticles
Abstract
An embedded-domain phase-field formalism is used for studying phase transformation pathways in bimetallic nanoparticles (BNPs). Competition of bulk and surface-directed spinodal decomposition processes and their interplay with capillarity are identified as the main determinants of BNP morphology. The former is characterized by an effective bulk driving force which increases with decreasing temperature, while the latter manifests itself through a balance of interfacial energies captured by the contact angle . The simulated morphologies, namely, core-shell, Janus and inverse core-shell, cluster into distinct regions of the - space. Variation of with in the Ag-Cu alloy system is computed as a function of temperature using a CALPHAD approach in which surface energies are estimated from a modified Butler equation. This trajectory for Ag-Cu, when superimposed on the morphology map, enables the prediction of different morphological transitions as a function of temperature. Therefore, the study establishes a unique thermodynamic framework coupled with phase-field simulations for predicting and tailoring nanoparticle morphology through a variation of processing temperature.
Introduction
Properties of bimetallic nanoparticles (BNPs) used in diverse fields such as catalysis, photonics, spintronics and biomedical-sensing [1, 2, 3] depend crucially on their morphology. Core-shell (CS) and Janus are the most commonly reported morphologies: CS morphology consists of an outer shell of the lower surface energy component surrounding a core of the other component, while Janus is characterized by the two components forming two opposite faces of a particle with their common interface extending to the surface. An inverse core-shell (ICS) morphology, where the higher surface energy component forms the shell, has also been observed in a few cases [4, 5].
A fundamental understanding of morphological development in BNPs is crucial for tailoring their properties. First principles [6] and atomistic [7] simulations, as well as classical thermodynamics [8] have been employed to find the lowest energy morphology of BNPs. However, these approaches generally do not address kinetic aspects of morphological development. Since many commonly used BNP systems like Ag-Cu, Ag-Ni, Au-Co, Co-Cu, etc. exhibit solid-state immiscibility, spinodal decomposition (SD) presents a likely kinetic pathway for morphology development in BNPs [9].
Phase-field models have been employed very successfully for studying microstructure development in bulk immiscible systems systems using the Fourier spectral method [10]. For finite systems with complex geometries, embedding the system of interest in a larger computational domain has proven to be an effective strategy for dealing with the non-periodicity of the domain of interest [11, 12, 13, 14]. In addition to Dirichlet, Neumann and Robin boundary conditions, Yu et al. developed a methodology [13] to impose a contact angle boundary condition for studying phase transformations in contact with an external surface. However, if one wishes to capture the in situ development of three-phase contacts (or their absence) on the surface, a different approach involving a modification of the system’s free energy can be adopted.
Recently, we presented such an embedded-domain phase-field model (EPFM) [15] using which correct contact angles could be naturally recovered without imposing them directly through boundary conditions. This model was was used to understand how contact angle and particle size influenced the morphology development in BNPs. However, the role of temperature, which is an important parameter from a processing perspective, on BNP morphology was not addressed. Temperature, or equivalently, undercooling below a critical temperature, can exert a strong influence on the phase separation process by altering the driving force for bulk SD. In addition, in confined systems such as BNPs, surface directed SD (SDSD) presents another mode of microstructural evolution which may also be influenced by temperature through its effect on surface and interfacial energies. Interplay between these two alternative mechanisms and their interactions with capillarity give rise to different BNP morphologies. In this paper, we use EPFM to systematically investigate this process, and by carrying out further thermodynamic computations, identify the relevant physical parameter groups that can be used to understand and predict morphology selection in BNPs as a function of temperature.
Model Formulation
In the EPFM formalism [15] illustrated schematically in Fig. 1, a BNP system consisting of atomic species A and B is modeled by placing an isolated particle () in an inert matrix (). A scaled composition field describes phase separation of an initially homogeneous to a mixture of and phases with equilibrium compositions and , respectively. We use for the scaling where denotes the mole fraction of B and is the equilibrium composition of phase at a given temperature. An auxiliary non-conserved phase-field variable is used to distinguish the particle from the matrix; we use a stationary and radially symmetric tanh profile for that varies smoothly across the particle surface from 0 in the matrix side to 1 inside the particle [15]. Total free energy of the system is then expressed as:
| (1) |
where is the molar volume, is bulk free energy density, and are gradient energy coefficients associated with and , respectively, and is the volume of the whole computational domain.
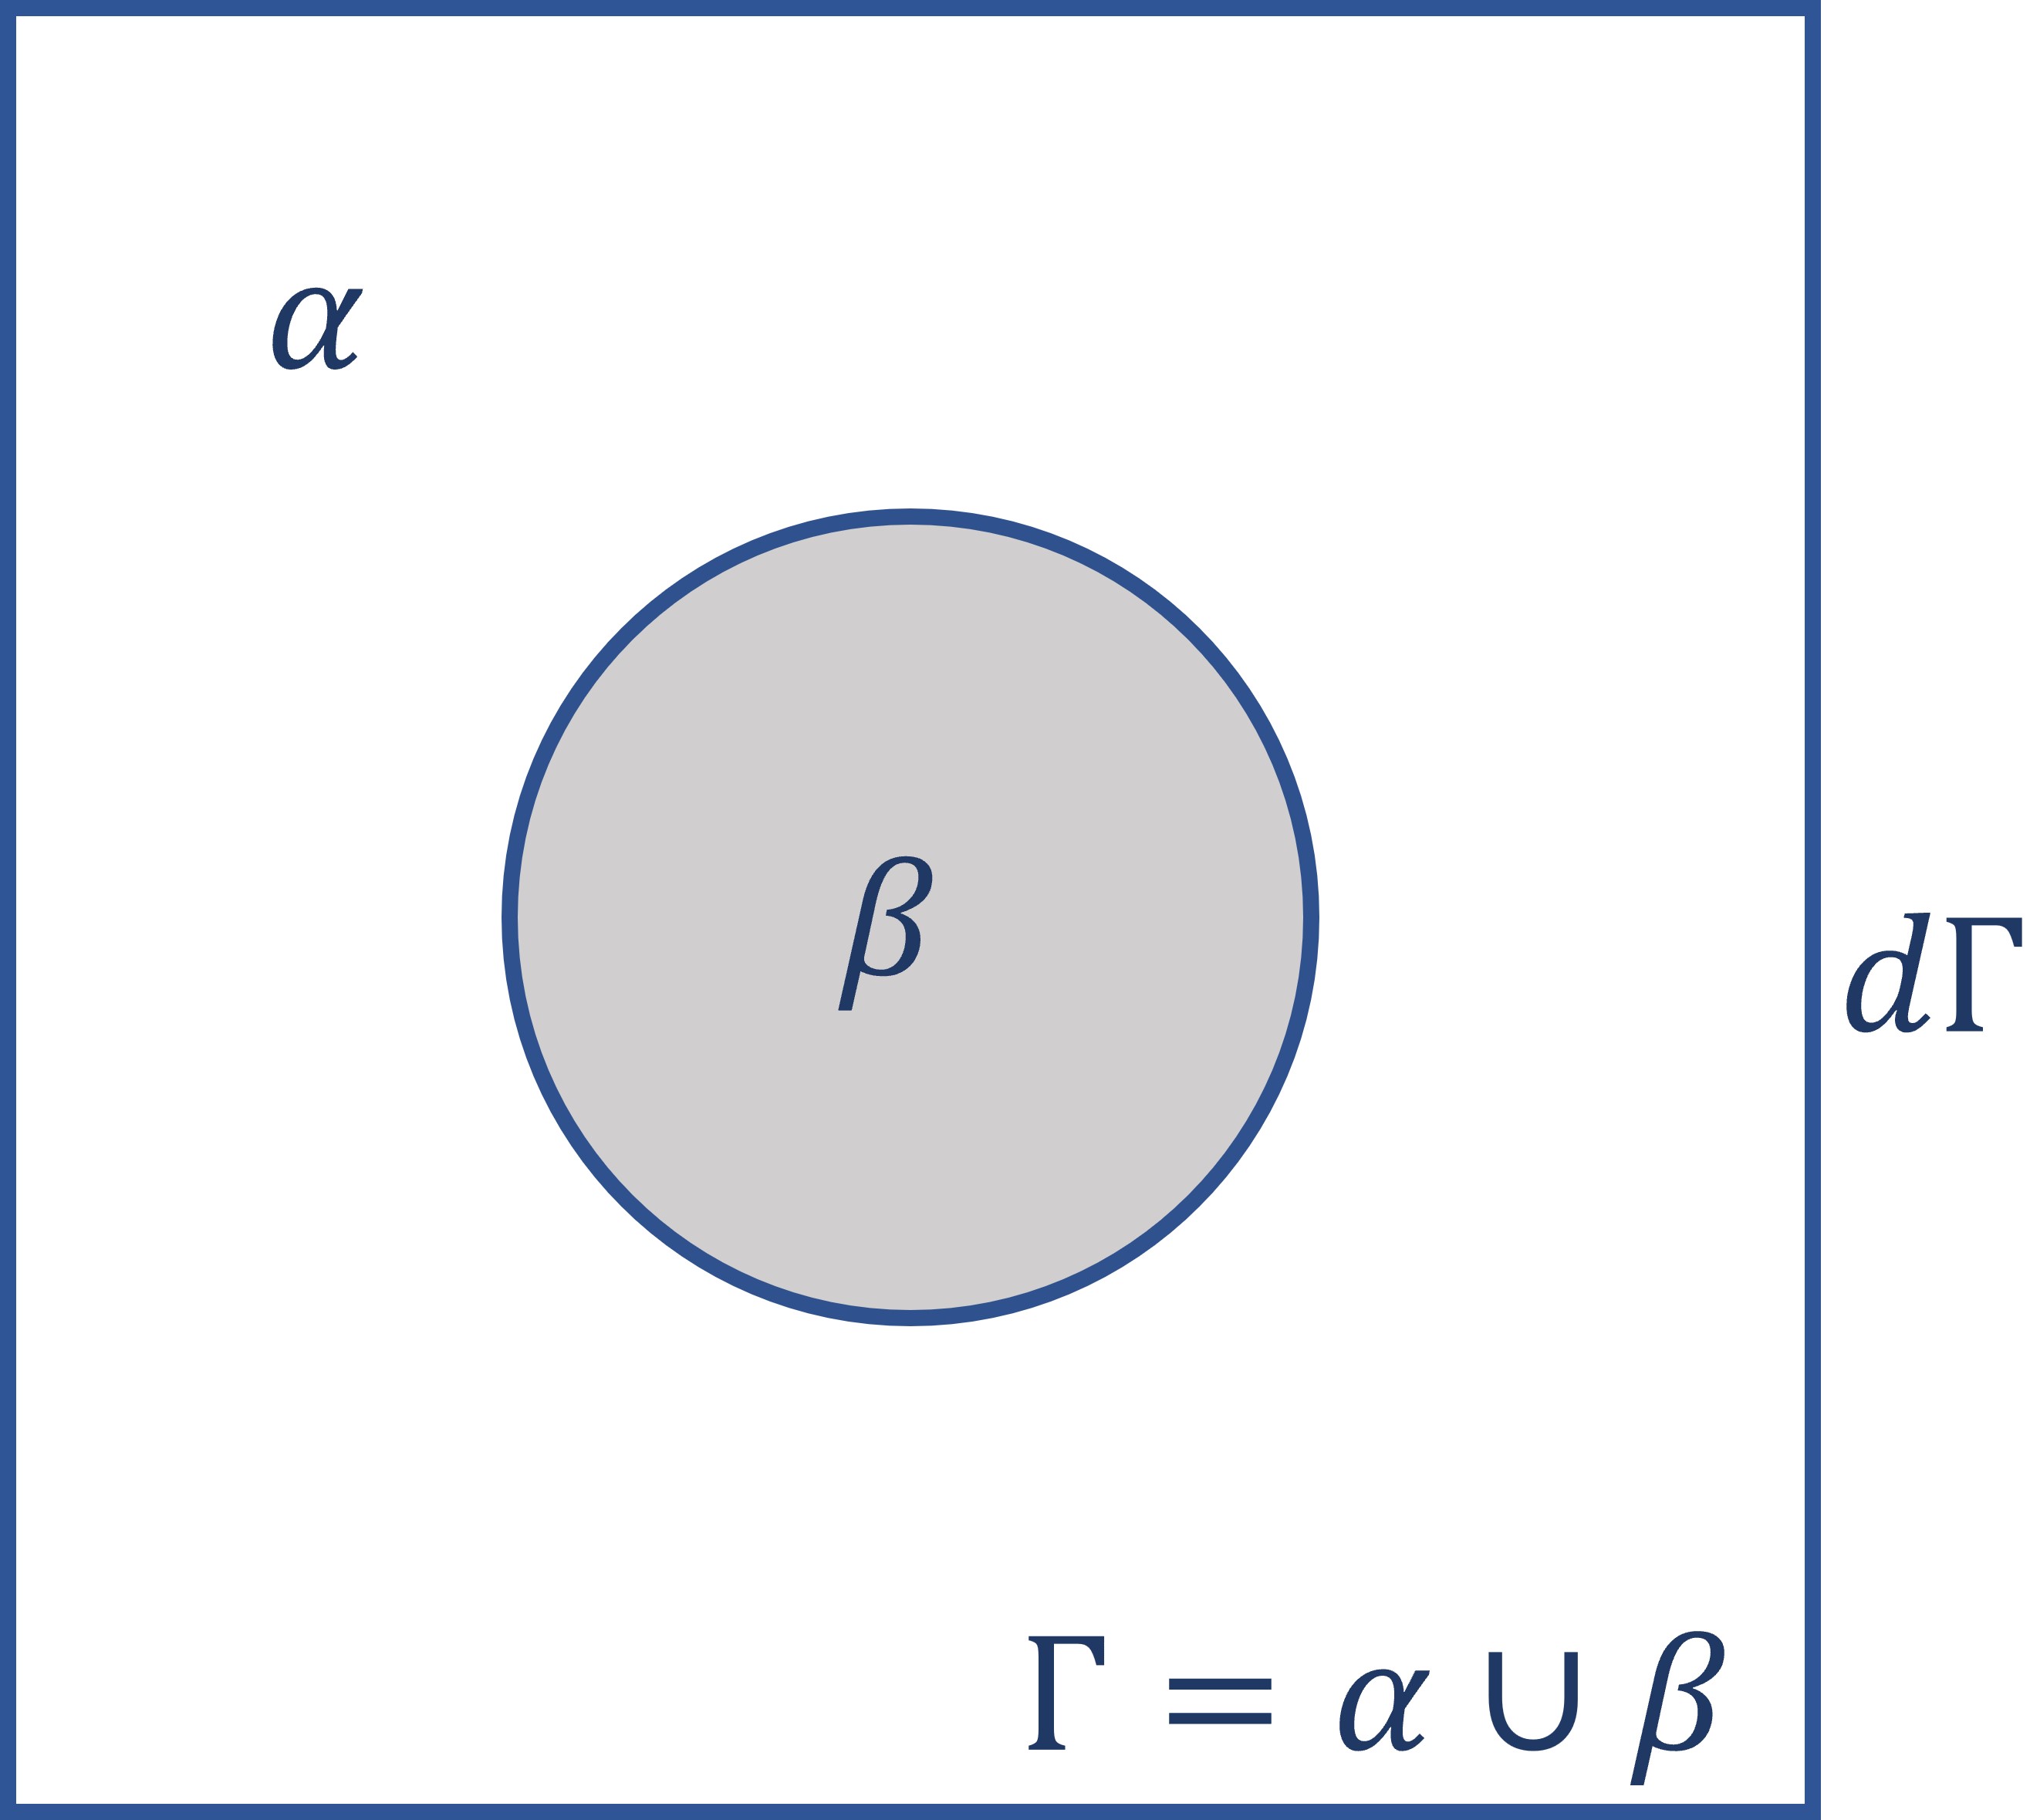
Defining an interpolating function that connects and (with being 0 and 1 inside and , respectively), the bulk free energy density is given as . Here describes the free energy barrier between and , sets the barrier height and controls solute segregation at the particle-matrix interface [15]. We use the following forms of free energy for and :
| (2) |
The scaled equilibrium compositions are chosen to be 0.5, 0 and 1, respectively, and and are temperature-dependent constants. Evolution of composition field within the particle is described by the Cahn-Hilliard equation:
| (3) |
We constrain the matrix to remain inert with respect to solute diffusion by choosing , with being the effective atomic mobility of solute in the particle. Eq. (3) is solved numerically using a semi-implicit Fourier spectral method [16, 17, 18]. We non-dimensionalize all parameters in the equations using characteristic length , time and energy . Details of the non-dimensionalization procedure are provided Supplementary Information A; further details of the model and its numerical implementation can be found elsewhere [15].
Energies of -, - and - interfaces, designated as and , are obtained from the equilibrium composition profiles across the respective interfaces:
| (4) |
where denotes the equilibrium chemical potential of component in any one the coexisting phases across the interface.
The surface and interfacial energies define the contact angle at the triple junction between the phases as:
| (5) |
Phase transformations within the particle need not always yield triple junctions at the surface. Cahn, in his classic paper on “Critical Point Wetting”, described a condition that precluded the formation of a triple junction. He defined this spontaneous wetting condition to be ; the equality condition corresponds to , while become undefined for the inequality condition. In the latter case, the phase with the low surface energy develops a continuous layer on the surface.
Non-zero leads to preferential solute segregation to one of the surfaces by creating imbalance between the ‘surface’ energies and – its key role on BNP morphology has already been explored in detail [15]. Here, we keep and particle size fixed, and investigate the competition of bulk SD and SDSD in deciding the BNP morphology (CS, ICS and Janus) by varying , and . Note that these variable also control . Since each of these parameter combinations gives rise to one of these three morphologies, we performed simulations over a large set of parameters and classified the results in terms of driving force and contact angle.
Results and Discussion
.1 Simulation of BNP morphologies
All simulations begin with an initially homogeneous, axisymmetric particle with composition quenched inside the miscibility gap. A small initial noise () mimicking thermal fluctuations is applied to trigger bulk SD. Figs. 2 and 3 present time snapshots of evolution of stable and metastable morphologies corresponding to representative parameter sets listed in Table 1. In these figures, green color represents the solute-poor phase, blue the solute-rich phase, and grey the undecomposed with .
| Set | Figure no. | |||||||
|---|---|---|---|---|---|---|---|---|
| 1 | 8 | 1 | 12 | 4.19 | 3.09 | 0.94 | wetting | 2(a)-2(e) |
| 2 | 6 | 2 | 3.75 | 1.77 | 1.44 | 1.15 | 2(f)-2(j) | |
| 3 | 4 | 1 | 6 | 2.21 | 1.76 | 0.67 | 3(a)-3(e) | |
| 4 | 2 | 8 | 6 | 2.24 | 1.86 | 1.33 | 3(f)-3(j) | |
| 5 | 4 | 2 | 5 | 1.98 | 1.60 | 0.94 | 3(k)-3(o) |
In all cases, SDSD precedes bulk-SD and forms alternate solute-rich and solute-lean rings which grow inward. When bulk SD starts in the interior of the particle, it creates intertwined compositionally modulated domains that interact with the rings growing from the surface to the center. Depending on the chosen parameter set, domain coarsening proceeds along different pathways to produce the final BNP configuration. A Janus structure is formed when coarsening disrupts the continuity of ring-like structures at the surface, and CS or ICS results otherwise.
Figs. 2(a-e) is an example of a typical evolution pattern leading to a stable CS morphology (set 1 of Table 1). It occurs irrespective of the driving force if the spontaneous wetting condition is satisfied (i.e., ). For large , if bulk driving force is sufficiently high to break the outermost layer, we obtain stable Janus morphology. A typical sequence of its formation is presented in Figs. 2(f-j) which corresponds to parameter set 2 of Table 1.
Parameter sets 3-5 of Table 1 correspond to intermediate values of driving force (which scales with ) and which result in metastable configurations shown in Figure 3. For example, Figs. 3(a-e) shows how a CS morphology can develop for small non-zero ’s if the driving force for bulk spinodal is also small. Thus, the spontaneous wetting condition is only a sufficient condition – stable CS forms when it is satisfied, but a metastable CS can develop even when it is not.
On the other hand, one obtains a metastable ICS morphology when the driving force is small but is large, as demonstrated by the typical evolution patterns in Figs. 3(f-j) and Figs. 3(k-o). When surface effects dominate over the bulk, an onion-like ring structure develops initially (Figs. 3(a)-3(b)), which coarsens subsequently (Figs. 3(a-e)) to form a metastable ICS morphology. It is also possible that we get metastable ICS/CS even in the presence of bulk spinodal. As shown in Figs. 3(f-o), the bulk driving force in this case is not sufficiently high enough to achieve a stable Janus configuration, and domain coarsening leads to an ICS configuration. Between the two evolutionary paths to ICS, the latter is observed when the driving force is higher.
As shown in Fig. 4, however, the CS at non-zero and ICS configurations are metastable, as they relax to more stable structures when subjected to a sustained white noise [19]. Here the initial configurations for the simulations are the final metastable ones shown in Fig. 3. With increasing time, the concentric structures break down and evolve to form Janus. The time taken for the metastable-to-stable morphological transition is very large because the difference of the energies between the metastable (CS/ICS) and stable (Janus) configuration is very small, resulting in very sluggish diffusion. Therefore, these can be termed as kinetically trapped configurations [20, 21, 15].
To understand the formation of different morphologies as a function of the model parameter sets, one needs to relate the competing processes of bulk SD and SDSD. For bulk SD, sets the driving force , defined as the difference between the free energy of non-equilibrium initial state and that of the final state made up of equal parts of equilibrium and phases:
| (6) |
, together with , also determines the interfacial energy of the system as [22]:
| (7) |
Both and increase with decreasing (or increasing undercooling ).
The surface energies and , and their difference , on the other hand, scale with the height of the free energy barrier . While controls bulk SD within the particle, influences SDSD by defining – the larger the , the easier it is to initiate SDSD. We now define a normalized driving force for bulk phase separation, , by taking the ratio of to .
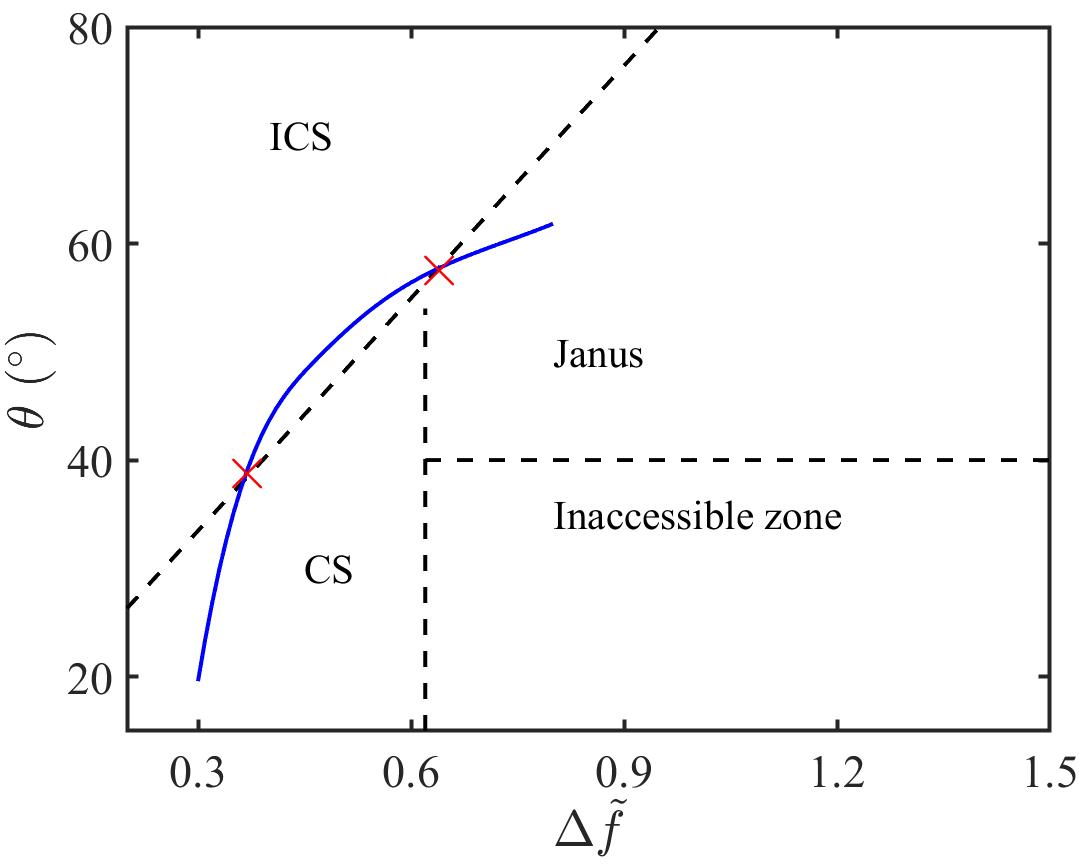
Fig. 5 presents the essence of all simulations by assigning the location of BNP configuration in the space of model parameters and . The map clearly demarcates three distinct regions in this space: high -high for Janus, low -high for ICS, and the intervening region for CS. The region of high -low is physically inaccessible since high implies either high or low , which increases or decreases , respectively, and thereby lead to high .
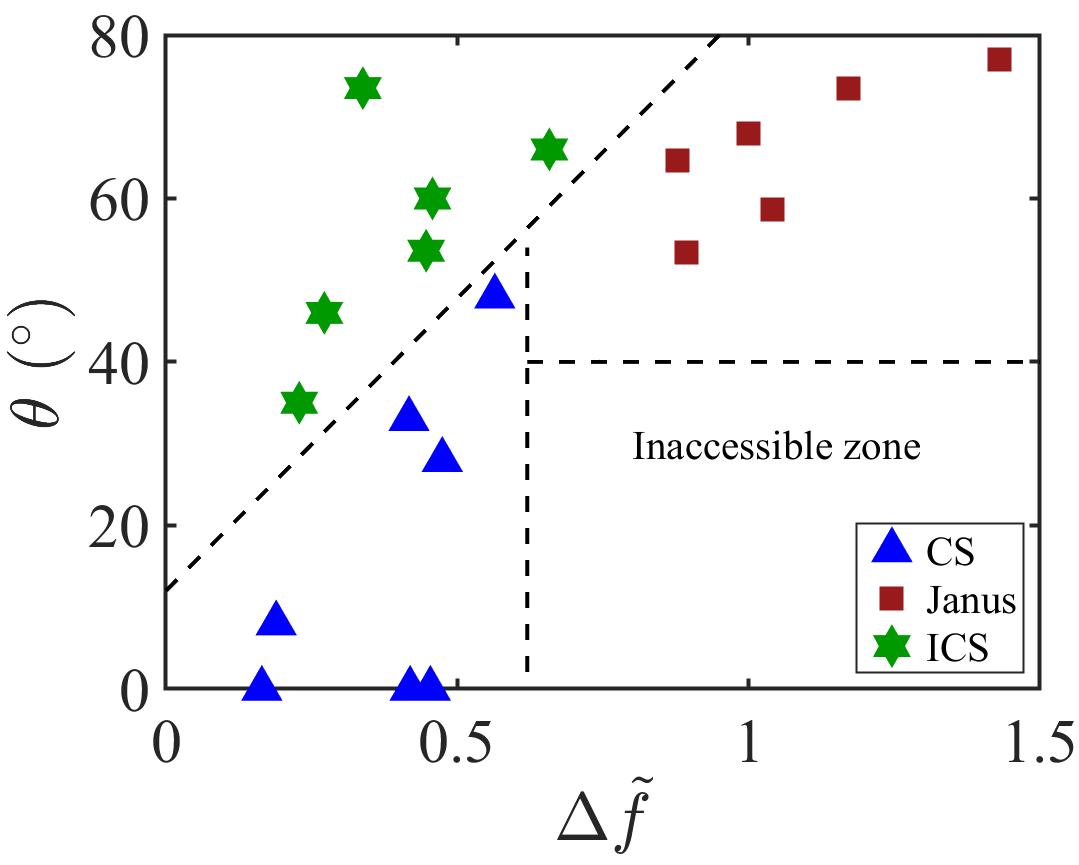
When the spontaneous wetting condition is satisfied ( or undefined), CS is the final configuration irrespective of . Also, for a given , a metastable CS configuration is preferred over ICS at larger . At lower , SDSD creates alternate concentric rings extending towards the center, with segregation giving rise to an outermost ring [15]. Subsequently, ring-coarsening leads to the ICS structure. In contrast, bulk SD dominates at higher , resulting in interactions between inner interconnected domains and the outermost ring during coarsening. Subsequently, the latter is replaced by , leading to metastable CS. Note that these interactions do not yield the stable Janus configuration, because, in this case, remains sufficiently large to cause to preferentially spread along the surface and to recede.
.2 Computation of chemical and capillary forces for Ag-Cu
Fig. 5 demonstrated how different morphologies clustered around in distinct regions of the driving force – contact angle space. This space essentially represents the interplay of chemical and capillary forces, and temperature is one of the key physical parameters that directly or indirectly controls them. The chemical driving force for phase separation, , for a given system can be obtained as a function of temperature in a relatively straightforward way from its CALPAHD data. Capillarity, on the other hand, is manifested through the contact angle , which itself is defined in terms of interfacial and surface energies (). Reliable values of the latter as a function of temperature are often difficult to measure experimentally. Nevertheless, here we attempt to arrive at fair estimates of these energies using the available data and thermodynamic correlations. We consider the Ag-Cu system as an example and proceed to compute the temperature dependence of these quantities.
.2.1 Driving force for phase separation
The molar bulk free energy of the Cu-Ag solid solution can be expressed through a Redlich-Kister polynomial as:
| (8) |
where ’s ( Cu, Ag) are the mole fractions component in the solution. The first bracketed group in the right hand side is the mixture free energy contribution with ’s being the standard free energies of the pure components which can be found in the SGTE database [23]. The second group is the contribution from the ideal solution part of free energy () and the last term represents the excess contribution (). The temperature-dependent interaction parameters for the Cu-Ag solid solution are given as and [24].
Equilibrium solute mole fractions in Cu-rich and Ag-rich solid solutions below the critical temperature are computed using the conditions for chemical equilibrium:
| (9) |
where the chemical potentials evaluated at equilibrium bulk compositions are given by
| (10) |
The free energy of mixing for an alloy composition is expressed as
| (11) |
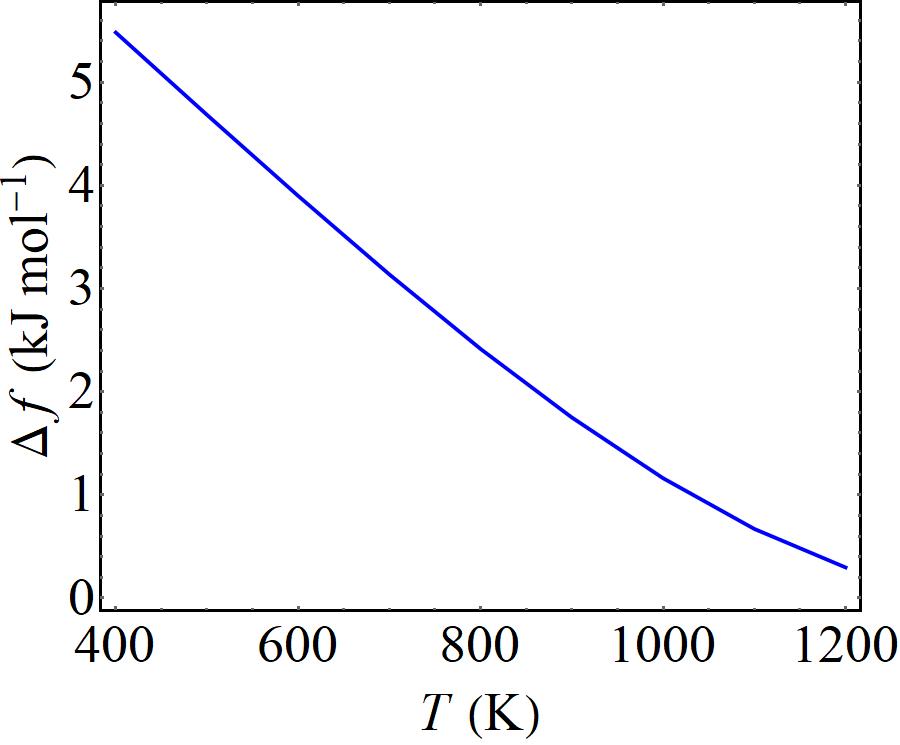
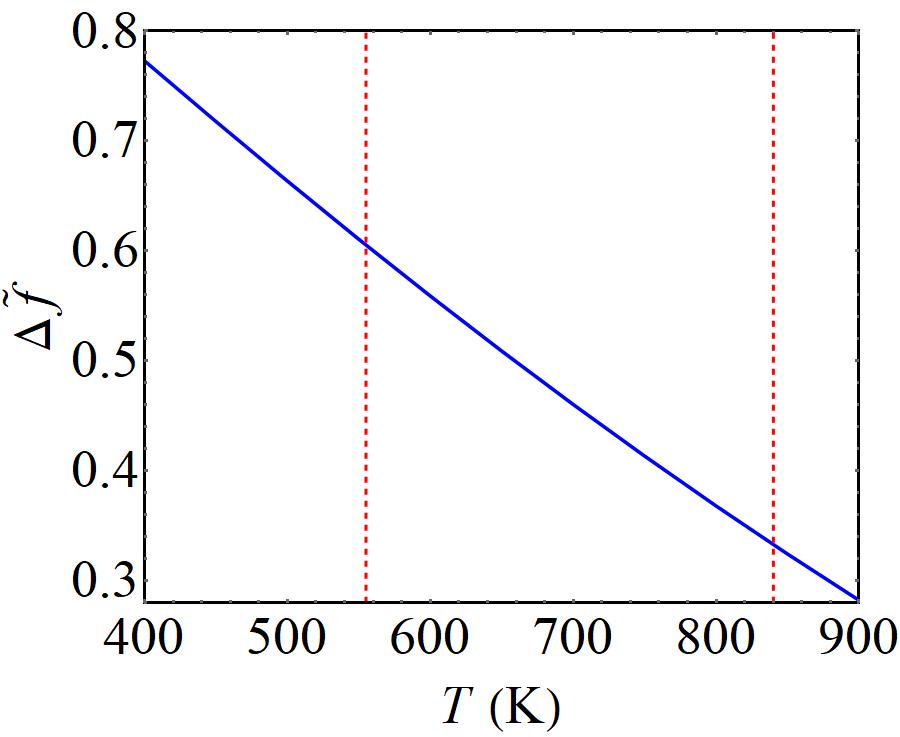
The driving force for bulk spinodal, , is the maximum value of over the entire composition range (i.e., maximum of the curve). It is evaluated and plotted in Fig. 6(a) for the temperature range of 400-800 K. The plot shows that decreases monotonically with increasing temperature. Using the same thermodynamic data, we also compute the equilibrium mole fractions () in both Cu- and Ag-rich solutions which are required for estimating the interfacial energy.
.2.2 Interfacial energy
The temperature dependence of the interfacial energy between the Cu- and Ag-rich solid solutions () can be computed using Eq. (7). To be able to do so, however, one requires the value of . We utilize the value of at 800 K obtained from molecular dynamics simulations [7], along with the values of and at this temperature calculated in the previous step, and a constant molar volume of , to compute . Since is generally considered to be temperature-independent for a given system, we use this constant value in Eq. (7) to compute in the temperature range of 400-1200 K.
.2.3 Surface energies
We calculate surface energies of the Cu-rich and Ag-rich solid solutions as a function of temperature using a modified Butler model [25]:
| (12) |
Here, denote the components Cu and Ag, respectively, are the surface energies of the pure components, are the molar surface areas, are the surface compositions at , and are the excess partial molar free energies of associated with surface and bulk, respectively.
Surface energies of the pure components Eq. (12) are obtained from the correlation
| (13) |
where is the surface tension of liquid component at its melting point and the temperature coefficient of surface energy is taken as . The partial molar excess free energies for bulk, , can be expressed in terms of using Eq. (10), with excess free energy replacing the total molar free energy . Following Tanaka and Hara [25], we take . The parameter is the ratio of coordination number in the surface to that in the bulk; it is taken as for face centered cubic solid solutions. Molar surface areas of the pure components are obtained using the relation where is the Avogadro’s number. Eq. (12) constitutes a set of two simultaneous non-linear algebraic equations which can now be solved numerically to obtain the unknown surface composition for both the terminal phases. Plugging its values in Eq. (10), one can compute the surface energies of the Cu- and Ag-rich solution phases.
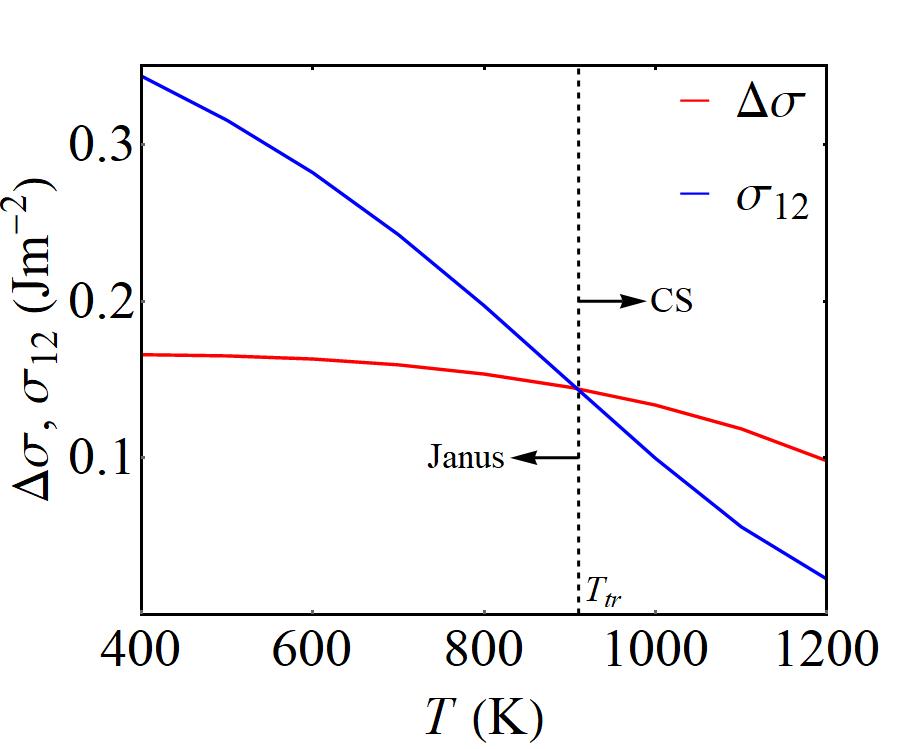
Fig. 6(b) plots the difference of the surface energies, , and the interfacial energy, , with temperature. It shows that although the surface energies themselves vary with temperature, their difference is relatively insensitive to it, changing only slightly at higher temperatures. The interfacial energy, on the other hand, depends strongly with temperature, decreasing steeply at higher temperatures. This is expected, as it must vanish at the critical temperature for the miscibility gap. In terms of the spontaneous wetting criterion (Eq. (5)), temperature of intersection of surface and interfacial energy lines, ( 910 K) marks the transition from stable CS to Janus morphologies.
.3 Connecting phase-field results with thermodynamic computations
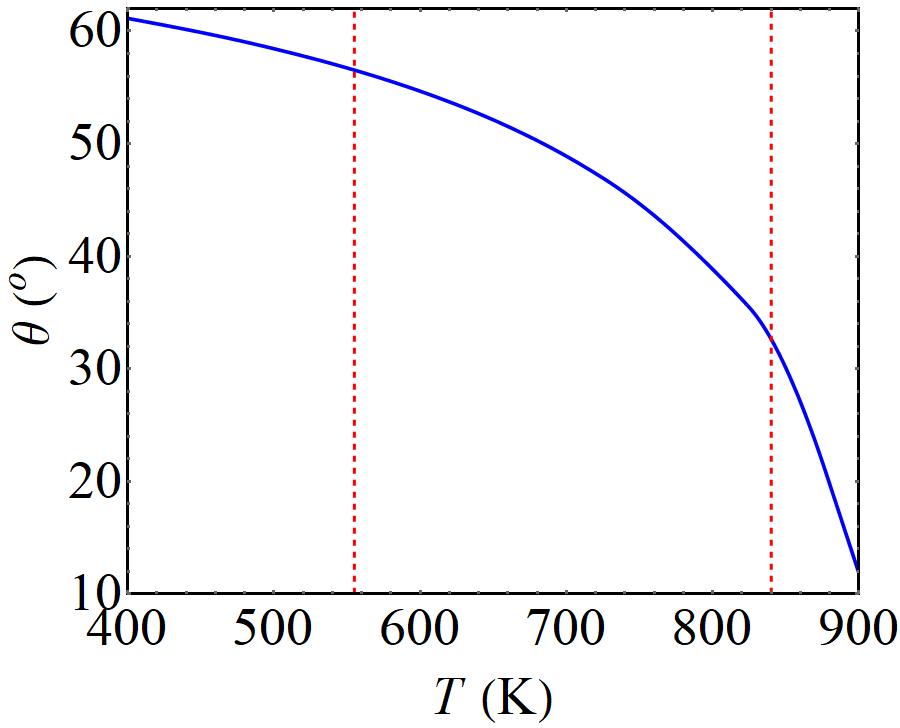
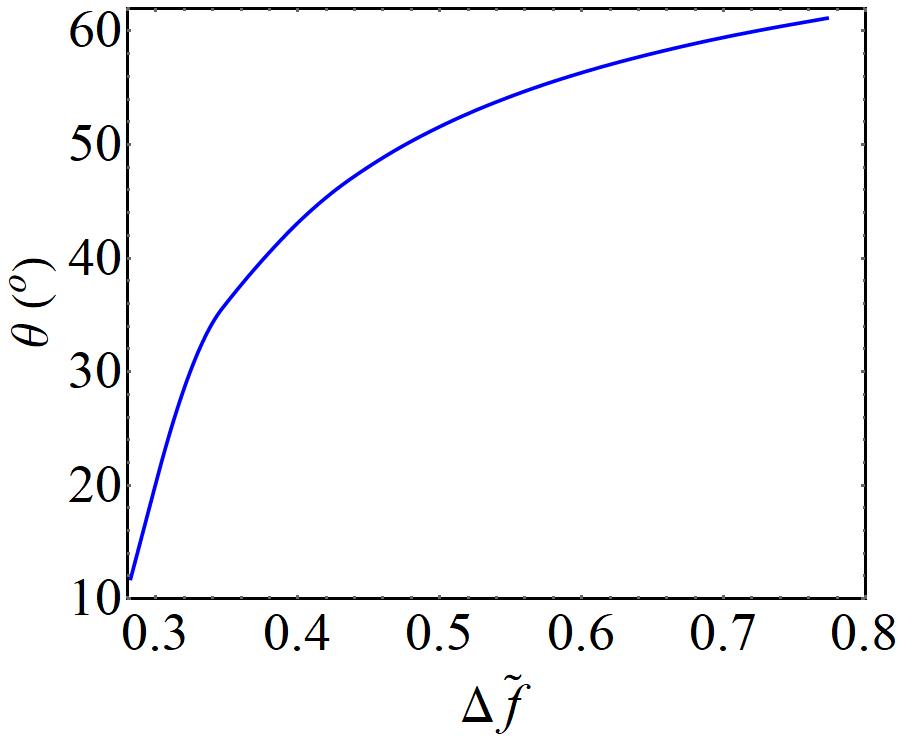
We proceed further to obtain a correlation between the effective driving force and , noting that the latter is defined only for . First, the bulk driving force (in J/mol) for phase separation in Ag-Cu is normalized by the product of surface energy difference (in J/m2) and molar surface area (in m2/mol). Fig. 7(a) shows the temperature dependence of estimated this way, it is very similar to the variation of with shown in Fig. 6(a). Next, the interfacial and surface energies computed earlier are used to determine how contact angle varies as a function of temperature. This is presented in Fig. 7(b), which shows that at high temperatures, decreases steeply with decrease in temperature, but the rate of this decrease reduces at lower temperatures. Finally, these variations are combined into a single - plot in Fig. 7(c). It shows a monotonic increase of with ; however, the slope of the curve is steeper at low-, gradually becoming gentler with increase in (i.e., decrease in ). This line is the trajectory that the system follows in the - space as temperature is reduced, and therefore captures its response to a change in the state variable . This trajectory is now superimposed on the morphology map which is redrawn in Fig. 7(d). It predicts the morphological transitions in Ag-Cu for : both and increase with decreasing temperature, and the system moves from a metastable CS to metastable ICS configuration, before finally transitioning into the Janus regime. Thus, depending on the processing conditions, all the three configurations can form in Ag-Cu BNPs, as confirmed by the experimentally observed configurations [5, 26].
Since the temperature dependence of bulk chemical and capillary forces are system specific, it should be noted that the trajectory may not always pass through the metastable ICS region of the map for all alloy systems. However, the insights gained from the study remains valid and provide crucial guidelines and understanding for conducting further experiments aimed at tailoring the BNP morphology.
I Conclusions
Results of the present study show how different BNP morphologies can emerge from a competition between two alternative and concomitant mechanisms, namely, bulk and surface-directed spinodal decomposition. Their interplay with capillarity sets up the eventual coarsening pathway toward a steady-state configuration. When we express the results in terms of three physical parameters, namely, driving force, difference in surface energies and contact angle, different morphologies automatically cluster into three distinct regions in the space. This identification of relevant physical parameters appears remarkable, as the computed thermodynamic trajectory for Ag-Cu involving the same variables traverses all the three distinct regions revealing the morphological transitions. We note that morphological transitions for a particular alloy system are sensitive to the nature of temperature-dependence of the relevant variables. Therefore, the exact transition points for different alloys systems will be different.
The following specific conclusions can be drawn from the study:
-
1.
Irrespective of the driving force for bulk spinodal, stable CS forms when the spontaneous wetting condition is satisfied (). This happens at .
-
2.
A combination of low driving force and high contact angle gives rise to metastable ICS, while metastable CS forms at moderate driving force and lower non-zero . Thus, the spontaneous wetting condition given by Cahn is found to be a sufficient, but not a necessary condition for the formation of CS.
-
3.
Janus forms when both bulk driving force and contact angle are large.
-
4.
Trajectory of Ag-Cu in the driving force-contact angle space shows transitions involving CS, ICS and Janus morphologies as a function of temperature.
Conflict of Interest
The authors have no conflicts to disclose.
Acknowledgement
Authors gratefully acknowledge the computational support from DST-NSM Grant DST/NSM/R&D-HPC-Applications/2021/03.
References
- Ferrando [2016] R. Ferrando, Structure and Properties of Nanoalloys (Elsevier, 2016).
- Cortie and McDonagh [2011] M. B. Cortie and A. M. McDonagh, Synthesis and optical properties of hybrid and alloy plasmonic nanoparticles, Chemical Reviews 111, 3713 (2011).
- Medina-Cruz et al. [2020] D. Medina-Cruz, B. Saleh, A. Vernet-Crua, A. Nieto-Argüello, D. Lomelí-Marroquín, L. Y. Vélez-Escamilla, J. L. Cholula-Díaz, J. M. García-Martín, and T. Webster, Bimetallic nanoparticles for biomedical applications: A review, in Racing for the Surface: Antimicrobial and Interface Tissue Engineering, edited by B. Li, T. F. Moriarty, T. Webster, and M. Xing (Springer International Publishing, Cham, 2020) pp. 397–434.
- Tsuji et al. [2010] M. Tsuji, S. Hikino, R. Tanabe, and D. Yamaguchi, Synthesis of Ag@Cu core–shell nanoparticles in high yield using a polyol method, Chemistry Letters 39, 334 (2010).
- Nakamura et al. [2007] T. Nakamura, Y. Tsukahara, T. Yamauchi, T. Sakata, H. Mori, and Y. Wada, Preparation of Ag core–Cu shell nanoparticles by microwave-assisted alcohol reduction process, Chemistry Letters 36, 154 (2007).
- Ferrando [2015] R. Ferrando, Symmetry breaking and morphological instabilities in core-shell metallic nanoparticles, Journal of Physics Condensed Matter 27, 13003 (2015).
- Chandross [2014] M. Chandross, Energetics of the formation of Cu–Ag core–shell nanoparticles, Modelling and Simulation in Materials Science and Engineering 22, 075012 (2014).
- Yuan et al. [2008] C. W. Yuan, S. J. Shin, C. Y. Liao, J. Guzman, P. R. Stone, M. Watanabe, J. W. Ager, E. E. Haller, and D. C. Chrzan, Structure map for embedded binary alloy nanocrystals, Applied Physics Letters 93, 193114 (2008).
- Radnóczi et al. [2017] G. Radnóczi, E. Bokányi, Z. Erdélyi, and F. Misják, Size dependent spinodal decomposition in Cu-Ag nanoparticles, Acta Materialia 123, 82 (2017).
- Chen and Shen [1998] L. Chen and J. Shen, Applications of semi-implicit fourier-spectral method to phase field equations, Computer Physics Communications 108, 147 (1998).
- Bueno-Orovio et al. [2006] A. Bueno-Orovio, V. M. Pérez-García, and F. H. Fenton, Spectral methods for partial differential equations in irregular domains: The spectral smoothed boundary method, SIAM Journal on Scientific Computing 28, 886 (2006).
- X. Li et al. [2009] X. Li, J. Lowengrub, A. R Ratz, and A. Voigt, Solving pdes in complex geometries, Communications in Mathematical Sciences 7, 81 (2009).
- Yu et al. [2012] H. C. Yu, H. Y. Chen, and K. Thornton, Extended smoothed boundary method for solving partial differential equations with general boundary conditions on complex boundaries, Modelling and Simulation in Materials Science and Engineering 20, 075008 (2012).
- Poulsen and Voorhees [2016] S. Poulsen and P. Voorhees, Early stage phase separation in ternary alloys: A test of continuum simulations, Acta Materialia 113, 98 (2016).
- Pankaj et al. [2022] P. Pankaj, S. Bhattacharyya, and S. Chatterjee, Competition of core-shell and Janus morphology in bimetallic nanoparticles: Insights from a phase-field model, Acta Materialia 233, 117933 (2022).
- Cogswell and Carter [2011] D. A. Cogswell and W. C. Carter, Thermodynamic phase-field model for microstructure with multiple components and phases: The possibility of metastable phases, Physical Review E 83, 061602 (2011).
- Cogswell [2010] D. A. Cogswell, A phase-field study of ternary multiphase microstructures, Ph.D. thesis, Massachusetts Institute of Technology (2010).
- Zhu et al. [1999] J. Zhu, L.-Q. Chen, J. Shen, and V. Tikare, Coarsening kinetics from a variable-mobility Cahn-Hilliard equation: Application of a semi-implicit Fourier spectral method, Physical Review E 60, 3564 (1999).
- Cook [1970] H. Cook, Brownian motion in spinodal decomposition, Acta Metallurgica 18, 297 (1970).
- Li et al. [2019] L. Li, X. Li, Z. Duan, R. J. Meyer, R. Carr, S. Raman, L. Koziol, and G. Henkelman, Adaptive Kinetic Monte Carlo simulations of surface segregation in PdAu nanoparticles, Nanoscale 11, 10524 (2019).
- Grammatikopoulos et al. [2016] P. Grammatikopoulos, J. Kioseoglou, A. Galea, J. Vernieres, M. Benelmekki, R. E. Diaz, and M. Sowwan, Kinetic trapping through coalescence and the formation of patterned Ag–Cu nanoparticles, Nanoscale 8, 9780 (2016).
- Haider et al. [2007] F. Haider, R. Kozubski, and T. Abinandanan, Simulation techniques, in Alloy Physics (John Wiley & Sons, Ltd, 2007) Chap. 12, pp. 653–706.
- Dinsdale [1991] A. Dinsdale, SGTE data for pure elements, Calphad 15, 317 (1991).
- Subramanian and Perepezko [1993] P. Subramanian and J. Perepezko, The Ag-Cu (silver-copper) system, Journal of Phase Equilibria 14, 62 (1993).
- Tanaka and Hara [2001] T. Tanaka and S. Hara, Thermodynamic evolution of nanoparticle binary alloy phase diagrams, Zeitschrift fuer Metallkunde/Materials Research and Advanced Techniques 92, 1236 (2001).
- Malviya and Chattopadhyay [2014] K. D. Malviya and K. Chattopadhyay, Synthesis and mechanism of composition and size dependent morphology selection in nanoparticles of Ag–Cu alloys processed by laser ablation under liquid medium, The Journal of Physical Chemistry C 118, 13228 (2014).
- C.P. Wang et al. [2012] C.P. Wang, L.N. Yan, J.J. Han, and X.J. Liu, Diffusion mobilities in the fcc Ag–Cu and Ag–Pd alloys, Calphad 37, 57 (2012).
- Cahn [1961] J. W. Cahn, On spinodal decomposition, Acta Metallurgica 9, 795 (1961).
- Cahn [1977] J. W. Cahn, Critical point wetting, The Journal of Chemical Physics 66, 3667 (1977).
Appendix: Non-dimensionalization procedure
We make the governing equations (Eqs. (1) and (3)) dimensionless by using dividing the length, energy and time variables by their characteristic values (, , and , respectively):
| (14) |
where the primed quantities represent the dimensional values of the variables. Now we write the dimensional form of Eq. (1) and use the above relations to make it non-dimensional (noting that the dimensional gradient operator has the dimension of inverse of length):
| (15) |
Thus we see that we get back the original form of Eq. (1) in terms of non- dimensional variables when and are scaled by choosing a reference value of .
The Cahn-Hilliard equation (Eq. 3) in dimensional form is converted to its non-dimensional form as follows:
| (16) |
Thus we get back the non-dimensional Eq. (3) by scaling the dimensional mobility with its characteristic value . Using these conversion expressions and choosing appropriate values for the reference variables , and , the dimensionless model parameters used in the simulations can now be connected to their dimensional counterparts [15].
Choosing where is the Avogadro’s number gives a reference length of . If reference energy is taken as , it yields a value of for . Finally, a reference time can be obtained, for example, by using a typical mobility value [27] of , which for yields ms. Dimensional values of relevant model parameters, along with their conversion factors, are listed in Table LABEL:SimulationParameters, while the corresponding values of surface and interfacial energies resulting from different parameter sets are provided in Table LABEL:tab:IEdimensional.