AntiBenford Subgraphs:
Unsupervised Anomaly Detection in Financial Networks
Abstract
Benford’s law describes the distribution of the first digit of numbers appearing in a wide variety of numerical data, including tax records, and election outcomes, and has been used to raise "red flags" about potential anomalies in the data such as tax evasion. In this work, we ask the following novel question:
Given a large transaction or financial graph, how do we find a set of nodes that perform many transactions among each other that deviate significantly from Benford’s law?
We propose the AntiBenford subgraph framework that is founded on well-established statistical principles. Furthermore, we design an efficient algorithm that finds AntiBenford subgraphs in near-linear time on real data. We evaluate our framework on both real and synthetic data against a variety of competitors. We show empirically that our proposed framework enables the detection of anomalous subgraphs in cryptocurrency transaction networks that go undetected by state-of-the-art graph-based anomaly detection methods. Our empirical findings show that our AntiBenford framework is able to mine anomalous subgraphs, and provide novel insights into financial transaction data. The code and the datasets are available at https://github.com/tsourakakis-lab/antibenford-subgraphs.
1 Introduction
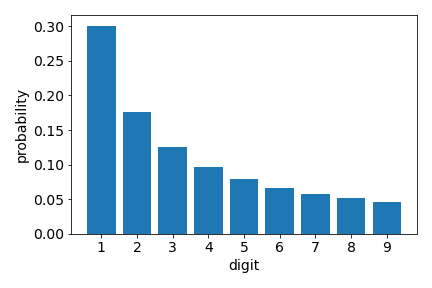
Anomaly detection is a broad term describing methods that detect patterns that deviate from normal behavior [17]. The development of an anomaly detection method is application-dependent, and requires an understanding of what constitutes “normal”. For example, consider the following question of interest to revenue services: how do we detect tax evasion and fraud? What information can we use in order to raise “red flags” about certain accounts that will undergo additional control? Benford’s law, aka Newcomb-Benford law [10, 53], states that the first digit of numbers appearing in natural datasets, such as addresses, areas, stock quotations, town populations, is not uniformly distributed. Specifically, the fraction of numbers starting with digit is not the uniform (), but instead follows the monotone decreasing function of , i.e., . This distribution is shown in Figure 1(a). Benford’s law has been used numerous times successfully in practice to raise red flags that eventually detect fraud, see for instance [61, 21, 63, 58, 16, 70].
 |
 |
| (a) | (b) |
In this work we are interested in developing novel unsupervised methods for detecting anomalous subgraphs in financial and transaction networks. Despite the large toolbox of unsupervised anomaly detection methods [31, 71], the task of designing novel, well-performing unsupervised methods remains a great challenge. Furthermore, the case of transaction networks is special for (at least) two major reasons. First, transaction networks are knowledge graphs, with a lot of important information available for the nodes and edges; e.g., we know that if a node has a PO box only, or resides in what is called high risk country, the conditional probability of being part in an illicit scheme is higher than some node that has a standard bank account in a low risk country. These special characteristics can play a key role in detecting anomalies, but have not been taken account largely by the research community. One of the key reasons behind this fact is the scarcity of real-world banking data, as well as the natural hesitation of financial institutions to publish more on their anomaly detection systems, despite the existence of dedicated venues (e.g., Journal of Money Laundering Control). Despite the scarcity of publicly available bank transaction datasets due to privacy reasons, the wide-spread use of cryptocurrencies has enabled the collection of interesting financial datasets. For instance, in a Bitcoin transaction network, nodes correspond to transactions, and edges to Bitcoins flow between transactions [79].
Finding subgraphs that correspond to illicit behavior such as malware, money laundering, ransomware, and Ponzi schemes is a challenging task. Towards this goal, we propose a novel graph based anomaly detection method that leverages two components: (i) Benford’s law, and (ii) dense subgraph discovery, a major area of graph mining. The latter has been used widely in a variety of tasks ranging from finance to biology, and also anomaly detection, e.g., [25, 46, 45, 35, 51]. The latter is due to the intuitive fact that in certain applications statistically unlikely dense clusters correlate well with anomalous, and possibly malicious behavior. .
In this work we propose the AntiBenford subgraph anomaly detection problem, stated informally as follows:
Intuitively, Antibenford subgraphs are dense subgraphs whose edges have an empirical distribution significantly different from Benford’s law. The edge density constraint (i) biases the output towards a set of nodes that in some way are likely to know each other, or in the context of cryptocurrency financial networks, they may even correspond to wallets held by a single person or a small group of people who coordinate their actions. The second constraint (ii) biases the output to include edges whose weights “violate” Benford’s law in the following sense; if the edges’ first digits are independent and identically distributed (iid) random variables (RVs) according to Benford’s law, then their distribution is a multinomial. There exists a variety of goodness-of-fit tests for testing such hypotheses, e.g., [34, 66]. As we show experimentally in Section 4, combining constraints (i), and (ii) results in finding interesting, and statistically significant anomalous subgraphs. It is worth mentioning that we empirically verify that Ethereum blockhain transactions follow closely Benford’s law, see Section 4.3 for details.
Our contributions in this work include the following.
AntiBenford subgraphs. We propose a novel unsupervised framework for detecting anomalies in financial networks. The generic task of developing such a framework is known to be a challenging problem of great importance.
Mathematical and algorithmic analysis. We propose a specific formulation for problem 1, and design an algorithm that is algorithmically founded on dense subgraph discovery. Furthermore, we provide mathematical insights into the behavior of our objective using a probabilistic analysis.
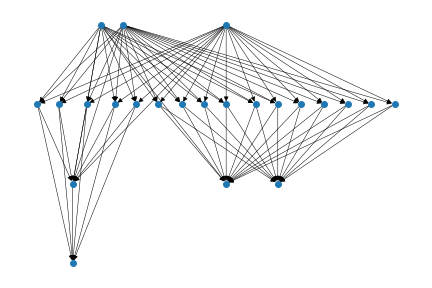
Experimental validation. Our method is able to uncover anomalous subgraphs in various settings. For example, Figure 1(b) shows an AntiBenford subgraph found in the Ethereum network spanning a period of a month (Jan. 2018). The subgraph has an apparent tripartite structure, where the money flows from one layer to the next. Furthermore, the distribution of the first digit among this set of transactions deviates significantly from Benford’s law, see Figure 4. The structure resembles a smurf-like111In banking, smurfing refers to splitting of a large financial transaction into multiple smaller transactions. structure with respect to the layering, a subgraph that is known to appear in money laundering schemes [44, 67]. These findings are representative of what our proposed method can achieve in complex, networked data. Despite the remarkable success of prior graph-based anomaly detection methods, our findings verify that our framework provides information that is otherwise inaccessible.
2 Related Work
Graph Based Anomaly Detection is an intensively active area of graph mining [55], that attracts interest from a diversity of industrial and scientific applications. Such applications include security applications [12, 19], anti-money laundering [45], spammers [3, 35, 25], and fraud detection [22]. We indicatively report some works in this area; the interested reader should confer the extensive survey on graph-based anomaly detection [4]. -cores have also been frequently used to detect anomalies in large-scale networks [28, 65]. Many frameworks tend to use both graph topology and node/edge attributes to identify anomalies. Noble and Cook [55] studied anomaly detection on graphs with categorical features by searching for graph sub-structures that occur infrequently. The evaluation is based on the Minimum Description Length Principle (MDL). Davis et al.[20] suggested an extension that is able to treat both structural data and numeric attributes. OddBall is a scalable anomaly detection tool on weighted graphs [3]. To detect transaction frauds, Semenets et al. compress each transaction as a star graph instance, and train classifiers with vector representations generated based on frequent subgraphs [32]. Braun et al. constructed a shop-card bipartite graph, and defined a suspiciousness score focusing on the bicliques [15]. Kumar et al. proposed REV2 to identify fraudulent users from rating platforms, by computing anomalous scores on nodes and edges with network and behavior properties [43]. Agarwal et al. calculated statistics to measure the statistical significance of subgraphs matching on uncertain graphs [2]. Recently, Nilforoshan and Shah proposed an axiomatic-based method to find fraudsters on Snapchat’s ad platform by incorporating characteristics that such fraudsters typically possess [54]. Mitzenmacher et al. [51] use the -clique densest subgraph problem [72] to find a citation ring in the patents citation network. Graph anomaly detection has been applied to financial networks for applications including anti-money laundering, and fraud detection. Pham et al. applied unsupervised machine learning techniques including k-means clustering and SVM to detect anomalies on Bitcoin transaction network [59]. Recently Weber et al. published the Elliptic dataset, so far the largest labelled Bitcoin transaction dataset [79]. Graph neural networks are used on financial networks, typically in a semi-supervised setting [77, 79, 80].
Several dense subgraph discovery based methods have been proposed in the literature. Fraudar is an algorithm for catching fraudulent sets of nodes in graphs that are dense and that may attempt to camouflage themselves by creating random connections with non-malicious/normal nodes [35]. HoloScope [46] is a well-suited framework for bipartite graphs, that detects fraudulent attacks based on the graph topology, and also other information including temporal event bursts, drops, and rating scores. Their method relies on using singular vectors to detect well-connected communities that are then used as seeds to detect dense subgraphs based on node anomaly scores. FlowScope [45] aims to detect money laundering on transaction networks by detecting dense multi-partite structures. Starnini et al. show that detecting smurfs using standard SQL joins with a time filter results in highly suspicious subgraphs of money laundering [67]. Finally, EigenSpokes [60] uses the correlations between eigenvectors to detect near-bipartite cliques and near-cliques, see also [37] for further applications.
Dense subgraph discovery is a major topic in graph mining [29]. Detecting dense subgraphs has a wide range of applications, ranging from anomaly detection [45, 35, 25, 36], to bioinformatics [62, 26]. A wide variety of mathematical formulations has been proposed in the literature. The archetypical dense subgraph is a clique. However, the maximum clique problem is not only NP-hard, but also strongly inapproximable, see [33]. Many other formulations that relax the clique requirement, and instead require that a large fraction of all pairs of nodes are connected are also NP-hard, and typically hard to approximation. For instance, finding an optimal quasi-clique [39, 74] is also NP-hard [73], but scalable solutions that work well on real-world datasets have been developed in recent years [51, 42].
In sheer contrast to the quasi-clique formulations with respect to the computational complexity, stands the densest subgraph problem (DSP) that is solvable in polynomial time on graphs with non-negative weights [27, 40, 30]. Given a graph the densest subgraph problem (DSP) aims to find a subset of nodes that maximizes the degree density . Here, denotes the total edge weight induced by , i.e., . When the graph is unweighted, then the numerator simply equals the number of induced edges , and the degree density is simply half the average degree of the subgraph induced by . When there exist negative weights, the DSP becomes NP-hard [76]. We emphasize that the degree density objective is better suited for undirected, non-bipartite graphs; we focus on this objective in this paper. More suitable objectives for other types of graphs have also been proposed in the literature, see [38, 18, 40, 47].
The DSP can be solved exactly using (parametric) maximum flows [27, 30]. Since maximum flow computations are computationally expensive [56] and theoretical advances in approximate max flow computations have not been yet translated to scalable software implementations [50, 57, 48], practitioners usually favor a -approximation algorithm that uses linear-space and run in linear time for unweighted graphs. Specifically, Charikar [18] showed that the greedy algorithm proposed by Asashiro et al. [7] is a -approximation algorithm. We refer to this algorithm as the Greedy Peeling algorithm. The algorithm removes in each iteration, the node with the smallest degree. This process creates a nested sequence of sets of nodes . The algorithm outputs the graph that maximizes the degree density among . Recently, Boob et al. proposed a new algorithm [14] that combines near-optimal solutions with time efficiency. We emphasize that the DSP has no restrictions on the size of the output. When one imposes cardinality constraints on the size of the problem becomes NP-hard. For instance, solving the DSP with the requirement that the output set should have exactly nodes is known as the densest--subgraph problem and the state-of-the-art approximation algorithm is due to Bhaskara et al. [11], and provides a approximation in time. Other versions where have also been considered in the literature see [6]. The DSP has been studied under various other computational models in addition to the RAM model, including dynamic setting [13, 23, 64], the streaming model [9, 13, 49, 24], and the MapReduce model [9, 8]. In recent years, notable extensions of the DSP have been proposed. Tsourakakis proposed the -clique DSP [75, 72] that can be solved fast on massive graphs [51, 68], and Tatti and Gionis [69] introduced the locally-dense graph decomposition.
Tests of fit. Parametric hypothesis testing is an extensive area of statistics [78]. We are interested in tests of fit for the multinomial distribution, as Benford’s law can be thought of as a 9-sided loaded die that determines the first digit of a transaction weight. More generally, we wish to test the hypothesis
where is some particular cumulative distribution function. This problem is known in general as a goodness-of-fit problem [66, 34]. In the case where we have classes, and we assume corresponds to the multinomial distribution , if is the number of observations from class for , and the total number of observations is then the likelihood function is given by
It is well known that the likelihood of alternative hypothesis is maximized when we consider to be the multinomial distribution with parameters given by the ML estimators of its parameters, namely . The likelihood ratio (LR) statistic for testing against is equal to the ratio of the two likelihood functions, and is equal to . Hypothesis is rejected when the LR statistic is small enough. It is known that as , the function is asymptotically distributed in the form with degrees of freedom. Karl Pearson proposed the statistic . Asymptotically the LR test, and the statistic have the same distribution, but it is known that for small values of they can yield different results.
Theorem 1 (Chernoff bound).
Consider a set of mutually independent binary random variables . Let be the sum of these random variables. Then, for we have
3 AntiBenford Subgraphs
Given a weighted transaction network , we view the set of its edges as iid samples from Benford’s distribution, and we use the standard -statistic to test whether it follows such distribution [34]. We refer to this hypothesis as .
The -statistic of a subgraph induced by is defined as
where is the number of edges in subgraph induced by whose weight’s first digit is , and is the expected number of edges whose weight’s first digit is according to Benford’s distribution. When it is clear to which subset we are referring to, we use instead of for brevity. The -statistic of the whole graph is defined as .
It is a well-known fact this statistic follows the distribution with degrees of freedom. We define the average -statistic of the graph as , and more generally the average -statistic of any induced subgraph as , where is the statistic of the weights induced by .
Definition 1 (AntiBenford subgraph).
An AntiBenford subgraph is a subset of nodes such that .
The above definition is founded on our probabilistic analysis, see Corollary 1. Assuming the null hypothesis is true, the average score of any subgraph is a diminishing fraction of its order:
However, even if the null hypothesis is true, we do expect to observe subgraphs that deviate from the mean. Roughly speaking, our mathematical analysis shows that the key quantity to look at is the degree density, i.e., half of the average degree. Notice that a claim of the form “there does not exist a large subgraph whose average -score is much larger than its degree density”, is far from obvious; the standard probabilistic approach of bounding the failure probability of a given subgraph by for any constant , and a union bound over all possible subgraphs does not yield any meaningful results, since we have an exponential number of bad events.
Our key theoretical result shows that under hypothesis there exist no AntiBenford subgraphs with average degree .
Theorem 2.
Let be an accuracy parameter, and let be the lowest digit probability in Benford’s law. Suppose that the null hypothesis is true, and all edge weights are iid samples from Benford’s distribution. Then, with high probability for all subgraphs with average degree at least where is a constant depending on , the number of edges that start with digit in is strongly concentrated around its expectation, for all
Proof.
Consider a subgraph induced by , and a digit . Let be the number of induced edges, and the number of edges whose weight starts with digit respectively. Notice that . By the Chernoff bound (see Theorem 1) we obtain that for any the following inequality holds
We used the fact that , since the average degree satisfies . Now, consider the following double union bound over all digits, and subgraphs with average degree as described above:
Therefore, we conclude that with high probability , the number of edges with first digit in subgraphs with large enough average degree is strongly concentrated around the expectation for all nine possible digits . ∎
This implies that we expect for all sufficiently large subgraphs to have a strong concentration of around the true expectation. This fact in turn implies that the average score of a set satisfying the conditions of Theorem 2 is within a factor of of its average degree. To see why, notice that with high probability the following holds:
Since , we state this informally as the next corollary:
Corollary 1.
Under the null hypothesis , we expect to observe subgraphs with . Furthermore, , where is the density of the densest subgraph in .
Algorithm. Our approach is outlined in pseudocode 1. For each node , we measure how the transactions it is involved into, deviate from Benford’s distribution by computing the score. We define the anomaly score of node as
where is the number of transactions incident to whose first digit is . Once we have computed all scores we reweigh each edge by a function of the scores. Specifically, we find that the following function works well in practice. Then we solve the densest subgraph problem, namely we maximize the following objective Our choice of reweighing biases the densest anomalous subgraph to contain nodes that are all involved in transactions that deviate from Benford’s; consider a node with high degree towards an anomalous set of nodes, but assume that overall the transactions that involve agree with Benford’s, so is low. Then, our reweighing scheme will avoid including such a node in an optimal solution, in contrast to other possible AntiBenford formalizations of the form . Such formulations are known to be solvable in polynomial time for non-negative scores, see [30, 35]. Notice that one can use a linear program, a max-flow approach, or a greedy approximation algorithm for finding the DSP (line 6) in the algorithm. Let and be the approximation guarantee ( for exact) and the run time of the algorithm DSP used in line 6. Then, we obtain the following straight-forward proposition:
Proposition 1.
We can find an -approximate AntiBenford subgraph in time in the standard RAM model of computation.
In our experiments, we favor for the scalable greedy algorithm. Finally, in practice we may want to extract more than one AntiBenford subgraph. In order to do so, we run Algorithm 1 repeatedly, and each time we remove the previous output set of vertices from the graph, thus finding node-disjoint AntiBenford subgraphs.
4 Experiments
4.1 Experimental Setup
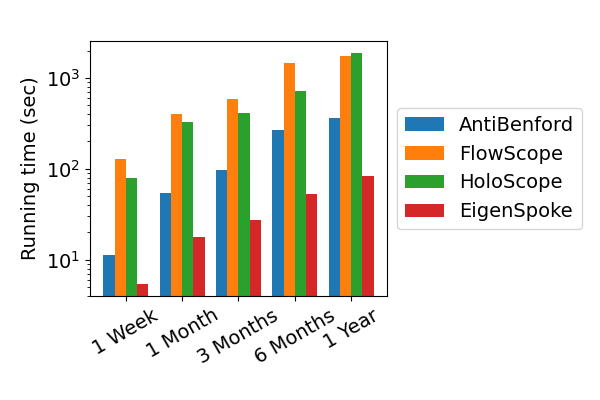
Datasets and competitors. We use Ethereum token transfer networks together with synthetic data to evaluate our proposed framework. As competitors we use EigenSpoke [60], HoloScope [46], and FlowScope [45]. The real-world datasets are summarized in Table 1.
Ethereum blockchain. We use the Ethereum token transfer dataset supported and shared by Google BigQuery [1]. The original data contains for each token transaction its source and sink addresses, value, timestamp and block information. We present our anomaly detection results from two snapshots, spanning the periods of January 2018 and January 2019. We filter out all transactions with values less than 1 unit. We also construct five cumulative Ethereum token transfer networks spanning from one week to the whole year of 2019 to analyze the running time of our method, see the second part of Table 1.
| Name | # nodes | # edges | # transactions |
|---|---|---|---|
| ETH-Jan-18 | 1 761 571 | 2 749 707 | 4 279 799 |
| ETH-Jan-19 | 2 199 347 | 3 331 594 | 6 128 061 |
| ETH - 1 Week | 779 237 | 1 016 481 | 1 438 641 |
| ETH - 1 Month | 2 199 347 | 3 331 594 | 6 128 061 |
| ETH - 3 Month | 2 877 055 | 8 504 999 | 17 529 925 |
| ETH - 6 Month | 5 018 047 | 21 572 152 | 43 885 527 |
| ETH - 1 Year | 6 820 719 | 38 917 136 | 85 055 054 |
Machine Specs and code. The experiments are performed on a single machine, with Intel i7-10850H CPU @ 2.70GHz and 32GB of main memory. Our graph analysis code is written in Python3, and we use the C++ implementation of DSP algorithms from [14] for efficiency. We use the spartan2222https://github.com/BGT-M/spartan2 library for all competitors. The code and datasets are available at https://github.com/tsourakakis-lab/antibenford-subgraphs.
4.2 Synthetic data
The goal of our experiments on synthetic data is two-fold. First, we want to show that popular competitors cannot detect the planted anomalies, and secondly show the limitations of AntiBenford subgraphs.
Towards this purpose, we generate clustered networks, with planted anomalies with respect to the first digit distribution in order to compare how well various methods can detect them. Since the original HoloScope implementation assumes that the input has a bipartite structure, we generate a version of the stochastic blockmodel as follows. We have two types of nodes (users vs. objects), and nine clusters. Each cluster is a bipartite clique, and clusters are interconnected with edge probability , namely for each pair of user , and object from two separate clusters we generate an edge independently with probability . Then we sample first digits on the edges (since we only care about the first digit, this suffices) according to Benford’s distribution for all the edges except for the induced edges for three clusters. Those three bicliques receive digits 1, 2, 3 with probability 1 respectively. We set the size of each normal cluster to 80 nodes, and we range the size of the anomalous bicliques in [20, 50, 80, 110].
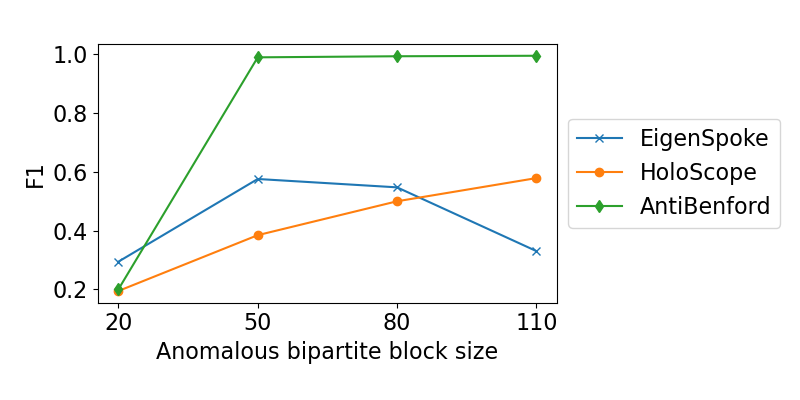 |
Figure 2 shows the results of the three methods. Eigenspoke and Holoscope cannot detect the planted anomalous subgraphs. For example, Holoscope outputs the whole graph. It is worth emphasizing that the increase in the F1 of Holoscope is due to the fact that the size of the anomalous clusters increases, and not due to any changes in the performance of the algorithm. Our method achieves perfect precision and recall when the size of the anomalous clusters is greater than 20, by finding the top-3 outputs of Algorithm 1. This is done by running the algorithm, removing the output subgraph from the graph, and iterating for three times. This shows a well-known limitation of the densest subgraph problem, pointed out by prior work [74, 75, 72], namely the small size of the true anomalous clusters is “hidden” by larger sets of higher average degree. This issue can be resolved by using a weighted version of the -biclique DSP problem [51, 72] with .
4.3 Anomaly Detection in Ethereum Networks
In this section we analyze two Ethereum transaction networks, ETH-Jan-18 and ETH-Jan19, and demonstrate the suspicious subgraphs we find. By iteratively finding and removing suspicious subgraphs by applying Algorithm 1, we find the top-5 AntiBenford subgraphs and show their and scores in Table 2, together with the statistics for the whole network that closely follows Benford’s law. We observe a sheer contrast of the value of between the global network and the suspicious subgraphs we found. In Table 2 we also mark highly suspicious subgraphs whose values are significantly higher than their densities , according to our rigorous analysis, see Corollary 1. Figure 3 shows the empirical distribution of the quantity , i.e. the score of node averaged by its degree. The histogram of this quantity is skewed, and follows (roughly) a power law with slope on the whole network of ETH-Jan-18 [5]. We obtain this fitting using the Python package powerlaw [5]. The middle and right figures in Figure 3 show the histograms for two top AntiBenford subgraphs that deviate from the histogram of the global graph on the left.
| Dataset | Metrics | global | |||||
|---|---|---|---|---|---|---|---|
| ETH- | 3429 | 2587 | 379 | 2.59e5 | 698 | 1.6e5 | |
| Jan-18 | 14.4 | 7.59 | 11.14 | 35.75 | 5.96 | 0.09 | |
| 18.8 | 13.09 | 3.82 | 1.96 | 1.99 | 2.43 | ||
| ETH- | 131818 | 3963 | 1205 | 10677 | 9372 | 2.92e5 | |
| Jan-19 | 1588 | 10.88 | 9.06 | 9.58 | 9.49 | 4.26e-3 | |
| 214 | 15.5 | 4.77 | 14.15 | 3.96 | 2.79 |
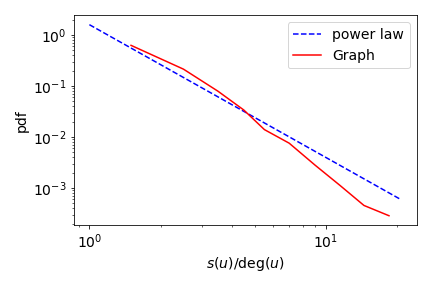
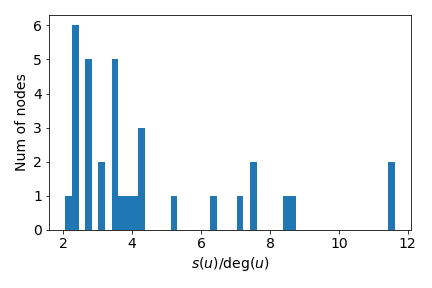
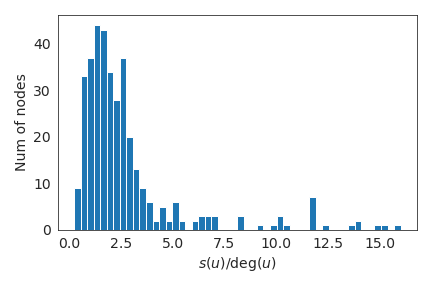
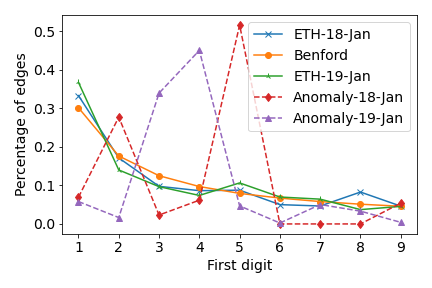
Figure 4 describes the first digit distribution of the subgraph we found from the Ethereum token transfer network in January 2018. Transaction values of this subgraph strongly violate Benford’s law as half of them start with 5. Figure 1(b) visualizes the topology which is close to a tripartite directed graph. According to previous studies [67, 41, 45], this follows a common money laundering network pattern where money flows quickly (i.e., in a matter of a couple of weeks) from few sources to few targets via middle nodes. We can even visually recognize the sources, middle nodes, and final recipients. Over Ethereums are transferred from top to bottom in one month in this subgraph. Interestingly we verify that all middle nodes send out all the money they receive, which is a property known to hold in money laundering as the zero out property, see also [45, 67]. A sample of such transactions are shown in Table 3. We observe that a certain amount of money is sent to several middle accounts on the same day by one sender, and is altogether sent out to one receiver after at most a couple of weeks, and sometimes even earlier than that.
|
|
|
|
|
|||||||||||
|---|---|---|---|---|---|---|---|---|---|---|---|---|---|---|---|
| beb58d36 | 9b06578f | 9667 | 18/01/18 | 18/02/06 | |||||||||||
| 07c15792 | 59c42026 | 2160 | 17/09/15 | 17/09/24 | |||||||||||
| 9a974c3b | 59c42026 | 33565 | 17/10/13 | 17/10/20 | |||||||||||
| c0cb31d0 | 89705733 | 17200 | 18/02/03 | 18/02/17 |
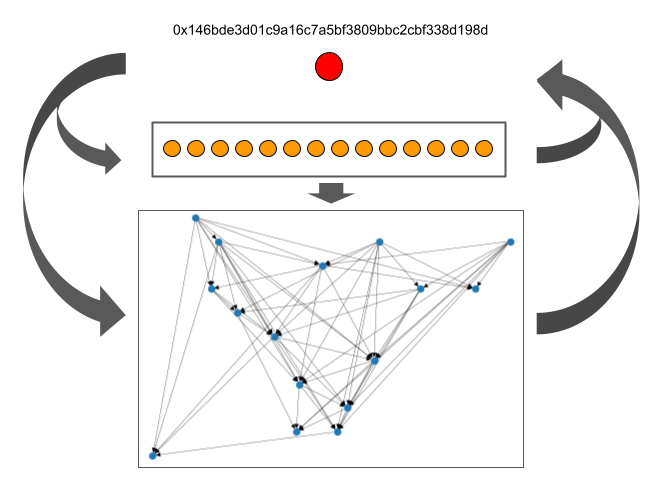
On the Ethereum Jan. ’19 network, our method outputs a clearly anomalous subgraph. The distribution of its digits significantly deviates from Benford’s law, which, as we mentioned before, fits well the empirical global first digit distribution. Most of the transactions start with digits 3, and 4. Table 2 summarizes the statistics of the top-5 anomalous subgraphs found using Algorithm 1, and Figure 4 shows the resulting digit distributions, contrasted with the global digit distributions that follow closely Benford’s law. Figure 5(a) shows that the subgraph can be partitioned into three groups of nodes. There is a central node, depicted as red, a set of middle nodes marked as orange, and a group of accounts marked blue that form a more complicated network, but still exhibit a DAG-like structure, with top-down edge flow. Each big arrow between groups represents complete edge connections between two groups in a certain direction. The central node in one month sends out more than million Ethereum Tokens to other accounts inside this subgraph, and receives more than Ethereum Tokens from them with some external incomes through the blue bottom accounts.
 |
 |
| (a) | (b) |
Flowscope -a framework tailored for anti-money laundering- is unable to output any of these subgraphs. Even worse, its outputs do not appear suspicious at all, and consist of a path of length 2, with large weights on the edges. Furthermore, we observe that suspicious structures in real-world financial networks do not always exhibit a perfect -partite structure, and thus are not easily detected by Flowscope.
Scalability. We apply AntiBenford and other competitors on a set of five Ethereum networks that span transactions from one week to one year. We report the running time in Figure 5(b). Due to the linear complexity of greedy peeling, Algorithm 1 can efficiently find anomalies even in the largest graph we have.
5 Conclusion
In this work we contribute a novel, statistically founded formulation for finding anomalies in transaction networks; it is known that unsupervised anomaly detection in financial networks is a challenging, and important problem world-wide. We show that AntiBenford subgraphs exhibit characteristics that are known in the literature to appear in illicit transactions, such as smurf-like structures showing that criminals are likely to operate abnormally both in terms of creating special subgraph structures, and splitting the money carefully. We provide an extension of Benford’s law on networks, and we show that the analysis of such a law presents technical challenges due to the fact that there exists an exponential number of “bad events”. Based on our analysis we provide a well-founded definition of AntiBenford subgraphs. We show empirically that the resulting AntiBenford subgraphs are able to find anomalies in Ethereum networks that are otherwise unobtainable from state-of-the-art graph-based anomaly detection methods. An interesting direction is the design of algorithms that allow for overlapping anomalous subgraphs, and extending the experimental setup to include other measures of statistical deviation.
References
- [1] Complete live historical ethereum blockchain data (bigquery). https://www.kaggle.com/bigquery/ethereum-blockchain.
- [2] S. Agarwal, S. Dutta, and A. Bhattacharya. Chisel: Graph similarity search using chi-squared statistics in large probabilistic graphs. Proc. VLDB Endow., 13(10):1654–1668, June 2020.
- [3] L. Akoglu, M. McGlohon, and C. Faloutsos. Oddball: Spotting anomalies in weighted graphs. In Pacific-Asia conference on knowledge discovery and data mining, pages 410–421. Springer, 2010.
- [4] L. Akoglu, H. Tong, and D. Koutra. Graph based anomaly detection and description: a survey. Data mining and knowledge discovery, 29(3):626–688, 2015.
- [5] J. Alstott, E. Bullmore, and D. Plenz. powerlaw: a python package for analysis of heavy-tailed distributions. PloS one, 9(1):e85777, 2014.
- [6] R. Andersen and K. Chellapilla. Finding dense subgraphs with size bounds. In International Workshop on Algorithms and Models for the Web-Graph, pages 25–37. Springer, 2009.
- [7] Y. Asahiro, K. Iwama, H. Tamaki, and T. Tokuyama. Greedily finding a dense subgraph. Journal of Algorithms, 34(2):203–221, 2000.
- [8] B. Bahmani, A. Goel, and K. Munagala. Efficient primal-dual graph algorithms for mapreduce. In International Workshop on Algorithms and Models for the Web-Graph, pages 59–78. Springer, 2014.
- [9] B. Bahmani, R. Kumar, and S. Vassilvitskii. Densest subgraph in streaming and mapreduce. Proceedings of the VLDB Endowment, 5(5):454–465, 2012.
- [10] F. Benford. The law of anomalous numbers. Proceedings of the American philosophical society, pages 551–572, 1938.
- [11] A. Bhaskara, M. Charikar, E. Chlamtac, U. Feige, and A. Vijayaraghavan. Detecting high log-densities: an approximation for densest k-subgraph. In Proceedings of the forty-second ACM symposium on Theory of computing, pages 201–210, 2010.
- [12] S. Bhatia, B. Hooi, M. Yoon, K. Shin, and C. Faloutsos. Midas: microcluster-based detector of anomalies in edge streams. In Proceedings of the AAAI Conference on Artificial Intelligence, volume 34, pages 3242–3249, 2020.
- [13] S. Bhattacharya, M. Henzinger, D. Nanongkai, and C. Tsourakakis. Space-and time-efficient algorithm for maintaining dense subgraphs on one-pass dynamic streams. In Proceedings of the forty-seventh annual ACM symposium on Theory of computing, pages 173–182. ACM, 2015.
- [14] D. Boob, Y. Gao, R. Peng, S. Sawlani, C. Tsourakakis, D. Wang, and J. Wang. Flowless: extracting densest subgraphs without flow computations. In Proceedings of The Web Conference 2020, pages 573–583, 2020.
- [15] F. Braun, O. Caelen, E. N. Smirnov, S. Kelk, and B. Lebichot. Improving card fraud detection through suspicious pattern discovery. In S. Benferhat, K. Tabia, and M. Ali, editors, Advances in Artificial Intelligence: From Theory to Practice, pages 181–190, Cham, 2017. Springer International Publishing.
- [16] A. Cerioli, L. Barabesi, A. Cerasa, M. Menegatti, and D. Perrotta. Newcomb–benford law and the detection of frauds in international trade. Proceedings of the National Academy of Sciences, 116(1):106–115, 2019.
- [17] V. Chandola, A. Banerjee, and V. Kumar. Anomaly detection: A survey. ACM computing surveys (CSUR), 41(3):1–58, 2009.
- [18] M. Charikar. Greedy approximation algorithms for finding dense components in a graph. In International Workshop on Approximation Algorithms for Combinatorial Optimization, pages 84–95. Springer, 2000.
- [19] Y. Chen, Y. Nadji, A. Kountouras, F. Monrose, R. Perdisci, M. Antonakakis, and N. Vasiloglou. Practical attacks against graph-based clustering. In Proceedings of the 2017 ACM SIGSAC Conference on Computer and Communications Security, pages 1125–1142, 2017.
- [20] M. Davis, W. Liu, P. Miller, and G. Redpath. Detecting anomalies in graphs with numeric labels. In Proceedings of the 20th ACM International Conference on Information and Knowledge Management, CIKM ’11, page 1197–1202, New York, NY, USA, 2011. Association for Computing Machinery.
- [21] P. D. Drake and M. J. Nigrini. Computer assisted analytical procedures using benford’s law. Journal of Accounting Education, 18(2):127–146, 2000.
- [22] W. Eberle and L. Holder. Discovering structural anomalies in graph-based data. In Seventh IEEE international conference on data mining workshops (ICDMW 2007), pages 393–398. IEEE, 2007.
- [23] A. Epasto, S. Lattanzi, and M. Sozio. Efficient densest subgraph computation in evolving graphs. In Proceedings of the 24th International Conference on World Wide Web, pages 300–310. International World Wide Web Conferences Steering Committee, 2015.
- [24] H. Esfandiari, M. Hajiaghayi, and D. P. Woodruff. Applications of uniform sampling: Densest subgraph and beyond. arXiv preprint arXiv:1506.04505, 2015.
- [25] D. Eswaran, C. Faloutsos, S. Guha, and N. Mishra. Spotlight: Detecting anomalies in streaming graphs. In Proceedings of the 24th ACM SIGKDD International Conference on Knowledge Discovery & Data Mining, pages 1378–1386, 2018.
- [26] E. Fratkin, B. T. Naughton, D. L. Brutlag, and S. Batzoglou. Motifcut: regulatory motifs finding with maximum density subgraphs. Bioinformatics, 22(14):e150–e157, 2006.
- [27] G. Gallo, M. D. Grigoriadis, and R. E. Tarjan. A fast parametric maximum flow algorithm and applications. SIAM Journal on Computing, 18(1):30–55, 1989.
- [28] C. Giatsidis, F. Malliaros, D. Thilikos, and M. Vazirgiannis. Corecluster: A degeneracy based graph clustering framework. In Twenty-Eighth AAAI Conference on Artificial Intelligence, 2014.
- [29] A. Gionis and C. E. Tsourakakis. Dense subgraph discovery: Kdd 2015 tutorial. In Proceedings of the 21th ACM SIGKDD International Conference on Knowledge Discovery and Data Mining, pages 2313–2314. ACM, 2015.
- [30] A. V. Goldberg. Finding a maximum density subgraph. University of California Berkeley, CA, 1984.
- [31] M. Goldstein and S. Uchida. A comparative evaluation of unsupervised anomaly detection algorithms for multivariate data. PloS one, 11(4):e0152173, 2016.
- [32] V. Herrera-Semenets, N. Acosta-Mendoza, and A. Gago-Alonso. A framework for intrusion detection based on frequent subgraph mining. 2015.
- [33] J. Hstad. Clique is hard to approximate within . Acta Mathematica, 182(1), 1999.
- [34] W. Hoeffding. Asymptotically optimal tests for multinomial distributions. The Annals of Mathematical Statistics, pages 369–401, 1965.
- [35] B. Hooi, H. A. Song, A. Beutel, N. Shah, K. Shin, and C. Faloutsos. Fraudar: Bounding graph fraud in the face of camouflage. In Proceedings of the 22nd ACM SIGKDD International Conference on Knowledge Discovery and Data Mining, pages 895–904, 2016.
- [36] M. Jiang, A. Beutel, P. Cui, B. Hooi, S. Yang, and C. Faloutsos. A general suspiciousness metric for dense blocks in multimodal data. In 2015 IEEE International Conference on Data Mining, pages 781–786. IEEE, 2015.
- [37] M. Jiang, P. Cui, A. Beutel, C. Faloutsos, and S. Yang. Inferring strange behavior from connectivity pattern in social networks. In V. S. Tseng, T. B. Ho, Z.-H. Zhou, A. L. P. Chen, and H.-Y. Kao, editors, Advances in Knowledge Discovery and Data Mining, pages 126–138, Cham, 2014. Springer International Publishing.
- [38] R. Kannan and V. Vinay. Analyzing the structure of large graphs. Rheinische Friedrich-Wilhelms-Universität Bonn Bonn, 1999.
- [39] Y. Kawase and A. Miyauchi. The densest subgraph problem with a convex/concave size function. Algorithmica, 80(12):3461–3480, 2018.
- [40] S. Khuller and B. Saha. On finding dense subgraphs. In International Colloquium on Automata, Languages, and Programming, pages 597–608. Springer, 2009.
- [41] C. King. Find the fraudster/money launderer anti money laundering basics. https://tinyurl.com/cking-amlbasics.
- [42] A. Konar and N. D. Sidiropoulos. Mining large quasi-cliques with quality guarantees from vertex neighborhoods. In ACM SIGKDD, pages 577–587, 2020.
- [43] S. Kumar, B. Hooi, D. Makhija, M. Kumar, C. Faloutsos, and V. Subrahmanian. Rev2: Fraudulent user prediction in rating platforms. In WSDM, pages 333–341. ACM, 2018.
- [44] M.-C. Lee, Y. Zhao, A. Wang, P. J. Liang, L. Akoglu, V. S. Tseng, and C. Faloutsos. Autoaudit: Mining accounting and time-evolving graphs. In 2020 IEEE International Conference on Big Data (Big Data), pages 950–956. IEEE, 2020.
- [45] X. Li, S. Liu, Z. Li, X. Han, C. Shi, B. Hooi, H. Huang, and X. Cheng. Flowscope: Spotting money laundering based on graphs. In Proceedings of the AAAI Conference on Artificial Intelligence, volume 34, pages 4731–4738, 2020.
- [46] S. Liu, B. Hooi, and C. Faloutsos. Holoscope: Topology-and-spike aware fraud detection. In Proceedings of the 2017 ACM on Conference on Information and Knowledge Management, pages 1539–1548, 2017.
- [47] C. Ma, Y. Fang, R. Cheng, L. V. Lakshmanan, W. Zhang, and X. Lin. Efficient algorithms for densest subgraph discovery on large directed graphs. In Proceedings of the 2020 ACM SIGMOD International Conference on Management of Data, pages 1051–1066, 2020.
- [48] A. Madry. Fast approximation algorithms for cut-based problems in undirected graphs. In FOCS, pages 245–254. IEEE, 2010.
- [49] A. McGregor, D. Tench, S. Vorotnikova, and H. T. Vu. Densest subgraph in dynamic graph streams. In International Symposium on Mathematical Foundations of Computer Science, pages 472–482. Springer, 2015.
- [50] G. L. Miller and R. Peng. Approximate maximum flow on separable undirected graphs. In Proceedings of the twenty-fourth annual ACM-SIAM symposium on Discrete algorithms, pages 1151–1170. SIAM, 2013.
- [51] M. Mitzenmacher, J. Pachocki, R. Peng, C. Tsourakakis, and S. C. Xu. Scalable large near-clique detection in large-scale networks via sampling. In Proceedings of the 21th ACM SIGKDD International Conference on Knowledge Discovery and Data Mining, pages 815–824. ACM, 2015.
- [52] M. Mitzenmacher and E. Upfal. Probability and computing: Randomization and probabilistic techniques in algorithms and data analysis. Cambridge university press, 2017.
- [53] S. Newcomb. Note on the frequency of use of the different digits in natural numbers. American Journal of mathematics, 4(1):39–40, 1881.
- [54] H. Nilforoshan and N. Shah. Slicendice: mining suspicious multi-attribute entity groups with multi-view graphs. In 2019 IEEE International Conference on Data Science and Advanced Analytics (DSAA), pages 351–363. IEEE, 2019.
- [55] C. C. Noble and D. J. Cook. Graph-based anomaly detection. In Proceedings of the ninth ACM SIGKDD international conference on Knowledge discovery and data mining, pages 631–636, 2003.
- [56] J. B. Orlin. Max flows in o (nm) time, or better. In Proceedings of the forty-fifth annual ACM symposium on Theory of computing, pages 765–774, 2013.
- [57] R. Peng. Approximate undirected maximum flows in o (m polylog (n)) time. In Proceedings of the twenty-seventh annual ACM-SIAM symposium on Discrete algorithms, pages 1862–1867. SIAM, 2016.
- [58] L. Pericchi and D. Torres. Quick anomaly detection by the newcomb—benford law, with applications to electoral processes data from the usa, puerto rico and venezuela. Statistical Science, 26(4):502–516, 2011.
- [59] T. Pham and S. Lee. Anomaly detection in bitcoin network using unsupervised learning methods. 11 2016.
- [60] B. A. Prakash, A. Sridharan, M. Seshadri, S. Machiraju, and C. Faloutsos. Eigenspokes: Surprising patterns and scalable community chipping in large graphs. In M. J. Zaki, J. X. Yu, B. Ravindran, and V. Pudi, editors, Advances in Knowledge Discovery and Data Mining, pages 435–448, Berlin, Heidelberg, 2010. Springer Berlin Heidelberg.
- [61] B. F. Roukema. A first-digit anomaly in the 2009 iranian presidential election. Journal of Applied Statistics, 41(1):164–199, 2014.
- [62] B. Saha, A. Hoch, S. Khuller, L. Raschid, and X.-N. Zhang. Dense subgraphs with restrictions and applications to gene annotation graphs. In Annual International Conference on Research in Computational Molecular Biology, pages 456–472. Springer, 2010.
- [63] M. Sambridge, H. Tkalčić, and A. Jackson. Benford’s law in the natural sciences. Geophysical Research Letters, 37(22), 2010.
- [64] S. Sawlani and J. Wang. Near-optimal fully dynamic densest subgraph. arXiv preprint arXiv:1907.03037, 2019.
- [65] K. Shin, T. Eliassi-Rad, and C. Faloutsos. Corescope: graph mining using k-core analysis: patterns, anomalies and algorithms. In ICDM, pages 469–478. IEEE, 2016.
- [66] P. J. Smith, D. S. Rae, R. W. Manderscheid, and S. Silbergeld. Approximating the moments and distribution of the likelihood ratio statistic for multinomial goodness of fit. Journal of the American Statistical Association, 76(375):737–740, 1981.
- [67] M. Starnini, C. E. Tsourakakis, M. Zamanipour, A. Panisson, W. Allasia, M. Fornasiero, L. L. Puma, V. Ricci, S. Ronchiadin, A. Ugrinoska, et al. Smurf-based anti-money laundering in time-evolving transaction networks. In ECML-PKDD, pages 171–186. Springer, 2021.
- [68] B. Sun, M. Danisch, T. Chan, and M. Sozio. Kclist++: A simple algorithm for finding k-clique densest subgraphs in large graphs. Proceedings of the VLDB Endowment (PVLDB), 2020.
- [69] N. Tatti and A. Gionis. Density-friendly graph decomposition. In Proceedings of the 24th International Conference on World Wide Web, WWW 2015, Florence, Italy, May 18-22, 2015, pages 1089–1099, 2015.
- [70] A. Tošić and J. Vičič. Use of benford’s law on academic publishing networks. Journal of Informetrics, 15:101163, 08 2021.
- [71] C.-F. Tsai and C.-C. Yen. Unsupervised anomaly detection using hdg-clustering algorithm. In International Conference on Neural Information Processing, pages 356–365. Springer, 2007.
- [72] C. Tsourakakis. The k-clique densest subgraph problem. In Proceedings of the 24th international conference on world wide web, pages 1122–1132. International World Wide Web Conferences Steering Committee, 2015.
- [73] C. Tsourakakis. Streaming graph partitioning in the planted partition model. In Proceedings of the 2015 ACM on Conference on Online Social Networks, pages 27–35. ACM, 2015.
- [74] C. Tsourakakis, F. Bonchi, A. Gionis, F. Gullo, and M. Tsiarli. Denser than the densest subgraph: extracting optimal quasi-cliques with quality guarantees. In Proceedings of the 19th ACM SIGKDD international conference on Knowledge discovery and data mining, pages 104–112. ACM, 2013.
- [75] C. E. Tsourakakis. A novel approach to finding near-cliques: The triangle-densest subgraph problem. arXiv preprint arXiv:1405.1477, 2014.
- [76] C. E. Tsourakakis, T. Chen, N. Kakimura, and J. Pachocki. Novel dense subgraph discovery primitives: Risk aversion and exclusion queries. In Joint European Conference on Machine Learning and Knowledge Discovery in Databases, pages 378–394. Springer, 2019.
- [77] D. Wang, Y. Qi, J. Lin, P. Cui, Q. Jia, Z. Wang, Y. Fang, Q. Yu, J. Zhou, and S. Yang. A semi-supervised graph attentive network for financial fraud detection. pages 598–607, 11 2019.
- [78] L. Wasserman. Hypothesis testing and p-values. In All of Statistics, pages 149–173. Springer, 2004.
- [79] M. Weber, G. Domeniconi, J. Chen, D. K. I. Weidele, C. Bellei, T. Robinson, and C. E. Leiserson. Anti-money laundering in bitcoin: Experimenting with graph convolutional networks for financial forensics. arXiv preprint arXiv:1908.02591, 2019.
- [80] G. Zhang, Z. Li, J. Huang, J. Wu, C. Zhou, and J. Yang. efraudcom: An e-commerce fraud detection system via competitive graph neural networks. ACM Transactions on Information Systems, 07 2021.