Methods of Informational Trends Analytics and Fake News Detection on Twitter
Abstract
In the paper, different approaches for the analysis of news trends on Twitter has been considered. For the analysis and case study, informational trends on Twitter caused by Russian invasion of Ukraine in 2022 year have been studied. A deep learning approach for fake news detection has been analyzed. The use of the theory of frequent itemsets and association rules, graph theory for news trends analytics have been considered.
Keywords: fake news detection, twitter, news trends, frequent itemsets, transformers, deep learning, users’ communities.
1 Introduction
News have an essential impact in many areas of society, politics and business. That is why one can see a lot of attempts to produce manipulative and fake news to get a specified response in the society. One of horrible world events is Russian invasion of Ukraine on February, 24 2022. It causes a large informational news flow on social networks, including producing manipulative and fake news to shape a specified explanation and justification of invasion. One of the goals claimed by Russia was the ’denazification’ of Ukraine. One of the allegations of Russian propaganda was that Ukraine was developing the biological weapon in special laboratories.
Tweets, the messages of Twitter microblogs, have high density of semantically important keywords. It makes it possible to get semantically important information from tweets and generate the features of predictive models for the decision-making support. Different studies of Twitter are considered in the papers [1, 2, 3, 4, 5, 6, 7, 8, 9, 10, 11, 12, 13]. In [14, 15, 16], we study different approaches for the analysis of messages on Twitter, as well as the use of tweet features for forecasting different kinds of events.
In this paper, we consider the methods for the analysis of Twitter trends and for detecting fake news. As fake news, we will consider the news information which is not true as well as the information which can contain real facts, but with incorrectly specified accents, and the focuses that lead to distorted conclusion and incorrect understanding of underlying processes. For our analysis, we considered informational trends caused by Russian invasion of Ukraine in 2022. In the study, we also consider the possible impact of informational trends on different companies working in Russia during this conflict.
2 News Trends on Twitter
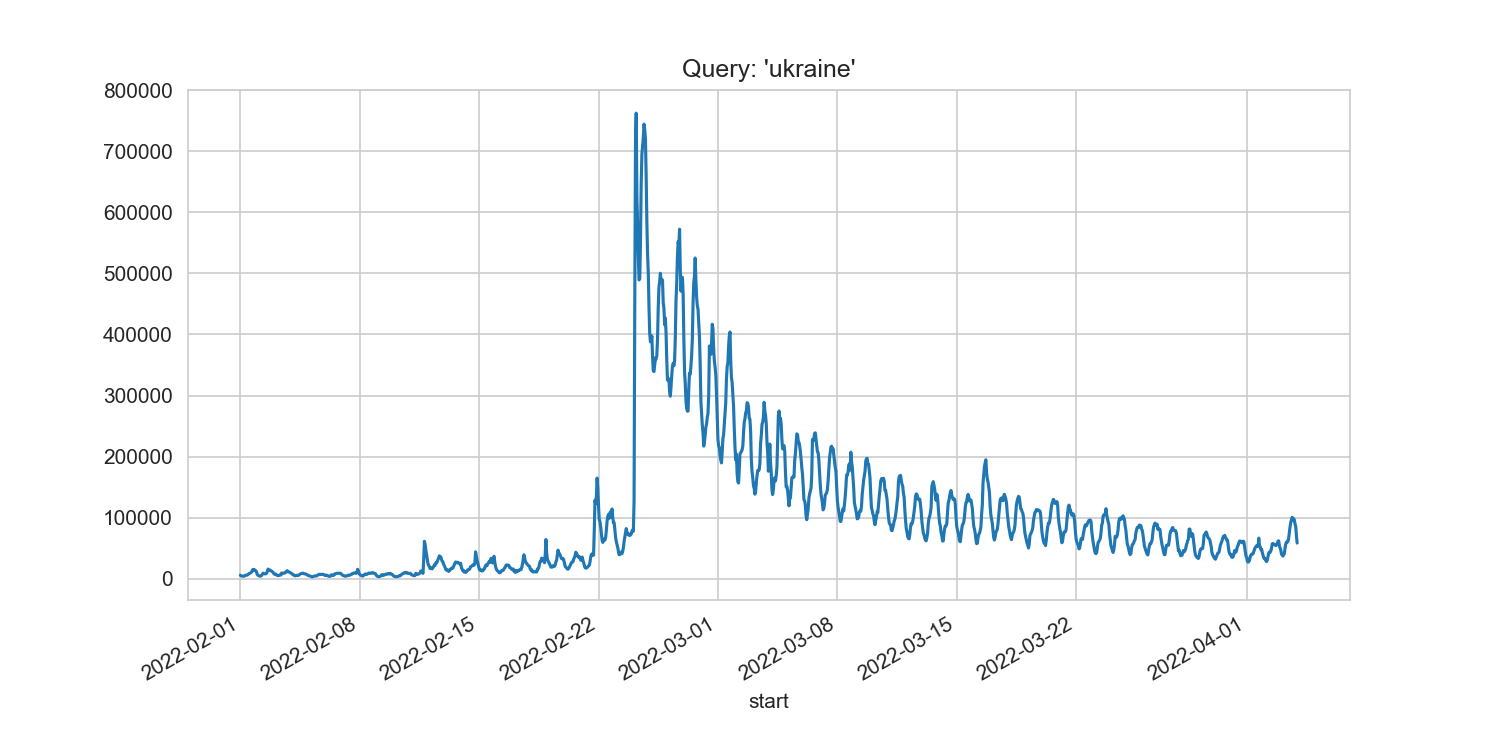
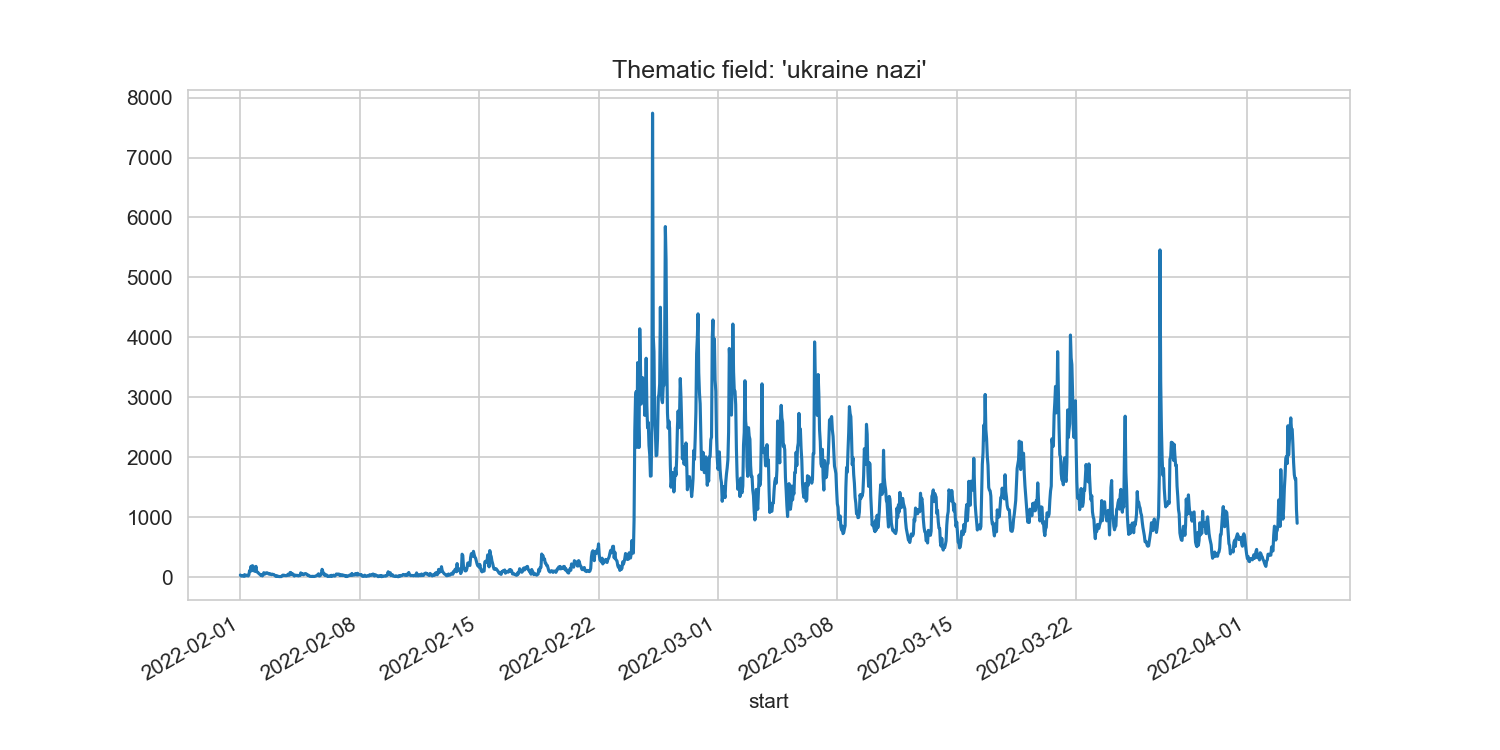
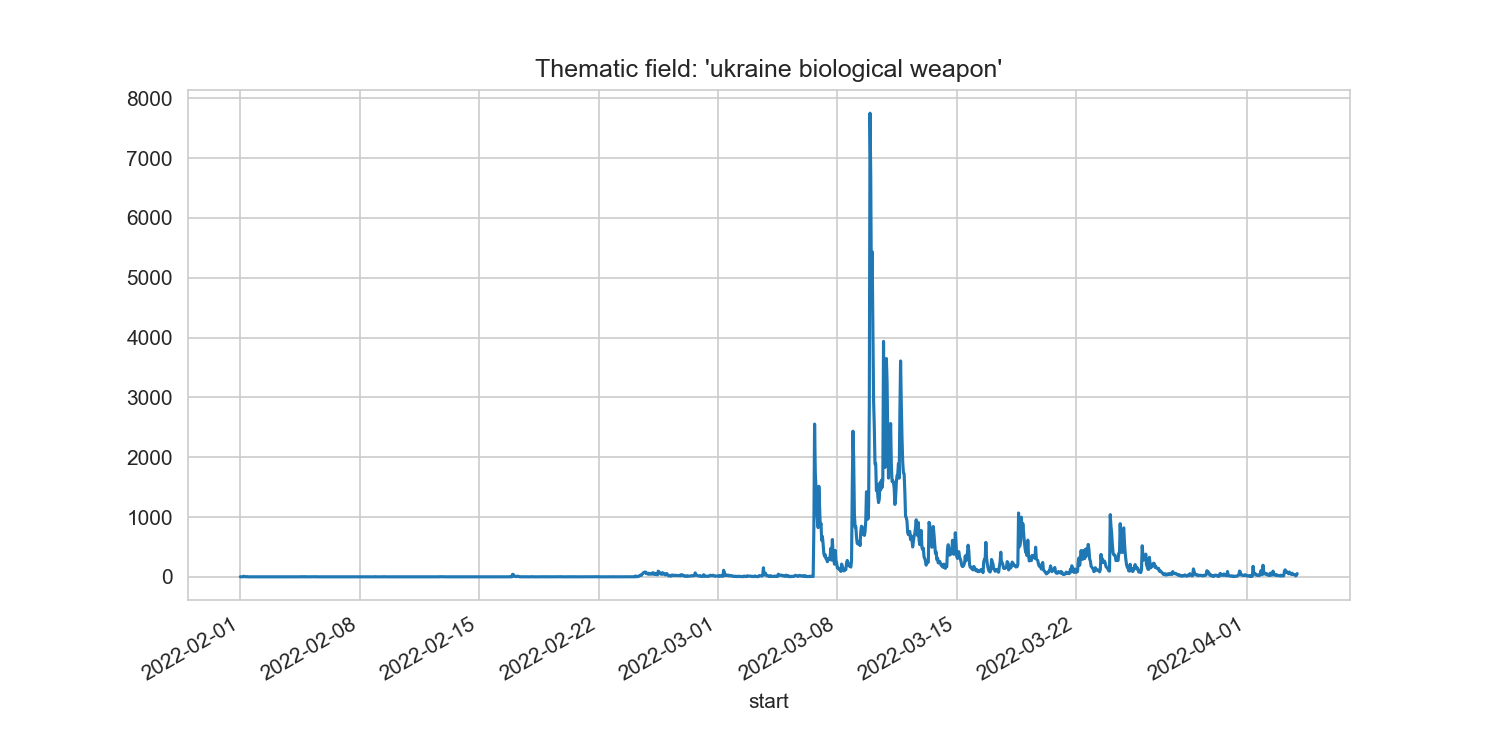
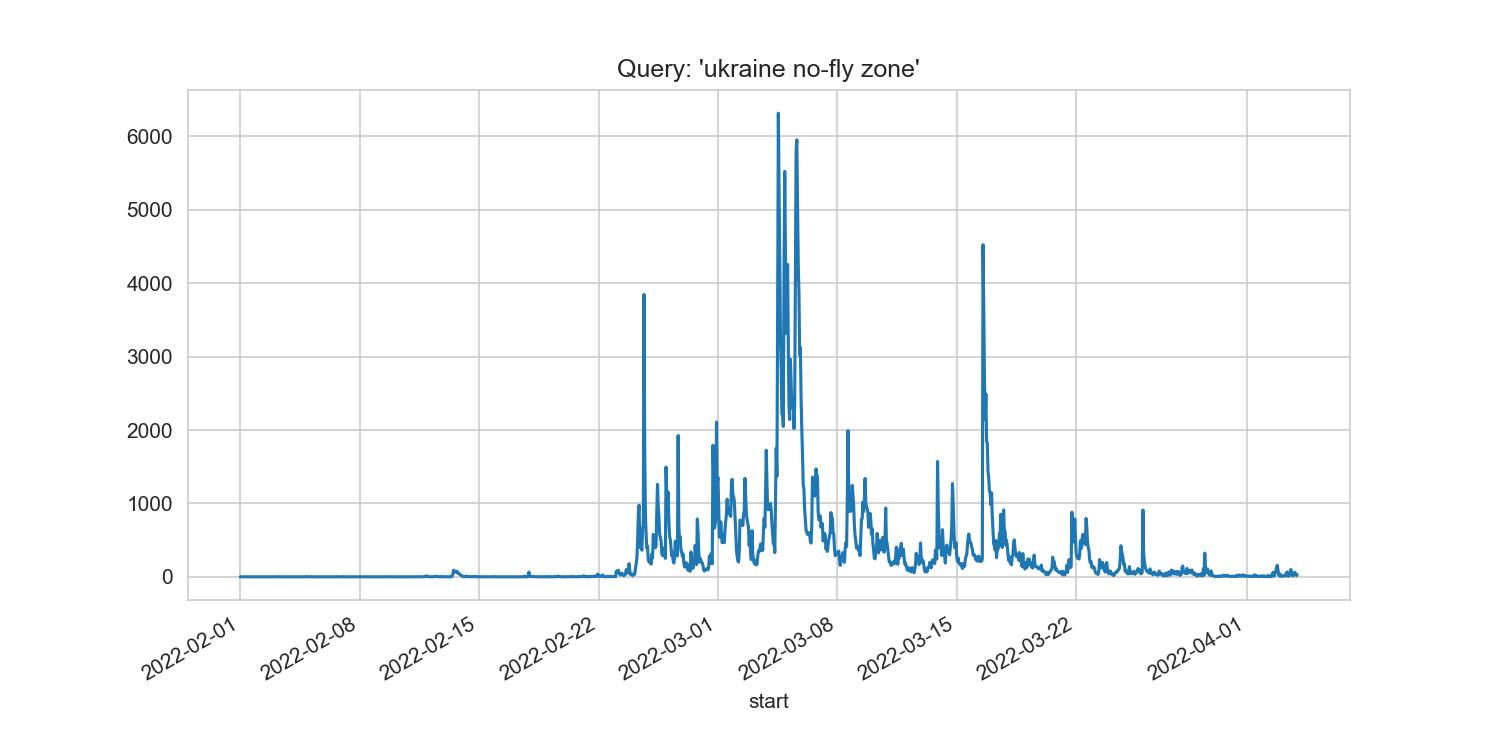
For the analysis, we used a combination of keywords related to thematic areas under consideration. The keywords related to the entity under consideration can be treated as a thematic field. The use of semantic and thematic fields for text analytics is considered in [17, 18, 19, 16]. To load tweets, we have used Twitter API v2. For the ’ukraine nazi’ thematic field the following Twitter API query "(ukraine OR ukrainian OR ukraine’s) (nazi OR nazism, nazists OR neonazi OR neo-nazi)" has been used. For the ’ukraine biological weapon’ thematic field, the query "ukraine biological (weapon OR weapons OR warfare)" has been used. For the analysis, the following main python packages were used: ’pandas’, ’matplotlib’, ’seaborn’, ’tweepy’. Figures 1-4 show the time series for tweet counts for different queries. The lower case of query keywords allows searching tweets with the keywords with both lower and upper cases. As the results show, for the ’ukraine nazi’ thematic field, the discussion of underlying problems rose dramatically after February 24, the date of Russian invasion of Ukraine. The amount of tweets related to this theme before that date was at the minimum level. That itself leads to the conclusion that the problem with nazi in Ukraine was just a formal reason to justify the invasion. Another claim of Russian propaganda was about biological weapons that were allegedly being developed in Ukrainian laboratories (Figure 3). For instance, it was claimed that a special virus was being developed and it was meant to be distributed through bats and migratory birds.
3 Deep Learning Approach for Fake News Detection
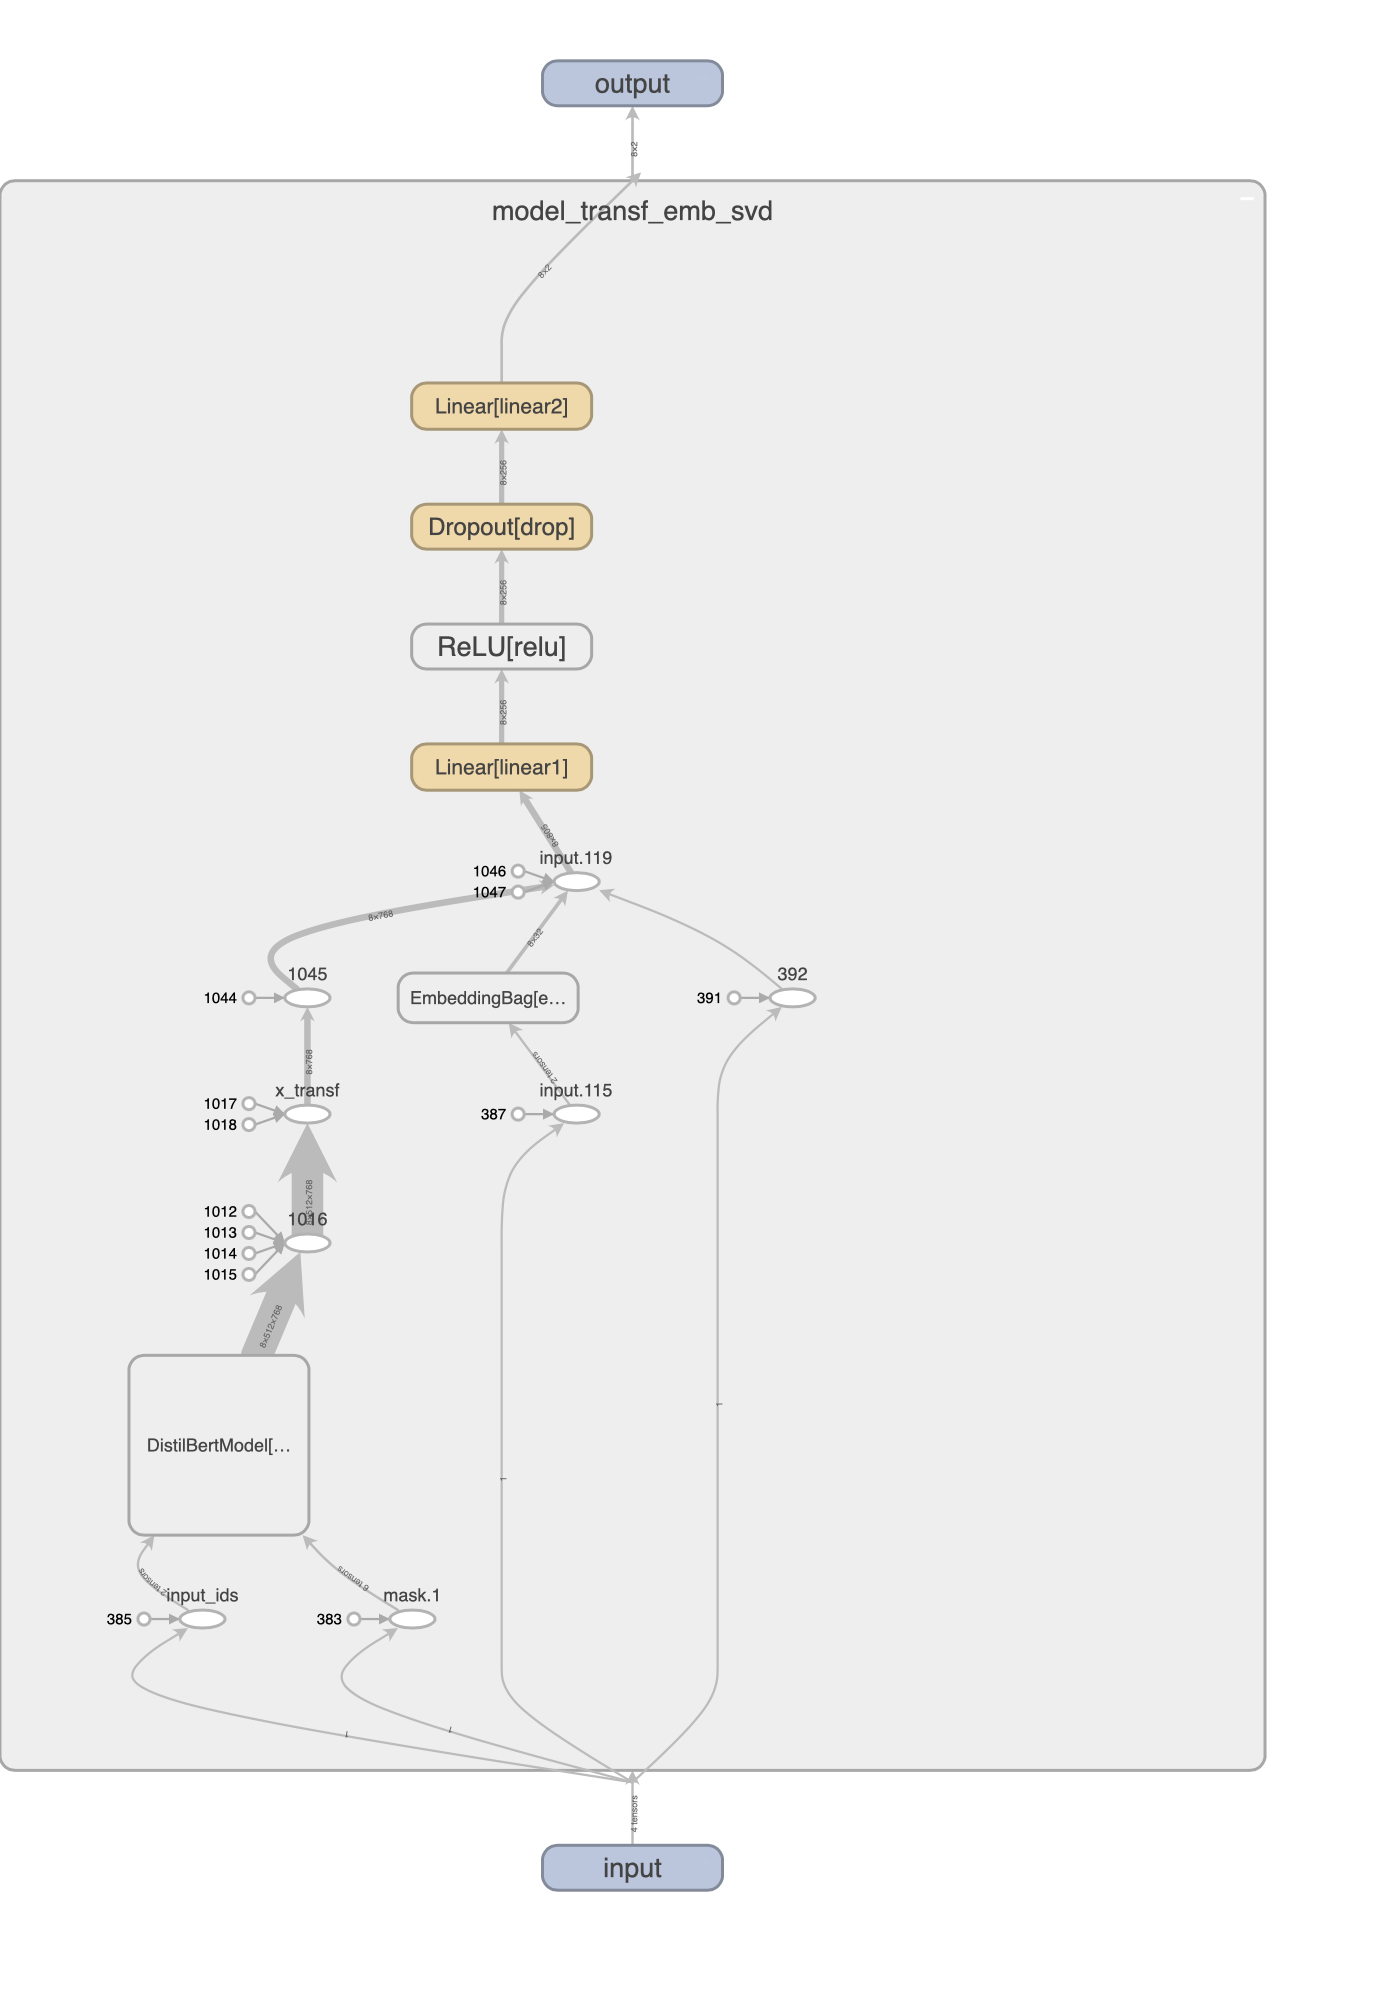
Fake news can be detected and revealed by analyzing facts and comparing them with reality and other news sources. Let us consider the methods which make it possible to detect fake news automatically. It is not easy to develop an AI system which can analyze the facts. But for manipulative news, it is typical to amplify them artificially in different ways, e.g. by retweeting manipulative tweets many times using different users’ accounts. Some accounts can be bots which were artificially created, others can belong to real users. It makes it possible to detect fake news using an approach which analyzes the patterns of users’ behavior. Also, fake news have specific patterns in the text of messages. Both users’ behavior and text patterns can be captured by deep machine learning algorithms. As the features for a predictive model, we used tweet texts and the list of users’ usernames who retweeted those tweets. For model developing, evaluation and prediction, the Python framework ’pytorch’ was used. The ML model consists of several concatenated neural subnetworks: subnetwork with DistilBERT transformer which ingests tokens of tweet text,s subnetwork with the embedding layer with averaging which ingests the mixture of encoded words of tweet texts and lists of usernames of retweeters, as well as a subnetwork for the components of truncated singular value decomposition of TF-IDF matrix for the list of usernames of retweeters. Figure 5 shows the structure of the deep learning model for fake and manipulative news detection. For our case study, the loaded tweets with the thematic fields ’ukraine nazi’ and ’ukraine biological weapon’ were used. For the model training and evaluation, the tweet datasets with a specified list of users who retweeted those tweets were created. For the analysis, only the tweets with a specified threshold for retweet counts were included. The dataset was labeled using an appropriate tweet id, usernames, hashtags of tweets which can be treated as fake or manipulative. Figure 6 shows model evaluation results on the validation dataset.

The examples of tweets which were recognized by the deep learning model as fake or manipulation news for the thematic fields ’ukraine nazi’ and ’ukraine biological weapon’ are at [20].
4 Detecting Artificially Generated News
One of the ways to form manipulative trends is to produce artificially created news tweet messages [21, 22, 23], e.g. by paraphrasing an initial text using Seq2Seq neural network models. For this purpose, GPT-2, and BART transformers can be used. Each pretrained transformer has its own patterns for generating texts using an encoder-decoder approach. These patterns can be detected by other transformers which are fine-tuned on a dataset with an artificialy generated text. For the model fine-tuning, a TweepFake dataset of artificially generated texts [22] was used. The framework ’pytorch’ was used for the model developing and evaluation. We tried two models – the neural network with the DistilBERT transformer layer and the neural network with the concatenation of the DistilBERT transformer with embedding layers for the usernames of users who post tweets. Figures 7, 8 show the model evaluation on the validation dataset for these two models.
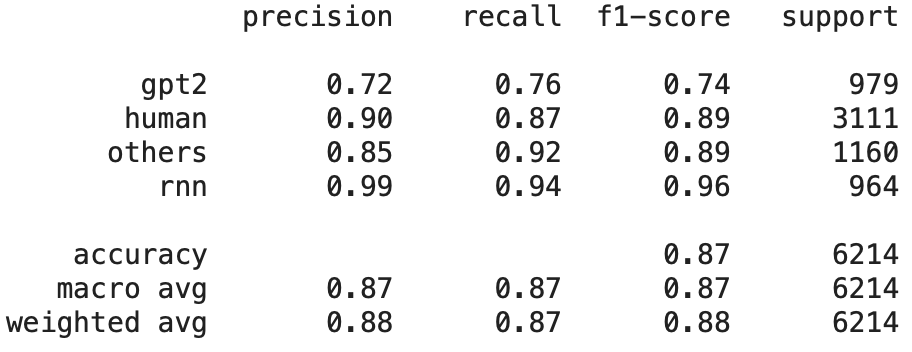
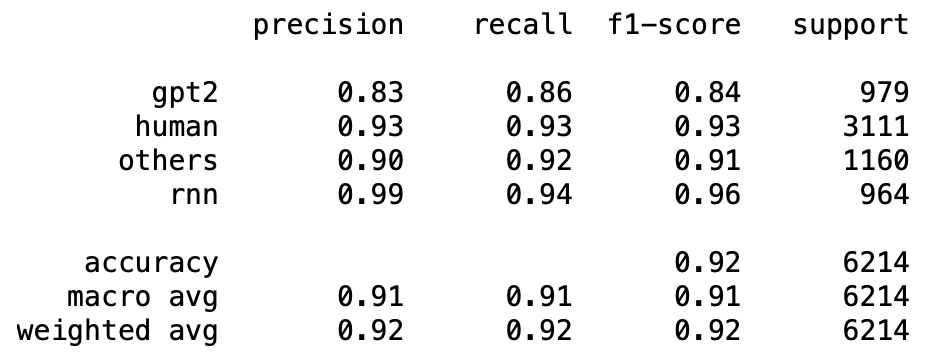
As the results show, the embedding layer for usernames can improve accuracy scores, it means that usernames have predictive potential for detecting artifitially created tweets. We applied the fine-tuned model to the datasets of tweets of the semantic fields under consideration and have received the following results: human - 80%, GPT-2-10%, RNN - 0.3%, Others - 3%.
5 The Impact of the Discussion About Company’s Behavior On Its Stock Prices
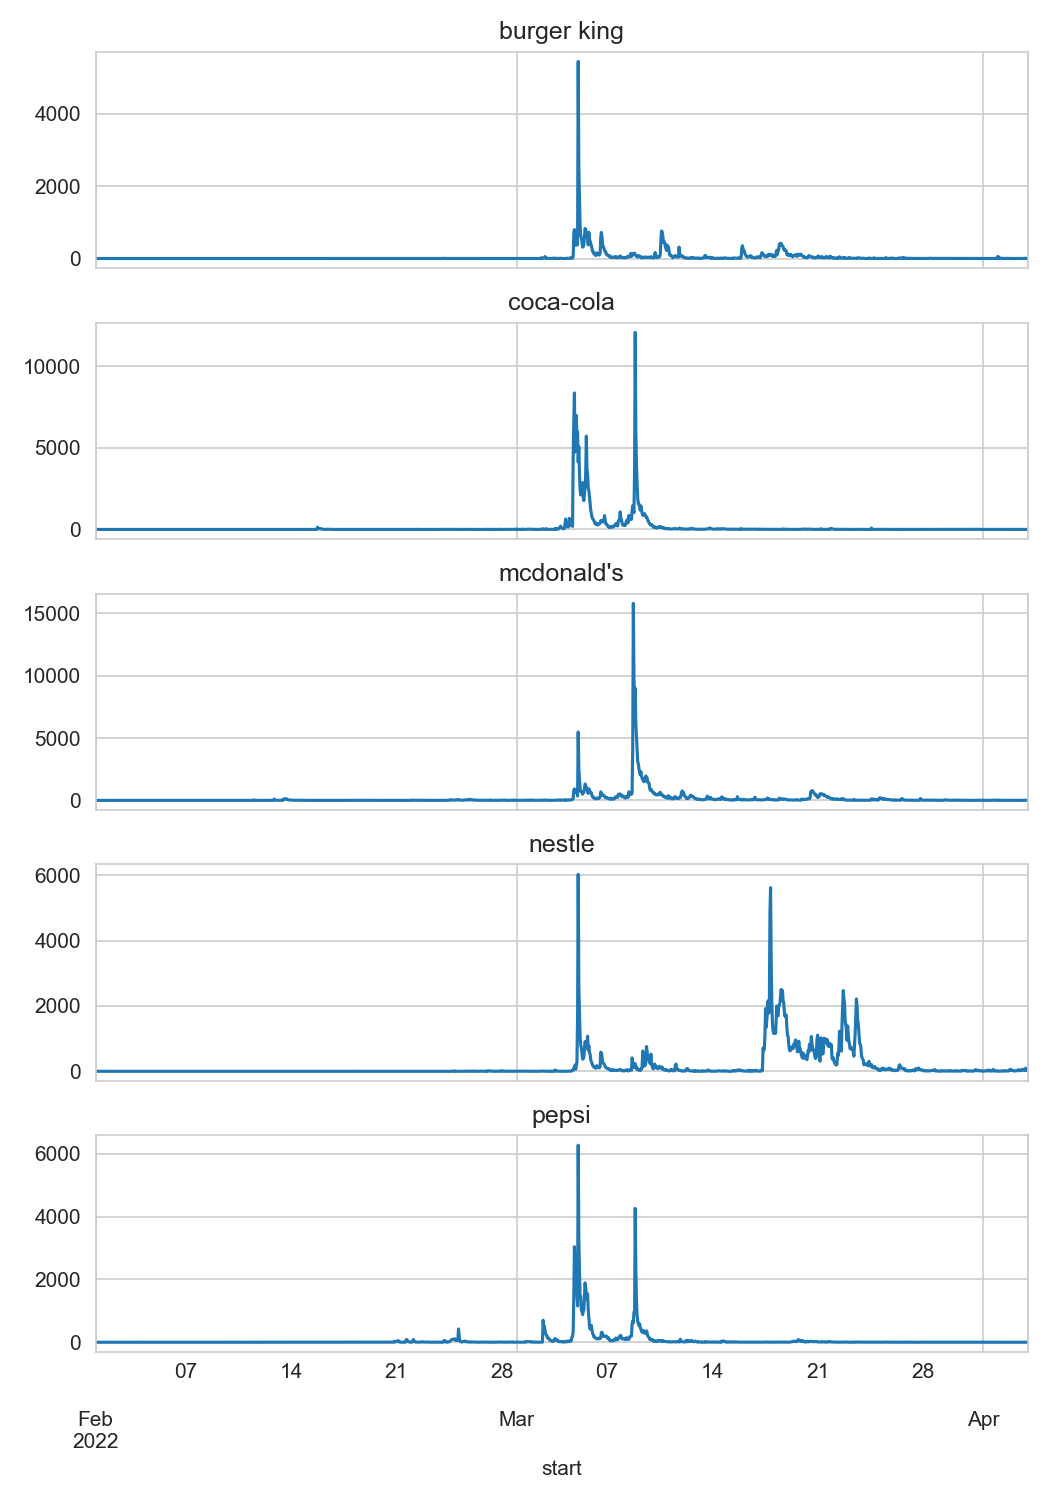
Russian invasion of Ukraine has huge impact on users’ attitude to different companies and shapes discussion trends on Twitter. Figure 9 shows time series for tweet counts related to the consideration of different companies in Russia during Russian invasion of Ukraine. For the case study, let us consider McDonald’s. Figure 10 shows the tweet counts in the trend of considering this company, a rolling mean of this time series, with a 7-day window and stock price for the ’MCD’ ticker for the McDonald’s company.
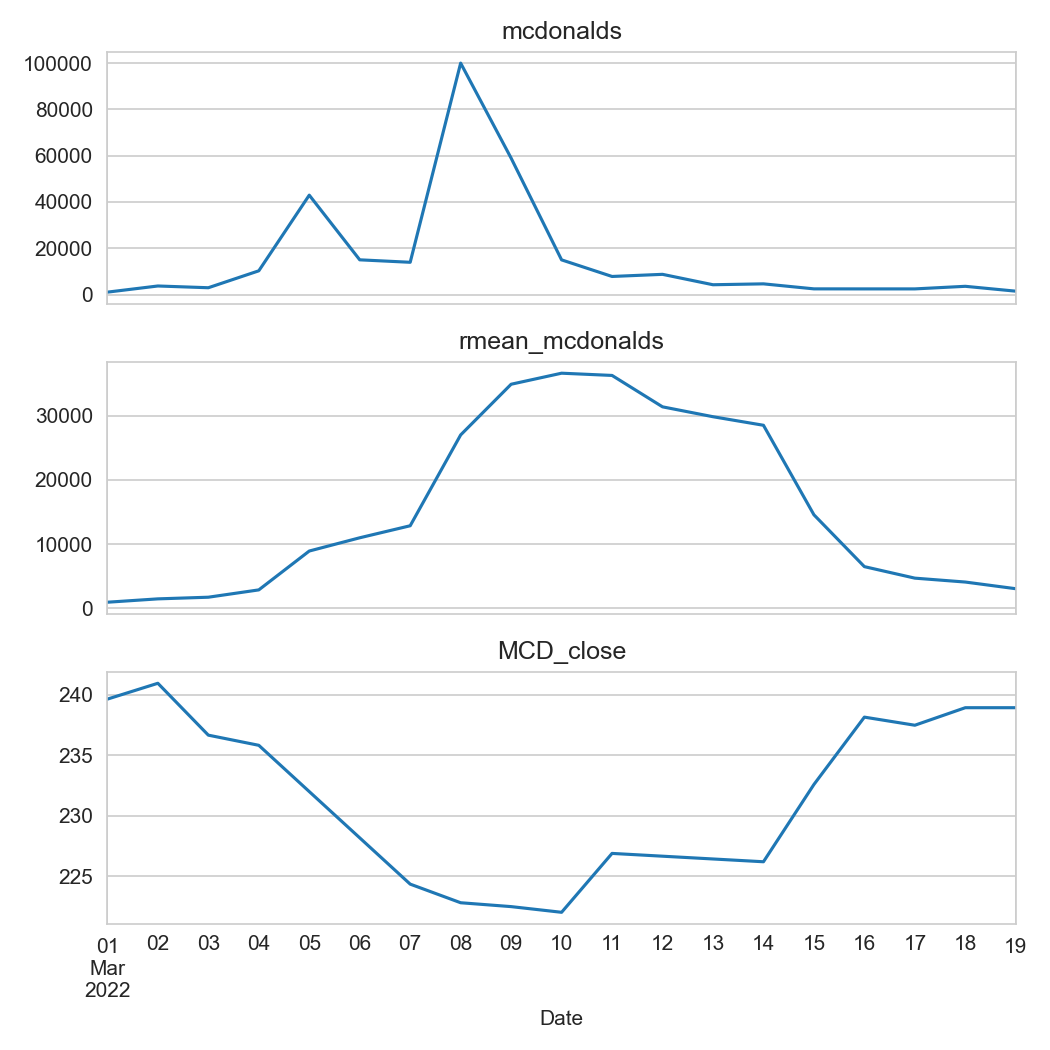
As a result of public discussion, it is known that McDonald’s has stopped its activity in Russia. After this announcement, the stock price for the ’MCD’ ticker has returned to almost initial price value before the invasion period (Figure 10). The stock price time series for the ’MCD’ ticker were loaded using Python package ’yfinance’. It shows that public consideration of a company’s behavior which is reflected on the social networks can have impact on the stock market. It is supposed that consideration has some cumulative effect, that is why the rolling mean of the time series of tweet counts corresponds more precisely to company’s stock prices on the stock market. Let us analyze the dependency of stock prices on the tweet counts rolling mean. It is important to estimate the uncertainty of such dependency. For the modeling of such a dependency, the Bayesian regression was applied. The probabilistic model can be considered as follows:
| (1) |
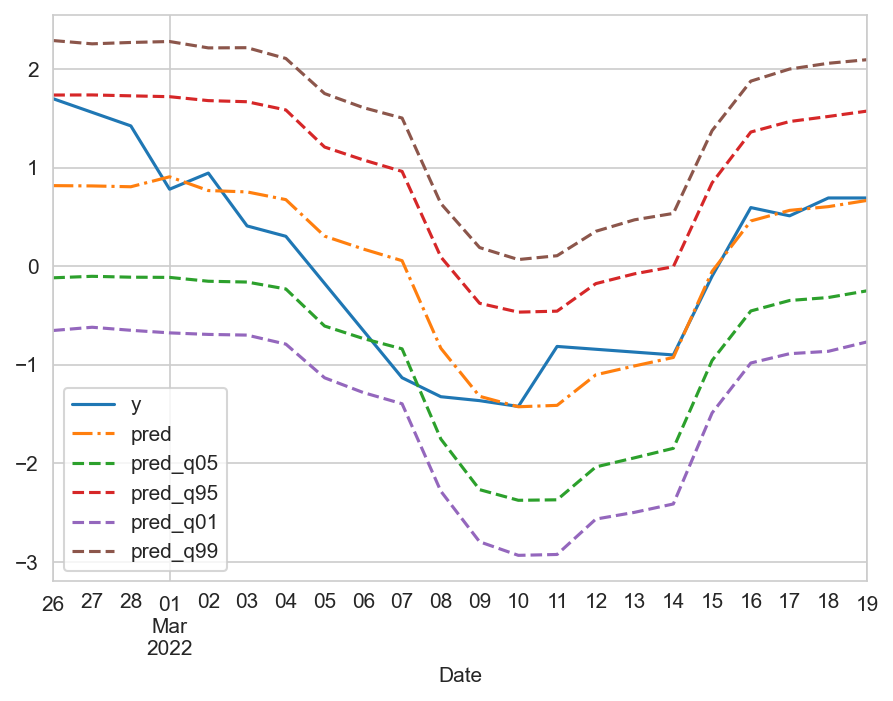
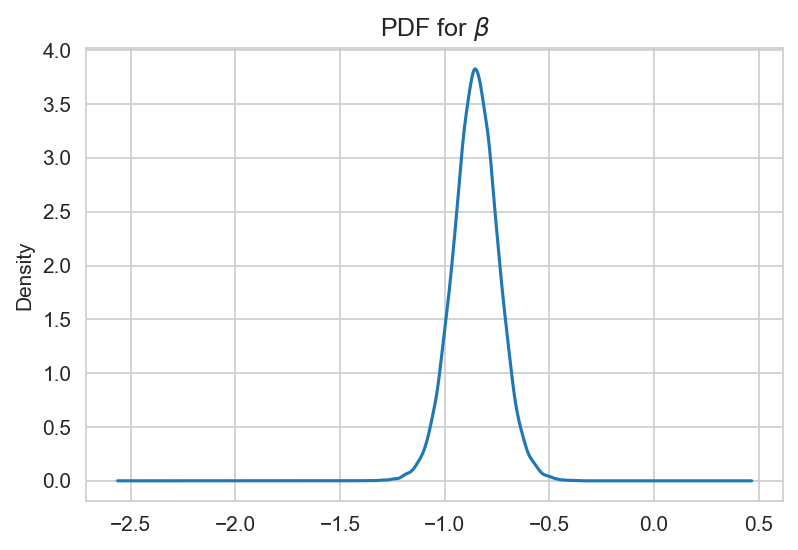
where is a distribution parameter, known as degrees of freedom. Target variable is described by Student’s t-distribution which has fat tails that makes it possible to take into account extreme events and values that enable us to estimate uncertainties more accurately. For Bayesian inference calculations, we used a Python package ’pystan’ for Stan platform for statistical modeling [24]. For the analysis, as a feature independent variable, we used z-scores for the rolling mean of tweet counts time series, as a target variable, we used z-scores for stock price for ’MCD’ ticker. As a result of sampling, the mean value as well as quantiles 0.01, 0.05, 0.95, 0.99 for the target variable were calculated. Figure 11 shows the results of modeling. Figure 12 shows the probability density function for parameter. Quantile 0.05 for predicted target variable can be treated as the value of risk (VaR) that is a quantitative characteristic for risk assessment.
6 Analysis of Tweets Using Frequent Itemsets
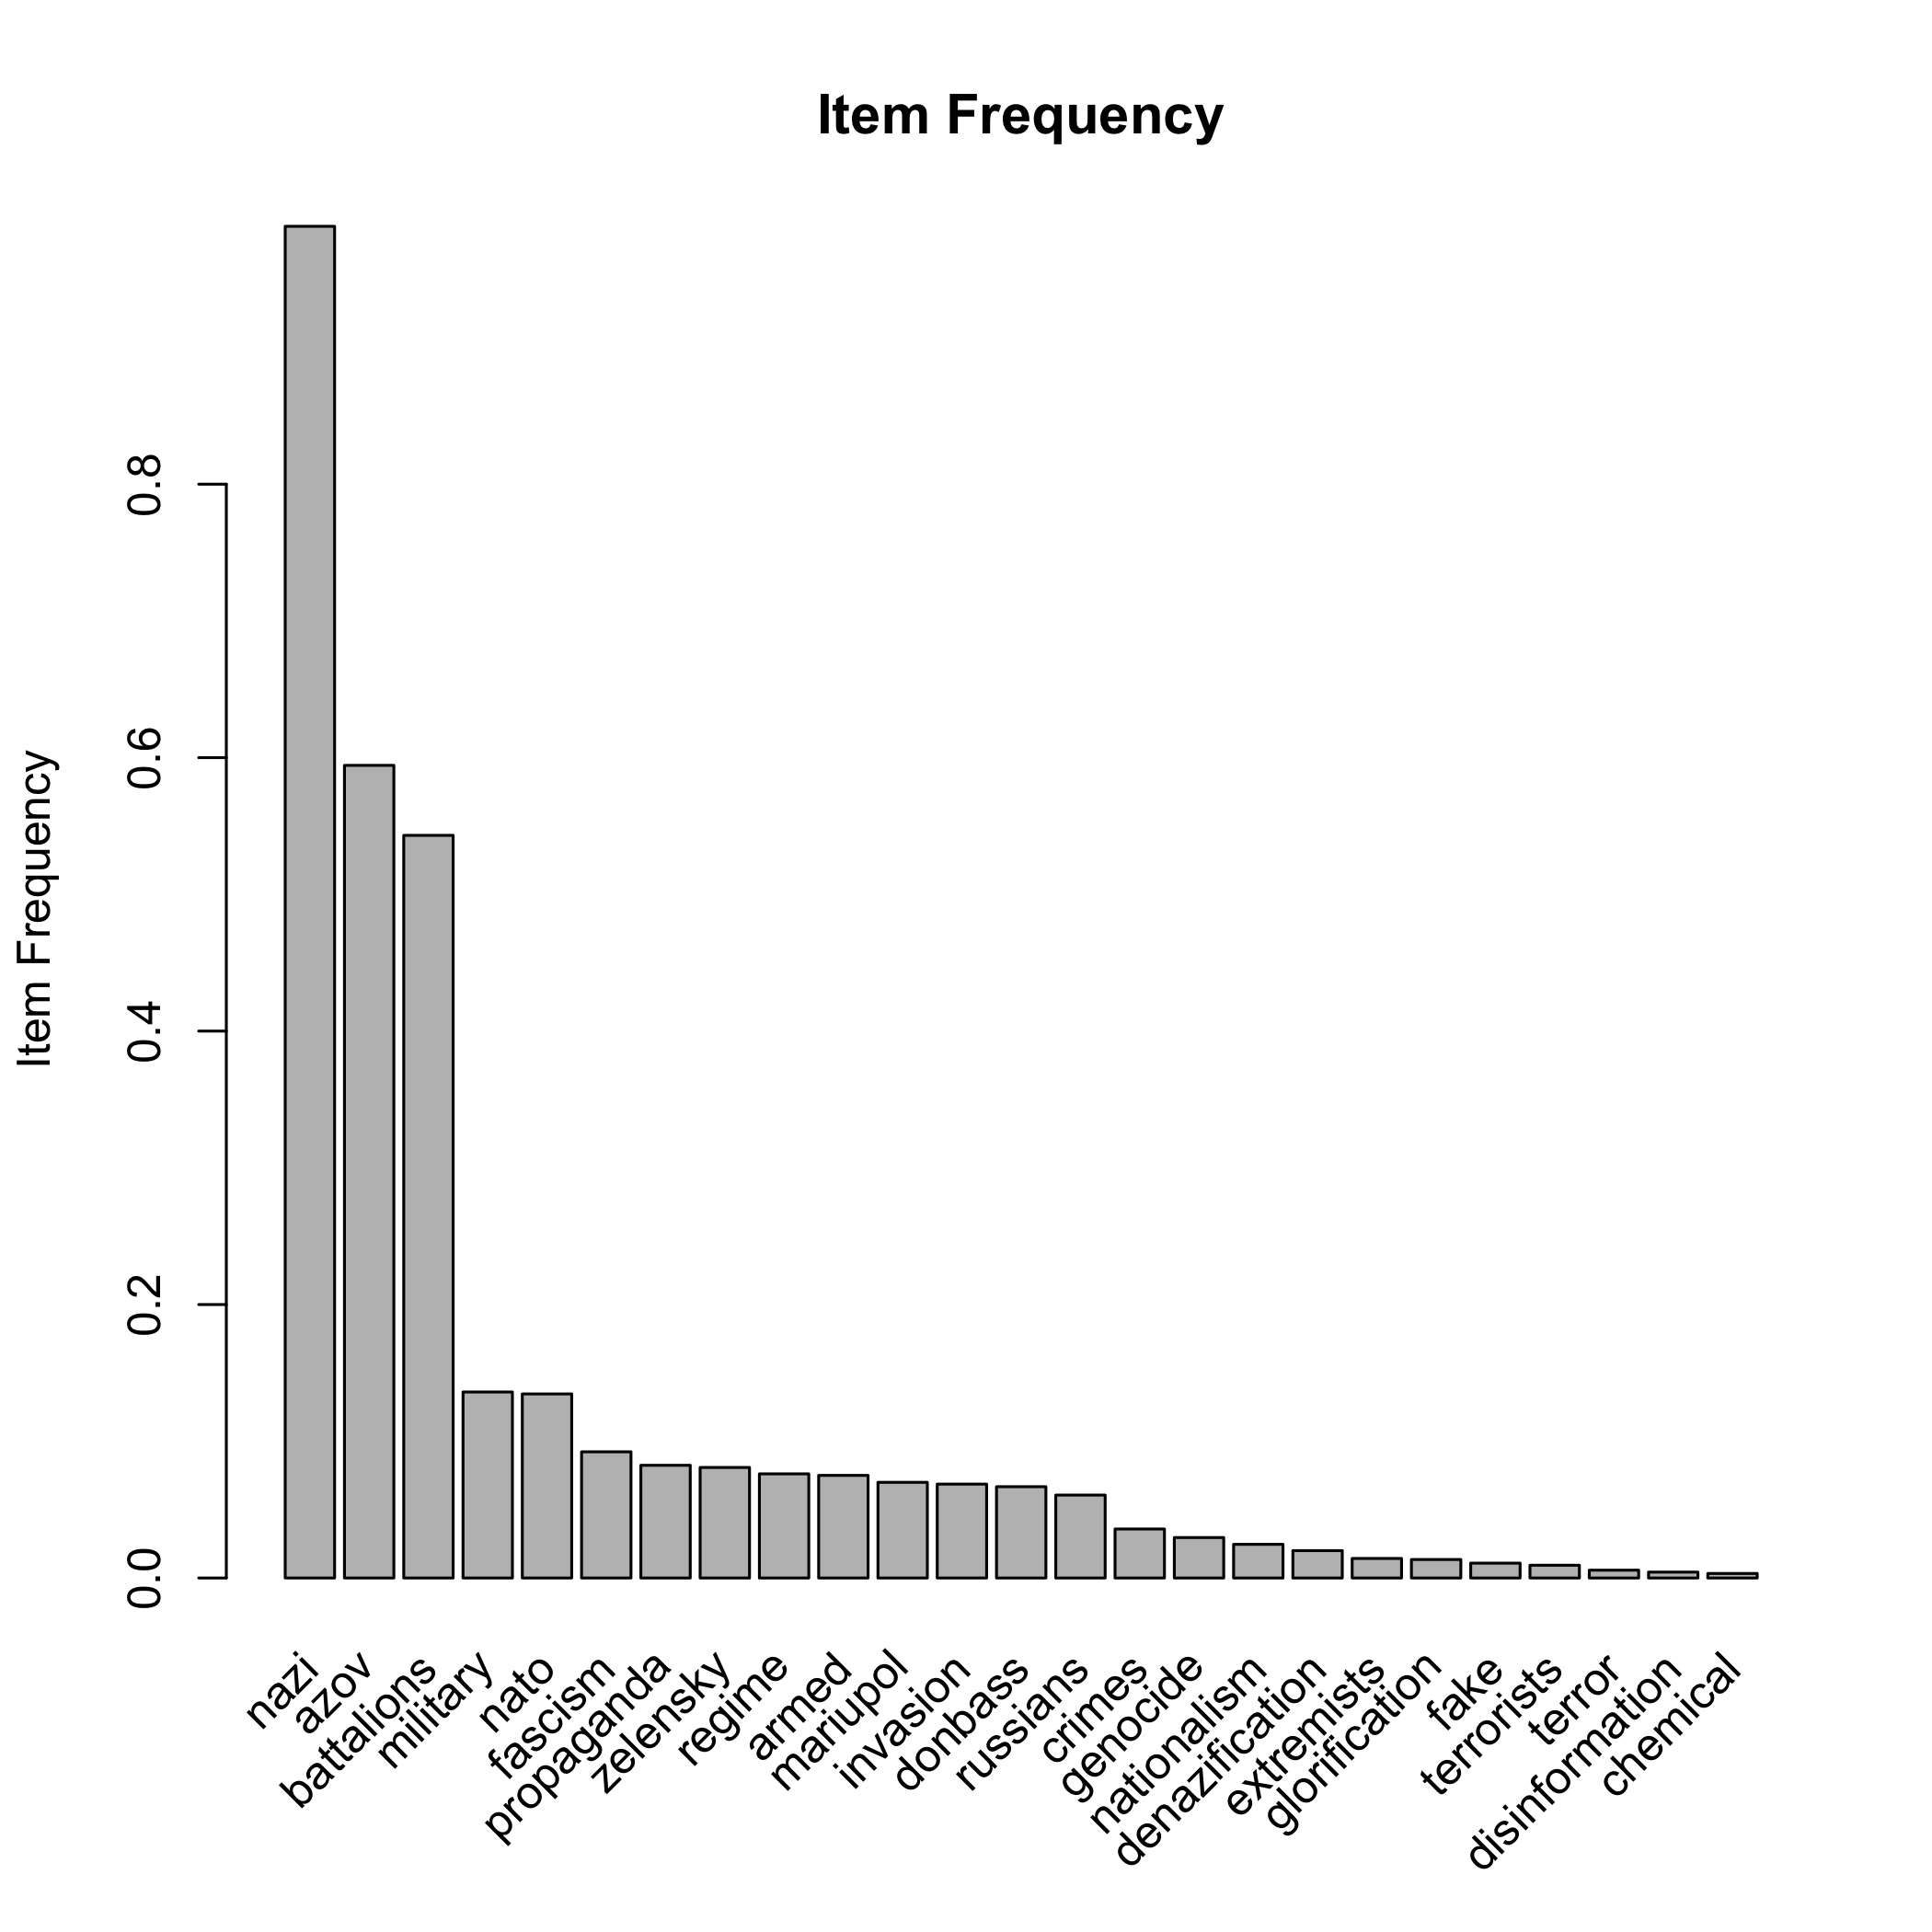
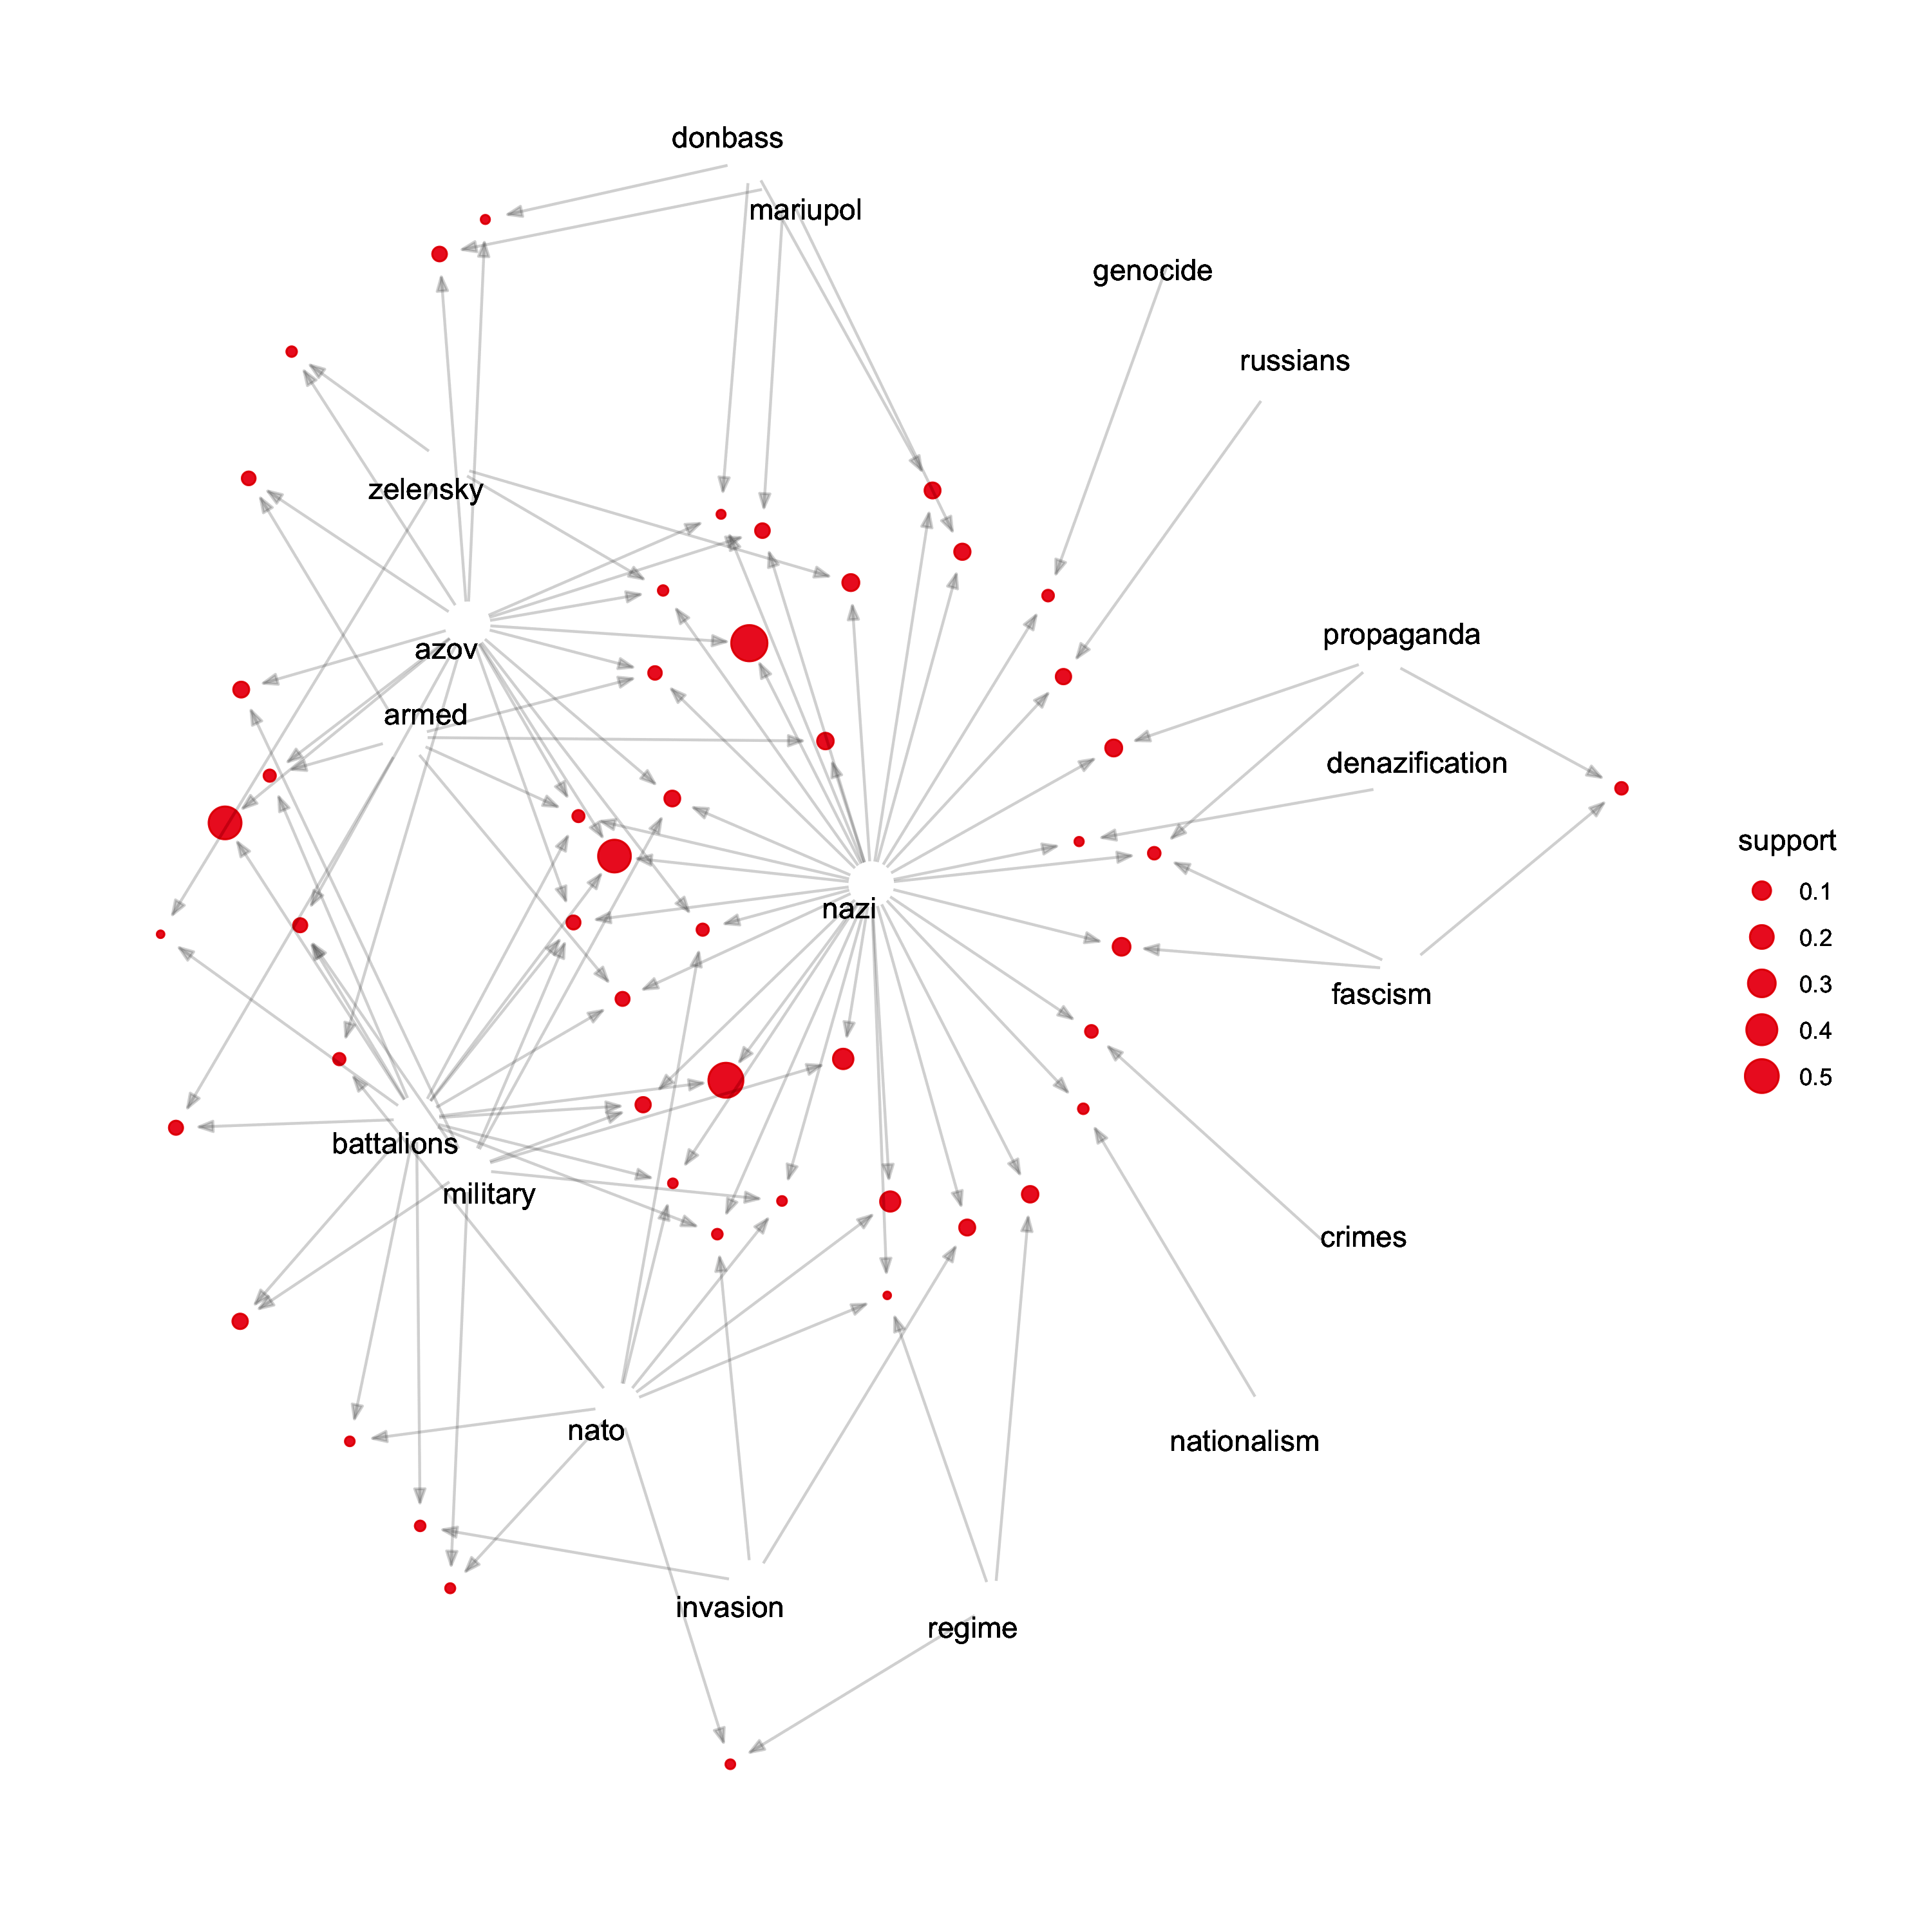
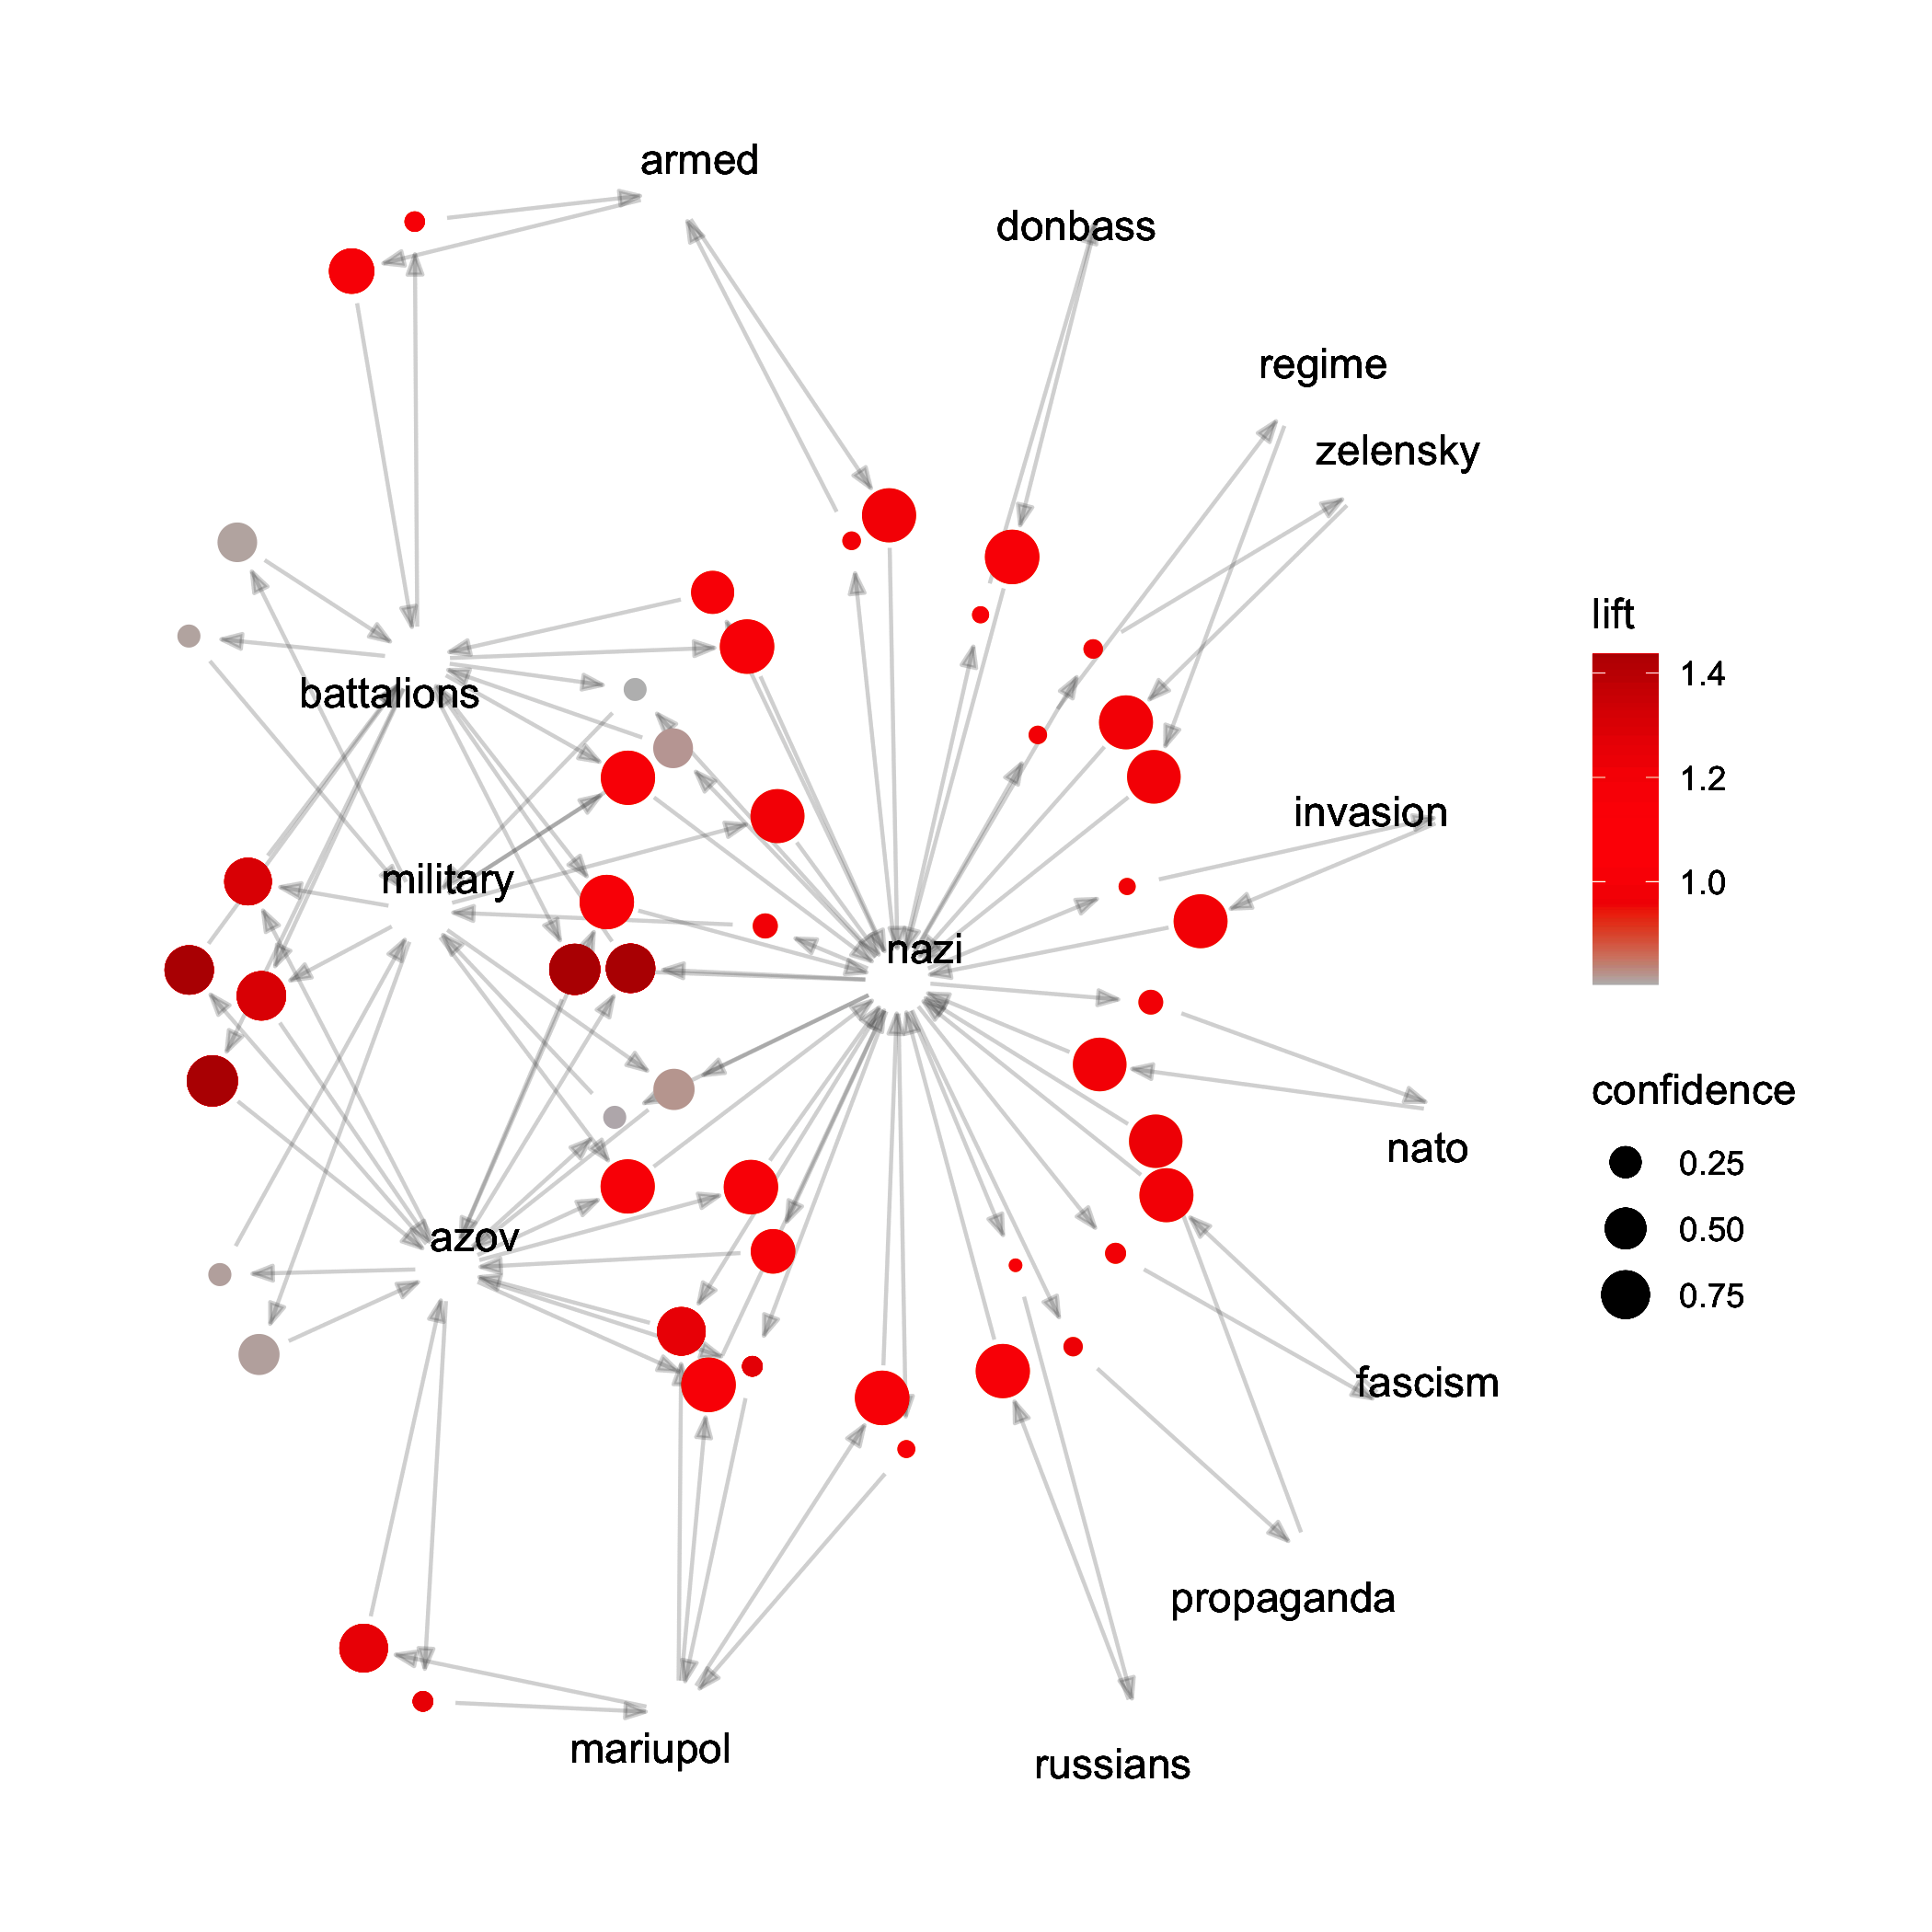
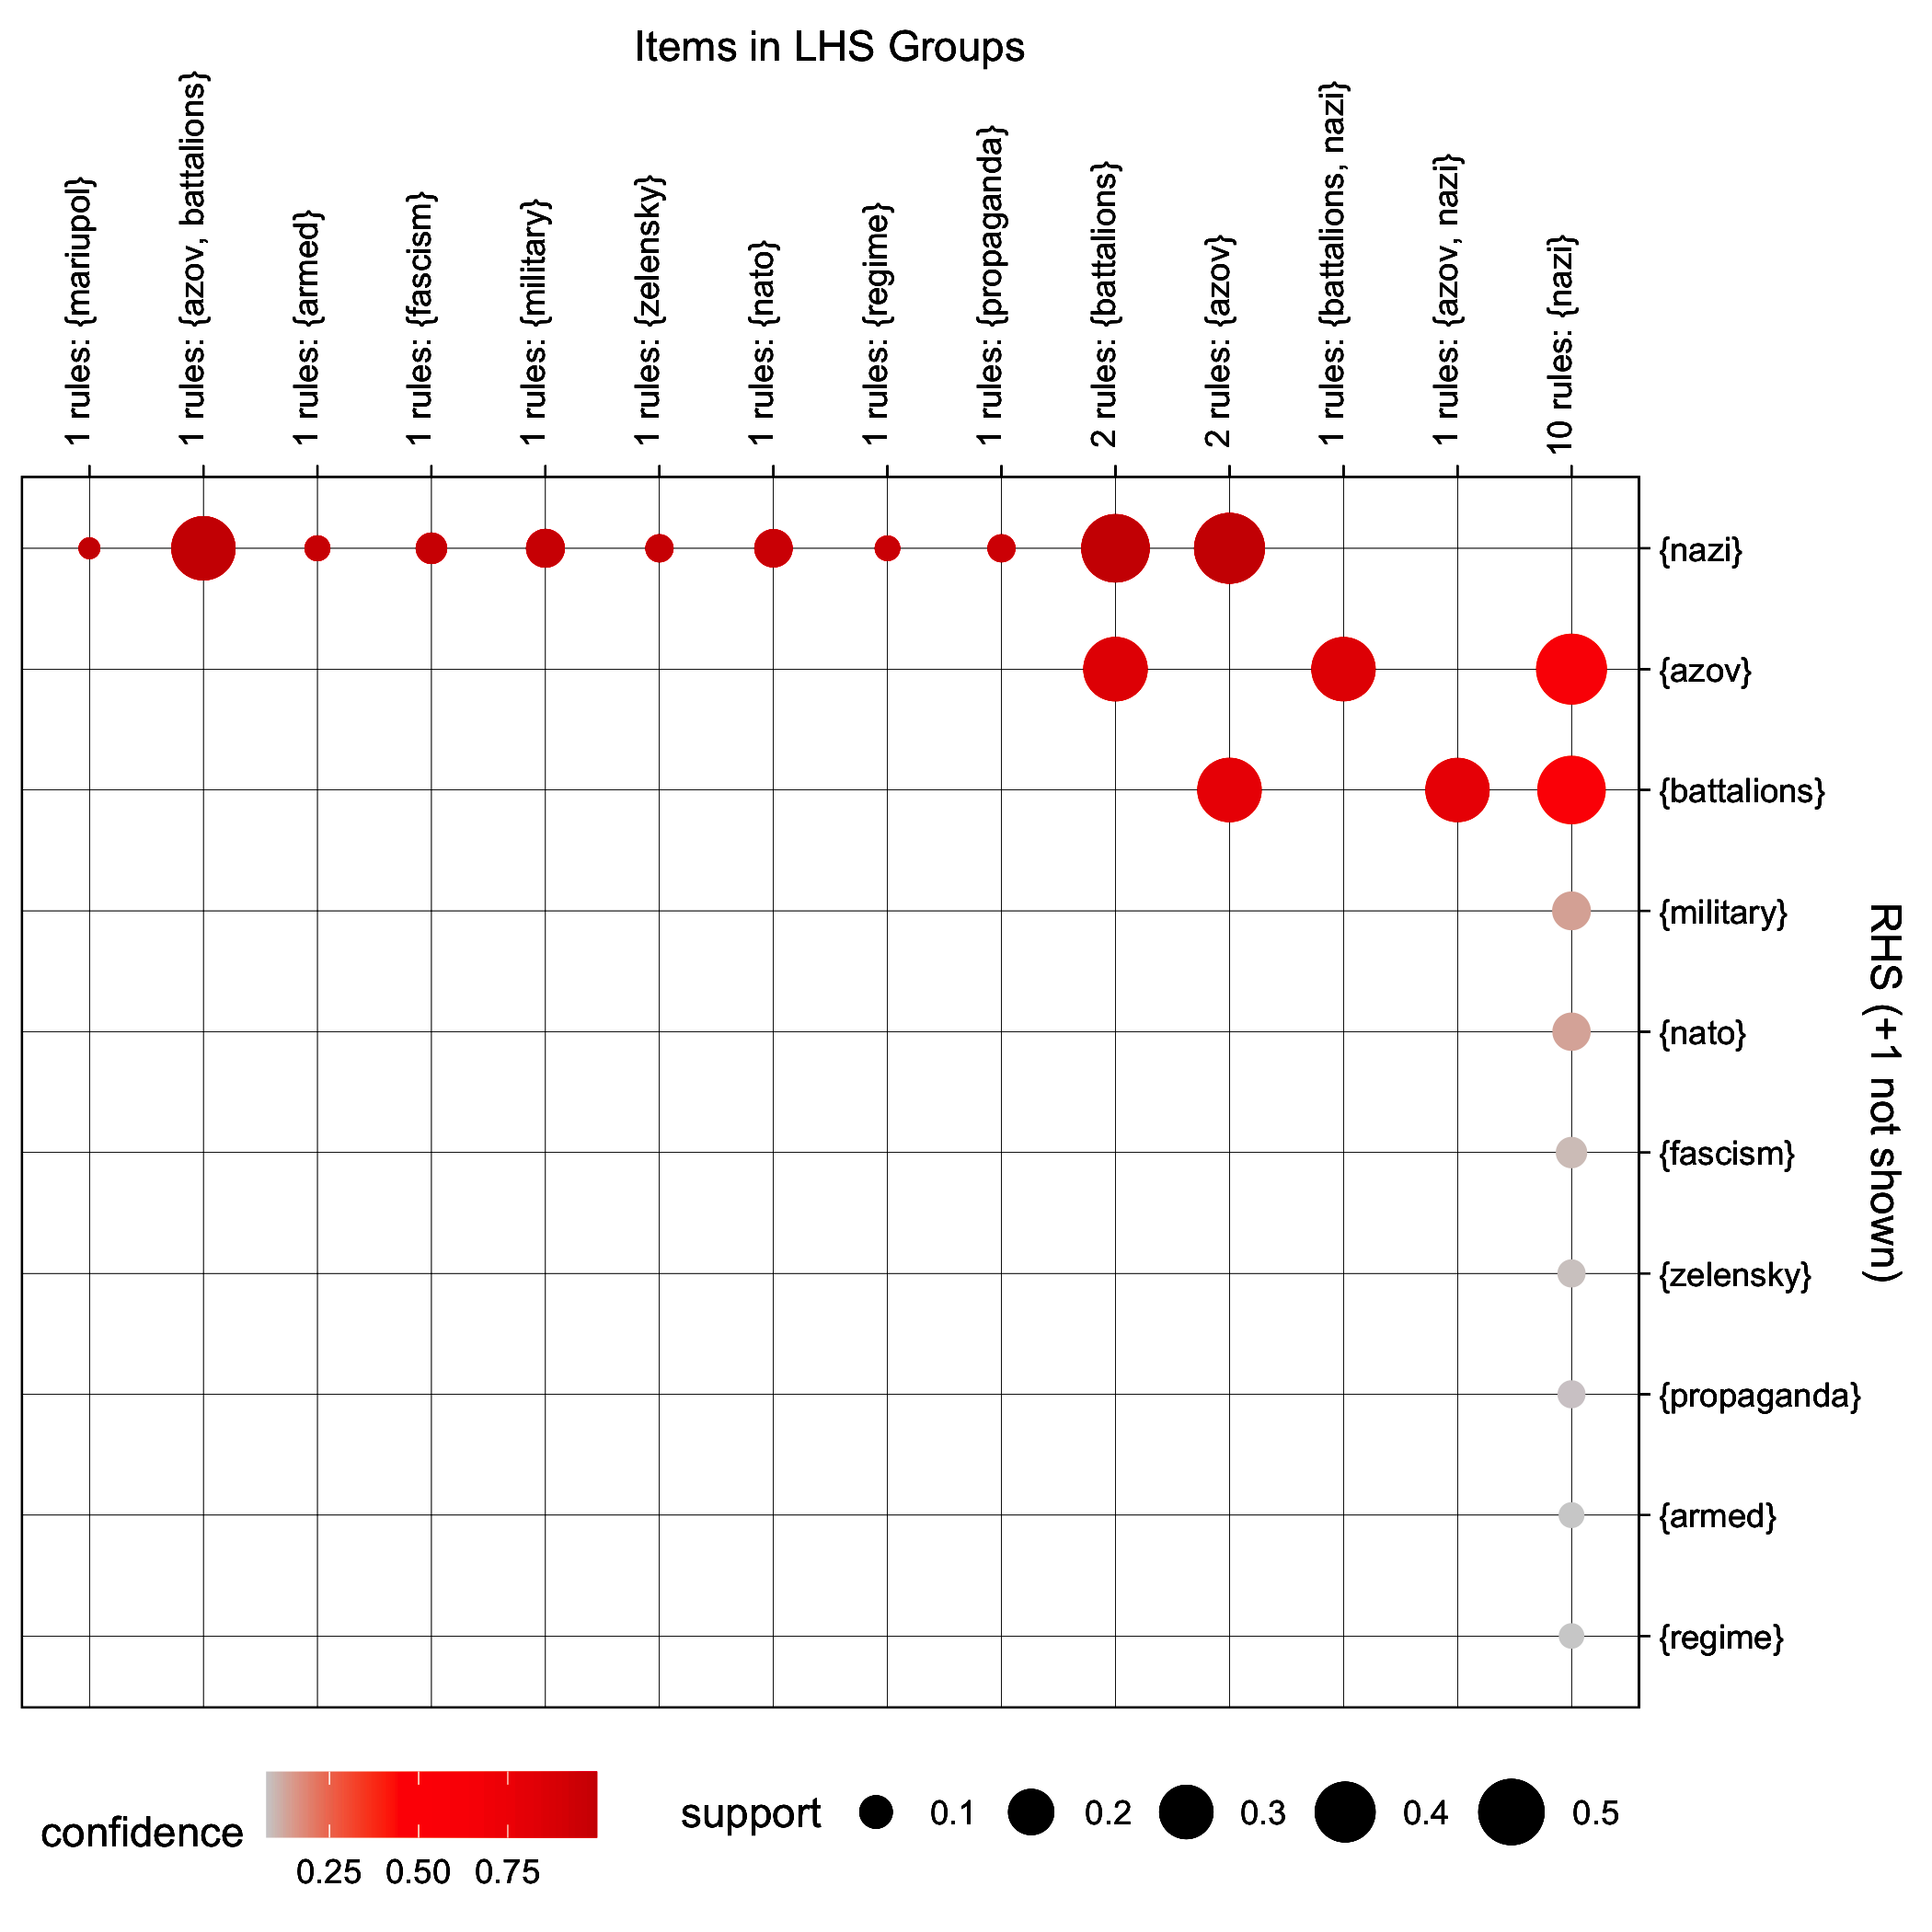
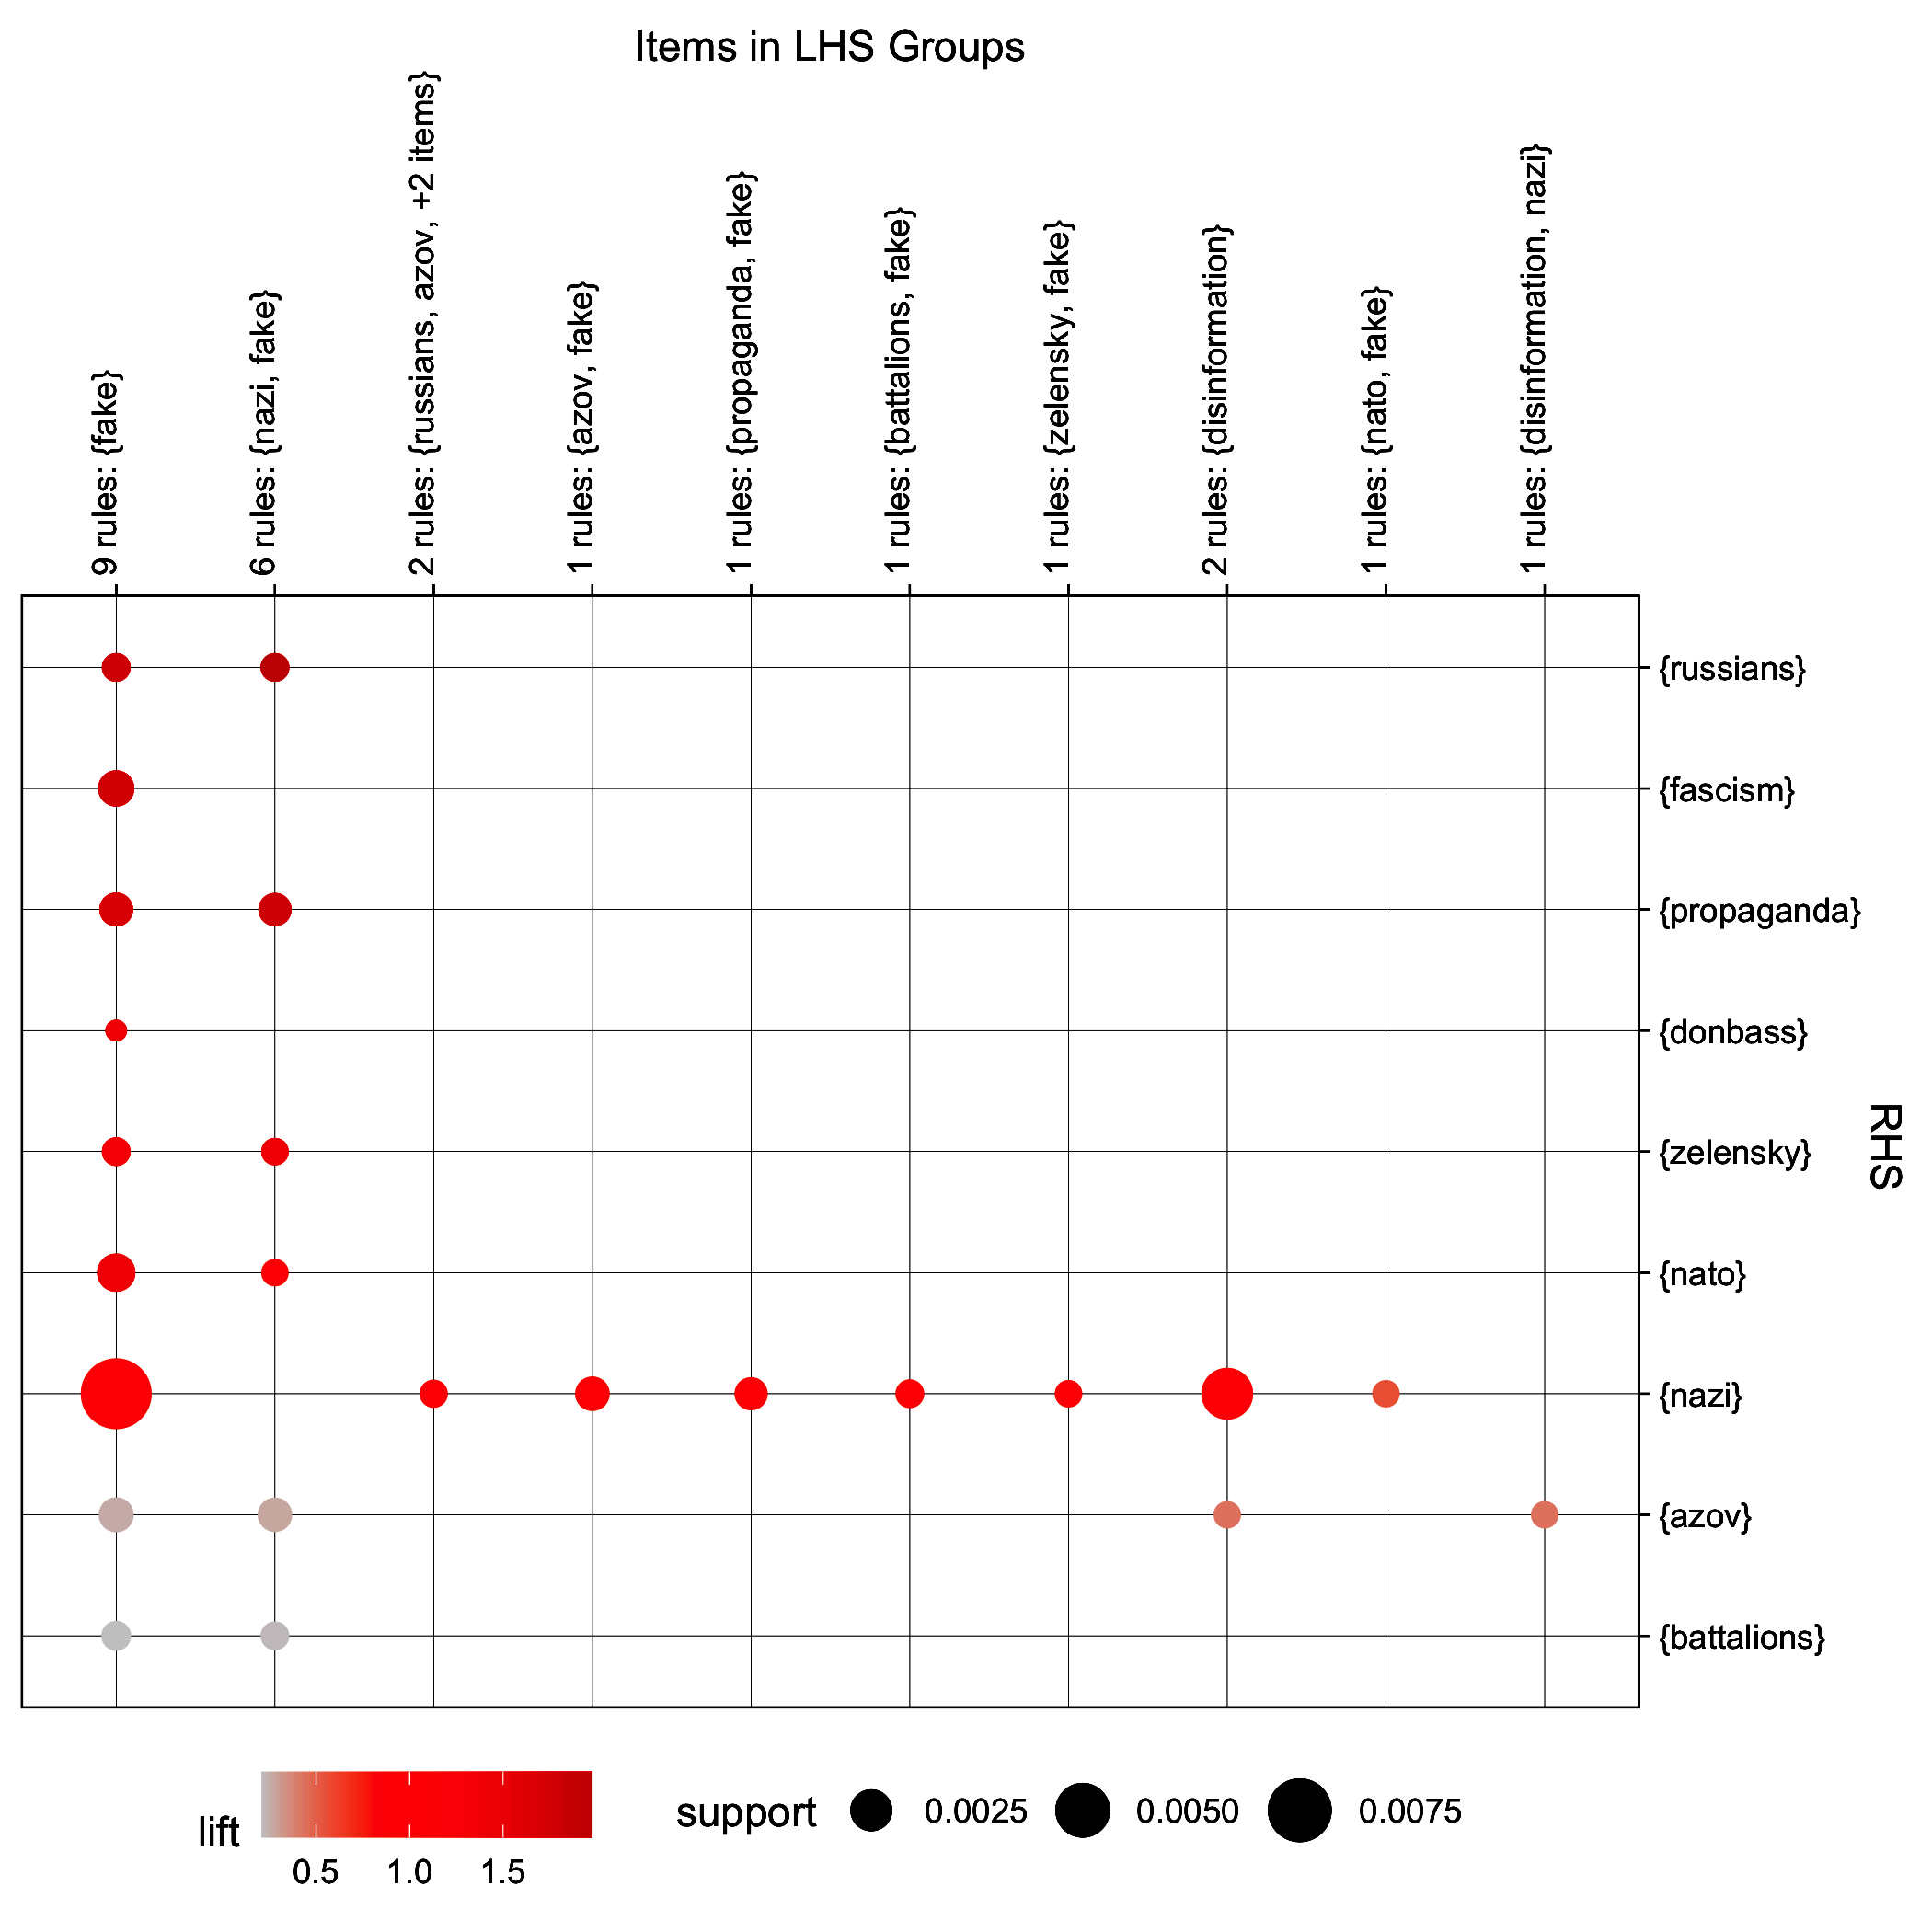
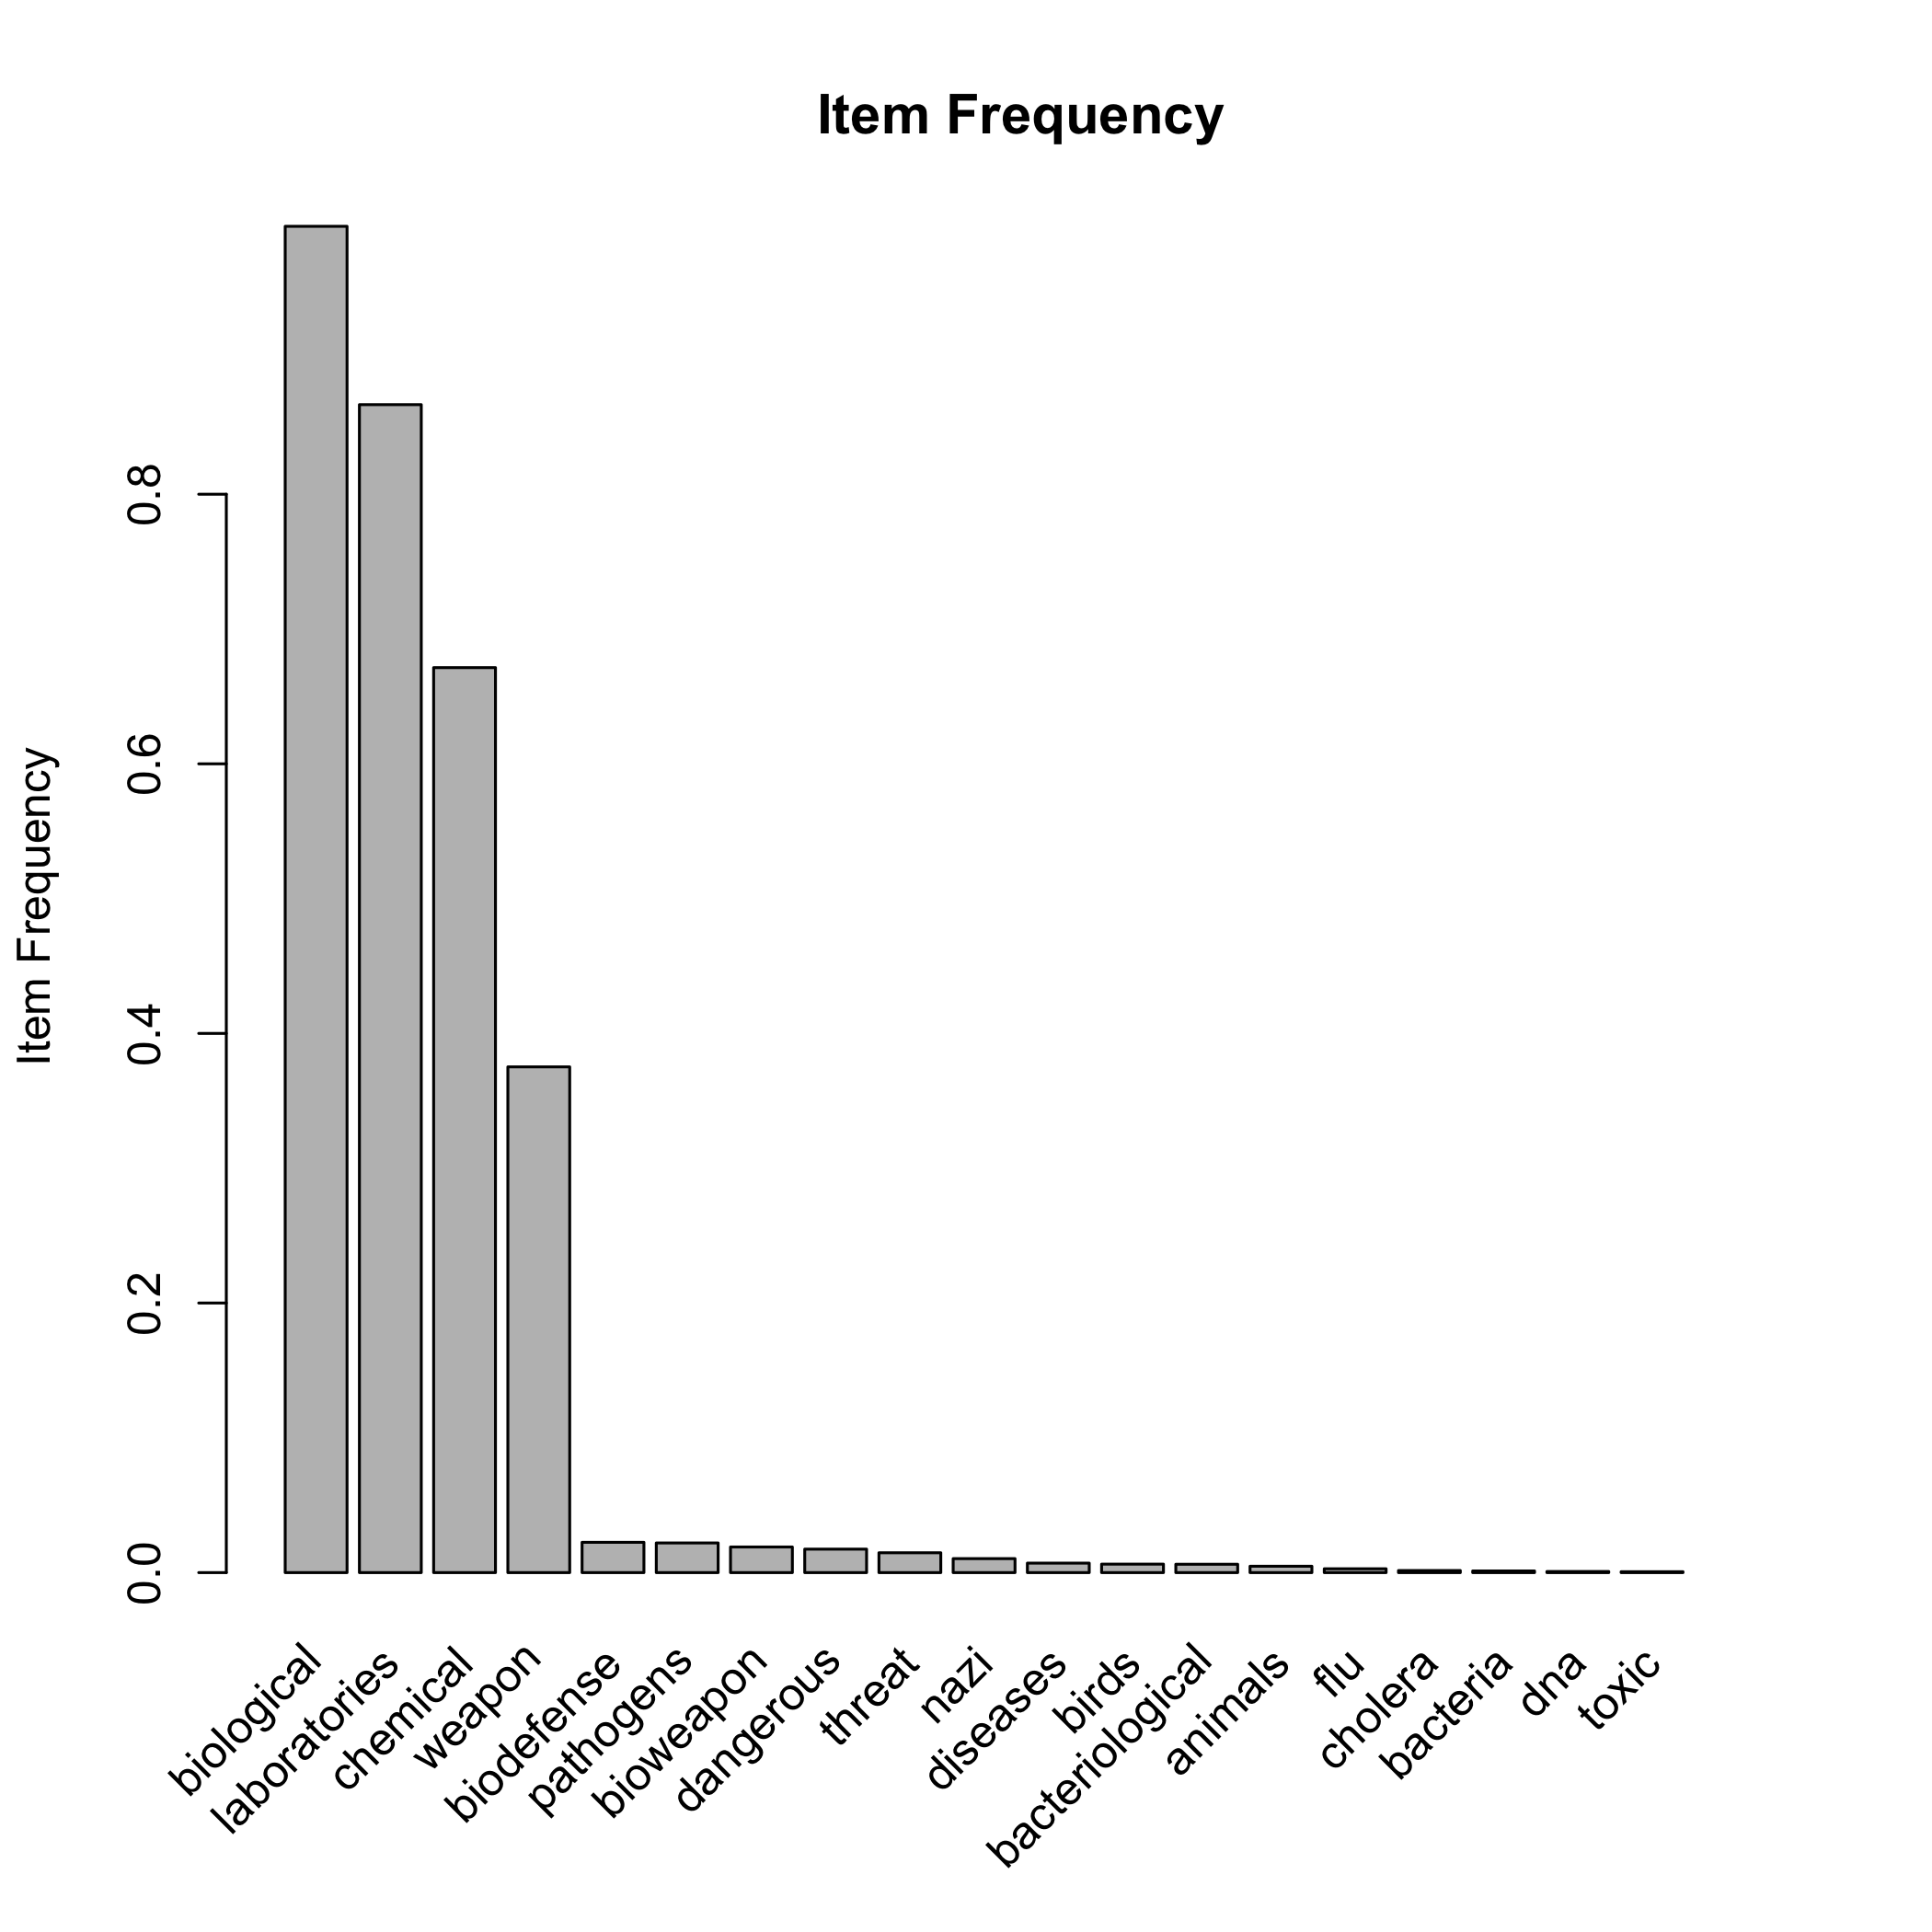
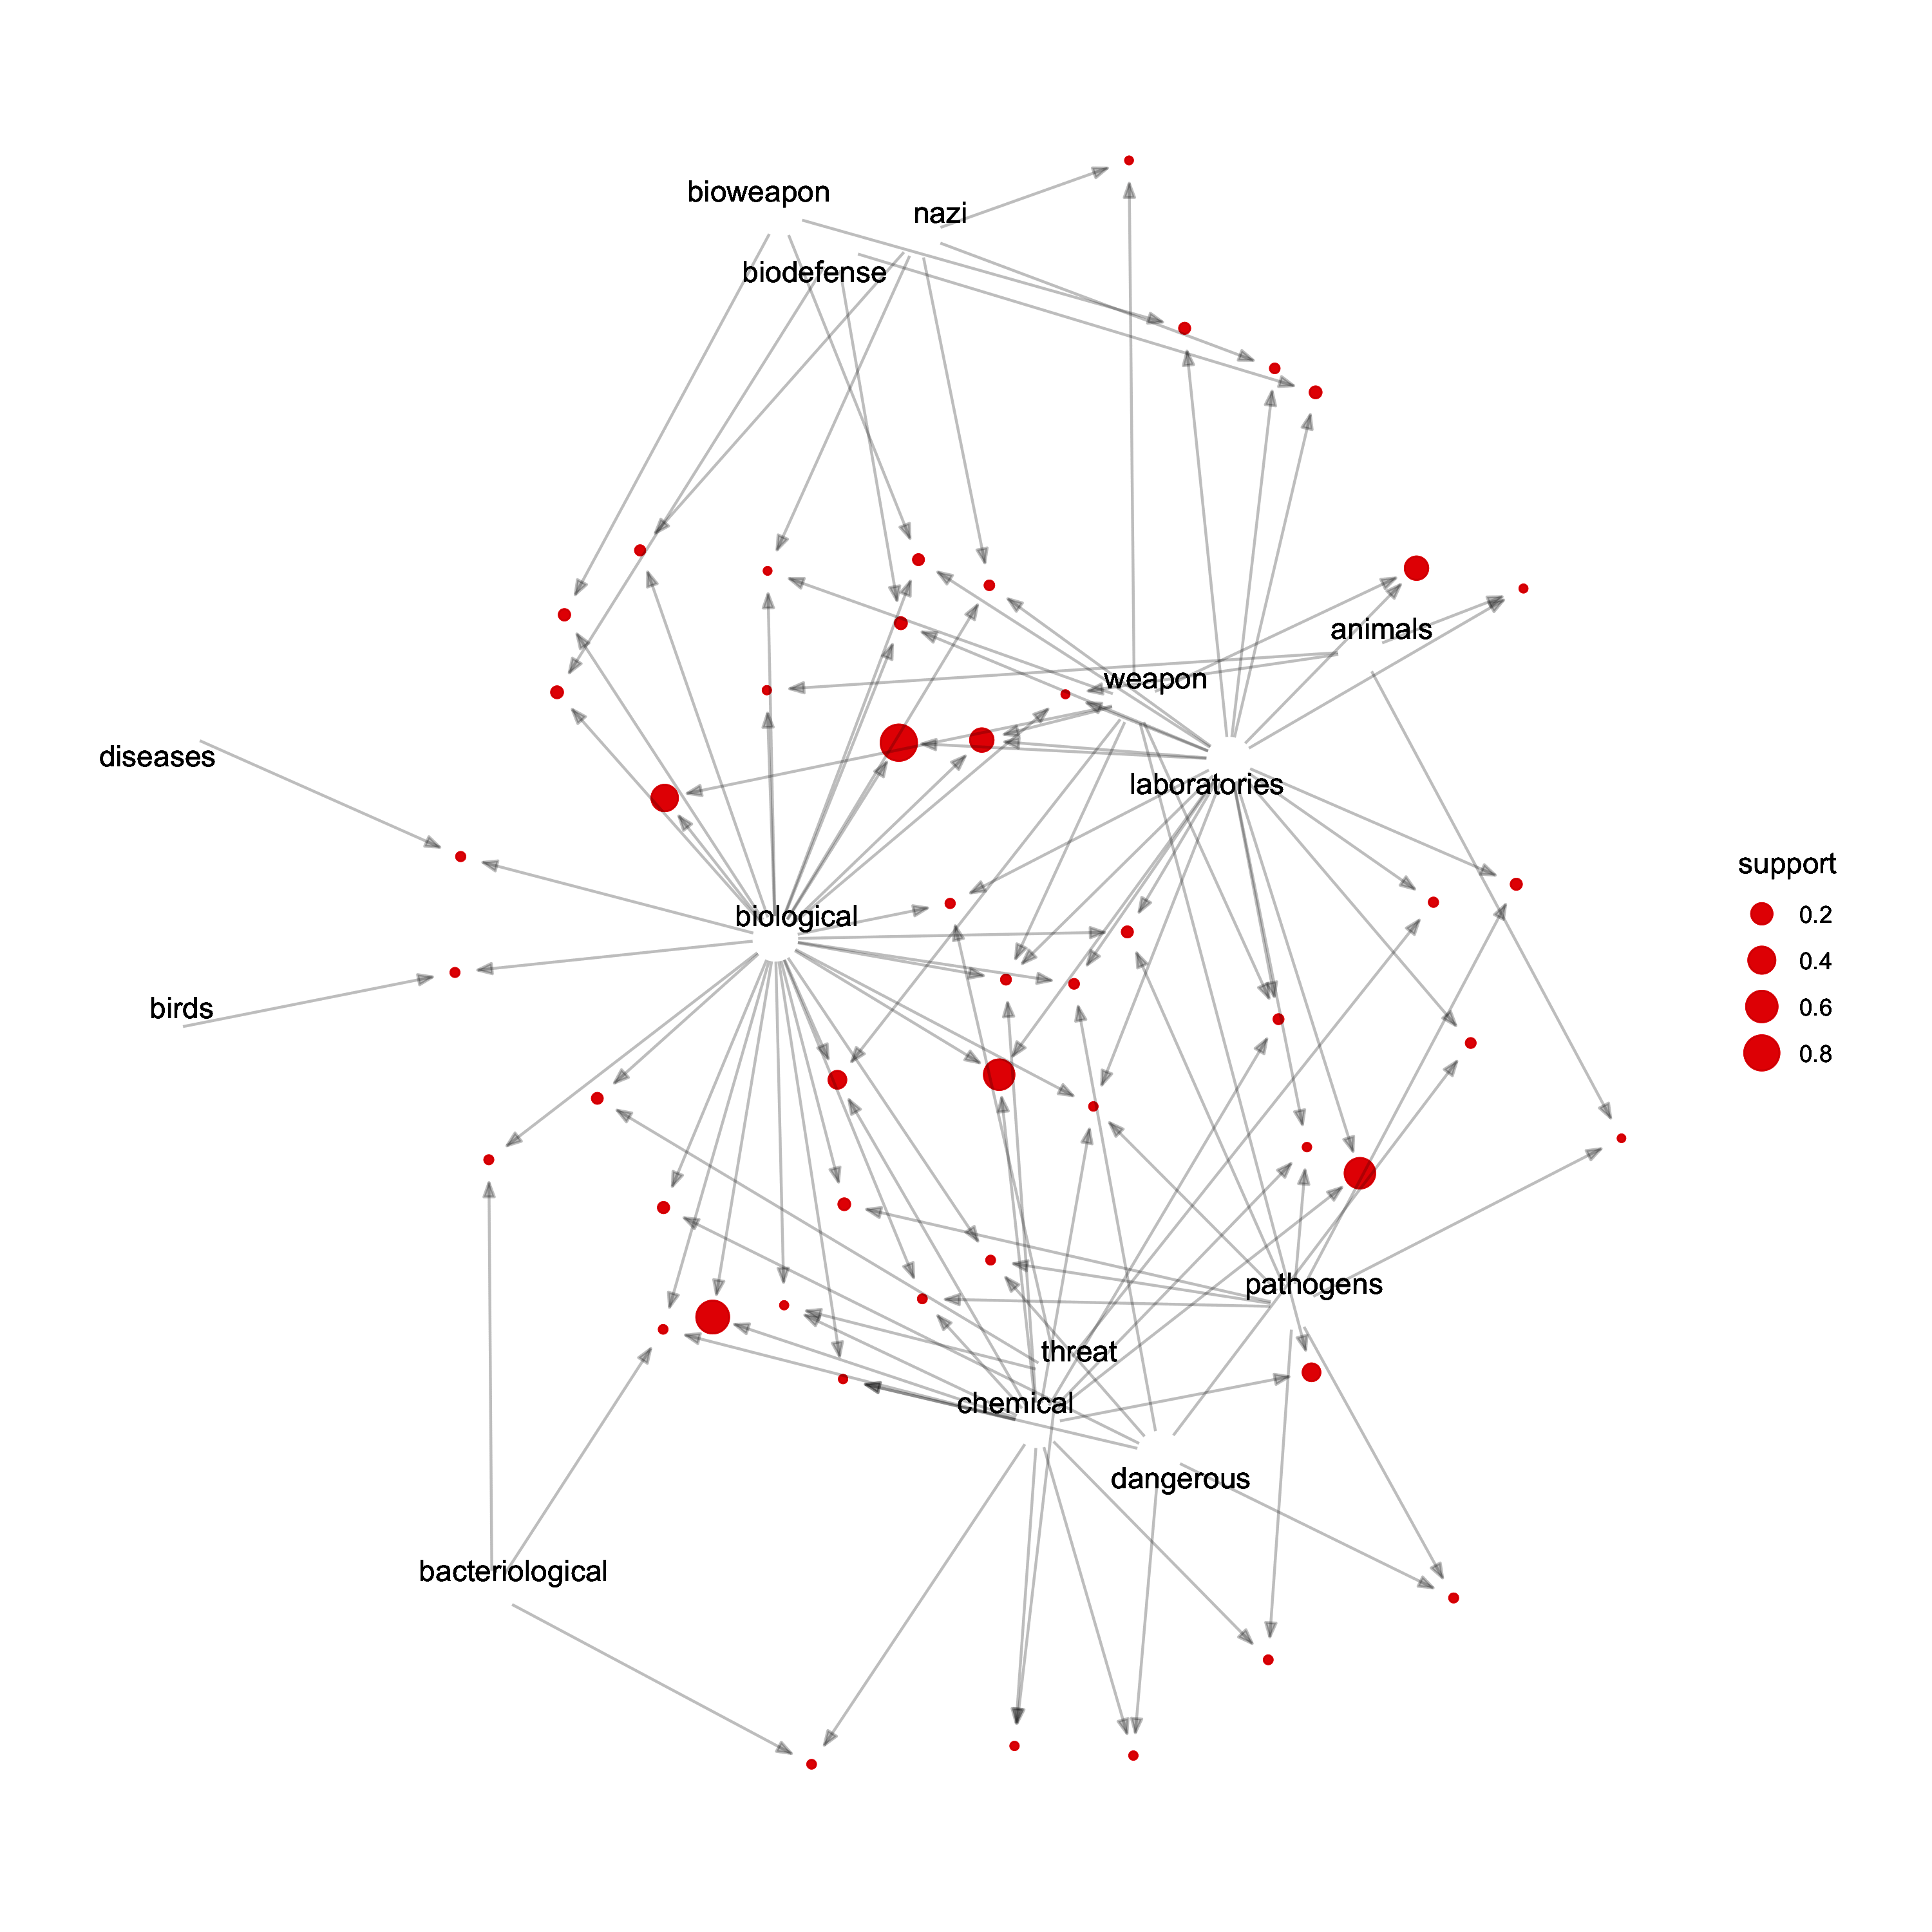
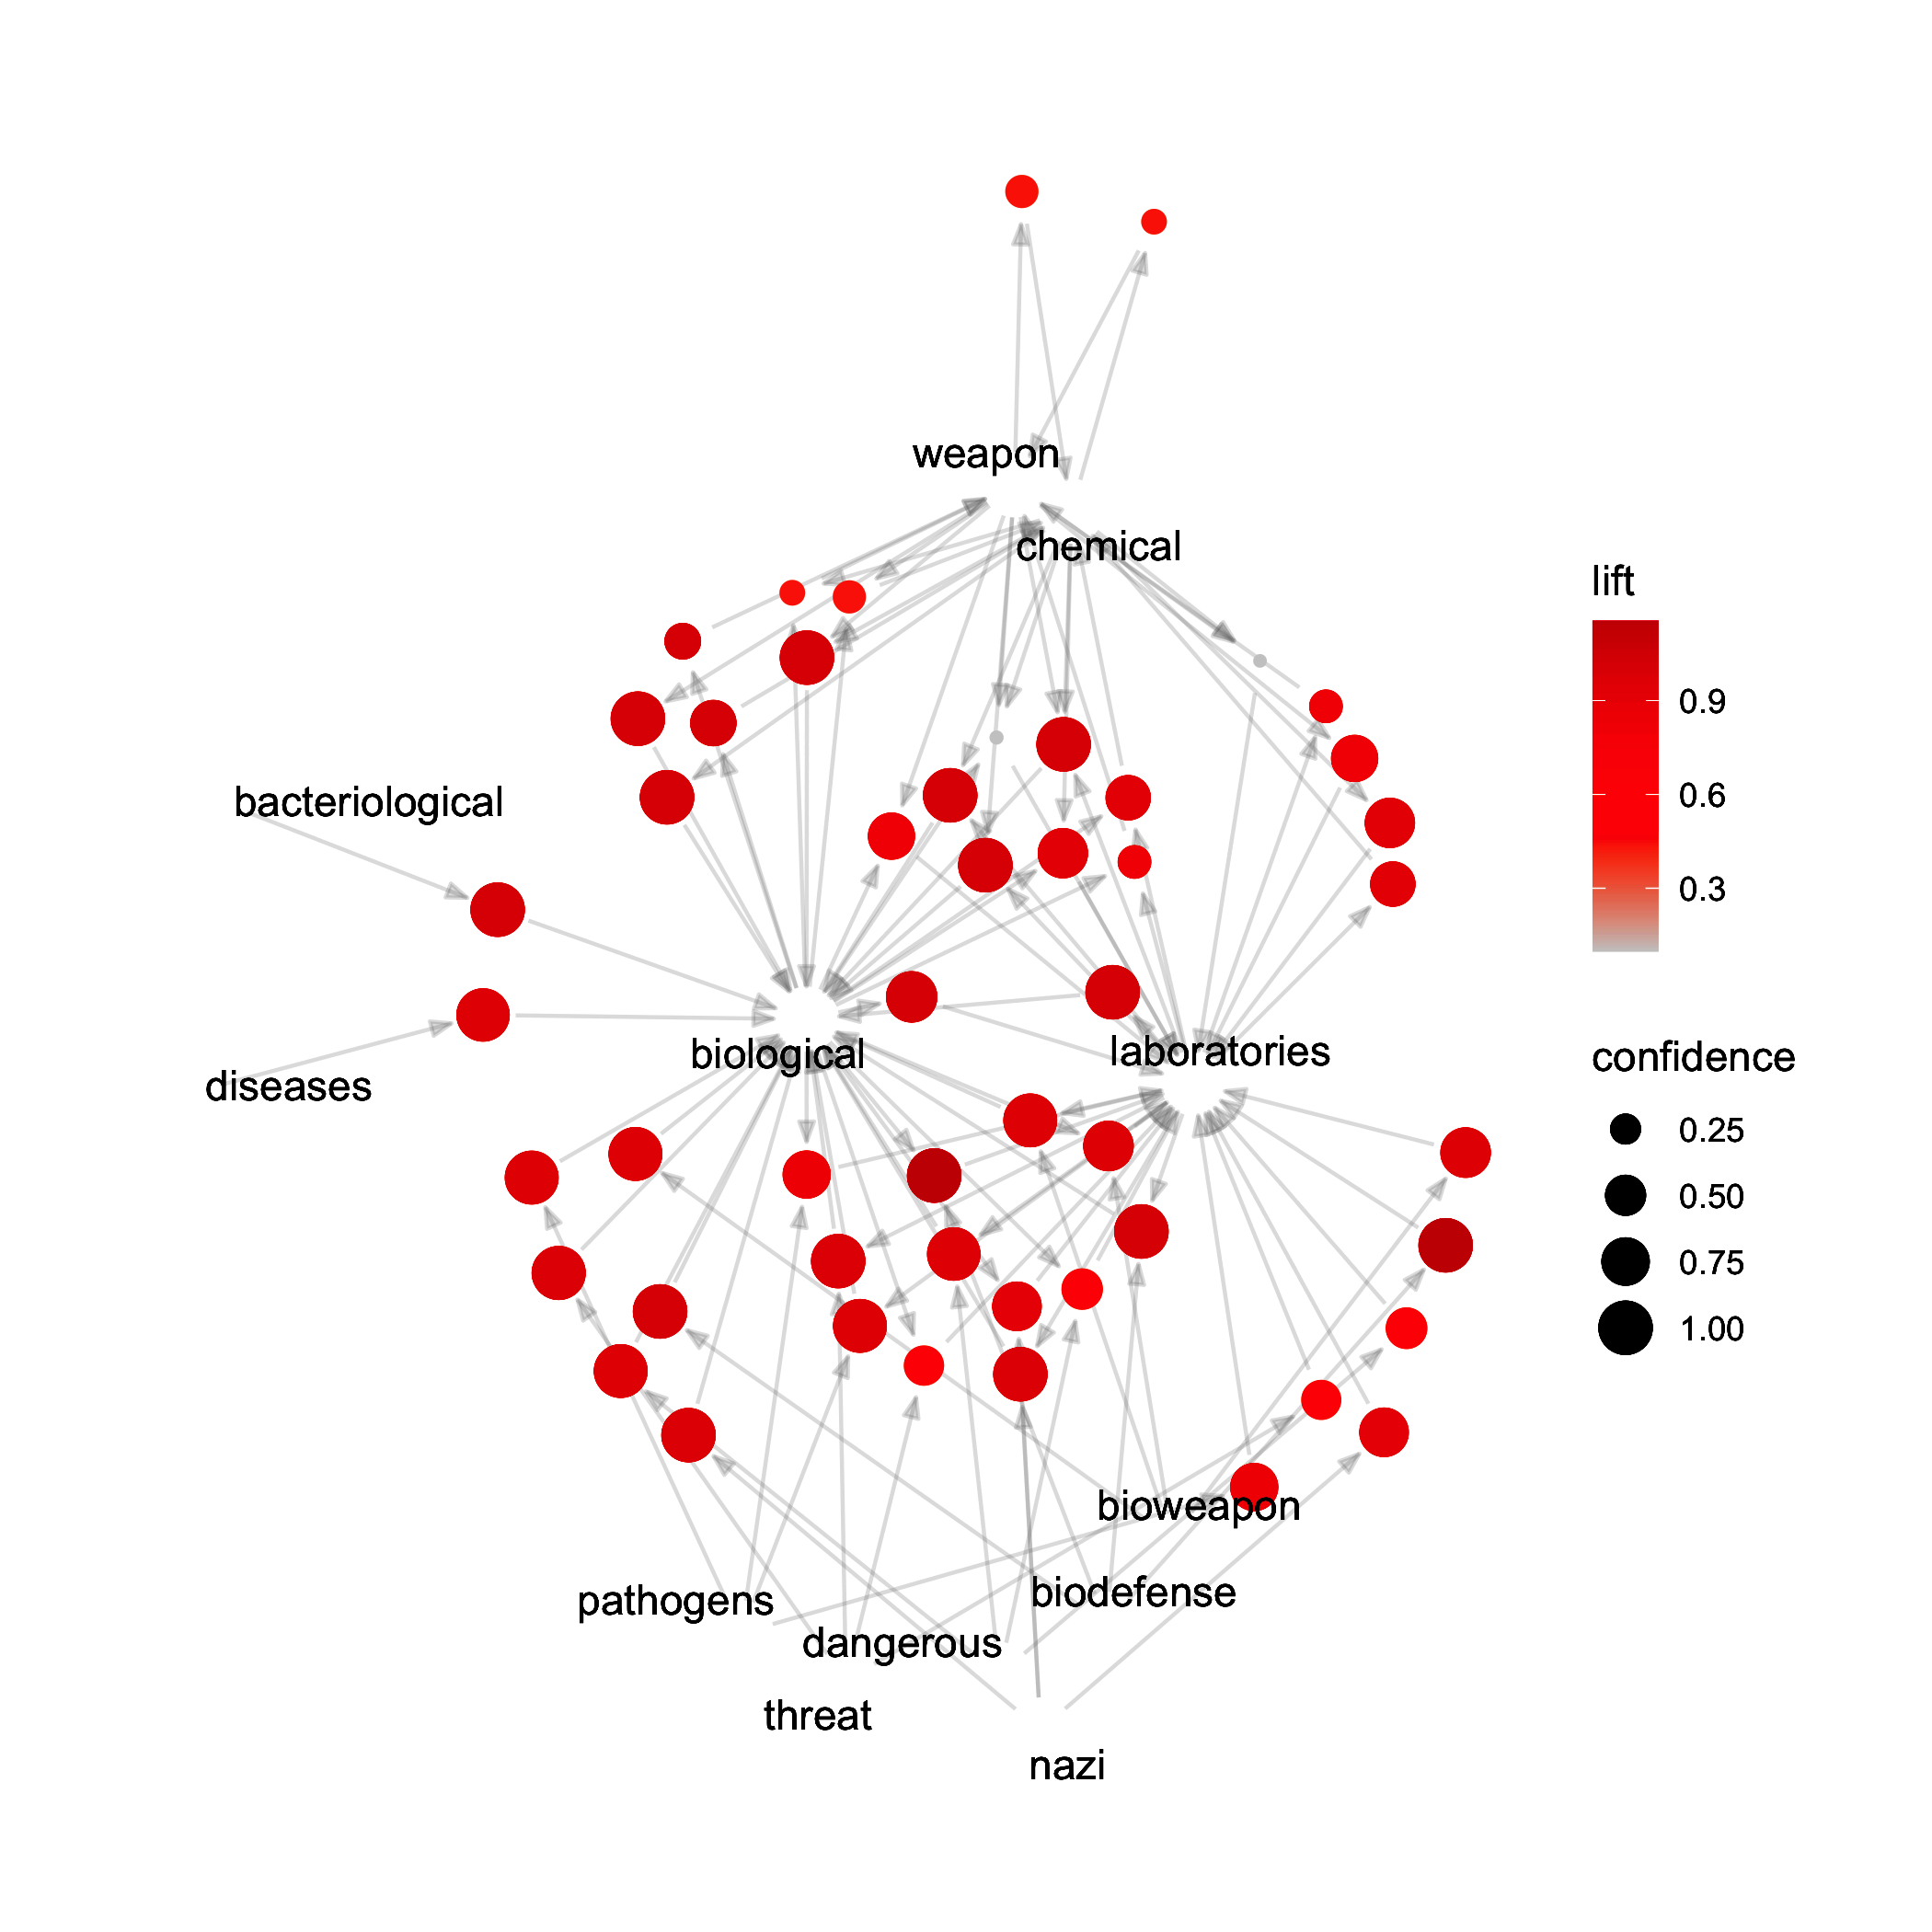
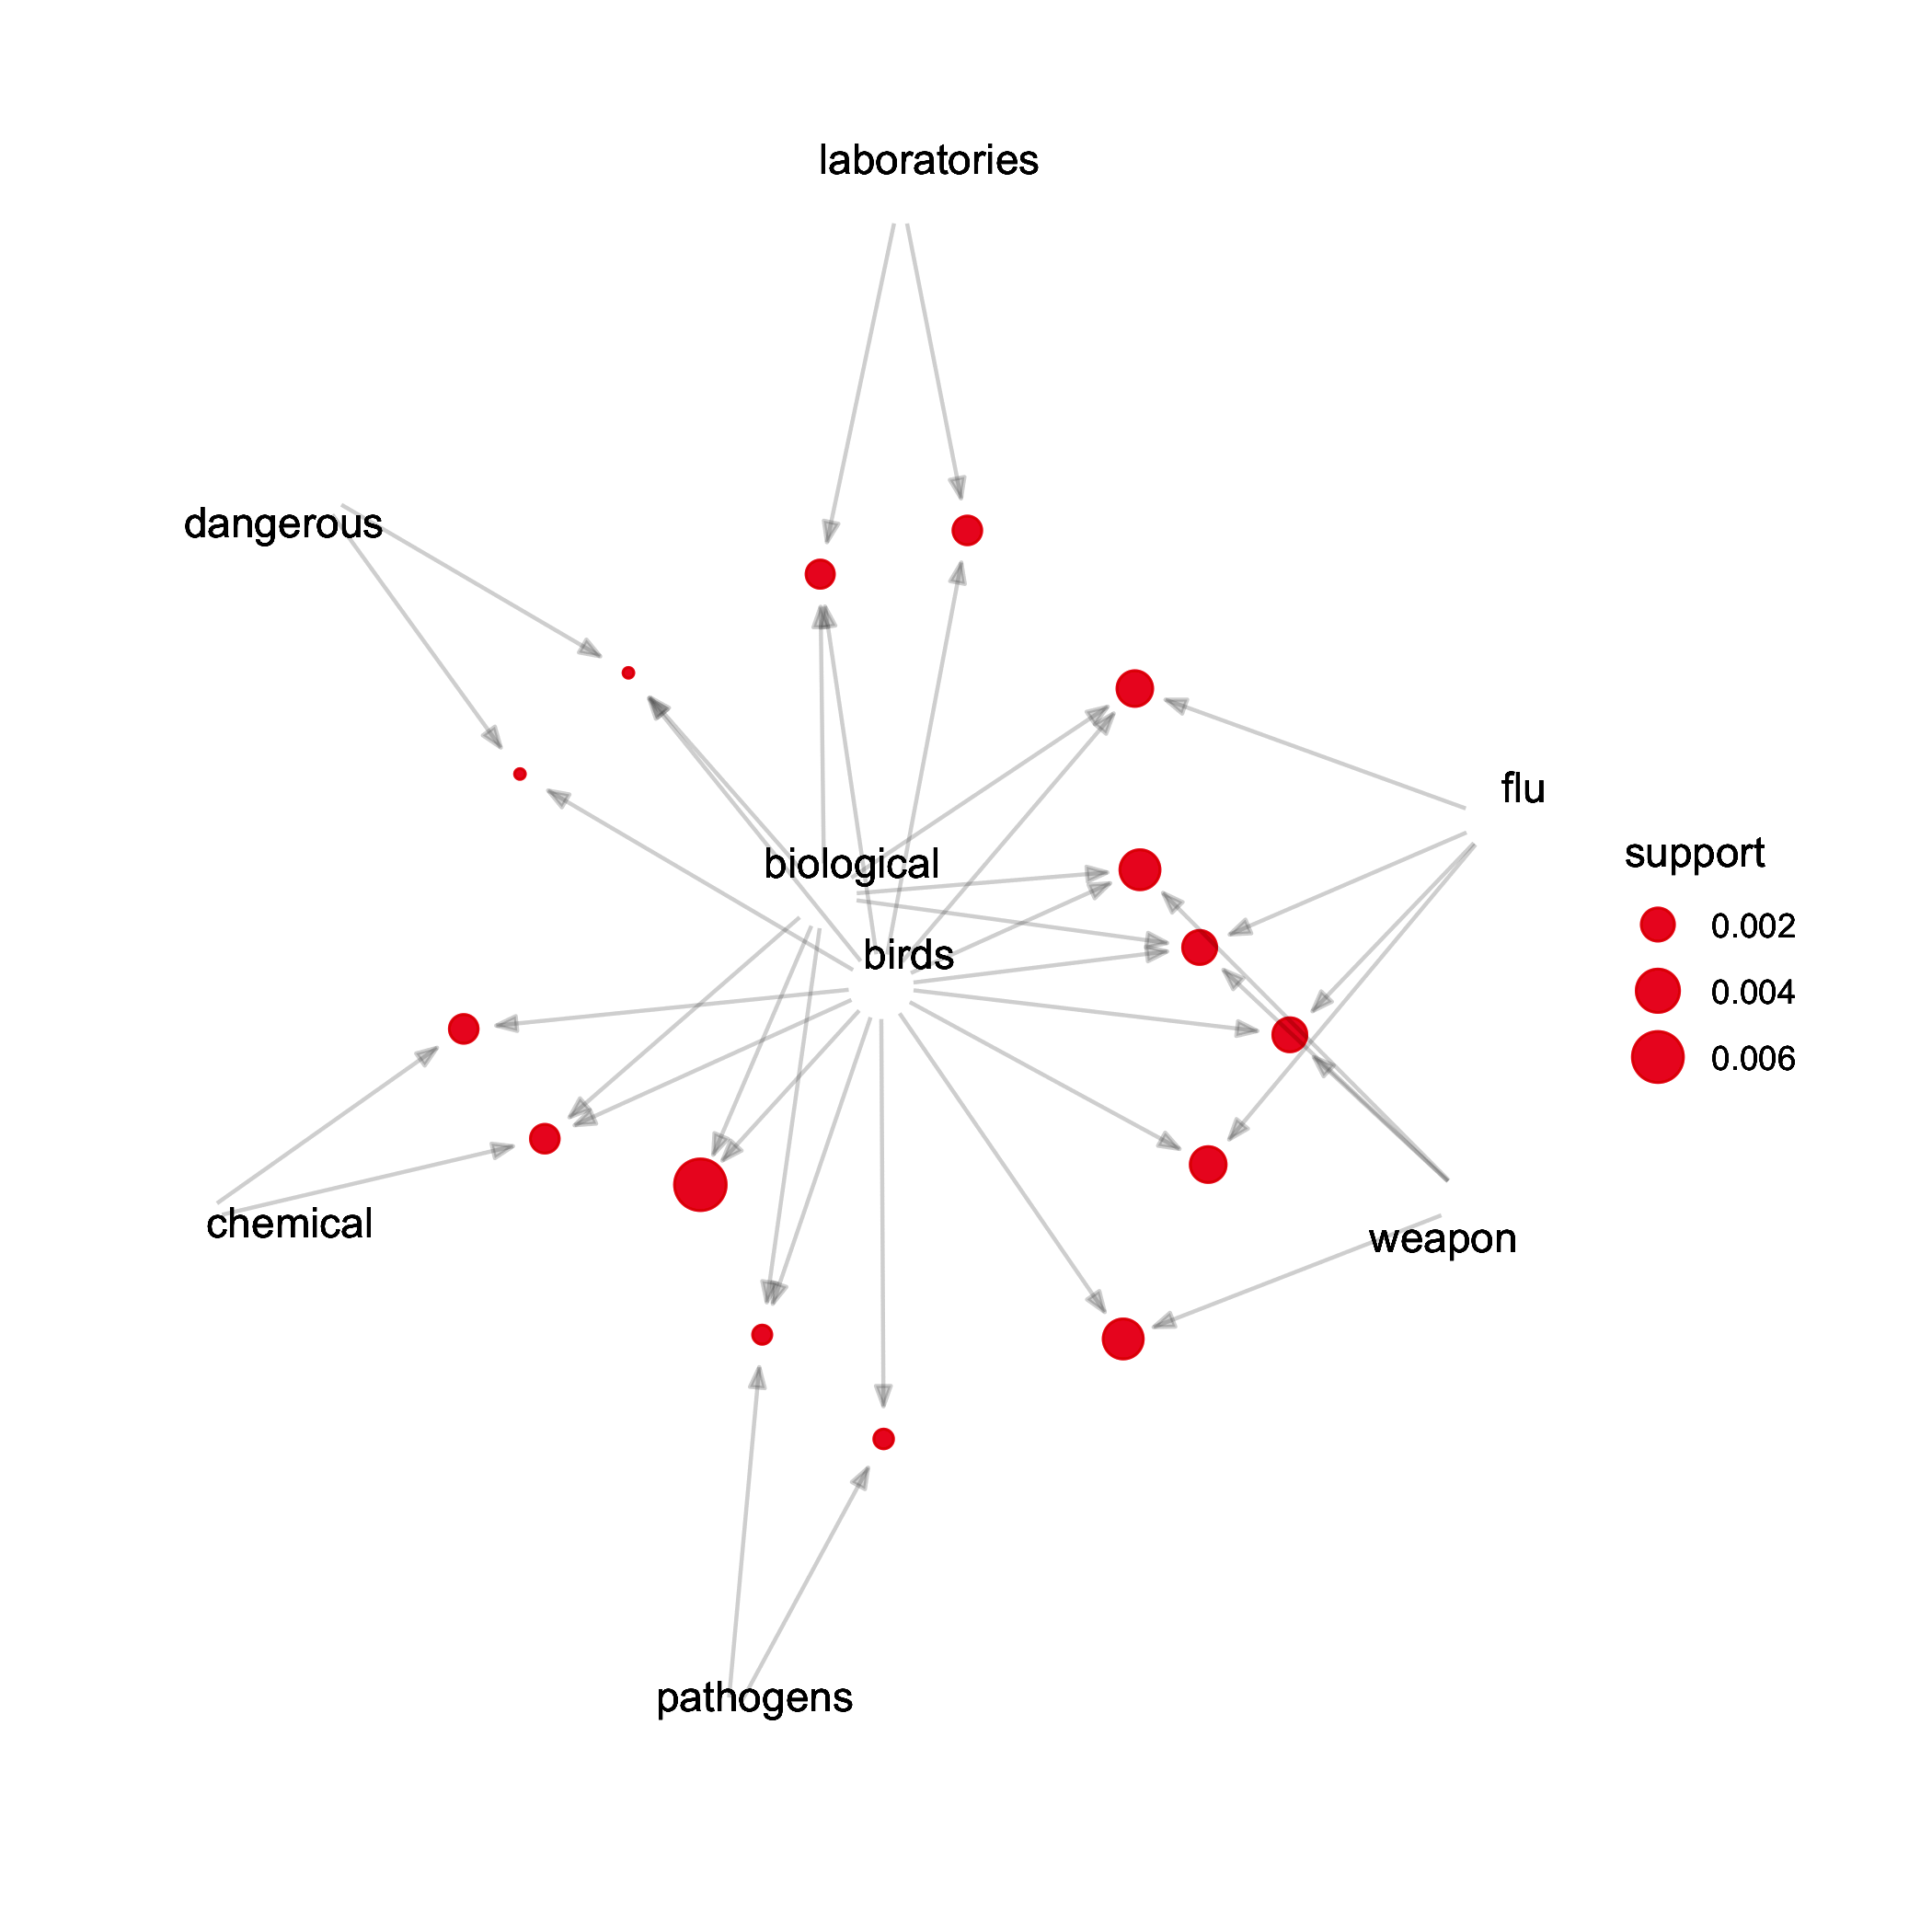
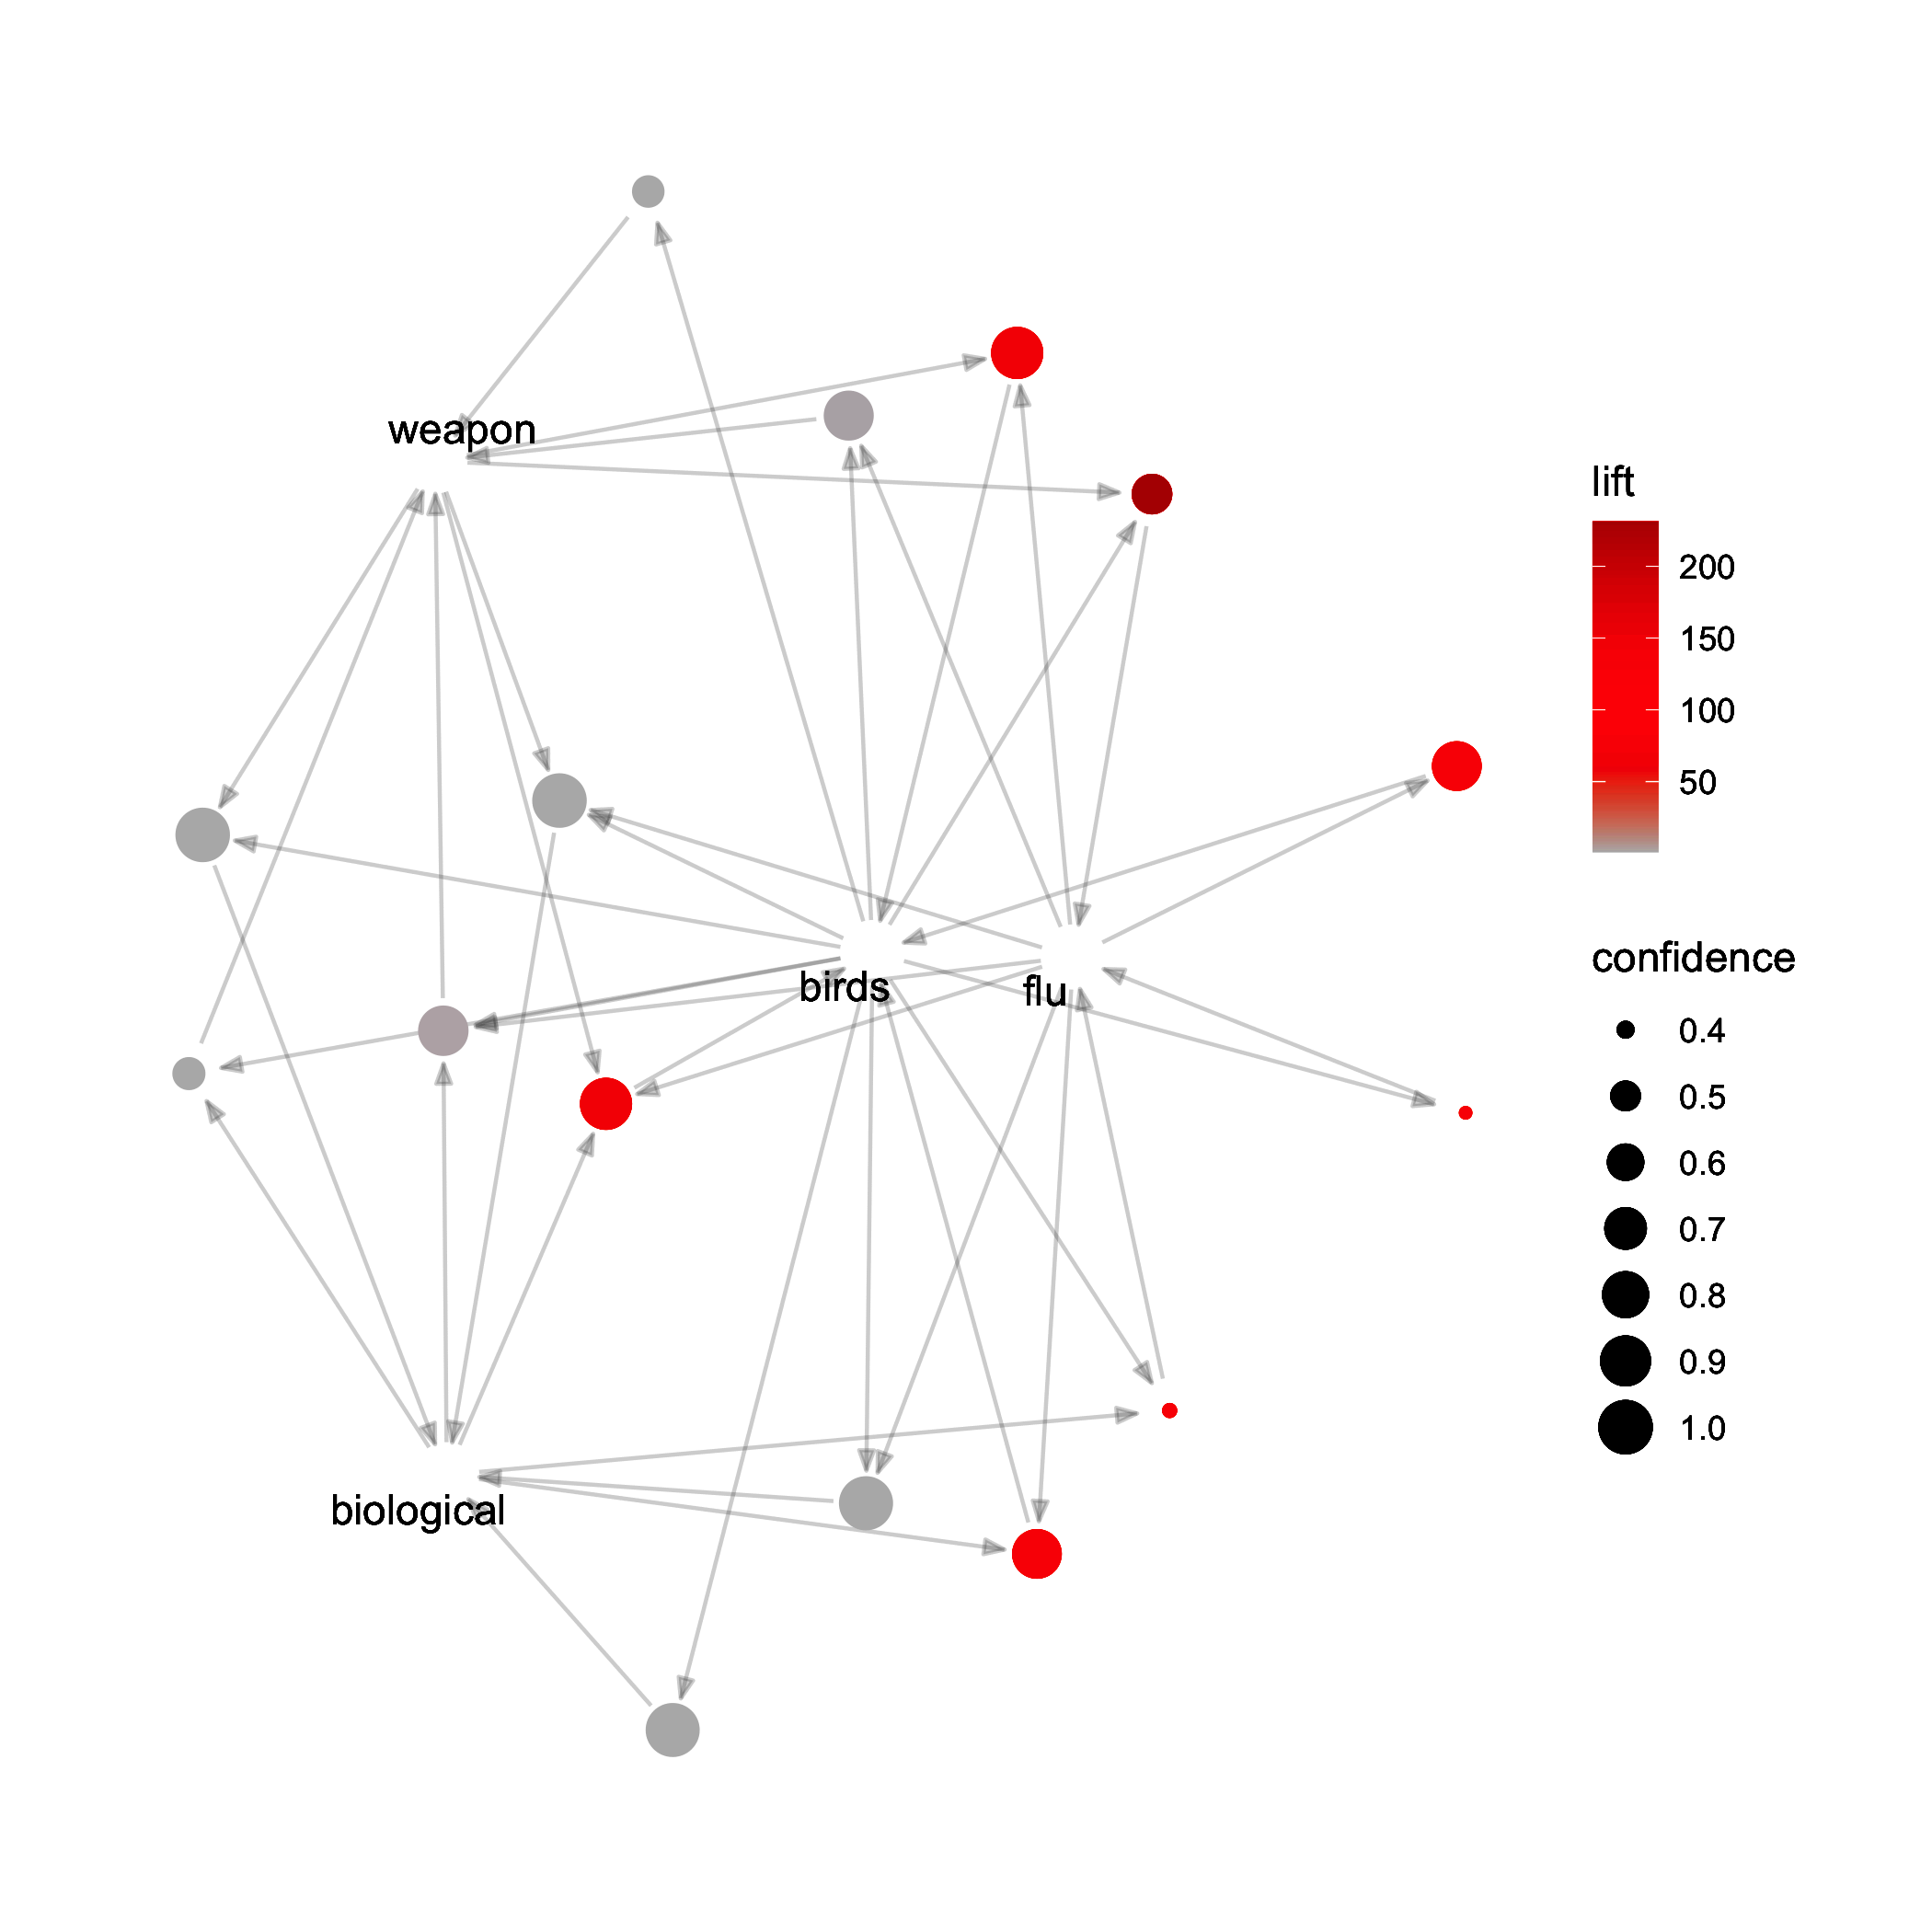
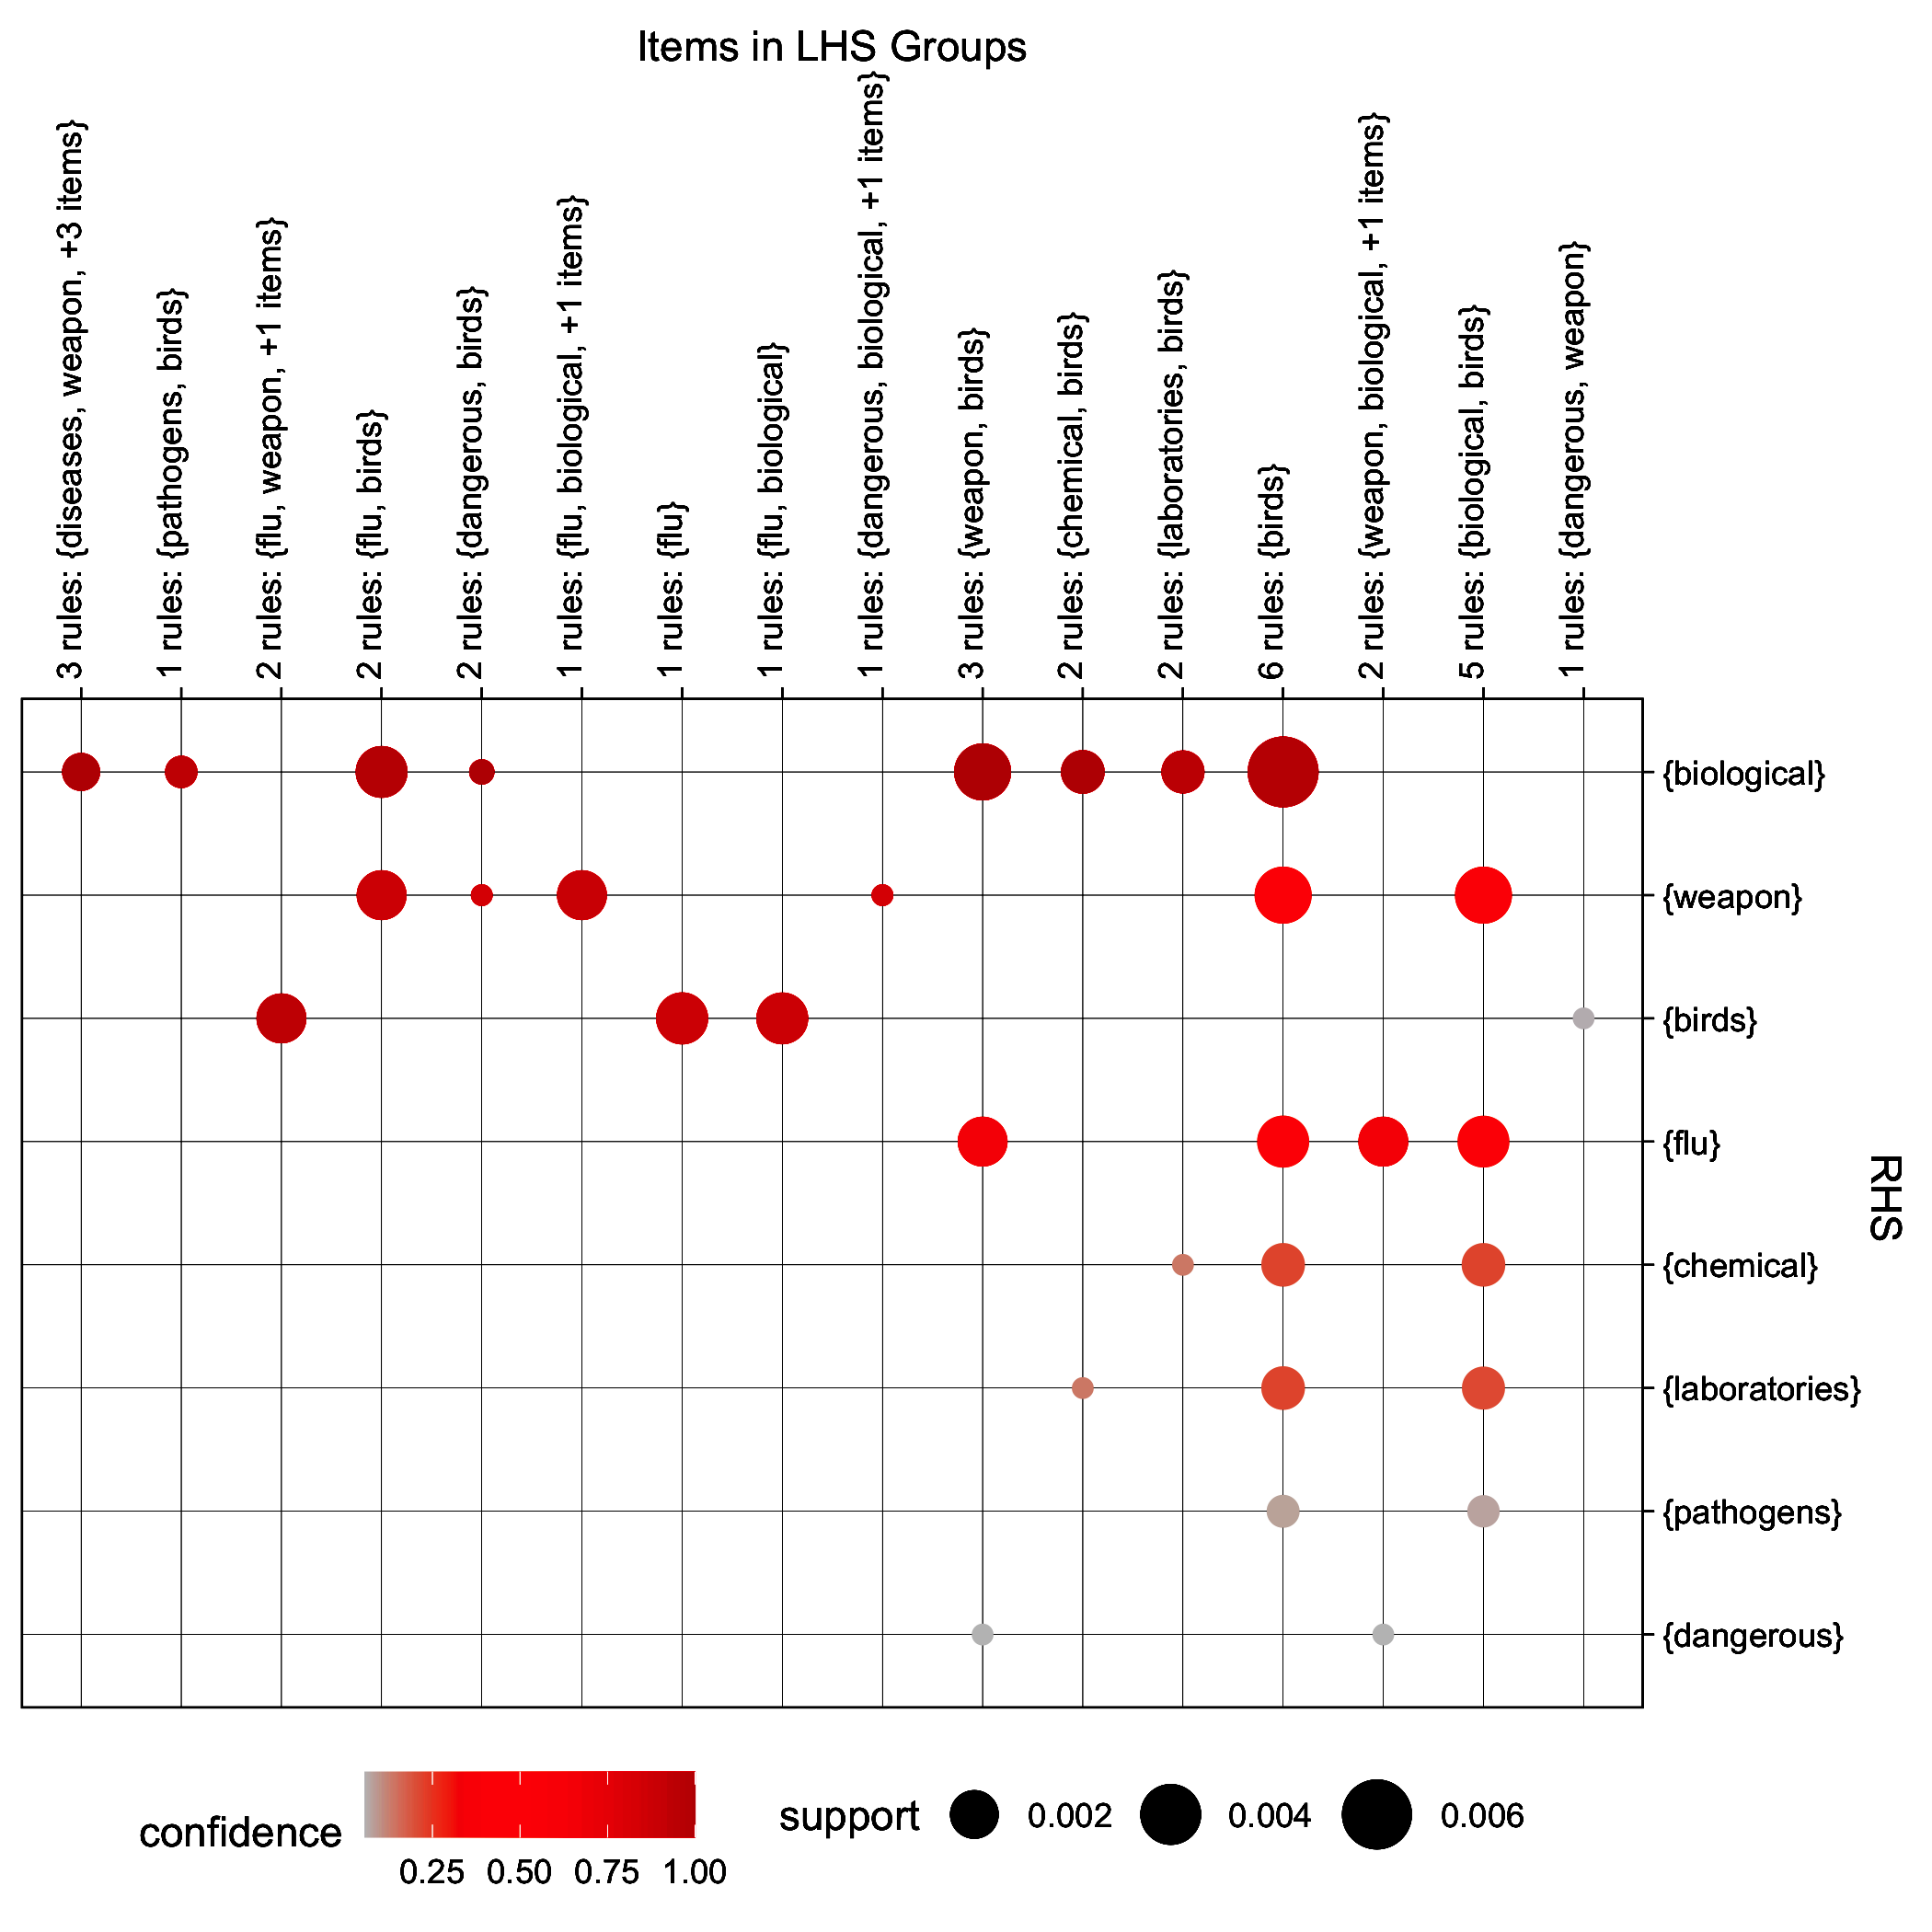
The frequent itemsets and associative rules theory is often used in the intellectual analysis [25, 26, 27, 28, 29, 30, 31, 32]. It can be used in a text data analysis to identify and analyze certain sets of objects, which are often found in large arrays and are characterized by certain features. Let us consider the algorithms for detecting frequent sets and associative rules on the example of processing microblog messages on tweets. Figure 13 shows keyword frequencies for the specified thematic field ’ukraine nazi’. Using these keywords, one can calculate frequent itemsets. Figure 14 shows the graph of frequent itemsets which describes the semantic structure of entities for a specified thematic field. Figure 14 shows the graph of the subset of association rules, Figure 16 shows the association rules represented by a grouped matrix. Figure 17 shows the association rules which contain the keyword ’fake’. Figures 18–20 show the similar calculation for the thematic field ’ukraine biological weapon’. Figures 21–23 show the subset of these frequent itemsets and association rules which contain the keyword ’bird’. The quantitative characteristics of frequent itemsets like value of support can be used as a predictive feature in machine learning models.
7 Graph Structure of Tweets
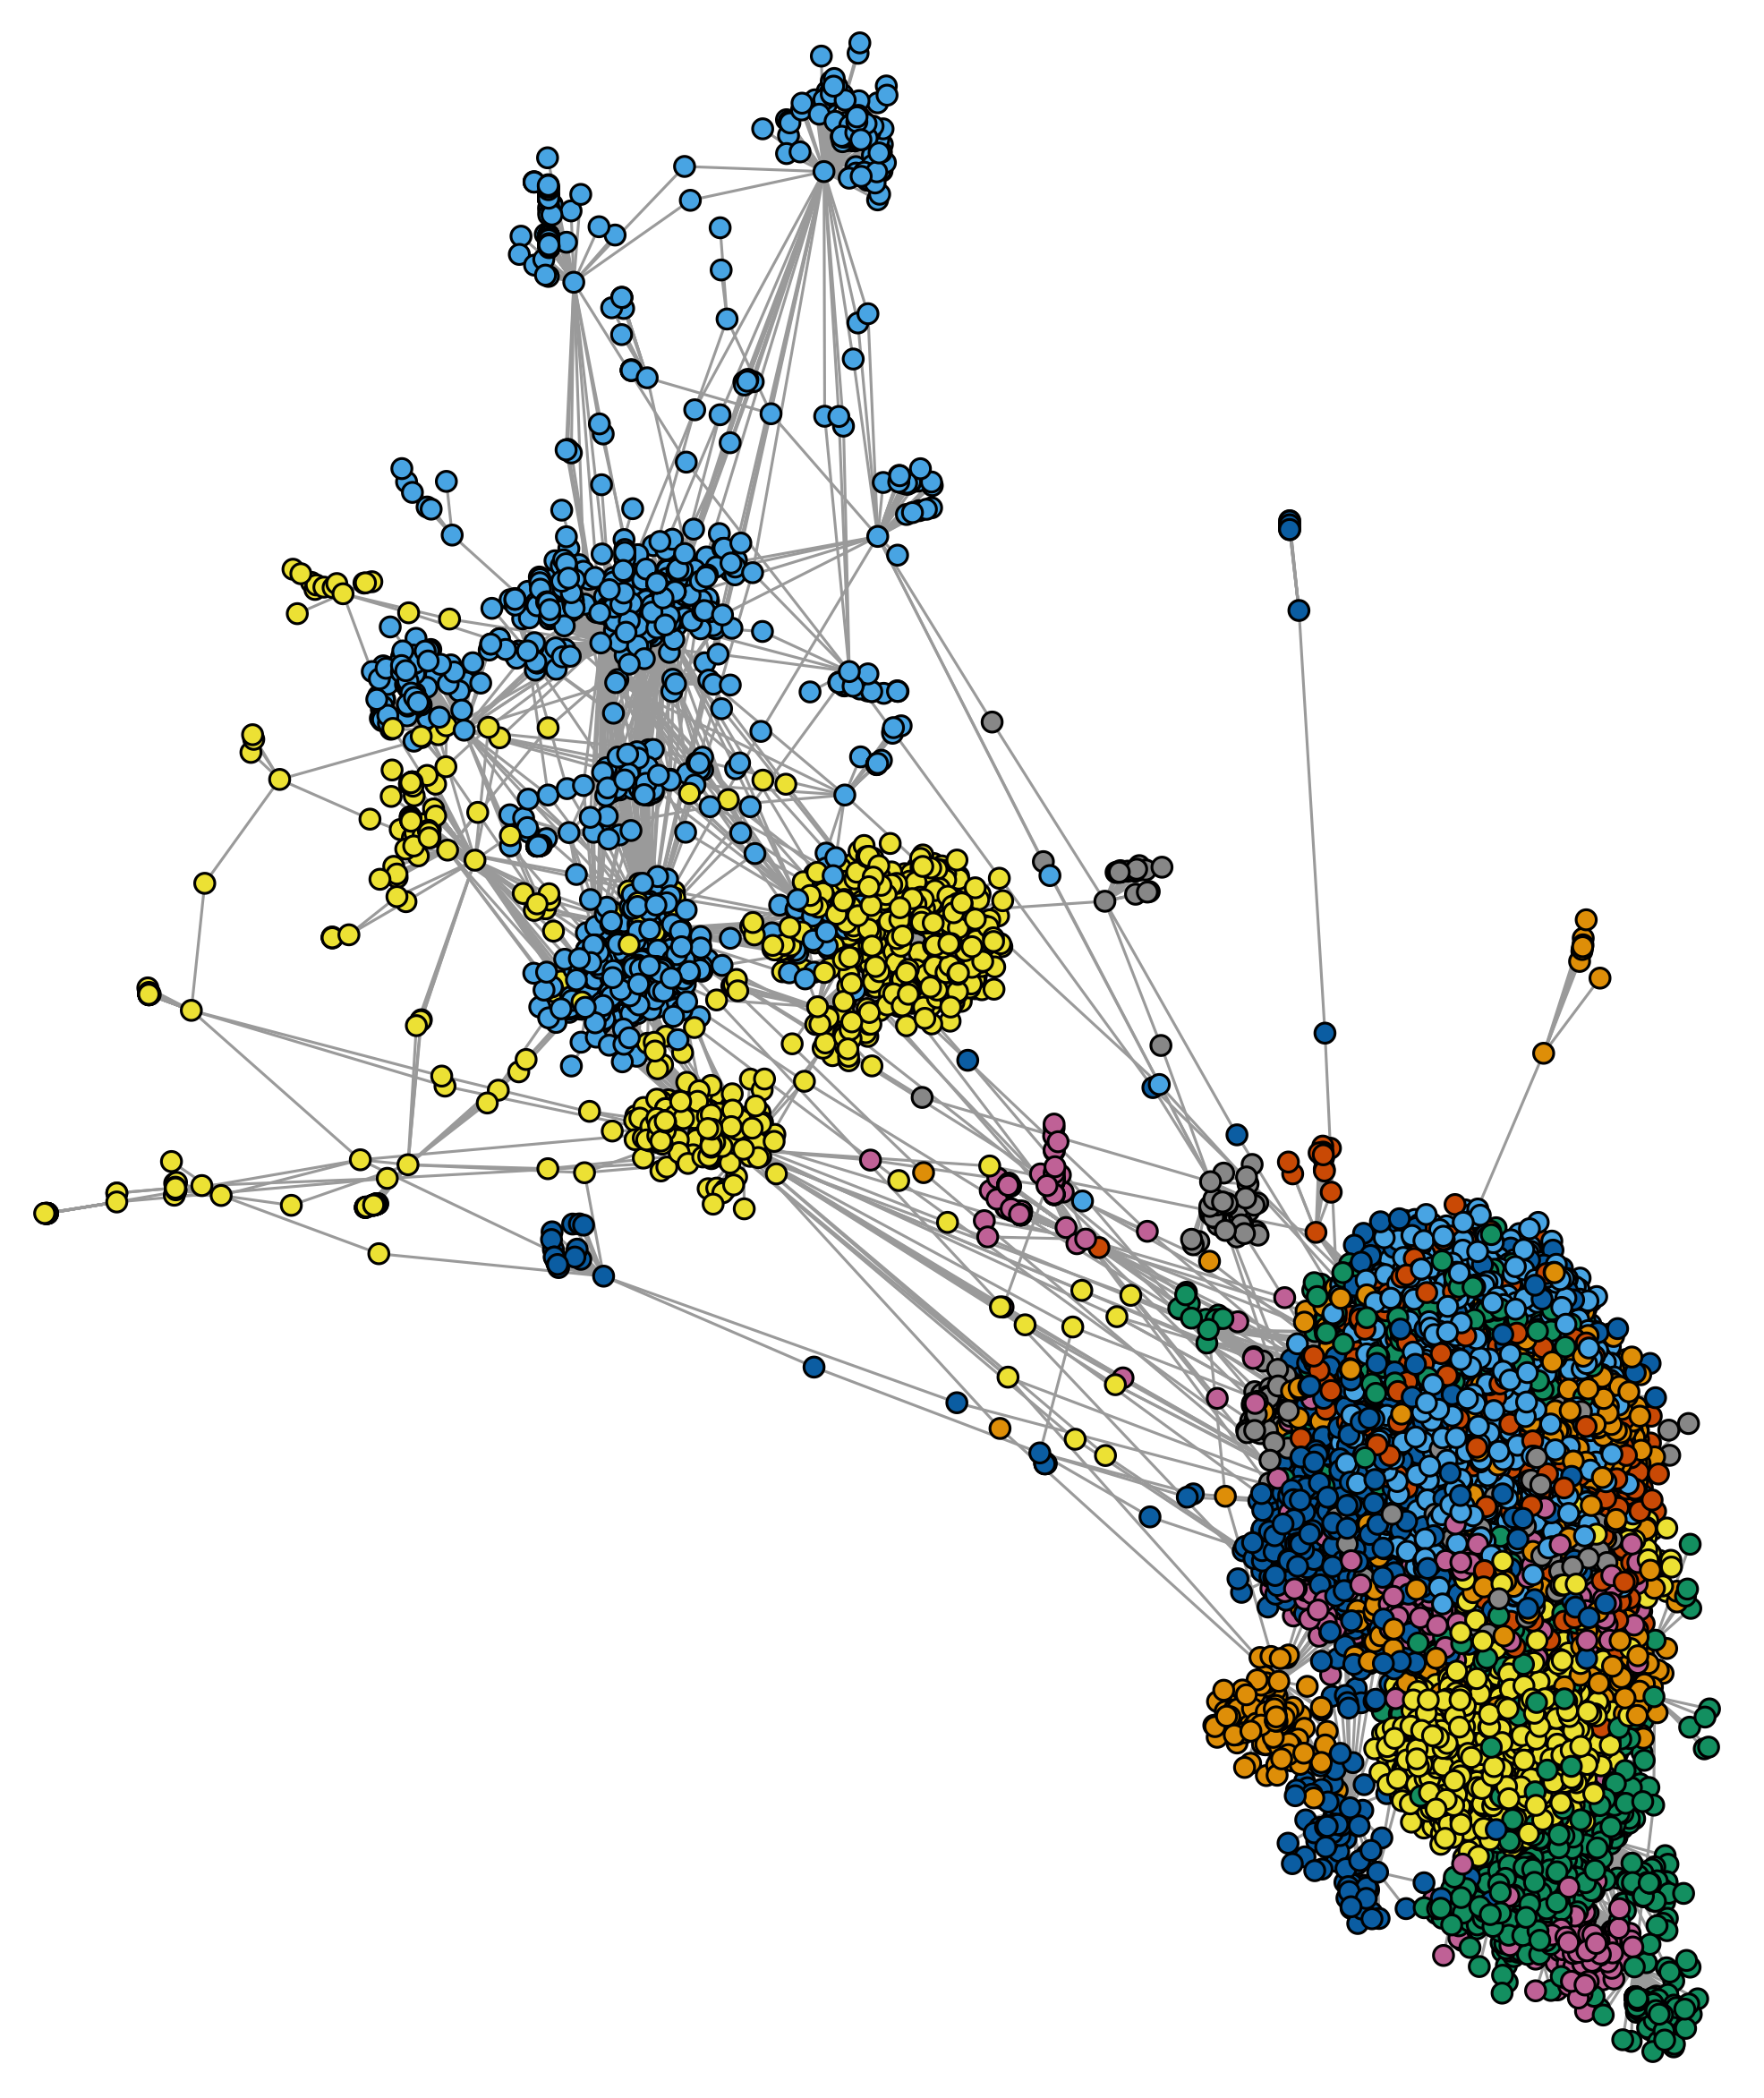
The relationships among users can be considered as a graph, where vertices denote users and edges denote their connections. Using graph mining algorithms, one can detect user communities and find ordered lists of users by various characteristics, such as Hub, Authority, PageRank, Betweenness. To identify user communities, we used the Community Walktrap algorithm and to visualize them we used Fruchterman-Reingold algorithm, which are implemented in the package ’igraph’ [33] for the R programming language environment. The Community Walktrap algorithm searches for related subgraphs, also called communities, by random walk [34]. A graph which shows the relationships between users can be represented by Fruchterman-Reingold algorithm [35]. The qualitative structure of user’s connections can be used for aggregating different quantitative time series and, in such a way, creating new features for predictive models which can be used, for example, for predicting target variables. Figure 24 shows users connections and revealed communities for the subset of tweets which are related to the trends under consideration. The results show that some communities marked by different colors are highly isolated and have only few connections outside. This kind of communities can be treated as suspicious, since artificially created communities for amplifying manipulative news are also highly isolated and their activity is often concentrated on amplifying by retweeting tweets from a limited set of users. Therefore, the numerical characteristics of users communities can have a predictive potential.
8 Conclusion
The obtained results show that an effective system for detecting fake and manipulative news can be developed using combined neural network which consist of three concatenated subnetworks: the subnetwork with DistilBERT transformer for tweet texts, the subnetwork with embedding of tweet words and usernames of users who retweeted tweets, and the subnetwork for the components of singular value decomposition of TF-IDF matrix for lists of usernames of users who retweeted tweets. Discussions on social networks about companies behavior has impact on their business and their stock prices on the stock market. To analyze such an impact and make risk assessment, Bayesian regression can be used. Using the theory of frequent itemsets and association rules along with thematic fields of keywords, makes it possible to reveal the semantic structure for entities in news messages. The quantitative characteristics association rules like support and confidence can be used as features for machine learning predictive models. Using the graph theory, the hidden communities of users can be revealed and their characteristics can be used in a machine learning approach for fake and manipulative news detection.
References
- [1] A. Java, X. Song, T. Finin, and B. Tseng, ‘‘Why we twitter: understanding microblogging usage and communities,’’ in Proceedings of the 9th WebKDD and 1st SNA-KDD 2007 workshop on Web mining and social network analysis, pp. 56–65, 2007.
- [2] H. Kwak, C. Lee, H. Park, and S. Moon, ‘‘What is Twitter, a social network or a news media?,’’ in Proceedings of the 19th international conference on World wide web, pp. 591–600, 2010.
- [3] A. Pak and P. Paroubek, ‘‘Twitter as a corpus for sentiment analysis and opinion mining,’’ in LREc, vol. 10, pp. 1320–1326, 2010.
- [4] M. Cha, H. Haddadi, F. Benevenuto, and K. Gummadi, ‘‘Measuring user influence in twitter: The million follower fallacy,’’ in Proceedings of the International AAAI Conference on Web and Social Media, vol. 4, 2010.
- [5] F. Benevenuto, T. Rodrigues, M. Cha, and V. Almeida, ‘‘Characterizing user behavior in online social networks,’’ in Proceedings of the 9th ACM SIGCOMM conference on Internet measurement, pp. 49–62, 2009.
- [6] J. Bollen, H. Mao, and X. Zeng, ‘‘Twitter mood predicts the stock market,’’ Journal of computational science, vol. 2, no. 1, pp. 1–8, 2011.
- [7] S. Asur and B. A. Huberman, ‘‘Predicting the future with social media,’’ in 2010 IEEE/WIC/ACM international conference on web intelligence and intelligent agent technology, vol. 1, pp. 492–499, IEEE, 2010.
- [8] D. Shamma, L. Kennedy, and E. Churchill, ‘‘Tweetgeist: Can the twitter timeline reveal the structure of broadcast events,’’ CSCW Horizons, pp. 589–593, 2010.
- [9] M. Wang and G. Hu, ‘‘A novel method for twitter sentiment analysis based on attentional-graph neural network,’’ Information, vol. 11, no. 2, p. 92, 2020.
- [10] V. Balakrishnan, S. Khan, and H. R. Arabnia, ‘‘Improving cyberbullying detection using twitter users’ psychological features and machine learning,’’ Computers & Security, vol. 90, p. 101710, 2020.
- [11] N. Grinberg, K. Joseph, L. Friedland, B. Swire-Thompson, and D. Lazer, ‘‘Fake news on twitter during the 2016 us presidential election,’’ Science, vol. 363, no. 6425, pp. 374–378, 2019.
- [12] O. Ajao, D. Bhowmik, and S. Zargari, ‘‘Fake news identification on twitter with hybrid cnn and rnn models,’’ in Proceedings of the 9th international conference on social media and society, pp. 226–230, 2018.
- [13] S. Helmstetter and H. Paulheim, ‘‘Weakly supervised learning for fake news detection on twitter,’’ in 2018 IEEE/ACM International Conference on Advances in Social Networks Analysis and Mining (ASONAM), pp. 274–277, IEEE, 2018.
- [14] B. M. Pavlyshenko, ‘‘Forecasting of Events by Tweets Data Mining,’’ Electronics and information technologies, no. 10, pp. 71–85, 2018.
- [15] B. M. Pavlyshenko, ‘‘Can Twitter Predict Royal Baby’s Name ?,’’ Electronics and information technologies, no. 11, pp. 52–60, 2019.
- [16] B. M. Pavlyshenko, ‘‘Forming predictive features of tweets for decision-making support,’’ in International Scientific Conference “Intellectual Systems of Decision Making and Problem of Computational Intelligence”, pp. 479–490, Springer, 2021.
- [17] B. Pavlyshenko, ‘‘Classification analysis of authorship fiction texts in the space of semantic fields,’’ Journal of Quantitative Linguistics, vol. 20, no. 3, pp. 218–226, 2013.
- [18] B. Pavlyshenko, ‘‘Clustering of authors’ texts of english fiction in the vector space of semantic fields,’’ Cybernetics and Information Technologies, vol. 14, no. 3, pp. 25–36, 2014.
- [19] B. Pavlyshenko, ‘‘Genetic optimization of keyword subsets in the classification analysis of authorship of texts,’’ Journal of Quantitative Linguistics, vol. 21, no. 4, pp. 341–349, 2014.
- [20] ‘‘Examples of Automatically Recognized Tweets As Fake or Manipulative.’’ URL: https://bit.ly/37u4viL.
- [21] G. Jawahar, M. Abdul-Mageed, and L. V. Lakshmanan, ‘‘Automatic detection of machine generated text: A critical survey,’’ arXiv preprint arXiv:2011.01314, 2020.
- [22] T. Fagni, F. Falchi, M. Gambini, A. Martella, and M. Tesconi, ‘‘Tweepfake: About detecting deepfake tweets,’’ Plos one, vol. 16, no. 5, p. e0251415, 2021.
- [23] T. Murayama, ‘‘Dataset of fake news detection and fact verification: A survey,’’ arXiv preprint arXiv:2111.03299, 2021.
- [24] B. Carpenter, A. Gelman, M. D. Hoffman, D. Lee, B. Goodrich, M. Betancourt, M. Brubaker, J. Guo, P. Li, and A. Riddell, ‘‘Stan: A probabilistic programming language,’’ Journal of statistical software, vol. 76, no. 1, 2017.
- [25] R. Agrawal, R. Srikant, et al., ‘‘Fast algorithms for mining association rules,’’ in Proc. 20th int. conf. very large data bases, VLDB, vol. 1215, pp. 487–499, 1994.
- [26] R. Agrawal, H. Mannila, R. Srikant, H. Toivonen, A. I. Verkamo, et al., ‘‘Fast discovery of association rules.,’’ Advances in knowledge discovery and data mining, vol. 12, no. 1, pp. 307–328, 1996.
- [27] C.-K. Chui, B. Kao, and E. Hung, ‘‘Mining frequent itemsets from uncertain data,’’ in Pacific-Asia Conference on knowledge discovery and data mining, pp. 47–58, Springer, 2007.
- [28] K. Gouda and M. J. Zaki, ‘‘Efficiently mining maximal frequent itemsets,’’ in Proceedings 2001 IEEE International Conference on Data Mining, pp. 163–170, IEEE, 2001.
- [29] R. Srikant, Q. Vu, and R. Agrawal, ‘‘Mining association rules with item constraints.,’’ in Kdd, vol. 97, pp. 67–73, 1997.
- [30] M. Klemettinen, H. Mannila, P. Ronkainen, H. Toivonen, and A. I. Verkamo, ‘‘Finding interesting rules from large sets of discovered association rules,’’ in Proceedings of the third international conference on Information and knowledge management, pp. 401–407, 1994.
- [31] N. Pasquier, Y. Bastide, R. Taouil, and L. Lakhal, ‘‘Discovering frequent closed itemsets for association rules,’’ in International Conference on Database Theory, pp. 398–416, Springer, 1999.
- [32] S. Brin, R. Motwani, and C. Silverstein, ‘‘Beyond market baskets: Generalizing association rules to correlations,’’ in Proceedings of the 1997 ACM SIGMOD international conference on Management of data, pp. 265–276, 1997.
- [33] G. Csardi, T. Nepusz, et al., ‘‘The igraph software package for complex network research,’’ InterJournal, complex systems, vol. 1695, no. 5, pp. 1–9, 2006.
- [34] P. Pons and M. Latapy, ‘‘Computing communities in large networks using random walks,’’ in International symposium on computer and information sciences, pp. 284–293, Springer, 2005.
- [35] T. M. Fruchterman and E. M. Reingold, ‘‘Graph drawing by force-directed placement,’’ Software: Practice and experience, vol. 21, no. 11, pp. 1129–1164, 1991.