ComputableViz: Mathematical Operators as a Formalism for Visualisation Processing and Analysis
Abstract.
Data visualizations are created and shared on the web at an unprecedented speed, raising new needs and questions for processing and analyzing visualizations after they have been generated and digitized. However, existing formalisms focus on operating on a single visualization instead of multiple visualizations, making it challenging to perform analysis tasks such as sorting and clustering visualizations. Through a systematic analysis of previous work, we abstract visualization-related tasks into mathematical operators such as union and propose a design space of visualization operations. We realize the design by developing ComputableViz, a library that supports operations on multiple visualization specifications. To demonstrate its usefulness and extensibility, we present multiple usage scenarios concerning processing and analyzing visualization, such as generating visualization embeddings and automatically making visualizations accessible. We conclude by discussing research opportunities and challenges for managing and exploiting the massive visualizations on the web.
1. Introduction
By representing data graphically, visualizations often serve as the main entry point to data for the public. With the increasing availability and democratization of visualization authoring tools, a large number of visualizations have been produced and shared on the web. Correspondingly, it is argued that data visualizations are becoming a new data format (Wu et al., 2021b). There is a growing research interest in exploring techniques used for processing and analyzing visualizations after they have been generated and digitized. For instance, researchers have started to investigate the problem of style transfer (Harper and Agrawala, 2017; Qian et al., 2020) and example-based retrieval (Hoque and Agrawala, 2019) on visualizations. Besides, the explosion of visualizations online has led to needs for summarizing and organizing what information has been presented to the public, especially in high-impact domains such as public health (Zhang et al., 2021; Lee et al., 2021). Under this trend, new ideas and problems are emerging, raising the need to organize research work and inform future research.
In this paper, we formulate this research topic as visualization processing and analysis. Our formulation is inspired by the well-established image processing and analysis (Niblack, 1985) since visualizations are widely considered as graphic images. Thus, visualization processing and analysis concern processing digitized visualizations through an algorithm and extracting meaningful information from visualizations. In surveying relevant literature, we observe that a large body of research has moved from operating on a single visualization to multiple visualizations. For example, style transfer involves “merging” a content visualization with a style visualization (Gatys et al., 2016), and example-based retrieval concerns measuring the difference or similarity between visualizations (Hoque and Agrawala, 2019; Li et al., 2022).
Researchers have contributed many mathematical formalisms for visualizations to generalize and organize research ideas (Lee et al., 2019). However, existing formalisms such as algebraic frameworks (Kindlmann and Scheidegger, 2014) and Draco (Moritz et al., 2018) focus on modelling operations on a single visualization. There lacks a formalism for operations on multiple visualizations. This issue results in both conceptual and practical gaps between different research problems and techniques. For example, visualization search engines (Hoque and Agrawala, 2019) and visualization sequencing (Kim et al., 2017) seem conceptually separated, yet they share the core idea of measuring the similarity between two visualization specifications. This kind of underlying relevance also provides an opportunity for avoiding “reinventing the wheel” in the implementation and development of visualization techniques, e.g., a reusable function for computing similarities.
To bridge this gap, we present a unified framework to formalizing visualization processing and analysis by mathematical operators on visualizations. As an initial step along this direction, we begin by formalizing visualization operations along two basic dimensions, i.e., what components of visualizations (operand) can be operated on and how can they be operated on (operator). We enumerate possible options of operands and operators by referring to existing implementations about visualization primitives (i.e., Vega-Lite (Satyanarayan et al., 2016)) and image operators (e.g., scikit-image (Van der Walt et al., 2014)), respectively. Based on a systematic analysis of previous work, we contextualize the design space to visualizations. We formally define operands as visualization primitives (i.e., data, transform, mark, and encoding) and identify operators, including three binary operators (i.e., union, intersection, difference) and advanced operators (e.g., sorting and clustering). This formalism provides a framework that is sufficiently clean and simple for us to describe existing techniques and communicate their relevance and subtleties.
We next describe ComputableViz, our proof-of-concept implementation of visualization operations based on Vega-Lite specifications. Our implementation presumes that visualization images, when applicable, can be transferred to specifications by reverse-engineering techniques (Poco and Heer, 2017). Our generic approach converts Vega-Lite specifications into a relational database, based on which mathematical operators are implemented on the grounds of relational algebra (Codd, 2002). Finally, we present several example applications using our implementation. We show that our solution can replicate and provide more efficient solutions to previous applications. We also describe new usage scenarios where ComputableViz helps explore visualization collections and conduct analysis. We conclude by discussing the expressive and generative power of our formalism, important extensions to our design and implementation, as well as future work surrounding processing and analyzing visualizations. In summary, our contributions are as follows:
-
•
We propose a formalism for processing multiple visualizations based on mathematical operations and provide a design space of visualization operations through a literature review;
-
•
We implement ComputableViz, a library for mathematical operations on Vega-Lite visualization specifications;
-
•
We present multiple example applications to demonstrate the benefits, usefulness, and extensibility of ComputableViz.
2. Related Work
Our work is related to image processing and analysis, visualization processing and analysis, programming libraries for visualizations, and mathematical framework of visualizations.
2.1. Image Processing and Analysis
Digital image processing and analysis have been undergoing vigorous growth in wide-ranging research fields. While the continuum of image-related research might not have a clear-off boundary, a useful distinction is often made by considering image processing to be the discipline where both input and output are images (Niblack, 1985). Under this definition, image processing often builds upon primitive operations such as algebra, mathematical morphology, and signal processing techniques (Haralick et al., 1987; Ritter et al., 1990). The area of image analysis furthers the continuum by extracting information from images and “making sense of” image ensembles. Inspired by those concepts, we aim to contextualize operations, processing, and analysis to data visualizations.
Much research has attempted to intertwine image processing and analysis with visualizations. A large body of work focuses on applying image processing techniques to scientific visualizations such as medical and flow visualizations (e.g., (Zhang et al., 2018; Hesselink, 1988; Ebling and Scheuermann, 2005)). Different from them, we concentrate our focus on data visualizations (i.e., charts) that are becoming increasingly popular and important on the web. More importantly, we delineate visualization operations from image operations, since direct operations on visualization images are less meaningful than manipulating semantic information such as visual encodings and data (Brosz et al., 2013; Zhang et al., 2020b). We introduce a novel framework of visualization operations grounded on database theory and demonstrate its feasibility through proof-of-concept implementation.
2.2. Visualization Processing and Analysis
The idea of visualization processing and analysis has been implicitly practiced in much early research for different goals. Several systems are proposed to transform a visualization image into another. For example, VisCode (Zhang et al., 2020a) and Chartem (Fu et al., 2020) output a visualization image with encrypted information. Another line of research studies the problem of style transfer, i.e., to blend two visualizations (one containing visual encodings and one containing data) to create new visualization (Qian et al., 2020; Harper and Agrawala, 2017). Some other work aims to model the difference between two visualizations as an action for recommending visualization sequences or animations (Kim and Heer, 2020; Kim et al., 2017; Shi et al., 2020; Lin et al., 2020) or redesigning visualizations (Wu et al., 2020; Chen et al., 2021b).
Research on visualization analysis comes into focus with the rapid popularization and accumulation of visualizations online (Wu et al., 2021b). Researchers have started to analyze and mine visualization ensembles to derive useful information such as visualization usage online (Battle et al., 2018; Hoque and Agrawala, 2019) and design patterns (Smart et al., 2020; Chen et al., 2020b). Another application is the meta-visualization analysis that aims to explore the data encoded in visualization collections (e.g., (Xu et al., 2018; Zhao et al., 2020)).
The above research topics are diverse and seemingly disjoint, resulting into a conceptual gap that hides the relevance. We propose mathematical operations as a formalism for operating on multiple visualizations, thereby bridging research ideas that are previously considered separate. Through our proof-of-concept implementation, we present an abstraction of their methods that facilitate code reuse and interoperation. Through several usage scenarios, we demonstrate that its scope of application is not limited to the above specialized problems and have huge potentials for future research.
2.3. Programming Libraries for Visualization
Decades of industry and research efforts have given birth to many programming libraries for creating data visualizations. One notable theoretical base is Wilkinson’s Grammar of Graphics (Wilkinson, 2012) that describes a visualization as a combination of layered components such as data, aesthetics, geometric, and facets. Based on Grammar of Graphics, researchers have proposed several widely-used programming languages and grammars such as ggplot (Wickham, 2010) and Vega-Lite (Satyanarayan et al., 2016). Those languages describe data visualizations in a declarative manner, i.e., visualization specifications that contain visualization primitives such as data, visual encodings, and guides. In this way, specifications are stored and circulated in text-based formats. Besides, specifications could be extracted from visualization images through computer vision algorithms (e.g., (Yuan et al., 2021; Poco and Heer, 2017)). Those benefits inspire our implementation, i.e., to develop a proof-of-concept programming language for operating on visualization specifications in Vega-Lite language.
Recent research in the HCI and visualization field has started to develop programming languages for different purposes. Several languages are proposed to tailor the specifications to specific kinds of visualizations such as tree-based (Li et al., 2020), scientific (Liu et al., 2021), probabilistic (Pu and Kay, 2020), and animated (Ge et al., 2020) visualizations. Those methods mainly operate on a single visualization specification that is insufficient for processing and analyzing. Closely related to our work, Gemini (Kim and Heer, 2020) recommends a transition path between two visualizations by modeling the pairwise difference, and Lekschas et al. (2020) proposed Piling.JS, a library for spatial grouping of multiple visual elements. We propose a library that leverages mathematical computations (e.g., union and intersection) for operating on multiple visualization specifications and present several example scenarios to demonstrate its capacity and usefulness.
2.4. Mathematical Frameworks of Visualizations
Much research effort has been made on developing mathematical frameworks to facilitate the quantitative theorization of visualization, which fall into the category of information-theoretic and algebraic frameworks (Chen et al., 2017). Information-theoretic frameworks (Chen and Jäenicke, 2010; Wang and Shen, 2011) manifest the usage of information theory to quantify visual information such as entropy, while algebraic frameworks (Kindlmann and Scheidegger, 2014) describe the uni-directional mappings from input data, through intermediate data representation, to final visualization. Those frameworks focus on modelling a single visualization, whereas we seek to model mathematical computation over multiple visualizations. Through inverse thinking of algebraic frameworks, our method models and reasons about computations on the final visualizations according to the computations over the data and its visual representations.
The theoretical nature of mathematical frameworks has inspired many methods and applications. For instance, information-theoretic frameworks have enabled effective methods for exploring multivariate (Biswas et al., 2013) and volumetric (Ip et al., 2012) datasets, while algebraic frameworks influenced research on validity checking of visualization (McNutt et al., 2020; Qu and Hullman, 2017) and design of visualization grammars (Pu and Kay, 2020). Similarly, we hope that our framework could inspire future research on processing and analyzing visualizations.
3. Visualization Operations
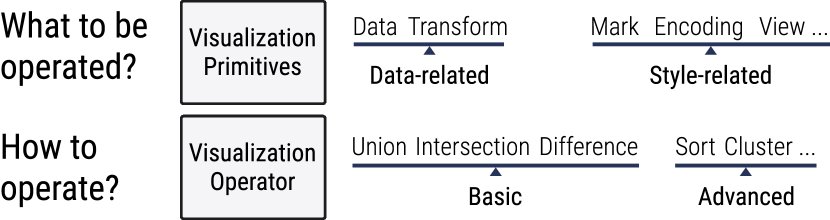
[]The design space of visualization operations is organised along two dimensions: operation targets (what to be operated) and operation types (how to operate).
In this section, we describe visualization operations, i.e., a set of mathematical operations on visualization specifications. Akin to image operations and processing, visualization operations are fundamental building blocks to process visualizations. However, direct operations on visualization images (e.g., arithmetic and morphological operations) might not be always interesting and meaningful. Instead, operations on visualizations often involve visualization primitives such as data and visual encodings. Thus, it is desirable to design a set of operations that are tailored to visualizations.
We adopt a deductive approach to conceptualize visualization operations by exploring its design space along two dimensions: what primitives of visualizations can be operated (operation target), and how can they be operated (operation type). Specifically, we first list possible candidates along the two dimensions by referring to the existing knowledge in related research. Then we narrow the range to verify whether each candidate is meaningful, thereby reaching our conclusions. Finally, we valid the design space by systematically reviewing related work concerned with multiple visualizations to understand the coverage.
3.1. Design
Figure 1 illustrates our final design space of visualization operations, which is organized along two dimensions including operation targets and operation types. Operation targets are basic visualization primitives that are classified into data-related and style-related. Operation types include basic operations (on two visualizations) and advanced operations (on more than two visualizations). We do not argue that the design space is comprehensive. Instead, we consider our design to be initial efforts to conceptualize visualization operations by presenting a basic set.
3.1.1. Operation Target
We decide our scope of operation targets by selecting visualization primitives in declarative visualization grammars. Specially, we refer to the Vega-Lite (Satyanarayan et al., 2016) language which has been gaining extensive popularity (Pu et al., 2021). At the top level, a Vega-Lite specification consists of view specification, data/dataset, transform, mark, encoding, view composition, parameters, and configurations. We classify them into data (including data/dataset and transform) and style (including mark, encoding, and others).
3.1.2. Operation Type
Now that we have considered the operation targets, the next problem is to determine possible operation types. Following our deductive approach, we start with obtaining a list of candidate operations by consulting relevant research concerning images and programs, which are common formats for storing and sharing visualizations (Wu et al., 2021b). Since we do not find well-established frameworks for operating on multiple programs, we consult image-related frameworks concerning image operations in digital image processing (Niblack, 1985) and programming libraries including Google Earth Engine (Google, 2021), Scikit-image (image development team, 2021), and Matlab (Mathworks, 2021). Next, we filter those operations according to several decisions that are summarized as follows:
-
•
Opting for low-level operations. As a preliminary work, we are interested in identifying low-level operations that can serve as building blocks for high-level operations. Therefore, we limit the scope to low-level operations in image processing characterized by the fact that “both inputs and outputs are images” (Niblack, 1985). That said, we discard operations concerning extracting information such as segmentation and feature extraction.
-
•
Excluding spatial- and frequency-based operations. Many image operations aim to improve the image quality by altering the spatial information (e.g., morphological operations) or manipulating the frequency domain. However, we find that such direct operations on visualization images are sparse (Brosz et al., 2013; Zhang et al., 2020b) and therefore exclude them.
Guided by the above decisions, we eventually narrow the scope of visualization operations to basic mathematical operations including union, difference, and intersection. Those visualization operations stem from mathematical operations on images (e.g., add and subtract), while we adapt the wordings in the consideration that a visualization is a collection of visualization primitives. We discuss in the following subsection how those basic operations can lead to more advanced operations concerning more than two visualizations.
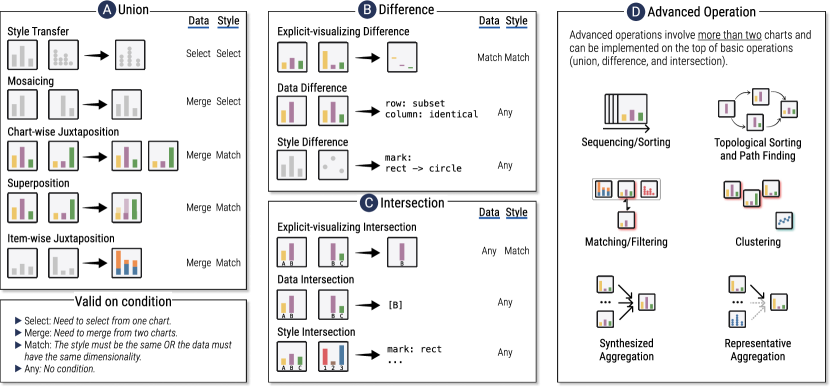
[]We summarize tasks regarding processing and analysing multiple visualizations from existing literature. We structure tasks according to the basic operations (i.e., (A) union, (B) difference, and (C) intersection) and (D) advanced operations. The first three are basic operators on two visualizations, while advanced operations involve more than two visualizations.
3.2. Refinement
The design space in Figure 1 is the outcome of the first phrase in our deductive approach, i.e., starting from a general premise that the fundamental ideas of image processing are legitimate in the context of visualizations. The next phrase is to refine and contextualise the design space by observation and confirmation. Specifically, we refine and validate visualization operations (Figure 1) by surveying existing work regarding processing and analysing multiple visualizations. Our goal is to construct a design space that is purposeful (i.e., solving real problems) and descriptive (i.e., generalizing across different studied problems).
Collecting Literature. We collect the literature by referring to recent related surveys (Wu et al., 2021b; Wang et al., 2021) on the use of AI and machine learning in data visualizations. We further augment the corpus with related concepts concerning multiple visualizations such as visual piling (Lekschas et al., 2020), visual comparison (LYi et al., 2020), composite visualization (Javed and Elmqvist, 2012; Yang et al., 2014), and visualization combinations (Schulz and Hadlak, 2015). We focus on research about lower-level operations, excluding statistical analysis of visualization collections (e.g., (Battle et al., 2018)).
Extracting Tasks. We extract tasks from the surveyed literature. We mainly adopt the naming of tasks in literature and in few cases create new names when necessary. For example, the task “topological sorting and path finding” is abstracted from several visualization recommender systems (Kim et al., 2017; Lin et al., 2020; Vartak et al., 2015; Mafrur et al., 2018; Wu et al., 2020; Qian et al., 2020) that contains a topological graph structure, where each node represents a visualization and each edge denotes an edit operation. Those systems aim to find a series of visualizations (nodes) or operations (links) that abstractly are a path.
Organizing and Abstracting Tasks. We organize those tasks by abstracting them into operations, i.e., which operation can support accomplishing the task. As illustrated in Figure 2, we observe two types of scenarios. First, Figure 2 (A-C) represents tasks that can be supported by basic operators, i.e., union, difference, and intersection, respectively. Each task concerns the data and/or style of the visualizations. We notice and describe conditions on which the task is valid. Second, Figure 2 (D) shows several advanced operations concerning more than two visualizations, which can be developed based on the three basic operators. We discuss details in section 3.2.2.
3.2.1. Basic Operation
We identify three basic operators including union, difference, and intersection.
Union
The union operation combines visualization primitives from two or more visualizations. Union provides support for style transfer (Qian et al., 2020; Wang et al., 2019; Harper and Agrawala, 2017) by selecting data from one visualization and selecting styles from another visualization. A similar task is extending static visualizations with new incoming data (Chen et al., 2020a, 2019), which requires merging the data from two visualizations. We refer to the general task as mosaicing, i.e., two or more visualizations of different views of a dataset can be mosaiced to represent the complete view. We borrow this concept from similar ones such as image mosaicing (Capel, 2004) and document mosaicing (Zappalá et al., 1999).
Another set of tasks supported by union is for visualization composition (LYi et al., 2020) and visual comparison (Javed and Elmqvist, 2012; Yang et al., 2014), including visualization-wise juxtaposition, superposition, and item-wise juxtaposition. Those tasks merge the data between the visualizations and require that the visual encodings of two input visualizations are equivalent. It should be noted that visualizations with different visual encodings can still be superimposed or juxtaposed, which might not always be meaningful and therefore excluded in our discussion.
Difference
The difference operation can be used to explicitly visualize difference, a common approach for visual comparison (LYi et al., 2020). This task requires that the data and style of two visualizations should match each other. If not matching, one could compute the data difference and style difference. Both types of differences can be mapped to semantic operations which are useful in visualization authoring, e.g., data differences can be used to generate data stories (Shi et al., 2020), and style differences help in recommending (Kim and Heer, 2020; Kim et al., 2017; Lin et al., 2020) or redesigning visualizations (Wu et al., 2020; Chen et al., 2021b). However, there exists many approaches to describe the difference such as natural language (Yu and Silva, 2019), parameterized function (Wu et al., 2019), and numerical scores (Kim et al., 2017). Our goal is to represent the difference in a generic format that can be converted into other formats with advanced techniques.
Intersection
The intersection operation is highly related to the difference operation. Therefore, the task covered by intersection is an analogy of that of difference, including explicit-visualizing intersection, data intersection, and style intersection.
3.2.2. Advanced Operation
We identify six tasks concerning advanced operations in surveyed literature. Those operations are named “advanced” since they concern with more than two visualizations and can be implemented by basic operations.
The first task is sequencing/sorting, which is used to find an optimal sequence of visualizations (Shi et al., 2019) or sort visualizations in browsers (Chen et al., 2020b). However, the relationships among visualizations are often non-linear, but instead modelled using a topological graph structure, where each node represents a visualization and each edge denotes an edit operation or the visualization difference. This issue motivates the second task topological sorting and path finding that aims to find an optimal destination node given an input node. This task is widely studied in visualization recommender systems (Kim et al., 2017; Lin et al., 2020; Vartak et al., 2015; Mafrur et al., 2018; Wu et al., 2020; Qian et al., 2020). Both tasks require comparing two visualizations that can be implemented via difference or intersection.
Another two tasks, i.e., matching/filtering and clustering, are related, both concerning measuring the difference between visualizations. Matching/filtering is concerned with visualization retrieval system (Hoque and Agrawala, 2019; Saleh et al., 2015), i.e., to find a visualization that is similar or related to the input visualization. Clustering provides support for meta-visualization analysis (Zhao et al., 2020; Xu et al., 2018). Both tasks might require a distance function that converts the difference/intersection into a numeric score.
Lastly, synthesized aggregation and representative aggregation are common methods to summarize multiple visualizations (Lekschas et al., 2020). According to the taxonomy by Lekschas et al. (Lekschas et al., 2020), another type of aggregation method is abstract, i.e., to provide a simplistic or schematic representation. We exclude this type because its output is no longer a visualization but instead the “category or type” that needs high-level operations such as visualization classification. Synthesized aggregation can build upon mosaicing, while representation aggregation can be implemented via sorting.
3.2.3. Discussion of Limitations
From our analysis, we identify several limitations of visualization operations including the operand (i.e., what to operate) and the operator (i.e., how to operate).
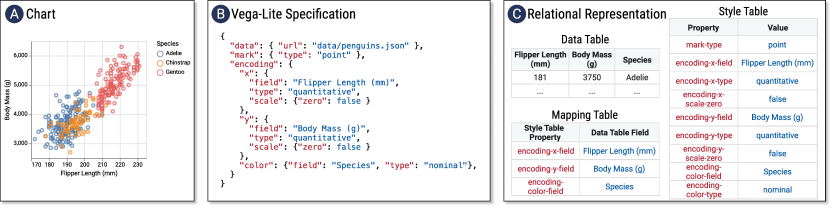
[]We represent visualization specifications as a relational database, whereby enabling operations grounded on relational algebra such as joins.
Coverage of operands.
We observe that operands represent a fundamental difference between image and visualization operations. Image operations directly manipulate the image data (e.g., pixel values in RGB), while operations on visualizations are mostly performed on the specifications (e.g., data and encoding). However, we find few approaches that directly alter the visualization images such as transmogrification (Brosz et al., 2013). As such, our method does not support operations on the images, which require further extension.
Coverage of operators.
Most of image operators stay legitimate in the context of visualizations, with few exceptions. We discuss the coverage of our visualization operators from two perspectives: breadth and depth.
From the perspective of breadth, there exist tasks that are not covered by the operators in Figure 2. For instance, some types of hybrid visualization such as nesting (Javed and Elmqvist, 2012) are performed by replacing one visualization by nested instances of another, which might be abstracted into a convolution operator. The F3 system (Knudsen, 2015) supports creating a view matrix that combines the views’ dimensions by specifying diagonal views, which can be described by a Cartesian product operator. Besides, the current space of mathematical operators cannot precisely describe complex tasks such as interpolating (Schulz and Hadlak, 2015) or morphing (Ruchikachorn and Mueller, 2015) existing visualizations, which might require geometric operators. This problem warrants future research to investigate the design space of hybrid, nested, and coordinated visualizations. Finally, our operators exclude unary ones, which can help describe actions, interactions, and other provenance data on a single visualization (e.g., VisAct (Wu et al., 2019) and Trrack (Cutler et al., 2020)). Thus, an extension to unary operators requires surveying the broad literature such as visualization authoring, interaction, and provenance.
From the perspective of depth, mathematical operations can be insufficient in fully solving challenging tasks such as visualization clustering, which needs more advanced approaches such as machine learning (e.g., (Zhao et al., 2020)). However, mathematical operations provide sensible baseline approaches and facilitate data processing that prepares machine learning approaches. We demonstrate in Section 5 how mathematical operations can be extended to machine learning tasks.
4. Implementation
We develop a proof-of-concept implementation of visualization operations to realize the design in Figure 1. Specifically, we present a python library for operating on Vega-Lite specifications. Our implementation is mainly grounded on database theory. We first convert a specification into a relational database and then leverage relational algebra (Codd, 2002) (e.g., join) to perform operations. In the following text of this section, we first describe our design considerations, followed by implementation details.
4.1. Implementation Consideration
Based on the above analysis of literature, we derive the following considerations that guide our implementations.
C1: Operating visualization primitives separately. Our analysis suggests multiple scenarios with different conditions on data and other visualization primitives. For example, users might be only interested in computing the difference of style-related primitives between visualizations. Therefore, those primitives should be operated separately.
C2: Supporting different tasks by passing parameters. One operation might support different tasks, e.g., the union operation can be used to achieve style transfer and mosaicing which concern selecting and merging data, respectively. Therefore, it is desirable to implement abstract functions with parameterization that allows for code reusability.
C3: Representing visualization difference and intersection in interoperable formats. Visualization difference and intersection are often represented in different formats (e.g., natural language and numeric score) depending on the specific needs. Our goal is to represent them in interoperable formats which can be transferred to other formats with advanced techniques such as machine learning.
4.2. Implementation Detail
We implement visualization operators based on Vega-Lite specifications. However, Vega-Lite specifications are in JSON schema that is semi-structured and difficult to perform operations such as union (Liu et al., 2014). We overcome this challenge by converting specifications into a relational database, whereby implementing operators on the grounds of relational operations.
4.2.1. Converting Specifications into Relational Representations
We convert the visualization specifications into a relational database composed of basic tables and a mapping table.
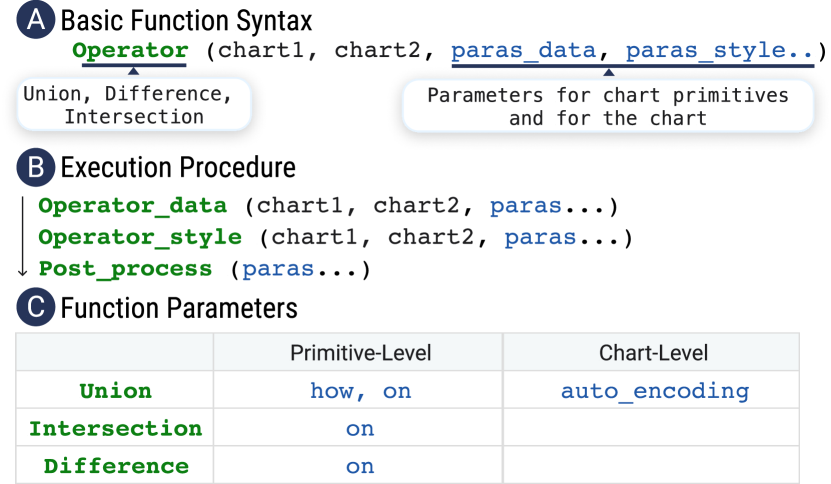
[](A) The parameters of visualization operators include two input visualizations, primitive-level and visualization-level parameters; (B) The operator works on visualization primitives separately, followed by a post-processing step; (C) The primitive-level and visualization-level parameters vary according to the operation.
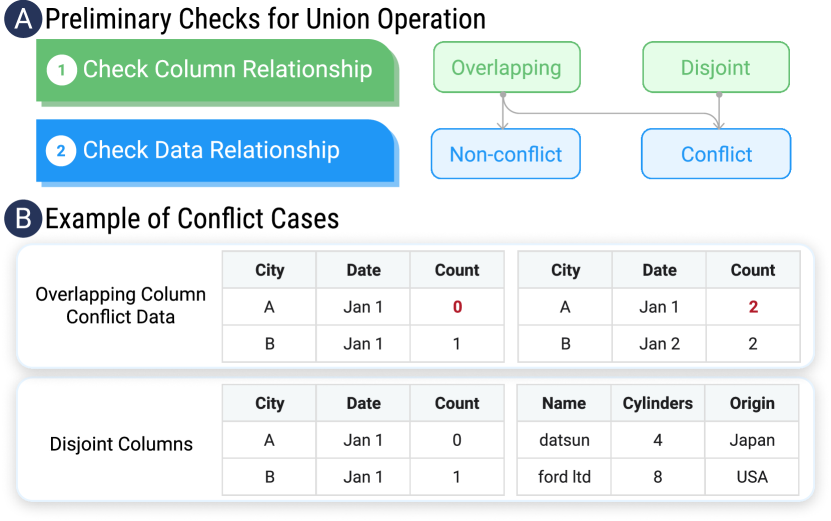
[](A) The union operation starts with preliminary checks; (B) Conflicting data tables cannot be automatically combined.
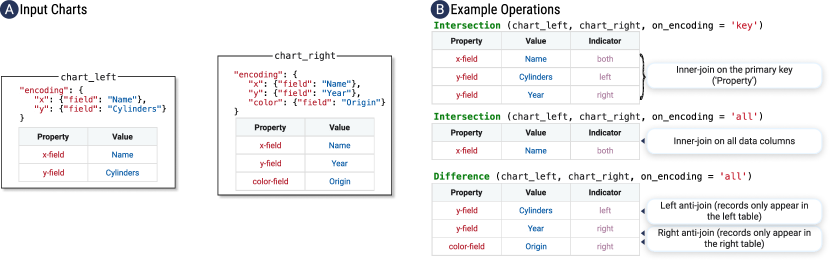
[](A) The encoding table of input visualizations; (B) Examples of intersection and difference operations.
Basic Tables. As shown in Figure 3 (C), our relational representation consists of tables for each visualization primitive. The data table is mostly consistent with the original data. However, our relational representation drops data columns (fields) that are not encoded to avoid redundant information by default. For style-related primitives, we convert the JSON format to property-value table structure. We flatten nested JSON objects by concatenating keys with nested levels using a dash character (e.g., “encoding-x-field” in Figure 3) which is reversible since the JSON scheme does not allow duplicate keys.
Mapping Table. We implement a mapping table to store the relationships between the data table and other tables such as encoding. Those mapping relationships need to be maintained when changing the data.
Alternative Representations. We consider multiple alternative representations of specifications including logic programming (e.g., Draco (Moritz et al., 2018)), relational programming (e.g., VQL (Luo et al., 2020) and CompassQL (Wongsuphasawat et al., 2016)), and set-theoretic programming (e.g., Viser (Wang et al., 2019)). However, those specifications are lossy and contain limited information. For instance, Draco expresses data by a set of data attributes instead of the entire dataset, and VQL discards non-data encodings such as view sizes and interactions. Different from them, our relational representation is lossless and reversible to the original Vega-lite specifications.
4.2.2. Implementing Visualization Operation by Relational Operators
Figure 4 illustrates the functions implemented for visualization operations.
The function syntax takes two visualizations and parameters as input.
Each operation is first executed on the data table and the style table separately, followed by post-processing (C1).
We implement the operation on those tables based on the JOIN clause in relational algebra (Codd, 2002).
Specially,
the union operator builds on the FULL OUTER JOIN clause which merges all records when there is a match in the left table or the right table records.
Similarly,
we realize the intersection operator by the INNER JOIN clause that requires records to match one in both tables.
In a slightly different manner,
the difference operator consists of three steps,
including the left and right ANTI-JOIN that find records that only appear in either the left or the right table.
Function Parameters
As shown in Figure 4 (C), the function parameters vary depending on the operator (i.e., union, intersection, or difference) and the level (i.e., visualization-level or primitive-level), that are listed as follows (C2).
The on parameter is a common one for primitive-level operations.
It specifies columns on which the JOIN clause is performed.
Specially,
it can take either ’key’ (i.e., joining on primary keys) or ’all’ (i.e., joining on all columns).
The how parameter handles the data-conflicting scenarios as in Figure 5 (B).
Its value could be ’left’, ’right’ (i.e., selecting either the left or right one) or ’merge’ (i.e., merging two tables by adding a new indicator column denoting whether the record is from the left or right table.
The last parameter ’auto_encoding’ switches a post-processing step for the union operation.
If true,
it will automatically create a new visual encoding for indicator columns.
An indicator column consists of two constant values for data records in the left and right visualization, respectively.
Here we implement a heuristic to assign new visual encoding channels,
i.e., to pick an idle channel (if any) in the order of color, opacity, column, and row.
Union
We perform preliminary checks on the input data tables following two steps, as shown in Figure 5.
First,
we check whether the columns of two data tables are not disjoint,
since FULL OUTER JOIN requires common columns on which tables are merged.
Second,
we detect conflicting data records between two tables using a heuristic-based method.
We compare data records according to their primary keys (i.e., columns that contain values that uniquely identify each record).
However,
it still remains an unsolved problem to automatically detect primary keys (Jiang and Naumann, 2020).
Therefore,
we make a simplifying assumption that a primary key is a unique key of ordinal, categorical, or temporal data types.
Figure 5 (B) illustrates an example where data conflicts are detected according to the primary key <City, Date>.
The last post-processing step handles the problem of broken links after the union operation.
Specially,
some values in the encoding and transformation specification (e.g., field, groupby) are linked to corresponding data columns,
which might be missing in the merged data tables.
Therefore,
the last step recovers the links by assigning new data columns to those missing links.
Our assigning strategy prioritizes data columns with the same data type of the origin one.
Intersection and Difference
We represent the results of intersection and difference in database formats that are common and convenient to process (C3),
as shown in Figure 6.
We implement both operators using the JOIN relational operator.
This operator creates a new column named indicator that has a categorical type with the value of “left” if the record only appears in the left visualization, “right” if the record appears in the right visualization, or “both”.
Our representations provide basic information that can be converted to other practical formats. For instance, the difference operation (Figure 6 (B-bottom)) can be used to detect value conflicts by finding duplicates on the property column. It is also possible to transform the results into natural language sentences using template-based methods (e.g., “adding a new encoding by assigning the data field Year to the encoding channel x”). Moreover, distance functions can be proposed to map the table into a numeric score that enables advanced operations such as clustering and matching.
5. Usage Scenarios
To demonstrate the usability and extensibility of visualization operations, we present several usage scenarios regarding visualization processing or analysis. We situate those scenarios in the context of existing literature and illustrate how our implementation offers new and more efficient solutions to those problems. The source code is provided as supplemental material.
We present a total of six usage scenarios. The first two scenarios focus on visualization processing including creating accessible visualizations and compositing visualizations. Both scenarios are implemented by a single-line union operation, showing that our abstraction can cohere previously separate ideas and promote code reuse. The last four scenarios further the application to visualization analysis. We show that our operations can be combined or extended to support version control, perform meta-visualization analysis, conduct clustering analysis, and explore the “genealogy” tree of visualizations. Those scenarios demonstrate that our formalism and implementation can generate new, feasible solutions to emerging problems in a more automated and scalable manner.
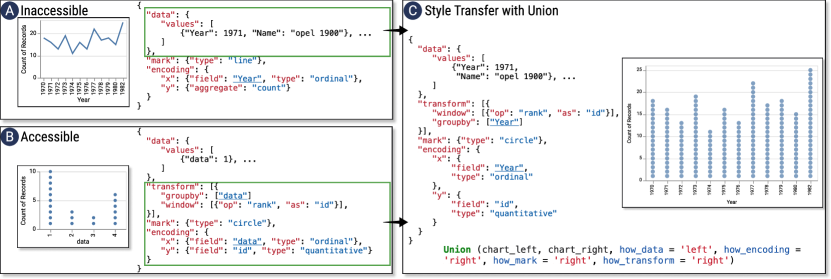
[](A) A original line visualization that is inaccessible for people with intellectual and developmental disabilities; (B) A dot-based plot that is accessible; and (C) The original visualization is converted to an accessible one by a singe-line union operation which can be executed at scale.
5.1. Style Transfer to Accessible Visualizations
Visualization accessibility has been gaining increasing attention during the past years. Many existing visualizations are inaccessible, and researchers recently started calling for scalable and affordable approaches that automatically convert charts into accessible designs (Kim et al., 2021). For example, Wu et al. (Wu et al., 2021a) suggested that the commonly used line charts (Figure 7 (A)) are not accessible for people with intellectual and developmental disabilities, while a dot-based plot is a better alternative (Figure 7 (B)). One possible solution to the above problem is style transfer, i.e., to blend the data of the original visualization (visualization A) with the visual encodings of another (visualization B).
However,
existing implementations of visualization style transfer either focus on a limited set of visualization types (Qian
et al., 2020; Wang
et al., 2019) or require manual editing (Harper and
Agrawala, 2017) which is difficult and time-consuming for two reasons.
First,
visualization authors need to read and comprehend the specifications for the visualization B,
which contains advanced data transformation such as window.
Second,
they need to merge two specifications and carefully revise the values of data-related entries (e.g., field and groupby) that are bound.
Our implementation provides an automated approach through the union operation (Figure 7 (C)). This operation reduces the efforts for manual editing and can apply to inaccessible visualizations at scale. Furthermore, it can be extended to other forms of accessible charts (e.g., colorblind-friendly palettes).
We benchmark the expressiveness of our approach by constructing a test case suite of 374 Vega-Lite specifications on the official example gallery (Vega-Lite, 2020), to which we refer as target style visualizations. Those visualizations vary from simple charts to layered plots and multiple-view displays. For each test case, we construct a corresponding data visualization that encodes the same number and type of data fields with the style visualization. A test case is successful if the visual encodings of the style visualization can be applied to the data visualization. The result shows that 264 (77.4%) test cases are successful, which is very encouraging given the wide diversity of those official examples.
We analyze the failing cases to motivate future research.
First, 53 cases are due to specifications expressed in string formats,
e.g., "calculate": "(datum.year % 10)".
When updating the dataset,
our method can not parse the string format and replace the data column (i.e., year).
The second type of errors (18 cases) is related to data values such as "extent": [2500, 6500]",
which might become invalid extent for the new dataset.
To address those problems,
future work might apply table transformation methods (Feng et al., 2017) to parse those data-related entities and automatically update new values.
Finally,
our method cannot handle map visualizations (5 cases) and might fail at parsing time strings (1 case).
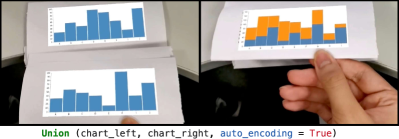
[]With the auto-encoding mechanism, the union operation merges two bar charts into a stacked bar visualization to represent more comprehensive view of data. This example is implemented under Mobile AR environment where the union operation is performed by physically overlaying two charts.
5.2. Interactive Visualization Composition
Visualization composition concerns combining two existing visualizations in the same visual space to facilitate visual comparison (LYi et al., 2020) and more comprehensive data analysis (Yang et al., 2014). Existing solutions to visualization composition such as Data Illustrator (Liu et al., 2018) are mainly implemented on graphical user interfaces, require manual manipulation or programming. Automated methods can be helpful in reducing human efforts, increasing the scalability, and adapting to post-WIMP interfaces like AR.
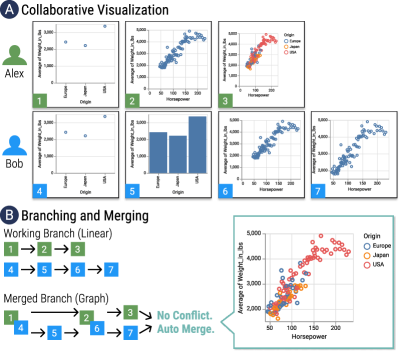
[](A) Two data workers create a series of visualization versions in collaborative visualization; (B) ComputableViz helps merge collaborators’ working branches into a graph structure. Besides, the final versions can be merged since no conflicted is detected.
With ComputableViz, visualization composition can be implemented based on the union operator in an interactive manner. In Figure 8, we show an example where two standard bar charts are composited into a stacked bar visualization by overlaying them in Mobile AR environment. This feature introduces new possibilities of visualization interactions (Dimara and Perin, 2019) by treating the whole visualization as the primary object, which are potentially beneficial (e.g., increasing user engagement) and warrant deeper studies.
We benchmark the expressiveness by replicating the composited layout in visual comparison111https://sehilyi.github.io/comparative-layout-explorer/. ComputableViz can replicate 13 (54%) out of the 24 cases. Failing cases include mirror layouts (6), composite marks (3), and item-wise adjacent juxtaposition (2). ComputableViz only supports adding a new encoding channel in visualization composition, while those cases require additional operations (e.g., mirror layouts require reversing the axis of one visualization). To solve those problems, a promising research topic is to design and develop grammars for visualization composition (e.g., (Chen et al., 2021a)).
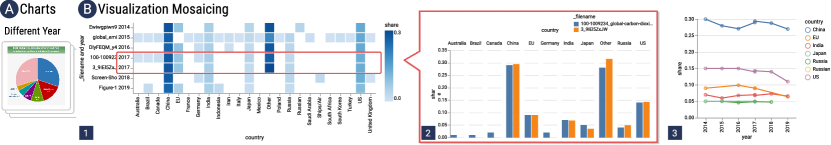
[]The union operation converts (A) multiple pie charts encoding countries’ share of carbon emission in different years to (B) mosaicked visualizations including (1) a heat-map summarizing the whole data, (2) a stacked bar visualization comparing two charts with conflicting data (both in 2017), and (3) a time series showing the trend of commonly referred countries.
5.3. Version Control in Collaborative Visualization
One important aspect of collaborative visualization involves version control that records changes to the visualization and resolves conflicts among collaborators (Schwab et al., 2020). Although version control is a well-established technique in software engineering, its adoption to data visualizations remains low. Specially, existing approaches mainly use timestamps to resolve orderings that are not aware of the visualization content (Badam and Elmqvist, 2014) or do not support conflict detection (Cutler et al., 2020).
ComputableViz addresses this problem by creating a history graph recording different versions of the visualization. For instance, in Figure 9, the historical versions made by two collaborators are represented by branches, where each node represents a version. Branches can be merged to form a graph by grouping and combining identical nodes using the difference operation (i.e., the difference between two charts is none). Such graph-based representations can effective reveal the patterns such as vertex connectivity (representing commonly visited versions), which can not be easily found in linear representations (Xu et al., 2020). Besides, ComputableViz can detect merge conflicts that are common in collaboration. As shown in Figure 9 (B), the visualizations created by two collaborators (Alex and Bob) diverge after the version 2/6, where Alex adds a new color encoding and Bob adjusts the axes’ extent. Since two changes are not conflicting (by using the difference operator), the final visualizations can be merged to facilitate the collaboration.
5.4. Visualization Mosaicing
As visualizations are increasingly shared on the web, so are their impacts on the public and society. As such, recent research has started to investigate the information communicated through data visualizations (Zhang et al., 2021; Comba, 2020). However, their approaches rely on manual analysis which does not scale well.
We introduce visualization mosaicing as an initial approach towards more automated analysis, that is, two or more charts of different views of a dataset can be mosaiced to represent the complete view. We borrow this concept from similar ones such as image mosaicing (Capel, 2004).
In Figure 10 (A), we show a collection of charts showing the countries’ share of carbon emission in different years. Those visualizations are collected from Google Image Search. We leverage reverse engineering techniques (Poco and Heer, 2017) to obtain their corresponding specifications. To get an overview of those visualizations, we apply multiple-way union and visualize the results using a heat-map. In Figure 10 (1), we observe how frequently each country is mentioned in original visualizations, i.e., common countries include China, India, Japan, and US which might be due to their significant emission. Only one visualization includes data from (international) ships and air, which might prevent the public from understanding that aviation is considerably responsible for carbon emission. Besides, we note that two charts encode the data in 2017. By composing them in Figure 10 (2), we observe that their data is not consistent, which indicates potential data errors and misinformation. Finally, we can convert the heat-map to a time series (Figure 10 (3)) to explore the trend of commonly referred countries, which cannot be easily found in the original visualization collection.
5.5. Computing Visualization Embedding for Clustering Analysis
Clustering has emerged as a new technique for analyzing a visualization collection and conducting meta-visualization analysis (e.g., (Zhao et al., 2020; Xu et al., 2018)). The state-of-the-art method (Zhao et al., 2020) leverages grammar variational autoencoders (GVAE) to convert Vega-Lite specifications into embeddings, which are subsequently projected onto a two-dimensional space for clustering analysis. However, the reported performance of GVAE remains relatively low (i.e., 44.46%) which degrades the final clustering results. Besides, such methods are end-to-end and not configurable, while users might want to specify criteria for visualization clustering (e.g., cluster charts by types or colors).
To solve those problems, we propose visualization clustering based on ComputableViz. Specifically, we first execute the difference operation to derive the results (Figure 6 (B)). We then apply a manual-configurable weighting function to different properties, whereby obtaining a score measuring the distance between two visualizations. The above steps are repeated for every pair of visualizations to get a distance matrix, which is subsequently fed into a multidimensional scaling model (Cox and Cox, 2008) to compute the visualization embeddings. Critically, the weighting function is configurable, which could be designed for particular purposes based on domain knowledge or integrate cost functions from previous research such as GraphScape (Kim et al., 2017).
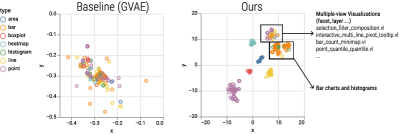
[]Visualizations of the learned embeddings by the baseline and our approach.
We conduct an experiment of clustering visualization by their types.
The dataset includes Vega-Lite specifications in the official example gallery (Vega-Lite, 2020),
where the ground truths of visualization types are available in the file name.
We filter out visualization types whose frequency is less than ten and obtain 210 visualizations in total.
According to our domain knowledge,
we assign higher weights to mark_type (the type of visual marks) and field_type (the data type of encoding channels) that are closely related to visualization types.
We compare our method with the GVAE algorithm in ChartSeer (Zhao
et al., 2020) and visualize the embeddings using t-SNE (Van der Maaten and
Hinton, 2008).
As shown in Figure 11,
our method can separate visualizations by their classes,
while the baseline approach achieves poorer performance.
Visualizations embeddings of bar charts and histograms are projected nearby, which is reasonable.
Besides,
we note that multiple-view visualizations are clustered together irrespective of the visualization type.
In summary,
our method demonstrates a feasible and effective solution for clustering visualizations by customizable criteria.
5.6. Exploring the Genealogy of Visualizations
The large collection of online visualizations has served as a source for visualization designers and researchers to explore and investigate design demographics. Existing work is mainly based on simple statistics to explore questions such as “which visual attribute—position, length or color—is most commonly used to encode data?” (Hoque and Agrawala, 2019; Battle et al., 2018). A missing perspective is the relationships among those designs, which is important for understanding the design evolution.
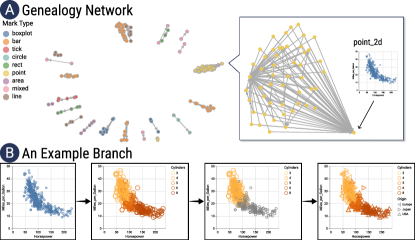
[](A) The genealogy tree of 340 Vega-Lite examples; (B) A example branch showing how a scatterplot design evolves to encode more information or enable new interactions.
We construct the genealogy network of the Vega-Lite examples (Vega-Lite, 2020).
Specially,
we define that a visualization is an ancestor if it is a subset of another visualization.
We compute such relationships by the intersection operation and ignore specification entities that are irrespective of visual designs such as description.
Figure 12 (A) provides an overview of the derived genealogy network with dozens of sub-networks. We note a large sub-network consisting of yellow-colored nodes, which is rooted from a simple 2D scatterplot. This shows that the scatterplot has evolved into a wide range of more complex designs. Figure 12 (B) shows an example branch of design evolution. The genealogy network allows us to quickly find a simpler and more advanced version of visualization designs. Furthermore, the network can be used to organize the tutorials for specification learners. For example, the genealogy branch can be converted to a step-by-step tutorial with increasing complexity. When learners have difficulties in understanding complex visualization specifications, they could traverse to the ancestor as prerequisites. Finally, siblings can be recommended as “related topics” to guide exploration.
6. Discussion and Future Work
The past years have witnessed a growing body of research on processing and analyzing visualizations after they have been generated and digitized, with substantial advances being made on developing new techniques (e.g., visualization sequencing (Kim et al., 2017)) and applications (e.g., style transfer (Qian et al., 2020)). Our work is motivated by a gap concerning the isolation among research ideas and we aim to contribute to an improved understanding and clearer organization of existing literature. We therefore propose defining mathematical operations as a formalism for processing multiple visualizations. In this section, we discuss the capabilities and limitations of our formalism to inform future research.
6.1. Descriptive and Generative Power
We now discuss the utility of our formalism regarding its descriptive power (i.e., to describe existing solutions) and generative power (i.e., to help create new ideas and solutions).
The descriptive power is rooted in our classifications for operations in terms of what (operation target) and how (operation type). Our formalism is therefore compact and expressive - basic operations can describe complex tasks, e.g., style transferring is described by a union operation on data and style. As illustrated in Section 3.2.1, the proposed formalism enables us to clearly express, classify, and organize relevant work at the conceptual level. From a practical perspective, we demonstrate its ability and potentials to facilitate code reuse despite the disparities between the applications. For instance, the union operation in our implementation can reproduce both style transfer (Section 5.1) and visualization composition (Section 5.2), which are previously separated. However, we acknowledge that our formalism cannot represent operations directly on visualization images such as transmogrification (Brosz et al., 2013). Future work could extend our formalism to support such tasks.
Much of the generative power originates from the starting formalism based on binary operators. The formalism is thus compositional and modular, as binary operations are the keystone of advanced computations concerning more than two visualizations and even a collection of visualizations. As discussed in Section 3.2.2, we identify six advanced operations using binary operations as a basis. For example, both filtering and clustering build upon measuring the distance between two visualizations, which can be implemented by an intersection operator combined with an additional weighting function (Section 5.5). Although our current advanced operators might not be comprehensive, our formalism can point researchers toward other scenarios where new operators can be generated. Furthermore, we show that our formalism can generate actionable solutions to emerging problems such as creating accessible visualizations (Section 5.1). We hope that our formalism could help abstract other problems in terms of which and how operators can be applied.
6.2. Scalability and Usability
Our proof-of-concept implementation provides reliable starting points for performing mathematical operations on visualization specifications to enable new applications. There remain several challenges and promising research opportunities for improving the scalability and usability of ComputableViz.
Improving the heuristics. The current implementation relies on several heuristics, e.g., to infer key columns and detect data conflicts. Those heuristics are simple, manageable, and efficient in terms of running time. However, heuristics can be error-prone, especially when applying to real-world visualizations with considerable data noises, e.g., in Section 5.4. To address this problem, future research might leverage machine learning methods (e.g., (Nargesian et al., 2018)) to improve the performance. However, this perspective presents significant research challenges such as gathering high-quality training data, adopting and evolving models, and improving the model explainability and trustworthiness (Saket et al., 2018).
Refining the programming abstraction. Our implementation inherits the abstraction from the conceptual formalism (Figure 2), e.g., it abstracts both style transfer and visualization composition into a single union function through parameterization. Although this abstraction generalizes behaviors and promotes code reuse, it could have a cost related to usability and scalability. For example, end-users need to manually configure those parameters, e.g., determining which properties of the specifications should be chosen. Such manual configuration can be diminished by implementing specific functions for style transfer and visualization composition, respectively, but at the cost of smaller scope of customization and flexibility. Given the practical nature of software engineering, future research should survey end-users in the wild to refine the programming abstraction.
Representing visualization data more expressively.
Our benchmark in Section 5 shows that our relational representations of visualization produce a few failing cases,
especially for non-basic visualizations such as composited and layered charts.
For example,
it cannot handle expressions in the string format for custom calculations such as "calculate": "datum.Time/datum.TotalTime * 100",
which requires new approaches to parse strings into relational formats.
Besides,
the union operation can not automatically produces mirror layouts and composite marks but needs tedious manual adjustment.
A potential approach is to develop more expressive language for visualization composition.
Recent work on coordinated grammars for graphics (Chen
et al., 2021a) seems quite promising and is worth further exploration.
6.3. Generalizability and Interoperability
This work treats Vega-Lite specifications as the primary data representation of visualizations. A clear next step is to extend ComputableViz to other types of representations such as other visualization languages and images. In the following text, we discuss the current limitations and improvement roadmap regarding generalizability and interoperability.
Generalizing to other visualization language. An important step of ComputableViz is to convert Vega-lite specifications to relational representations for computation. This conversion is generalizable to other declarative language such as Vega (Satyanarayan et al., 2015) and ECharts (Li et al., 2018). However, it is more challenging to apply ComputableViz to imperative language such as D3 (Bostock et al., 2011) which has higher flexibility and expressive power. Thus, it would be beneficial to develop new methods for translating among different visualization language to promote interoperation.
Continuing research on converting visualization images to specifications. Visualizations are often created and shared in image format. To apply ComputableViz on visualization images, it is necessary to extract the specifications from images through computer vision techniques (e.g., (Poco and Heer, 2017)). However, those techniques are not sufficiently robust (Davila et al., 2020). In our use case (Section 5.4), we manually fixed the errors in extracted specifications, which could become less affordable with the increasing number of visualizations. Therefore, it is necessary to continue research and improve performance.
6.4. Towards Visualization Analysis
Our work contributes initial efforts toward automated analysis of existing visualizations. With the rapid proliferation of data visualizations online, visualizations are becoming an increasingly important medium for communicating information, comparable with other mediums such as text and images. This perspective underscores the promising opportunities of research on visualization analysis akin to image analysis and text analysis.
Exploring the power of visualizations on the web. We present an application in Section 5.4 where ComputableViz allows summarizing visualizations and identifying potential data errors. There exist huge potentials for other applications by making use of the huge number of visualizations online. For example, data visualizations often appear in web articles and social media and have strong persuasive power and impact (Pandey et al., 2014). How can we analyze those visualizations to understand their content, semantics, and indented messages especially in high-impact domains such as public health and politics? How can we automatically detect visualizations with misinformation or harmful content? Besides, visualizations are often byproducts in data-enriched documents such as financial statements and Wikipedia, containing extensive information and human knowledge. It would be helpful to mine visualizations to improve our understandings of those documents.
Proposing new techniques for analyzing visualizations. We propose mathematical operations on data visualizations, which provide a foundation for analysis and have much room for future improvement. First, ComputableViz implements basic operators, based on which users could create ad-hoc solutions to advanced operators (e.g., clustering). An important extension of ComputableViz is to build a collection of algorithms for visualization analysis, that is similar to image analysis libraries such as scikit-image (image development team, 2021). Second, existing algorithms for converting visualization images to specifications are imperfect, producing errors and uncertainty. Thus, future techniques for visualization analysis need to be uncertainty-aware. A potential solution is to involve human in the loop for conducting analysis, e.g., by visual analytics approach. Finally, visualizations are characterized by multi-modality including images, text, and data (Wu et al., 2021b), posing unique research challenges for visualization analysis. This distinction calls for the needs of new techniques that are more tailored to visualizations.
Thinking visualizations as data about data. Visualizations are traditionally described as graphical representations of data, while recent research has started to think visualizations themselves as data, i.e., data that provides information (visual encodings) about other data (Wu et al., 2021b). Without knowing the underlying encoded data of visualizations, it is very difficult to leverage their content, especially in combination with others (Wu et al., 2021c). We apply heuristic-based approaches to detect value conflicts and merge data tables, which has limited applicability in real-world scenarios with noisy datasets. For example, it is necessary to link the data entities in visualizations that might have different wordings. In the future, we plan to integrate the techniques for analyzing data tables in the database and web research such as entities linking (Limaye et al., 2010) and table union search (Nargesian et al., 2018). We hope that such interdisciplinary perspective will inspire and engage the research community to develop innovative techniques and applications for analysing and mining visualizations.
Building a closed-loop ecosystem of online visualizations. Our work is primarily concerned with processing and analyzing multiple visualizations after they have been generated and digitized. Such process and analysis should not be an endpoint, but in turn can empower us to create new and better visualizations. For instance, we show in Section 5.1 that reusing visualizations enables us to create accessible visualizations in a scalable manner. Moving forward, we plan to explore how our formalism could foster the creation of more advanced visualizations such as multiple views, nested and composited visualizations. To that end, it would be beneficial to visit other formalisms or design space in related areas such as multiple coordinated views (Weaver, 2004; Knudsen and Carpendale, 2016) and visualization construction (Méndez et al., 2016; Mei et al., 2018). This perspective poses new challenges on the extension of our formalism to support operations on additional factors such as layout and inter-view relations.
7. Conclusion
In this paper we propose mathematical operations as a formalism for operating multiple visualizations. Formalising visualizations as computable data prompts us to abstract a wide range of visualization-related tasks into basic data operations and empowers us to develop a proof-of-concept library for visualization operations. Through several use cases, we demonstrate that visualization operations provide feasible solutions to emerging questions regarding the process and analysis of visualizations.
We offer our formalism as one potential method for modeling visualizations as computable data, which is still an initial step towards this direction. Given the rapid proliferation of visualizations online, we expect that visualization processing and analysis will attract extensive research interests from not only the visualization and HCI community but also other related fields such as database, computer vision, and the web. We hope that our work will inspire researchers to think broadly about how to advance the management and analysis of the massive data visualizations on the web.
Acknowledgements.
We thank reviewers for their thoughtful suggestions.References
- (1)
- Badam and Elmqvist (2014) Sriram Karthik Badam and Niklas Elmqvist. 2014. Polychrome: A cross-device framework for collaborative web visualization. In Proc. of the ACM International Conference on Interactive Tabletops and Surfaces. ACM, NY, USA, 109–118.
- Battle et al. (2018) Leilani Battle, Peitong Duan, Zachery Miranda, Dana Mukusheva, Remco Chang, and Michael Stonebraker. 2018. Beagle: Automated extraction and interpretation of visualizations from the web. In Proc. of the Conference on Human Factors in Computing Systems (CHI). ACM, NY, USA, 1–8.
- Biswas et al. (2013) Ayan Biswas, Soumya Dutta, Han-Wei Shen, and Jonathan Woodring. 2013. An information-aware framework for exploring multivariate data sets. IEEE Transactions on Visualization and Computer Graphics 19, 12 (2013), 2683–2692.
- Bostock et al. (2011) Michael Bostock, Vadim Ogievetsky, and Jeffrey Heer. 2011. D3 data-driven documents. IEEE Transactions on Visualization and Computer Graphics 17, 12 (2011), 2301–2309.
- Brosz et al. (2013) John Brosz, Miguel A Nacenta, Richard Pusch, Sheelagh Carpendale, and Christophe Hurter. 2013. Transmogrification: Causal manipulation of visualizations. In Proc. of the ACM Symposium on User Interface Software and Technology (UIST). ACM, NY, USA, 97–106.
- Capel (2004) David Capel. 2004. Image mosaicing. In Image Mosaicing and super-resolution. Springer, London, UK, 47–79.
- Chen et al. (2017) Min Chen, Georges Grinstein, Chris R Johnson, Jessie Kennedy, and Melanie Tory. 2017. Pathways for theoretical advances in visualization. IEEE Computer Graphics and Applications 37, 4 (2017), 103–112.
- Chen and Jäenicke (2010) Min Chen and Heike Jäenicke. 2010. An information-theoretic framework for visualization. IEEE Transactions on Visualization and Computer Graphics 16, 6 (2010), 1206–1215.
- Chen et al. (2021b) Qing Chen, Fuling Sun, Xinyue Xu, Zui Chen, Jiazhe Wang, and Nan Cao. 2021b. VizLinter: A Linter and Fixer Framework for Data Visualization. IEEE Transactions on Visualization and Computer Graphics 28, 1 (2021), 206–216.
- Chen et al. (2021a) Ran Chen, Xinhuan Shu, Jiahui Chen, Di Weng, Junxiu Tang, Siwei Fu, and Yingcai Wu. 2021a. Nebula: A Coordinating Grammar of Graphics. IEEE Transactions on Visualization and Computer Graphics 1, 1 (2021), 1–12.
- Chen et al. (2020b) Xi Chen, Wei Zeng, Yanna Lin, Hayder Mahdi Ai-Maneea, Jonathan Roberts, and Remco Chang. 2020b. Composition and configuration patterns in multiple-view visualizations. IEEE Transactions on Visualization and Computer Graphics 27, 2 (2020), 1514–1524.
- Chen et al. (2020a) Zhutian Chen, Wai Tong, Qianwen Wang, Benjamin Bach, and Huamin Qu. 2020a. Augmenting Static Visualizations with PapARVis Designer. In Proc. of the Conference on Human Factors in Computing Systems (CHI). ACM, NY, USA, 1–12.
- Chen et al. (2019) Zhutian Chen, Yun Wang, Qianwen Wang, Yong Wang, and Huamin Qu. 2019. Towards Automated Infographic Design: Deep Learning-based Auto-Extraction of Extensible Timeline. IEEE Transactions on Visualization and Computer Graphics 26, 1 (2019), 917–926.
- Codd (2002) Edgar F Codd. 2002. A relational model of data for large shared data banks. In Software Pioneers. Springer, Berlin, Germany, 263–294.
- Comba (2020) Joao LD Comba. 2020. Data visualization for the understanding of COVID-19. Computing in Science & Engineering 22, 6 (2020), 81–86.
- Cox and Cox (2008) Michael AA Cox and Trevor F Cox. 2008. Multidimensional scaling. In Handbook of Data Visualization. Springer, Berlin, Germany, 315–347.
- Cutler et al. (2020) Zach Cutler, Kiran Gadhave, and Alexander Lex. 2020. Trrack: A Library for Provenance-Tracking in Web-Based Visualizations. In Proc. of the IEEE Visualization Conference (VIS). IEEE, NY, USA, 116–120.
- Davila et al. (2020) Kenny Davila, Srirangaraj Setlur, David Doermann, Urala Kota Bhargava, and Venu Govindaraju. 2020. Chart mining: a survey of methods for automated chart analysis. IEEE Transactions on Pattern Analysis and Machine Intelligence 43, 11 (2020), 3799–3819.
- Dimara and Perin (2019) Evanthia Dimara and Charles Perin. 2019. What is interaction for data visualization? IEEE Transactions on Visualization and Computer Graphics 26, 1 (2019), 119–129.
- Ebling and Scheuermann (2005) Julia Ebling and Gerik Scheuermann. 2005. Clifford Fourier transform on vector fields. IEEE Transactions on Visualization and Computer Graphics 11, 4 (2005), 469–479.
- Feng et al. (2017) Yu Feng, Ruben Martins, Jacob Van Geffen, Isil Dillig, and Swarat Chaudhuri. 2017. Component-based synthesis of table consolidation and transformation tasks from examples. ACM SIGPLAN Notices 52, 6 (2017), 422–436.
- Fu et al. (2020) Jiayun Fu, Bin Zhu, Weiwei Cui, Song Ge, Yun Wang, Haidong Zhang, He Huang, Yuanyuan Tang, Dongmei Zhang, and Xiaojing Ma. 2020. Chartem: Reviving Chart Images with Data Embedding. IEEE Transactions on Visualization and Computer Graphics 27, 2 (2020), 337–346.
- Gatys et al. (2016) Leon A Gatys, Alexander S Ecker, and Matthias Bethge. 2016. Image style transfer using convolutional neural networks. In Proceedings of the IEEE Conference on Computer Vision and Pattern Recognition (CVPR). 2414–2423.
- Ge et al. (2020) Tong Ge, Yue Zhao, Bongshin Lee, Donghao Ren, Baoquan Chen, and Yunhai Wang. 2020. Canis: A High-Level Language for Data-Driven Chart Animations. In Computer Graphics Forum, Vol. 39. Wiley Online Library, NJ, USA, 607–617.
- Google (2021) Google. 2021. Image Overview. Retrieved June 16, 2021 from https://developers.google.com/earth-engine/guides/image_overview
- Haralick et al. (1987) Robert M Haralick, Stanley R Sternberg, and Xinhua Zhuang. 1987. Image analysis using mathematical morphology. IEEE Transactions on Pattern Analysis and Machine Intelligence 4 (1987), 532–550.
- Harper and Agrawala (2017) Jonathan Harper and Maneesh Agrawala. 2017. Converting basic D3 charts into reusable style templates. IEEE Transactions on Visualization and Computer Graphics 24, 3 (2017), 1274–1286.
- Hesselink (1988) Lambertus Hesselink. 1988. Digital image processing in flow visualization. Annual Review of Fluid Mechanics 20, 1 (1988), 421–486.
- Hoque and Agrawala (2019) Enamul Hoque and Maneesh Agrawala. 2019. Searching the Visual Style and Structure of D3 Visualizations. IEEE Transactions on Visualization and Computer Graphics 26, 1 (2019), 1236–1245.
- image development team (2021) Scikit image development team. 2021. scikit-image: Image processing in Python — scikit-image. Retrieved June 16, 2021 from https://scikit-image.org/
- Ip et al. (2012) Cheuk Yiu Ip, Amitabh Varshney, and Joseph JaJa. 2012. Hierarchical exploration of volumes using multilevel segmentation of the intensity-gradient histograms. IEEE Transactions on Visualization and Computer Graphics 18, 12 (2012), 2355–2363.
- Javed and Elmqvist (2012) Waqas Javed and Niklas Elmqvist. 2012. Exploring the design space of composite visualization. In Proc. of the IEEE Pacific Visualization Symposium. IEEE, NY, USA, 1–8.
- Jiang and Naumann (2020) Lan Jiang and Felix Naumann. 2020. Holistic primary key and foreign key detection. Journal of Intelligent Information Systems 54, 3 (2020), 439–461.
- Kim et al. (2021) NW Kim, SC Joyner, A Riegelhuth, and Y Kim. 2021. Accessible Visualization: Design Space, Opportunities, and Challenges. In Computer Graphics Forum, Vol. 40. Wiley Online Library, NJ, USA, 173–188.
- Kim and Heer (2020) Younghoon Kim and Jeffrey Heer. 2020. Gemini: A grammar and recommender system for animated transitions in statistical graphics. IEEE Transactions on Visualization and Computer Graphics 27, 2 (2020), 485–494.
- Kim et al. (2017) Younghoon Kim, Kanit Wongsuphasawat, Jessica Hullman, and Jeffrey Heer. 2017. Graphscape: A model for automated reasoning about visualization similarity and sequencing. In Proc. of the ACM Conference on Human Factors in Computing Systems (CHI). ACM, NY, USA, 2628–2638.
- Kindlmann and Scheidegger (2014) Gordon Kindlmann and Carlos Scheidegger. 2014. An algebraic process for visualization design. IEEE Transactions on Visualization and Computer Graphics 20, 12 (2014), 2181–2190.
- Knudsen (2015) Søren Knudsen. 2015. How Does Abundant Display Space Support Data Analysis?: Interaction Techniques for Information Visualizations on Large, High-Resolution Displays. Ph.D. Dissertation.
- Knudsen and Carpendale (2016) Søren Knudsen and Sheelagh Carpendale. 2016. View relations: An exploratory study on between-view meta-visualizations. In Proc. of the 9th Nordic Conference on Human-Computer Interaction. ACM, NY, USA, 1–10.
- Lee et al. (2019) Bongshin Lee, Kate Isaacs, Danielle Albers Szafir, G Elisabeta Marai, Cagatay Turkay, Melanie Tory, Sheelagh Carpendale, and Alex Endert. 2019. Broadening intellectual diversity in visualization research papers. IEEE Computer Graphics and Applications 39, 4 (2019), 78–85.
- Lee et al. (2021) Crystal Lee, Tanya Yang, Gabrielle D Inchoco, Graham M Jones, and Arvind Satyanarayan. 2021. Viral Visualizations: How Coronavirus Skeptics Use Orthodox Data Practices to Promote Unorthodox Science Online. In Proc. of the Conference on Human Factors in Computing Systems (CHI). ACM, NY, USA, 1–18.
- Lekschas et al. (2020) Fritz Lekschas, Xinyi Zhou, Wei Chen, Nils Gehlenborg, Benjamin Bach, and Hanspeter Pfister. 2020. A generic framework and library for exploration of small multiples through interactive piling. IEEE Transactions on Visualization and Computer Graphics 27, 2 (2020), 358–368.
- Li et al. (2018) Deqing Li, Honghui Mei, Yi Shen, Shuang Su, Wenli Zhang, Junting Wang, Ming Zu, and Wei Chen. 2018. ECharts: a declarative framework for rapid construction of web-based visualization. Visual Informatics 2, 2 (2018), 136–146.
- Li et al. (2020) Guozheng Li, Min Tian, Qinmei Xu, Michael J McGuffin, and Xiaoru Yuan. 2020. Gotree: A grammar of tree visualizations. In Proc. of the ACM Conference on Human Factors in Computing Systems (CHI). ACM, NY, USA, 1–13.
- Li et al. (2022) Haotian Li, Yong Wang, Aoyu Wu, Huan Wei, and Huamin Qu. 2022. Structure-aware Visualization Retrieval. arXiv preprint arXiv:2202.05960 (2022).
- Limaye et al. (2010) Girija Limaye, Sunita Sarawagi, and Soumen Chakrabarti. 2010. Annotating and searching web tables using entities, types and relationships. Proc. of the VLDB Endowment 3, 1-2 (2010), 1338–1347.
- Lin et al. (2020) Halden Lin, Dominik Moritz, and Jeffrey Heer. 2020. Dziban: Balancing Agency & Automation in Visualization Design via Anchored Recommendations. In Proc. of the Conference on Human Factors in Computing Systems (CHI). ACM, NY, USA, 1–12.
- Liu et al. (2021) Richen Liu, Min Gao, Shunlong Ye, and Jiang Zhang. 2021. IGScript: An Interaction Grammar for Scientific Data Presentation. In Proc. of the ACM Conference on Human Factors in Computing Systems (CHI). ACM, NY, USA, 1–13.
- Liu et al. (2018) Zhicheng Liu, John Thompson, Alan Wilson, Mira Dontcheva, James Delorey, Sam Grigg, Bernard Kerr, and John Stasko. 2018. Data Illustrator: Augmenting vector design tools with lazy data binding for expressive visualization authoring. In Proc. of the ACM Conference on Human Factors in Computing Systems (CHI). 1–13.
- Liu et al. (2014) Zhen Hua Liu, Beda Hammerschmidt, and Doug McMahon. 2014. JSON data management: supporting schema-less development in RDBMS. In Proc. of the ACM International Conference on Management of Data (SIGMOD). ACM, NY, USA, 1247–1258.
- Luo et al. (2020) Yuyu Luo, Chengliang Chai, Xuedi Qin, Nan Tang, and Guoliang Li. 2020. Interactive cleaning for progressive visualization through composite questions. In Proc. of the IEEE International Conference on Data Engineering (ICDE). IEEE, NY, USA, 733–744.
- LYi et al. (2020) Sehi LYi, Jaemin Jo, and Jinwook Seo. 2020. Comparative Layouts Revisited: Design Space, Guidelines, and Future Directions. IEEE Transactions on Visualization and Computer Graphics 27, 2 (2020), 1525–1535.
- Mafrur et al. (2018) Rischan Mafrur, Mohamed A Sharaf, and Hina A Khan. 2018. DiVE: diversifying view recommendation for visual data exploration. In Proc. of the ACM International Conference on Information and Knowledge Management (CIKM). ACM, NY, USA, 1123–1132.
- Mathworks (2021) Mathworks. 2021. Image Processing Toolbox — Functions. Retrieved June 16, 2021 from https://www.mathworks.com/help/images/referencelist.html?type=function
- McNutt et al. (2020) Andrew McNutt, Gordon Kindlmann, and Michael Correll. 2020. Surfacing visualization mirages. In Proc. of the Conference on Human Factors in Computing Systems (CHI). ACM, NY, USA, 1–16.
- Mei et al. (2018) Honghui Mei, Yuxin Ma, Yating Wei, and Wei Chen. 2018. The design space of construction tools for information visualization: A survey. Journal of Visual Languages & Computing 44 (2018), 120–132.
- Méndez et al. (2016) Gonzalo Gabriel Méndez, Miguel A Nacenta, and Sebastien Vandenheste. 2016. iVoLVER: Interactive visual language for visualization extraction and reconstruction. In Proc. of the ACM Conference on Human Factors in Computing Systems (CHI). ACM, NY, USA, 4073–4085.
- Moritz et al. (2018) Dominik Moritz, Chenglong Wang, Greg L Nelson, Halden Lin, Adam M Smith, Bill Howe, and Jeffrey Heer. 2018. Formalizing visualization design knowledge as constraints: Actionable and extensible models in Draco. IEEE Transactions on Visualization and Computer Graphics 25, 1 (2018), 438–448.
- Nargesian et al. (2018) Fatemeh Nargesian, Erkang Zhu, Ken Q Pu, and Renée J Miller. 2018. Table union search on open data. Proc. of the VLDB Endowment 11, 7 (2018), 813–825.
- Niblack (1985) Wayne Niblack. 1985. An introduction to digital image processing. Strandberg Publishing Company, Denmark.
- Pandey et al. (2014) Anshul Vikram Pandey, Anjali Manivannan, Oded Nov, Margaret Satterthwaite, and Enrico Bertini. 2014. The persuasive power of data visualization. IEEE Transactions on Visualization and Computer Graphics 20, 12 (2014), 2211–2220.
- Poco and Heer (2017) Jorge Poco and Jeffrey Heer. 2017. Reverse-Engineering Visualizations: Recovering Visual Encodings from Chart Images. In Computer Graphics Forum, Vol. 36. The Eurographics Association & John Wiley & Sons, Ltd., NJ, USA, 353–363.
- Pu and Kay (2020) Xiaoying Pu and Matthew Kay. 2020. A probabilistic grammar of graphics. In Proc. of the ACM Conference on Human Factors in Computing Systems (CHI). ACM, NY, USA, 1–13.
- Pu et al. (2021) Xiaoying Pu, Matthew Kay, Steven M Drucker, Jeffrey Heer, Dominik Moritz, and Arvind Satyanarayan. 2021. Special Interest Group on Visualization Grammars. In Extended Abstracts of the ACM Conference on Human Factors in Computing Systems (CHI). ACM, NY, USA, 1–3.
- Qian et al. (2020) Chunyao Qian, Shizhao Sun, Weiwei Cui, Jian-Guang Lou, Haidong Zhang, and Dongmei Zhang. 2020. Retrieve-Then-Adapt: Example-based Automatic Generation for Proportion-related Infographics. IEEE Transactions on Visualization and Computer Graphics 27, 2 (2020), 443–452.
- Qu and Hullman (2017) Zening Qu and Jessica Hullman. 2017. Keeping multiple views consistent: Constraints, validations, and exceptions in visualization authoring. IEEE Transactions on Visualization and Computer Graphics 24, 1 (2017), 468–477.
- Ritter et al. (1990) Gerhard X. Ritter, Joseph N. Wilson, and Jennifer L Davidson. 1990. Image algebra: An overview. Computer Vision, Graphics, and Image Processing 49, 3 (1990), 297–331.
- Ruchikachorn and Mueller (2015) Puripant Ruchikachorn and Klaus Mueller. 2015. Learning visualizations by analogy: Promoting visual literacy through visualization morphing. IEEE Transactions on Visualization and Computer Graphics 21, 9 (2015), 1028–1044.
- Saket et al. (2018) Bahador Saket, Dominik Moritz, Halden Lin, Victor Dibia, Cagatay Demiralp, and Jeffrey Heer. 2018. Beyond heuristics: Learning visualization design. arXiv preprint arXiv:1807.06641 (2018).
- Saleh et al. (2015) Babak Saleh, Mira Dontcheva, Aaron Hertzmann, and Zhicheng Liu. 2015. Learning style similarity for searching infographics. In Proc. of the Graphics Interface Conference. ACM, NY, USA, 59–64.
- Satyanarayan et al. (2016) Arvind Satyanarayan, Dominik Moritz, Kanit Wongsuphasawat, and Jeffrey Heer. 2016. Vega-lite: A grammar of interactive graphics. IEEE Transactions on Visualization and Computer Graphics 23, 1 (2016), 341–350.
- Satyanarayan et al. (2015) Arvind Satyanarayan, Ryan Russell, Jane Hoffswell, and Jeffrey Heer. 2015. Reactive vega: A streaming dataflow architecture for declarative interactive visualization. IEEE Transactions on Visualization and Computer Graphics 22, 1 (2015), 659–668.
- Schulz and Hadlak (2015) Hans-Jörg Schulz and Steffen Hadlak. 2015. Preset-based generation and exploration of visualization designs. Journal of Visual Languages & Computing 31 (2015), 9–29.
- Schwab et al. (2020) Michail Schwab, David Saffo, Yixuan Zhang, Shash Sinha, Cristina Nita-Rotaru, James Tompkin, Cody Dunne, and Michelle A Borkin. 2020. VisConnect: Distributed Event Synchronization for Collaborative Visualization. IEEE Transactions on Visualization and Computer Graphics 27, 2 (2020), 347–357.
- Shi et al. (2019) Danqing Shi, Yang Shi, Xinyue Xu, Nan Chen, Siwei Fu, Hongjin Wu, and Nan Cao. 2019. Task-oriented optimal sequencing of visualization charts. In Proc. of IEEE Visualization in Data Science (VDS). IEEE, NY, USA, 58–66.
- Shi et al. (2020) Danqing Shi, Xinyue Xu, Fuling Sun, Yang Shi, and Nan Cao. 2020. Calliope: Automatic visual data story generation from a spreadsheet. IEEE Transactions on Visualization and Computer Graphics 27, 2 (2020), 453–463.
- Smart et al. (2020) Stephen Smart, Keke Wu, and Danielle Albers Szafir. 2020. Color Crafting: Automating the Construction of Designer Quality Color Ramps. IEEE Transactions on Visualization and Computer Graphics 26, 1 (2020), 1215–1225.
- Van der Maaten and Hinton (2008) Laurens Van der Maaten and Geoffrey Hinton. 2008. Visualizing data using t-SNE. Journal of machine learning research 9, 11 (2008).
- Van der Walt et al. (2014) Stefan Van der Walt, Johannes L Schönberger, Juan Nunez-Iglesias, François Boulogne, Joshua D Warner, Neil Yager, Emmanuelle Gouillart, and Tony Yu. 2014. scikit-image: image processing in Python. PeerJ 2 (2014), e453.
- Vartak et al. (2015) Manasi Vartak, Sajjadur Rahman, Samuel Madden, Aditya Parameswaran, and Neoklis Polyzotis. 2015. Seedb: Efficient data-driven visualization recommendations to support visual analytics. In Proc. of the VLDB Endowment International Conference on Very Large Data Bases, Vol. 8. NIH Public Access, 2182.
- Vega-Lite (2020) Vega-Lite. 2020. Vega-lite-v4. Retrieved June 16, 2021 from https://github.com/vega/vega-lite-v4/tree/master/examples
- Wang et al. (2019) Chenglong Wang, Yu Feng, Rastislav Bodik, Alvin Cheung, and Isil Dillig. 2019. Visualization by example. Proc. of the ACM on Programming Languages 4, 49 (2019), 1–28.
- Wang and Shen (2011) Chaoli Wang and Han-Wei Shen. 2011. Information theory in scientific visualization. Entropy 13, 1 (2011), 254–273.
- Wang et al. (2021) Qianwen Wang, Zhutian Chen, Yong Wang, and Huamin Qu. 2021. A Survey on ML4VIS: Applying MachineLearning Advances to Data Visualization. IEEE Transactions on Visualization and Computer Graphics (Early Access) (2021).
- Weaver (2004) Chris Weaver. 2004. Building highly-coordinated visualizations in improvise. In IEEE Symposium on Information Visualization. IEEE, 159–166.
- Wickham (2010) Hadley Wickham. 2010. A layered grammar of graphics. Journal of Computational and Graphical Statistics 19, 1 (2010), 3–28.
- Wilkinson (2012) Leland Wilkinson. 2012. The grammar of graphics. In Handbook of computational statistics. Springer, 375–414.
- Wongsuphasawat et al. (2016) Kanit Wongsuphasawat, Dominik Moritz, Anushka Anand, Jock Mackinlay, Bill Howe, and Jeffrey Heer. 2016. Towards a general-purpose query language for visualization recommendation. In Proc. of the Workshop on Human-In-the-Loop Data Analytics. 1–6.
- Wu et al. (2020) Aoyu Wu, Wai Tong, Tim Dwyer, Bongshin Lee, Petra Isenberg, and Huamin Qu. 2020. Mobilevisfixer: Tailoring web visualizations for mobile phones leveraging an explainable reinforcement learning framework. IEEE Transactions on Visualization and Computer Graphics 27, 2 (2020), 464–474.
- Wu et al. (2021b) Aoyu Wu, Yun Wang, Xinhuan Shu, Dominik Moritz, Weiwei Cui, Haidong Zhang, Dongmei Zhang, and Huamin Qu. 2021b. AI4VIS: Survey on Artificial Intelligence Approaches for Data Visualization. IEEE Transactions on Visualization and Computer Graphics (2021).
- Wu et al. (2021c) Aoyu Wu, Yun Wang, Mengyu Zhou, Xinyi He, Haidong Zhang, Huamin Qu, and Dongmei Zhang. 2021c. MultiVision: Designing Analytical Dashboards with Deep Learning Based Recommendation. IEEE Transactions on Visualization and Computer Graphics 28, 1 (2021), 162–172.
- Wu et al. (2019) Hongjin Wu, Danqing Shi, Nan Chen, Yang Shi, Zhuochen Jin, and Nan Cao. 2019. VisAct: a visualization design system based on semantic actions. Journal of Visualization (2019), 1–14.
- Wu et al. (2021a) Keke Wu, Emma Petersen, Tahmina Ahmad, David Burlinson, Shea Tanis, and Danielle Albers Szafir. 2021a. Understanding data accessibility for people with intellectual and developmental disabilities. In Proc. of the 2021 CHI Conference on Human Factors in Computing Systems. 1–16.
- Xu et al. (2020) Kai Xu, Alvitta Ottley, Conny Walchshofer, Marc Streit, Remco Chang, and John Wenskovitch. 2020. Survey on the analysis of user interactions and visualization provenance. In Computer Graphics Forum, Vol. 39. Wiley Online Library, NJ, USA, 757–783.
- Xu et al. (2018) Shenyu Xu, Chris Bryan, Jianping Kelvin Li, Jian Zhao, and Kwan-Liu Ma. 2018. Chart Constellations: Effective Chart Summarization for Collaborative and Multi-User Analyses. In Computer Graphics Forum, Vol. 37. Wiley Online Library, 75–86.
- Yang et al. (2014) Huahai Yang, Yunyao Li, and Michelle X Zhou. 2014. Understand users’ comprehension and preferences for composing information visualizations. ACM Transactions on Computer-Human Interaction (TOCHI) 21, 1 (2014), 1–30.
- Yu and Silva (2019) Bowen Yu and Cláudio T Silva. 2019. FlowSense: A natural language interface for visual data exploration within a dataflow system. IEEE Transactions on Visualization and Computer Graphics 26, 1 (2019), 1–11.
- Yuan et al. (2021) Lin-Ping Yuan, Wei Zeng, Siwei Fu, Zhiliang Zeng, Haotian Li, Chi-Wing Fu, and Huamin Qu. 2021. Deep Colormap Extraction from Visualizations.
- Zappalá et al. (1999) Anthony Zappalá, Andrew Gee, and Michael Taylor. 1999. Document mosaicing. Image and Vision Computing 17, 8 (1999), 589–595.
- Zhang et al. (2018) Juyong Zhang, Bailin Deng, Yang Hong, Yue Peng, Wenjie Qin, and Ligang Liu. 2018. Static/dynamic filtering for mesh geometry. IEEE Transactions on Visualization and Computer Graphics 25, 4 (2018), 1774–1787.
- Zhang et al. (2020b) Jiayi Eris Zhang, Nicole Sultanum, Anastasia Bezerianos, and Fanny Chevalier. 2020b. DataQuilt: Extracting Visual Elements from Images to Craft Pictorial Visualizations. In Proc. of the Conference on Human Factors in Computing Systems (CHI). ACM, 1–13.
- Zhang et al. (2020a) Peiying Zhang, Chenhui Li, and Changbo Wang. 2020a. Viscode: Embedding information in visualization images using encoder-decoder network. IEEE Transactions on Visualization and Computer Graphics 27, 2 (2020), 326–336.
- Zhang et al. (2021) Yixuan Zhang, Yifan Sun, Lace Padilla, Sumit Barua, Enrico Bertini, and Andrea G Parker. 2021. Mapping the Landscape of COVID-19 Crisis Visualizations. In Proc. of the Conference on Human Factors in Computing Systems (CHI). ACM, NY, USA, 1–23.
- Zhao et al. (2020) Jian Zhao, Mingming Fan, and Mi Feng. 2020. ChartSeer: Interactive Steering Exploratory Visual Analysis with Machine Intelligence. IEEE Transactions on Visualization and Computer Graphics (Early Access) (2020).