Constraints on r-modes and mountains on millisecond neutron stars in binary systems
Abstract
Continuous gravitational waves are nearly monochromatic signals emitted by asymmetries in rotating neutron stars. These signals have not yet been detected. Deep all-sky searches for continuous gravitational waves from isolated neutron stars require significant computational expense. Deep searches for neutron stars in binary systems are even more expensive, but potentially these targets are more promising emitters, especially in the hundreds-Hz region, where ground-based gravitational wave detectors are most sensitive. We present here an all-sky search for continuous signals with frequency between 300 and 500 Hz, from neutron stars in binary systems with orbital period between 15 and 60 days, and projected semi-major axis between 10 and 40 light-seconds. This is the only binary search on Advanced-LIGO data that probes this frequency range. Compared to previous results, our search is over an order of magnitude more sensitive. We do not detect any signals, but our results exclude plausible and unexplored neutron star configurations, for example, neutron stars with relative deformations greater than within 1 kpc from Earth and r-mode emission at the level of a few within the same distance.
1 Introduction
Detecting continuous gravitational waves is one of the most anticipated milestones in gravitational-wave astronomy. In spite of much effort, no detection has been achieved yet (Abbott et al., 2021a, b, c, 2022a, 2022b, d; Ashok et al., 2021; Zhang et al., 2021; Ming et al., 2022; Dergachev & Papa, 2021; Steltner et al., 2021; Rajbhandari et al., 2021; Fesik & Papa, 2020).
Continuous gravitational wave signals can be produced by asymmetric rotating neutron stars due to
-
(i)
a mountain, i.e. a non-axisymmetric deformation rigidly rotating with the star. If the principal moment of inertia is aligned with the spin axis of the star, this generates gravitational waves at frequency , where is the rotational frequency of the neutron star.
- (ii)
Other mechanisms also exist, most notably following a glitch in the neutron star spin (see van Eysden & Melatos, 2008, and references therein), but we will not consider them here.
The mountain asymmetry could be generated by strains in the crust of the star, by internal magnetic fields or by accretion from a companion star (see for example Lasky, 2015; Glampedakis & Gualtieri, 2018). Most theoretical studies in the literature (e.g. Owen, 2005) provide upper limits on the possible mountain height, while there are few concrete models (Singh et al., 2020a) predicting physical mechanisms that would actually produce such long-lasting mountains.
On the other hand, r-modes in rotating neutron stars are unstable to gravitational-wave emission (Andersson, 1998; Friedman & Morsink, 1998; Owen et al., 1998; Lindblom et al., 1998). The instability is counteracted only by dissipative mechanisms in the neutron star such as viscosity, crust-core boundary friction, or through non-linear mode coupling (e.g. see Bondarescu et al., 2007, 2009; Bondarescu & Wasserman, 2013). This leads to predictions of the so-called (in)stability window, i.e. ranges of the neutron star parameters where the r-modes are (un)stable. There are large theoretical uncertainties on the details of the r-mode stability window, amplitude and timescales, but several studies predict that long-lasting r-modes are present in accreting or post-accretion (quiescent) neutron stars in low-mass X-ray binaries (qLMXBs) (Andersson et al., 1999; Reisenegger & Bonacic, 2003).
Furthermore, some authors (e.g. Chugunov et al., 2014; Maccarone et al., 2022) argue for the existence of a potentially large unobserved population of quiescent LMXBs that may be subject to long-lasting ( years) r-mode emission. These models provide compelling astrophysical motivation for an all-sky search for unknown neutron stars in binary systems emitting continuous gravitational waves. In turn, non-observation of such signals can potentially provide astrophysically relevant and informative upper limits, especially on r-mode amplitudes.
Independently of the emission mechanism, the expected continuous-wave amplitude is many orders of magnitude lower than the average noise level, so that months or years of data have to be combined together in order to build up a detectable signal-to-noise ratio.
The frequency of these signals is usually described in the source frame by an or order Taylor expansion around a reference time (referred to as IT signals in Dergachev & Papa, 2021). This means that in the source frame 2 or 3 parameters are needed to describe the frequency evolution of the signal. In the observer frame, amplitude and Doppler modulations need to be accounted for in order to accurately describe the signal frequency evolution, which means that now the sky position of the source needs to be specified (2 more parameters). Searching for signals from neutron stars with known parameters does not pose any difficulty, since this amounts to a single waveform, that in the observer frame is specified by the value of 4 or 5 parameters. But for unknown sources, the high resolution in all the parameters makes the all-sky, broad frequency searches the most computationally costly among all gravitational-wave searches. A recent review of different methods to perform these searches can be found in Tenorio et al. (2021).
If the unknown neutron star is assumed to be in a binary system rather than being isolated, the search problem becomes even more difficult. Assuming a circular orbit, three additional parameters need to be accounted for, which further increases the already high computational cost of all-sky surveys. However, since more than half of the known millisecond pulsars are in binary systems, and their accretion history offers channels to generate the asymmetries needed for a detectable continuous signal (Holgado et al., 2018; Gittins & Andersson, 2019; Singh et al., 2020b; Chugunov et al., 2014), searches for signals from unknown neutron stars in binaries are very interesting.
In this paper we present the results of an all-sky search for continuous waves from neutron stars in binary systems with gravitational-wave frequencies between 300 and 500 Hz, using the public Advanced LIGO O3a data (LVC, 2021). This search complements two previous Advanced LIGO data searches which looked at frequencies between 50 and 300 Hz (Covas & Sintes, 2020; Abbott et al., 2021d). The frequency range up to 500 Hz was previously explored using S6 and VSR2/3 data (Aasi et al., 2014), producing upper limits on the gravitational-wave amplitude not more stringent than . Our search improves on these results by nearly a factor of 30, with our most restrictive upper limit being .
We search for signals from systems with projected semi-major axis between 10 and 40 light-seconds, and orbital periods between 15 and 60 days. These parameter ranges are very similar to the ones searched by Covas & Sintes (2020) and in region A of Abbott et al. (2021d), the difference being that we have extended the largest orbital period from 45 to 60 days. The previous search using S6 and VSR2/3 data (Aasi et al., 2014) explored a wider range of parameter space, covering orbital periods from 0.08 to 94 days.
We use a newly-developed search pipeline – BinarySkyHou – which combines coherent -statistic search results with the Hough Transform method (Krishnan et al., 2004; Covas & Sintes, 2019). BinarySkyHou is an improvement over the method of Covas & Sintes (2019), due to its lower computational cost and the usage of a generally more sensitive coherent detection statistic (Covas, 2022).
2 Data
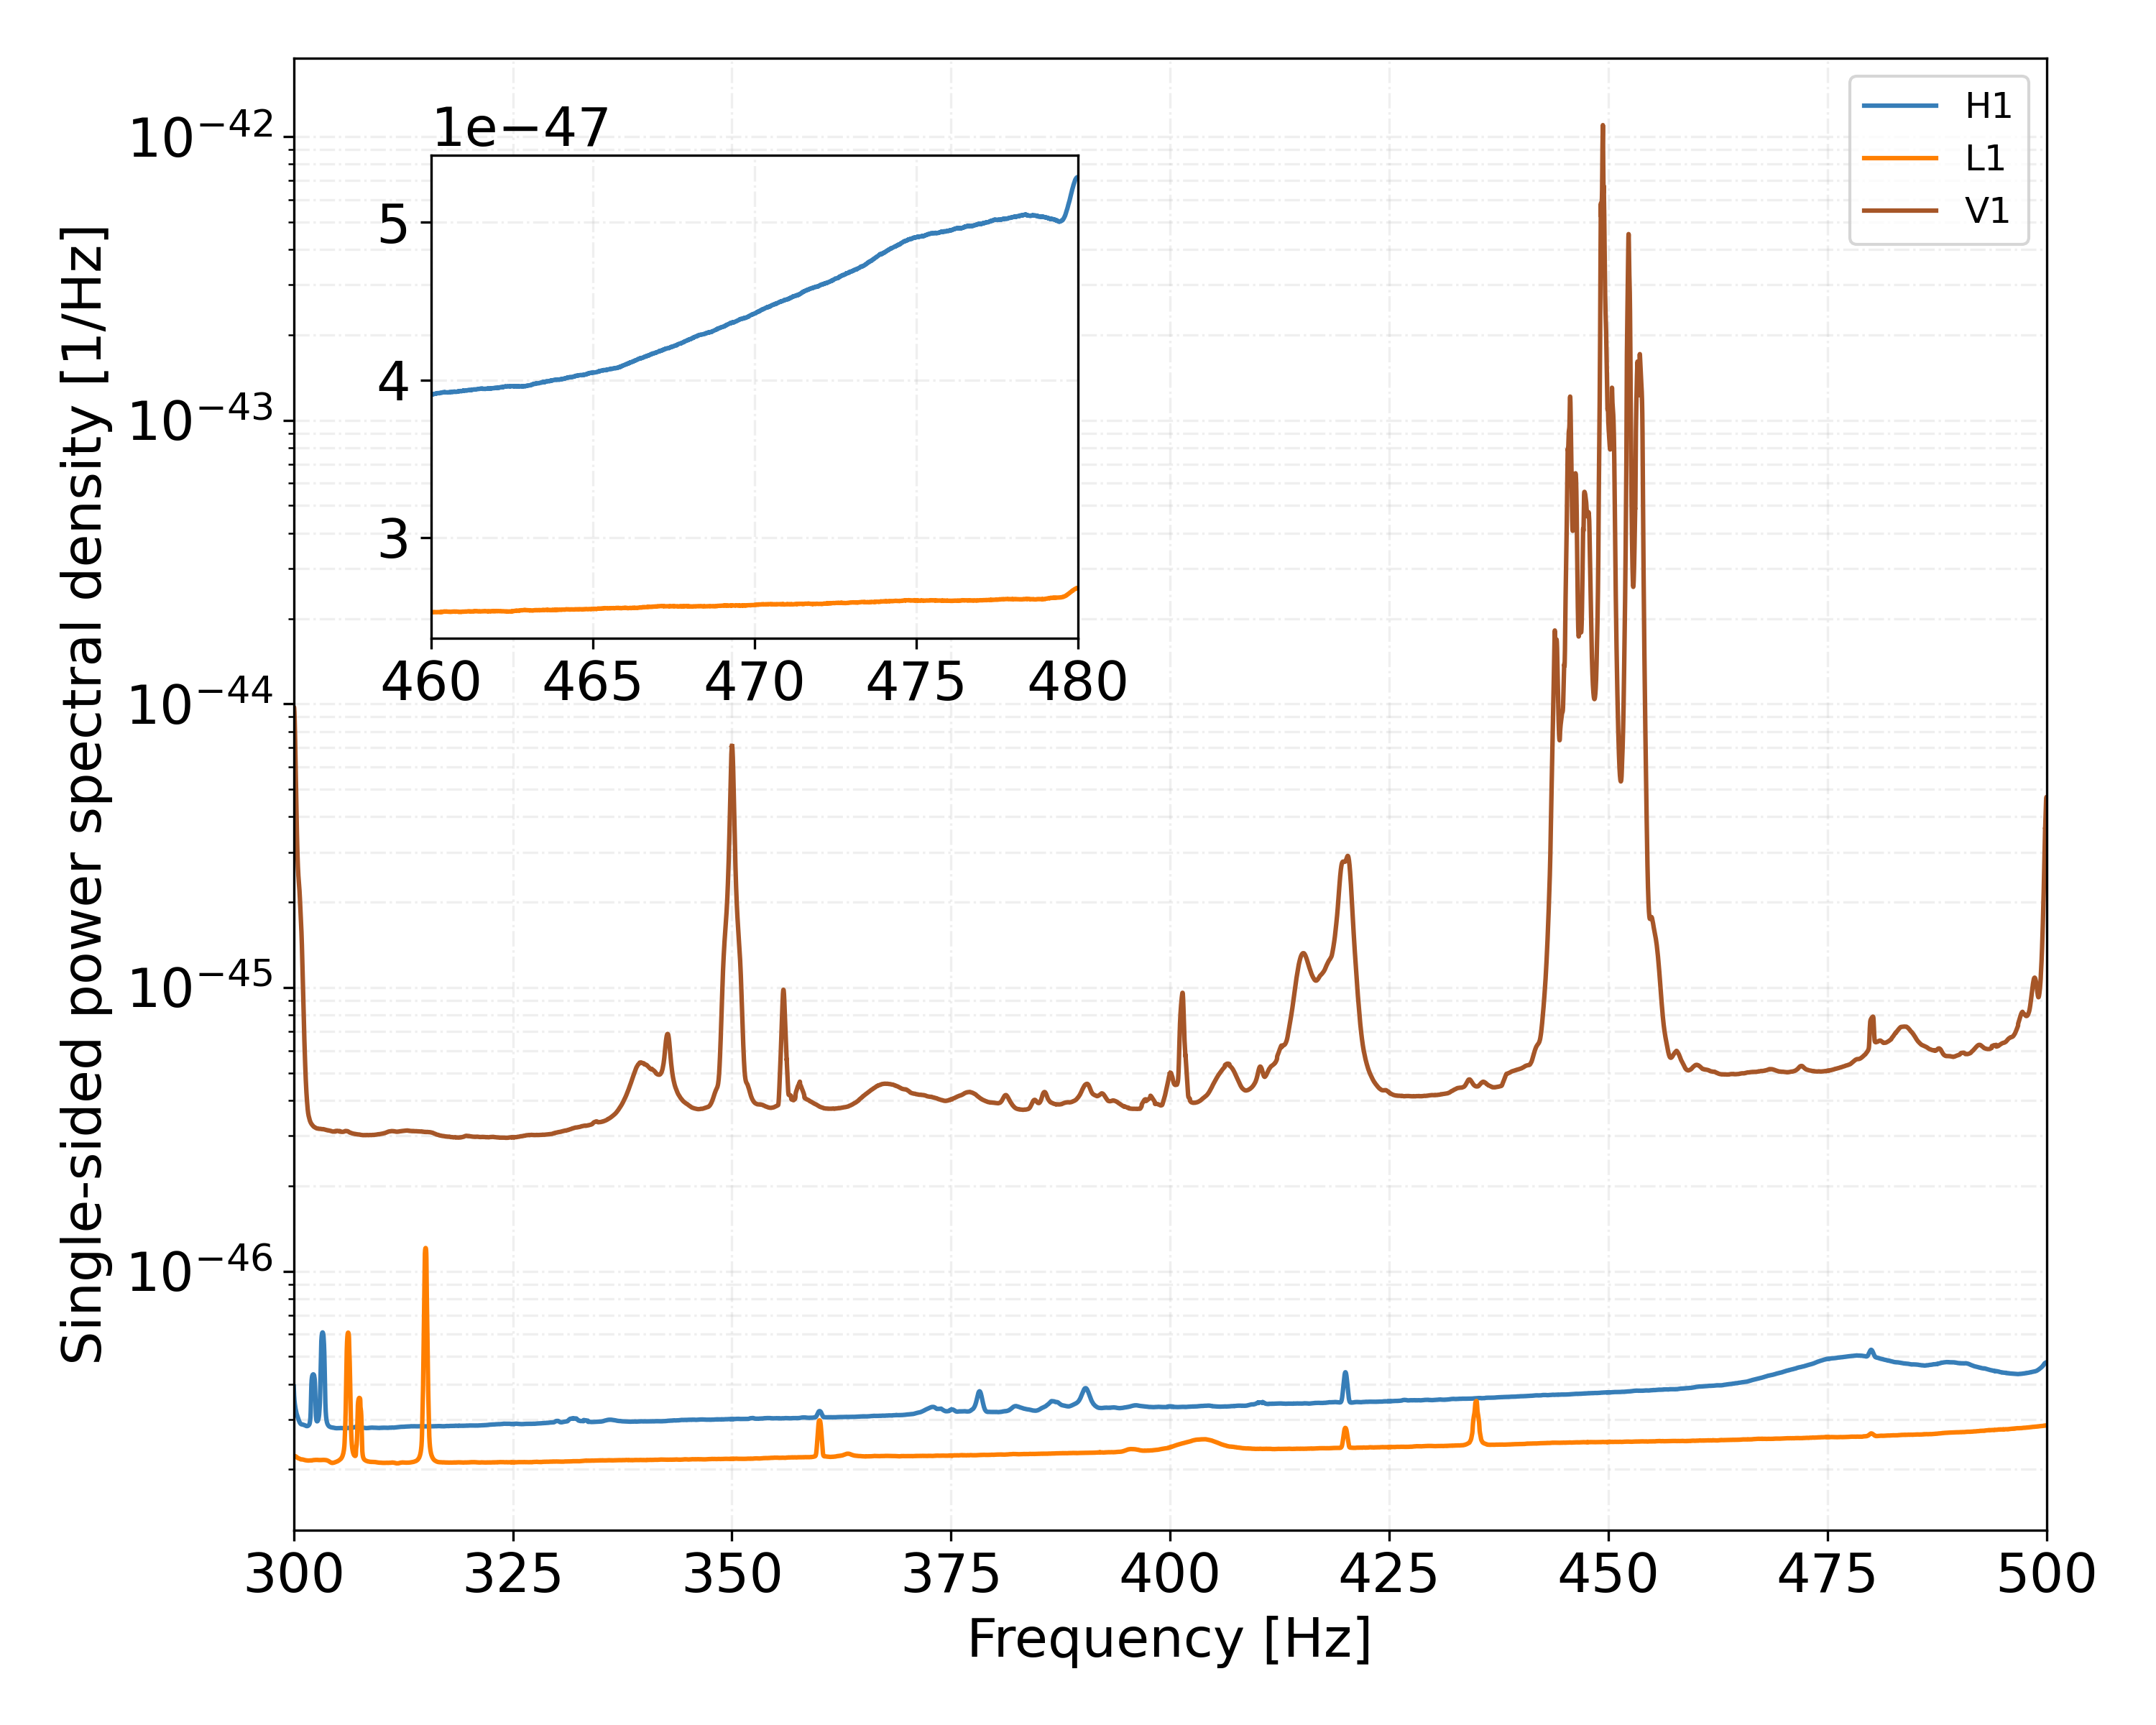
This search uses the Advanced LIGO O3a data (LVC, 2021). O3a comprises the first 6 months of the O3 run, i.e. April-October 2019, and is the first O3 dataset publicly released. We use data from both LIGO gravitational-wave detectors, i.e. from the Hanford (H1) and the Livingston (L1) detectors (Aasi et al., 2015). We do not consider data from the Virgo detector because the amplitude spectral density is times higher than that of LIGO and is more contaminated by non-Gaussian disturbances. The harmonic average power spectral density of the LIGO and Virgo detectors in the frequency range covered by this search is shown in Figure 1.
We use the GWOSC-16KHZ_R1_STRAIN channel and the DCS-CALIB_STRAIN_CLEAN_SUB60HZ_C01_AR frame type. This data had been cleaned before public release at the frequencies of the power 60 Hz lines and the calibration lines. Many other lines are still present in the dataset, which produce spurious outliers that need to be examined and discarded, as will be seen in Section 4.
As discussed in other publications (e.g. Abbott et al., 2022a), the O3a dataset suffers from a large number of short-duration glitches that increase the noise level in the frequency range of interest for this search, thus potentially reducing the sensitivity. For this reason, we use the gating method developped by Steltner et al. (2022) to remove these glitches and improve the data quality.
The dataset of each detector is divided in short Fourier transforms (SFTs, see Allen & Mendell, 2004) of 200 s, which is short enough that the signal power does not spread by more than a 1/200 Hz frequency bin during this time. In fact, in the chosen range of orbital and frequency parameters, this remains the case for durations up to 1200 s (see Figure 8 of Covas & Sintes, 2019). The total number of SFTs is 55068 for H1 and 56118 for L1.
3 The search
3.1 Signal model
The gravitational-wave signal from a tri-axial asymmetric rotating neutron star as a function of time in the observer frame is given by Jaranowski et al. (1998):
| (1) |
where and are the antenna-pattern functions of the detector, is in the inclination angle of the angular momentum of the source with respect to the line of sight, is the polarization angle, is the initial phase, is the gravitational-wave phase at time and is the intrinsic gravitational wave amplitude.
The phase of the signal in the observer frame depends on the intrinsic frequency and frequency derivatives of the signal and on the Doppler modulation of this signal due to the relative motion between the source and the detector. The Doppler modulation depends on the gravitational-wave frequency, the sky position of the source ( and ), and the parameters describing the Keplerian orbit of the neutron star. These orbital parameters are: orbital period , projected orbital semi-major axis , time of ascension , argument of periapsis, and eccentricity. In an all-sky search for IT signals this in principle amounts to parameters to be searched for, in order to accurately track the signal.
3.2 Parameter space covered
We search for signals with intrinsic frequency between 300 and 500 Hz and frequency derivative Hz/s, across the entire sky. We choose this frequency range because it has not yet been covered by a search on Advanced-LIGO data. The chosen frequency derivative range allows to set all template waveform and hence not search over multiple different frequency derivative values in the first stage of the search. With this range we are able to cover the expected frequency derivative values produced by spin-wandering, which may appear in accreting systems (Mukherjee et al., 2018).
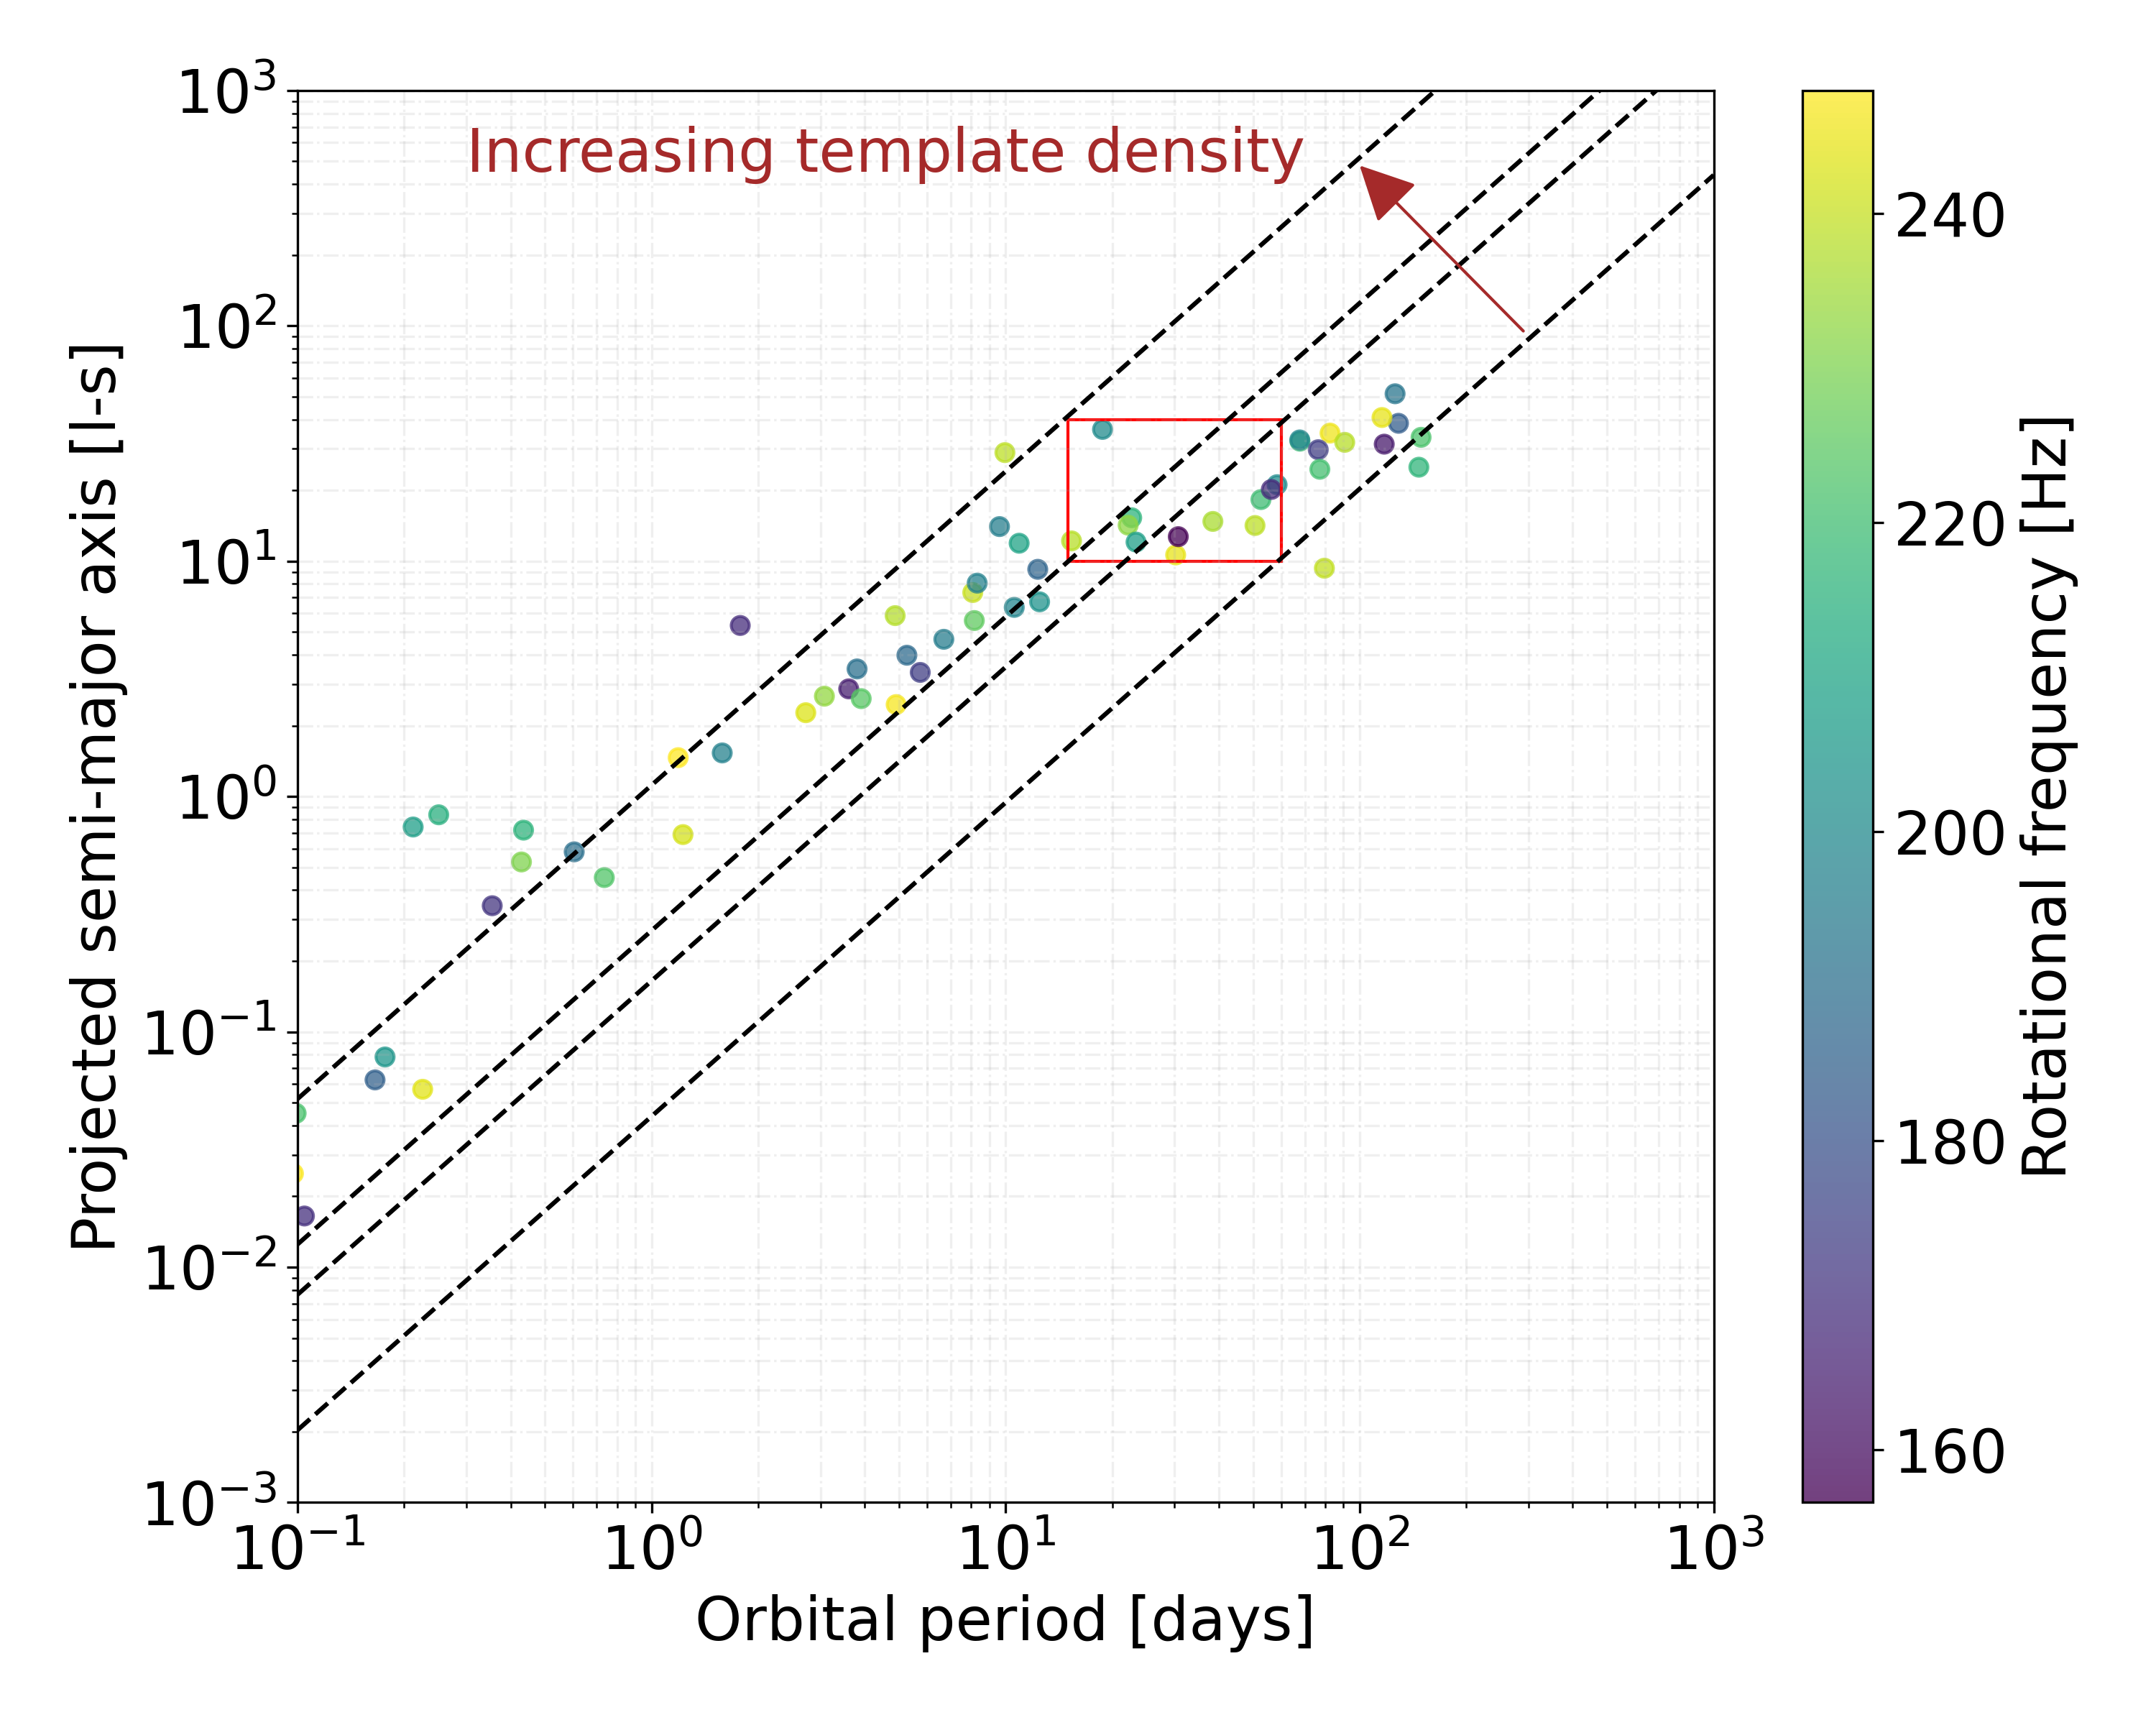
We assume that the signals come from a neutron star in a binary system. As shown in Figure 2, neutron stars in binary systems cover a broad range of orbital separations , depending on the neutron star companion mass and on the orbital period. On the other hand, all-sky high-sensitivity/high-resolution searches over such a broad range of orbital parameters are impossible due to their computational cost, so we concentrate the search to the range of indicated by the red box in Figure 2. This box is chosen in such a way that, among the search-boxes that could be drawn in that plane with the same computational cost for the associated search, this box contains the highest number of pulsars in it, while probing higher orbital periods than previous searches on Advanced LIGO data Abbott et al. (2021d). To give some idea of how the computational cost varies in the plane we also plot lines of constant template-count density (from Eq. 77 of Leaci & Prix, 2015). Following Covas & Sintes (2019) we assume an orbital eccentricity smaller than , so in the first stage of the search we set all template waveform and not search over different eccentricity (and argument of periapsis) values.
The signal parameter space covered by the search is summarized in Table 1. The total number of templates searched is .
| Parameter | Range |
|---|---|
| : Frequency [Hz] | 300 - 500 |
| : Frequency deriv. [Hz/s] | |
| : Projected semi-major axis [l-s] | 10 - 40 |
| : Orbital period [days] | 15 - 60 |
| : Time of ascension [s] | |
| : Orbital eccentricity | |
| : Right ascension [rad] | 0 - |
| : Declination [rad] | - |
3.3 Summary of pipeline
We use a semi-coherent search method, where the data is separated in segments of a maximum span s. For all segments we calculate the coherent detection statistic of Cutler & Schutz (2005) and Jaranowski et al. (1998) over a coarse grid in frequency and sky. The segment length is short enough that the orbital parameters are not resolved. The -statistic values are then combined with an improved version of the BinarySkyHough methodology of Covas & Sintes (2019), described in more detail in Covas (2022). By using the -statistic, the new pipeline can leverage sensitivity gains from the use of longer coherent duration segments and from the coherent combination of data from different detectors. However, with the particular set-up used for this search – short segment length and two detectors – its sensitivity is comparable to that of power-based statistics.
The final detection statistic is a weighted sum of the single-segment statistic :
| (2) |
where depends on the detectors’ antenna beam-pattern functions during segment , inverse-weighted with the noise power spectral density, and . The sum of Eq. 2 depends on the template orbital parameters.
We use the coherent detection statistic for all segments that have a well-conditioned antenna pattern matrix with condition number . For larger condition numbers the -statistic becomes numerically singular and we use the constant antenna-pattern detection statistic with two degrees of freedom derived in Covas & Prix (2022).
| Frequency Range | |||
|---|---|---|---|
| Resolution | [300,400) | [400,500) | |
| [mHz] | |||
| [l-s] | |||
| rad] | |||
| s] | |||
| rad ] | |||
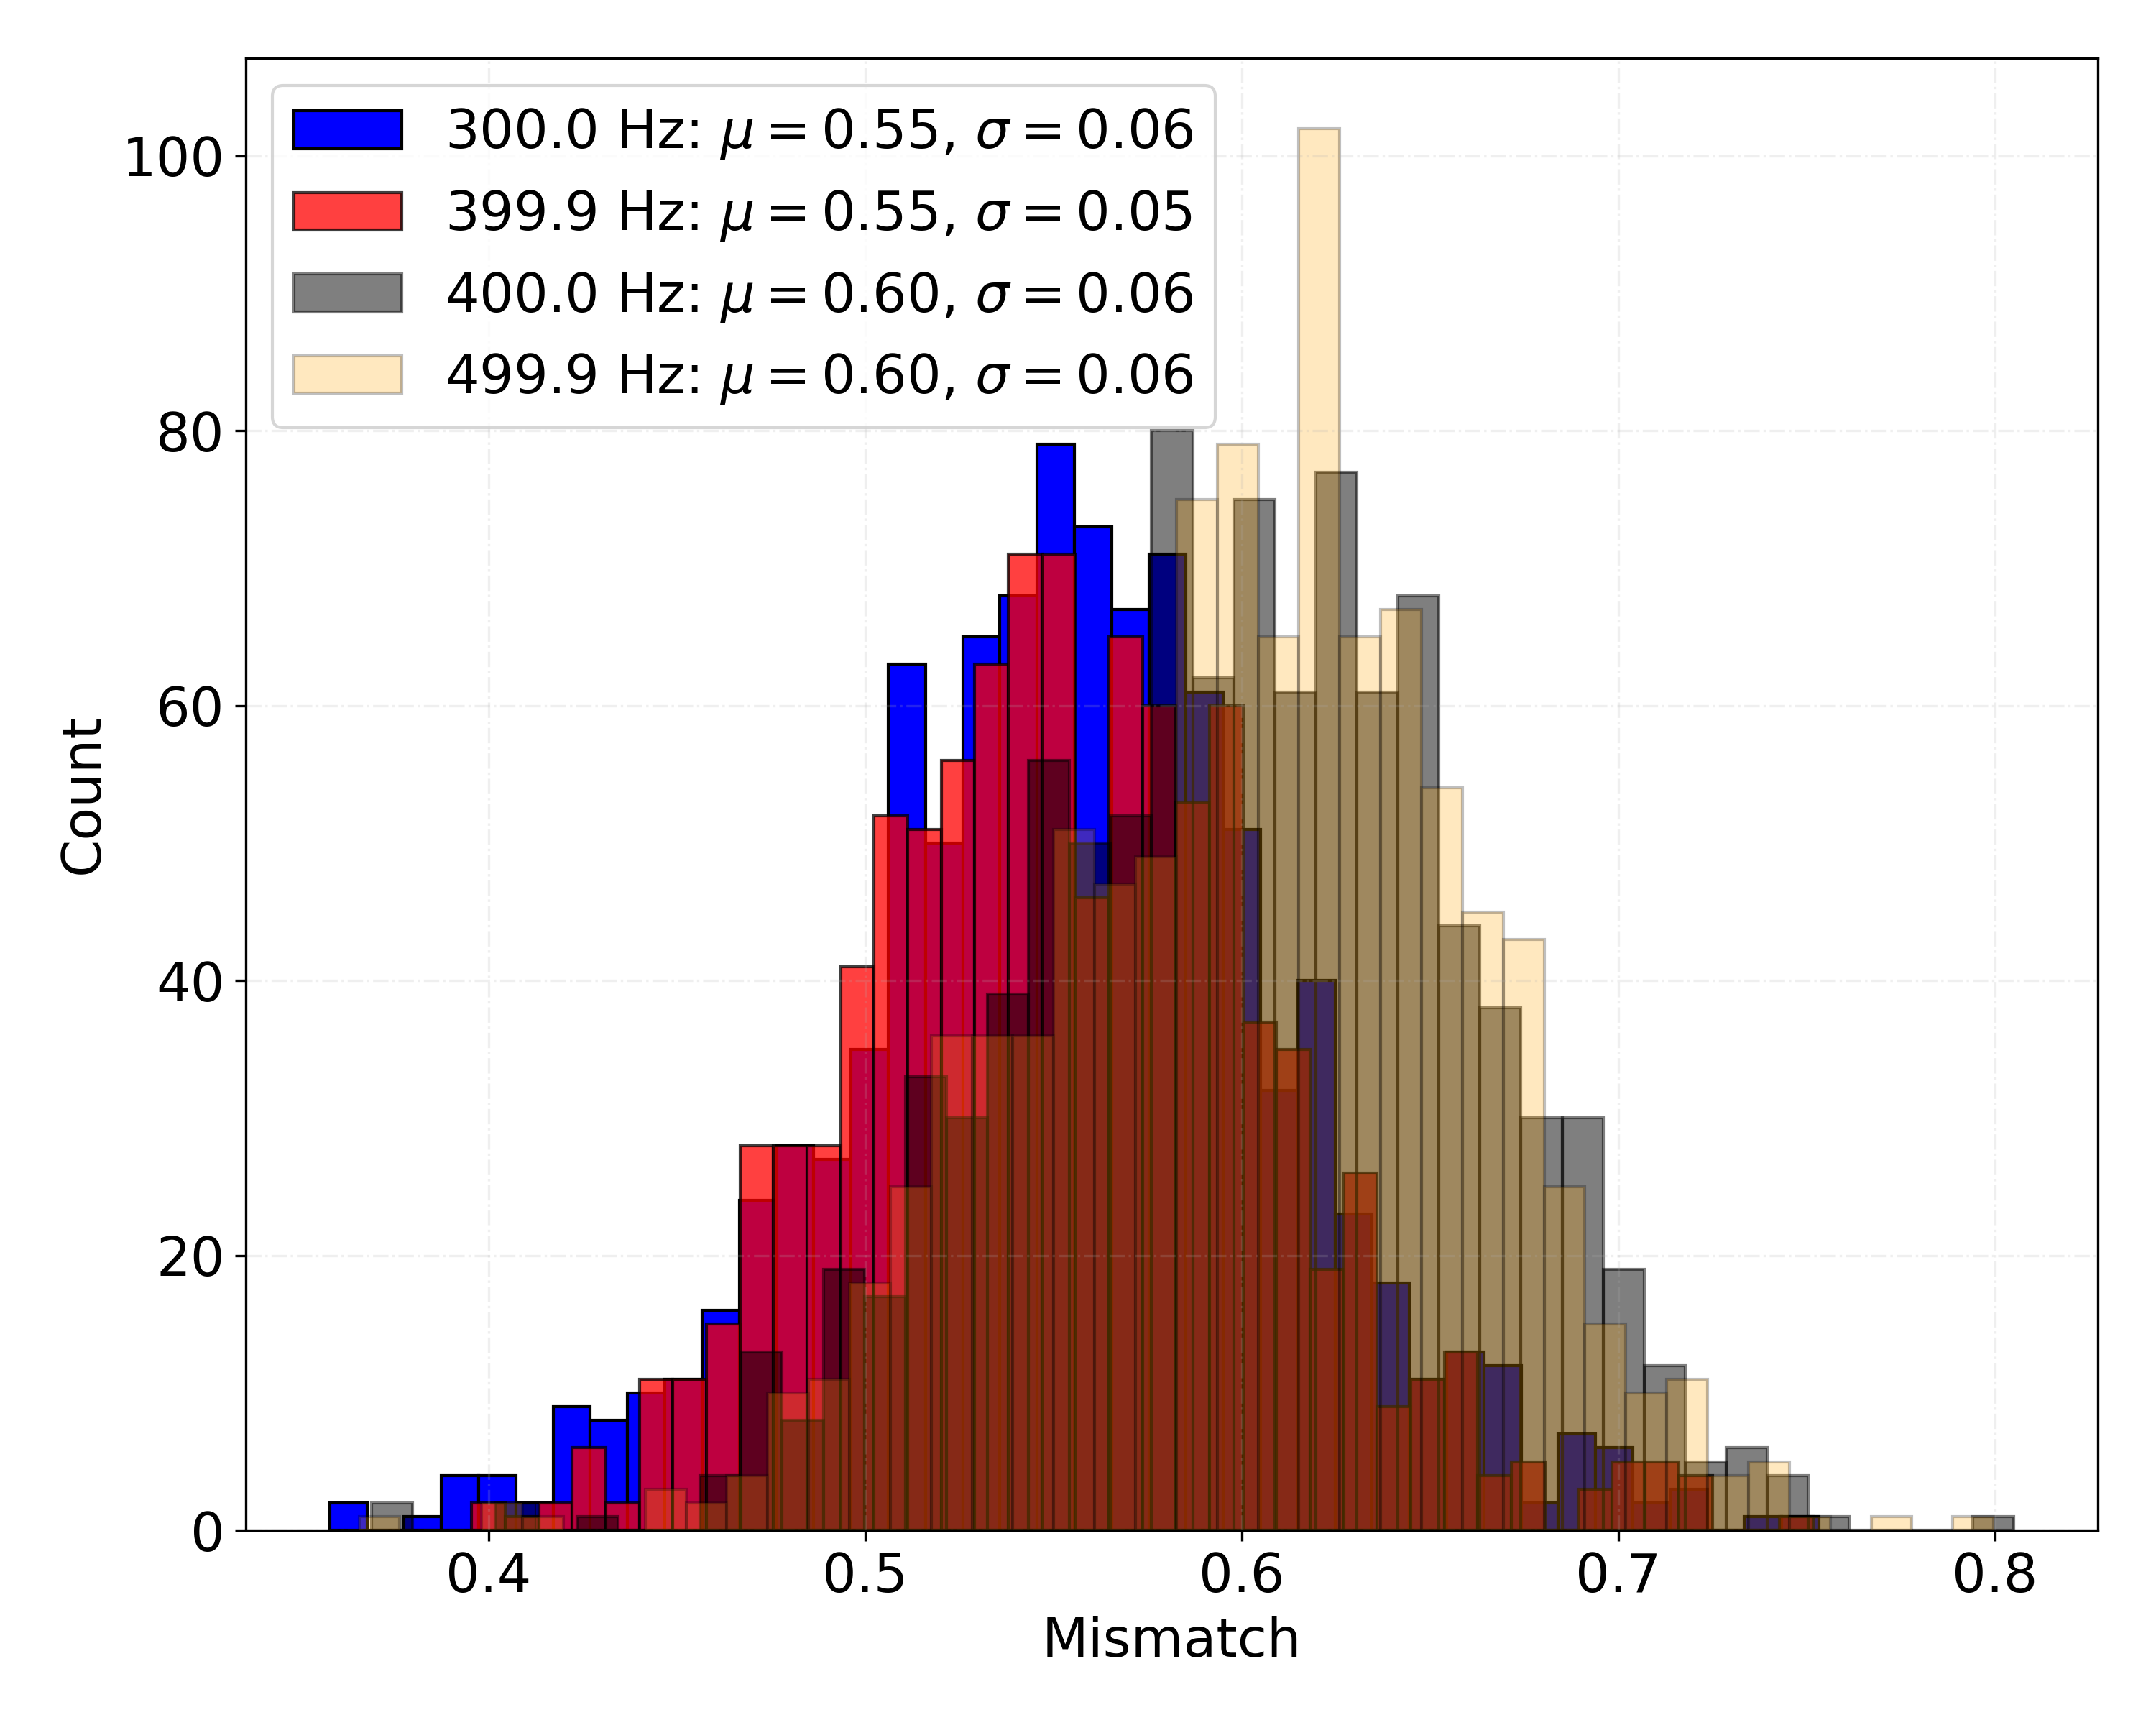
We divide the search into a low- and a high-frequency region, each 100 Hz wide, and use different template grids in order to balance the computational cost in the two regions. The grid resolutions for all the parameters are shown Table 2. The overall resulting average mismatch is and the mismatch distributions at four frequencies spanning the search range are shown in Figure 3.
We define a significance for every search result as
| (3) |
where
| (4) | ||||
| (5) |
are the mean and standard deviation of in Gaussian noise, and () are the weights for the segments with four (two) degrees of freedom, respectively.
4 Results
4.1 Outliers, follow-up
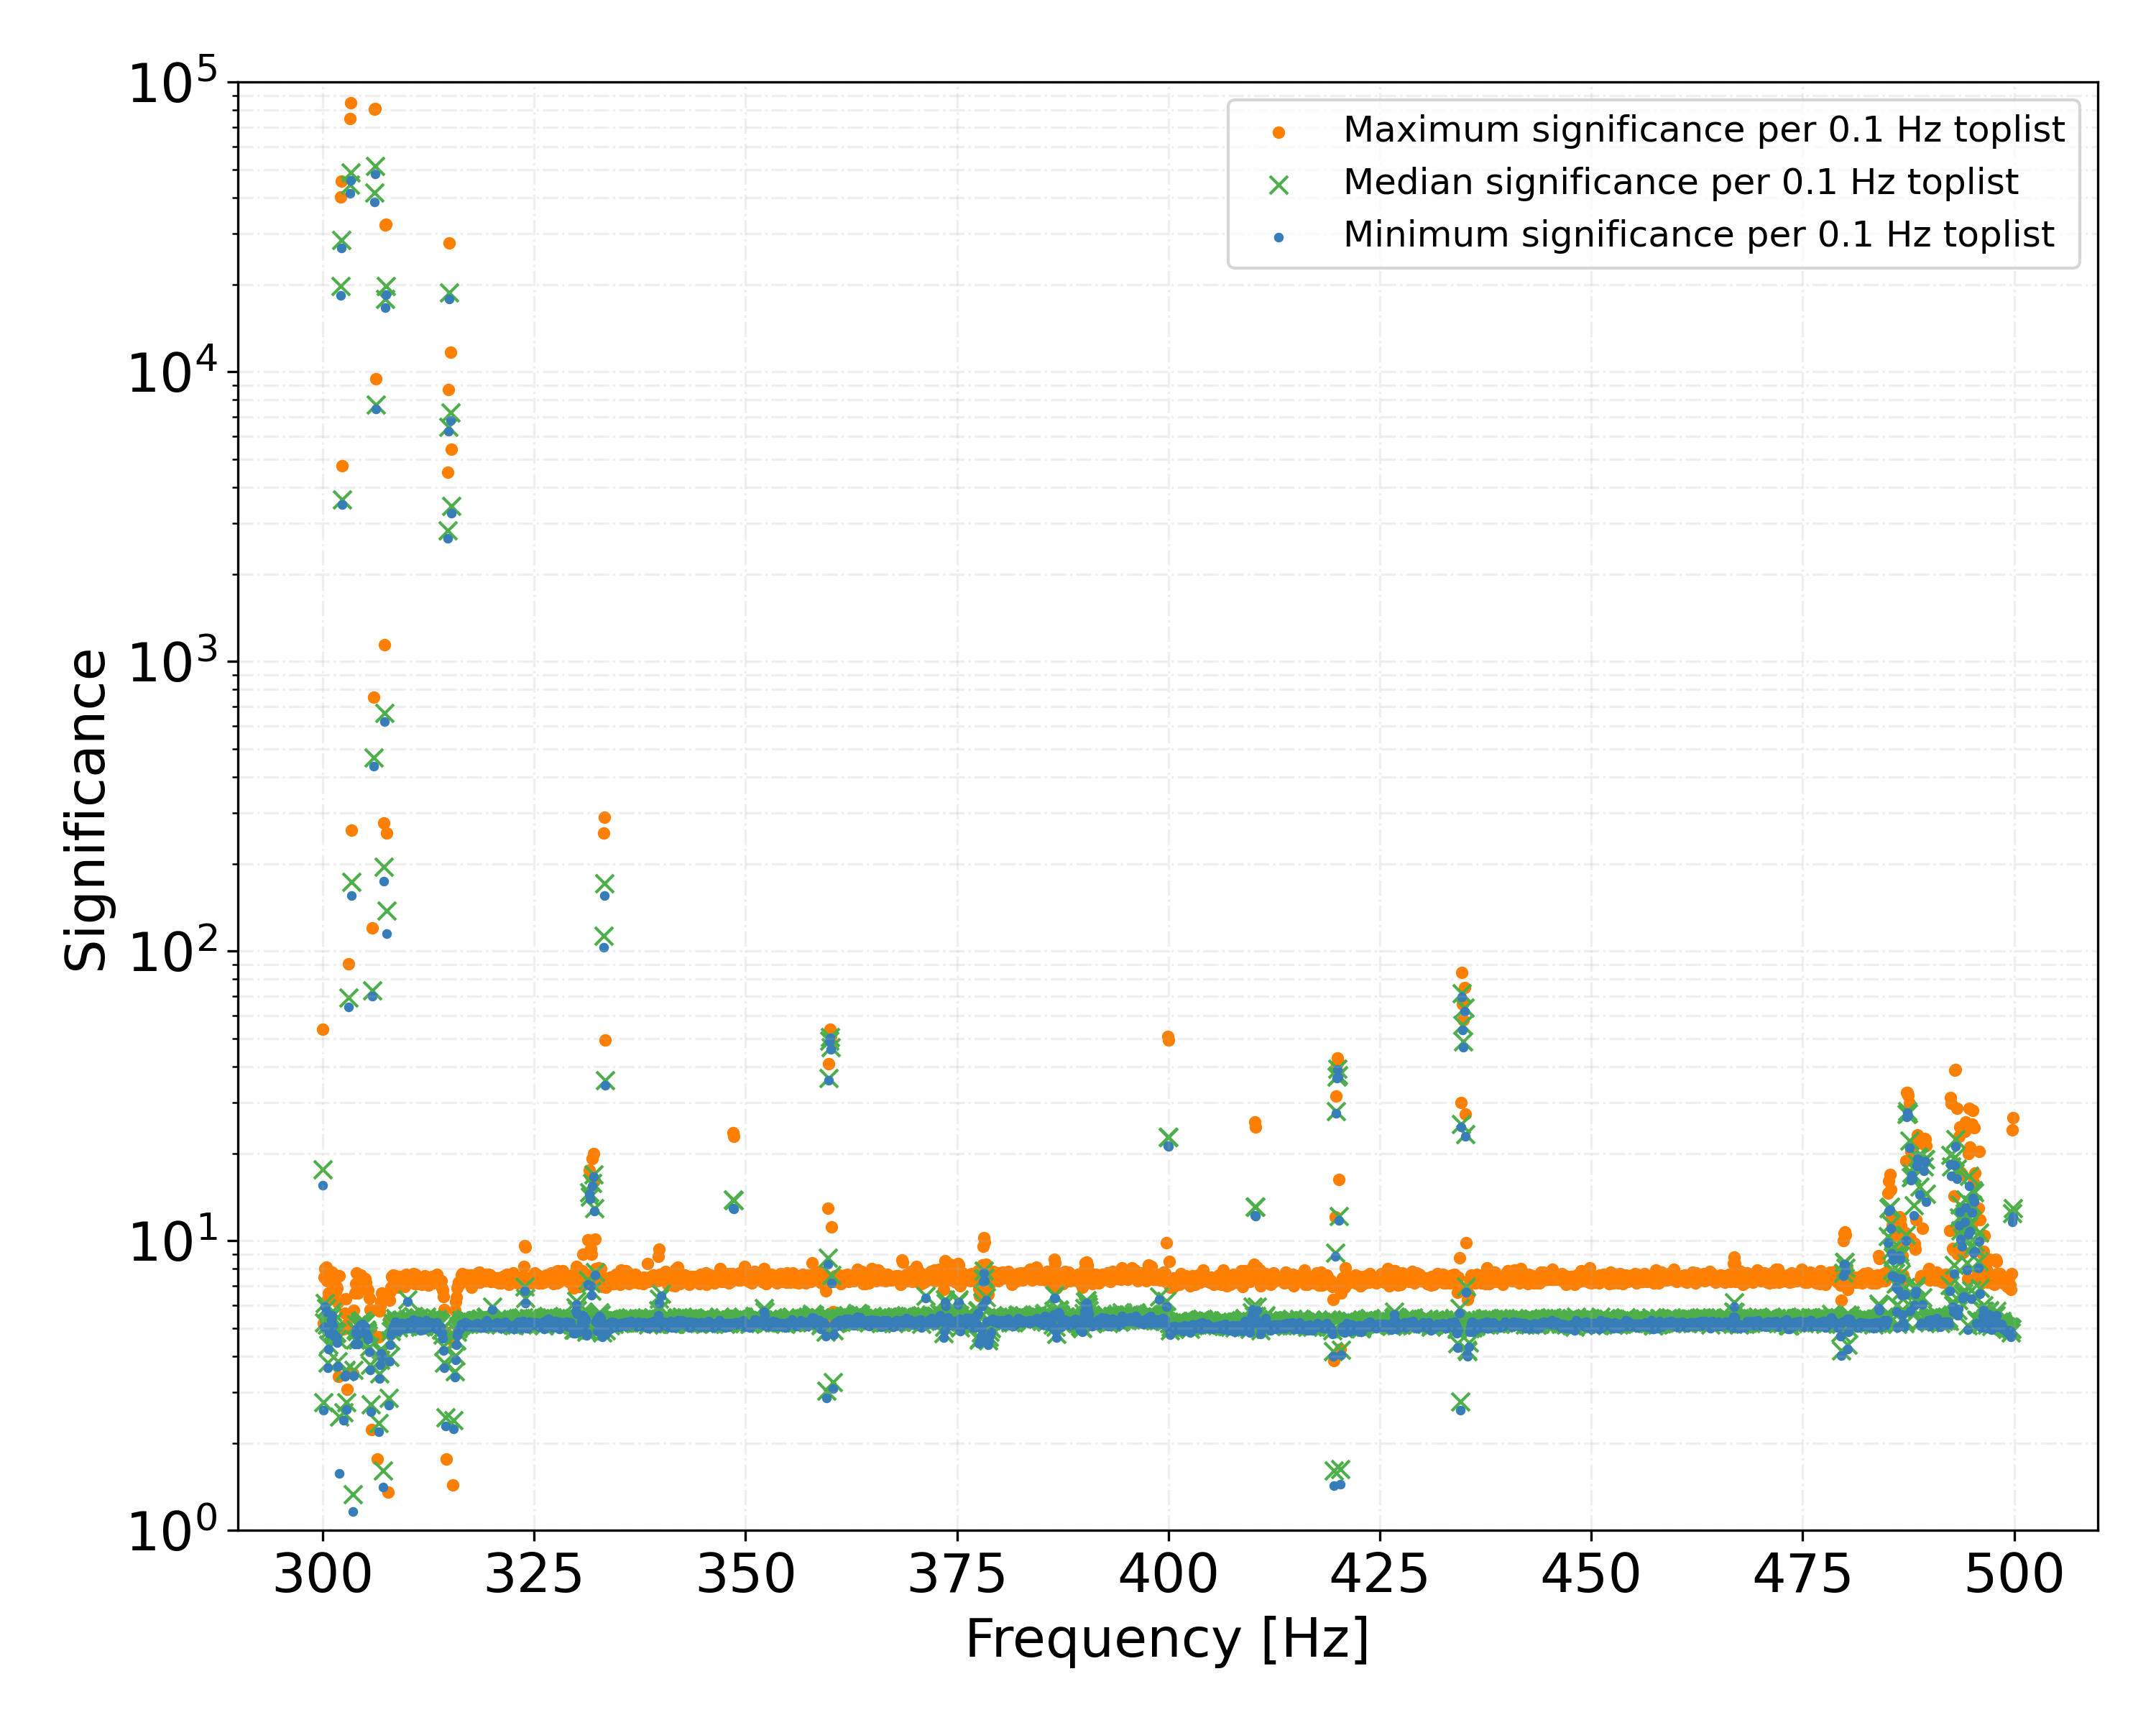
We consider the most significant results in every 0.1 Hz band, which are shown in Figure 4. On these we use the clustering procedure of Covas & Sintes (2019, 2020) and group together results due to the same cause. The top ten clusters per 0.1 Hz band are saved for further analysis, yielding a total of 20 000 clusters. In what follows we will refer to these selected clusters as candidates.
Before analyzing the candidates with a longer coherence time, we search for the presence of instrumental lines in their vicinity. We use the list of LIGO detectors’ lines compiled by Goetz et al. (2021). We calculate the frequency-time pattern of every candidate and discard it if it crosses any of the lines in the lists. Doing this, 19 044 candidates remain.
In the next step we apply the same follow-up that was used in Covas & Sintes (2020), where we increase the coherence time () to 9000 s and use a Markov Chain Monte Carlo (MCMC) procedure to calculate the detection statistic (Keitel et al., 2021; Ashton et al., 2020). Due to the significantly longer coherent time baseline of the follow-up, the detection statistic is an average of the detection statistics from each of the 1 728 segments, without any noise weights. Furthermore, due to the increase of coherence time, the follow-up resolves different values of the argument of periapsis, eccentricity, and frequency derivative, which now need to be all searched for explicitly.
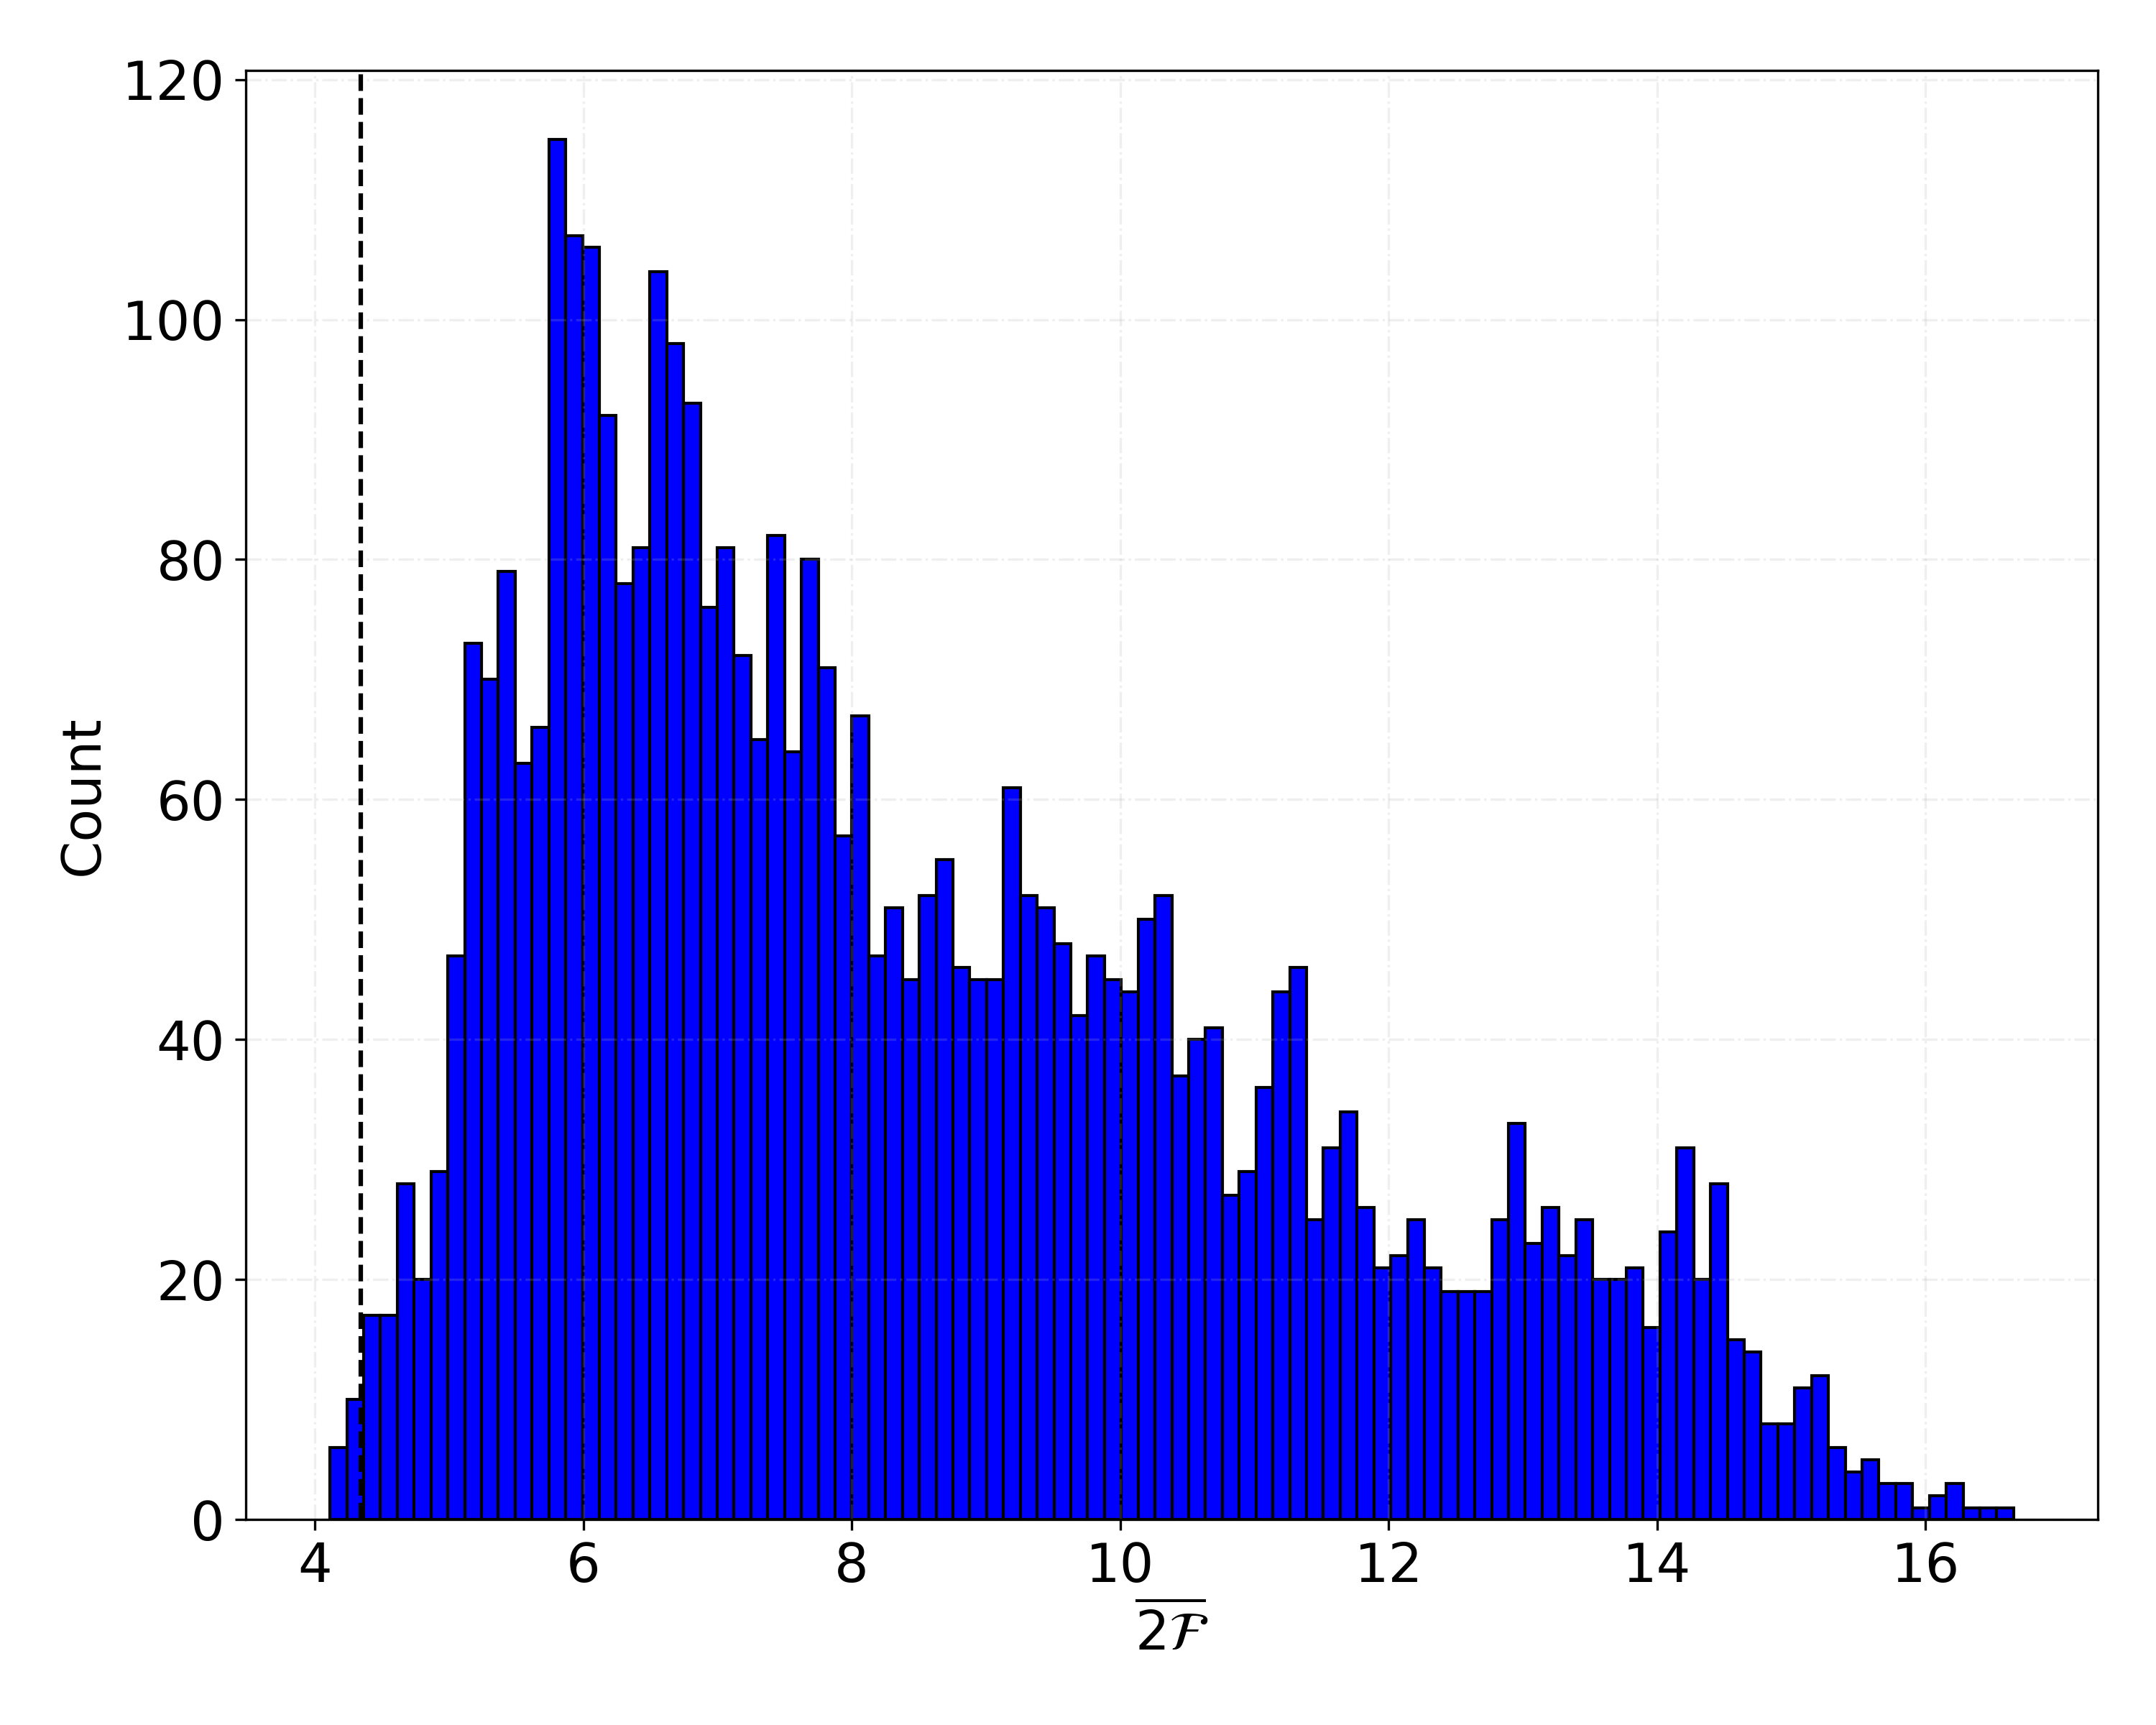
If one of our MCMC candidates is due to a gravitational-wave signal its detection statistic value must be consistent with what is expected from a signal. This is shown in Figure 5, where we have the distribution of detection statistic values after the MCMC follow-up of 4 763 candidates stemming from fake signals added to the O3a data. The signal parameters are distributed within the ranges of Table 1 111The cosine of the source inclination angle, the polarization angle, the initial phase, the frequency, the orbital period, the projected semi-major axis, the log of the eccentricity and of the frequency derivative are uniformly distributed; sky positions are isotropically distributed in the sky.. Each of the 4 763 candidates has passed the previous stage of the search, i.e. is one of the top 10 clusters in its 0.1 Hz band. The amplitudes of the fake signals bracket the 95% upper limit value. Based on the distribution of recovered values we set a threshold for our MCMC candidates at , which corresponds to about a 1% false dismissal rate.
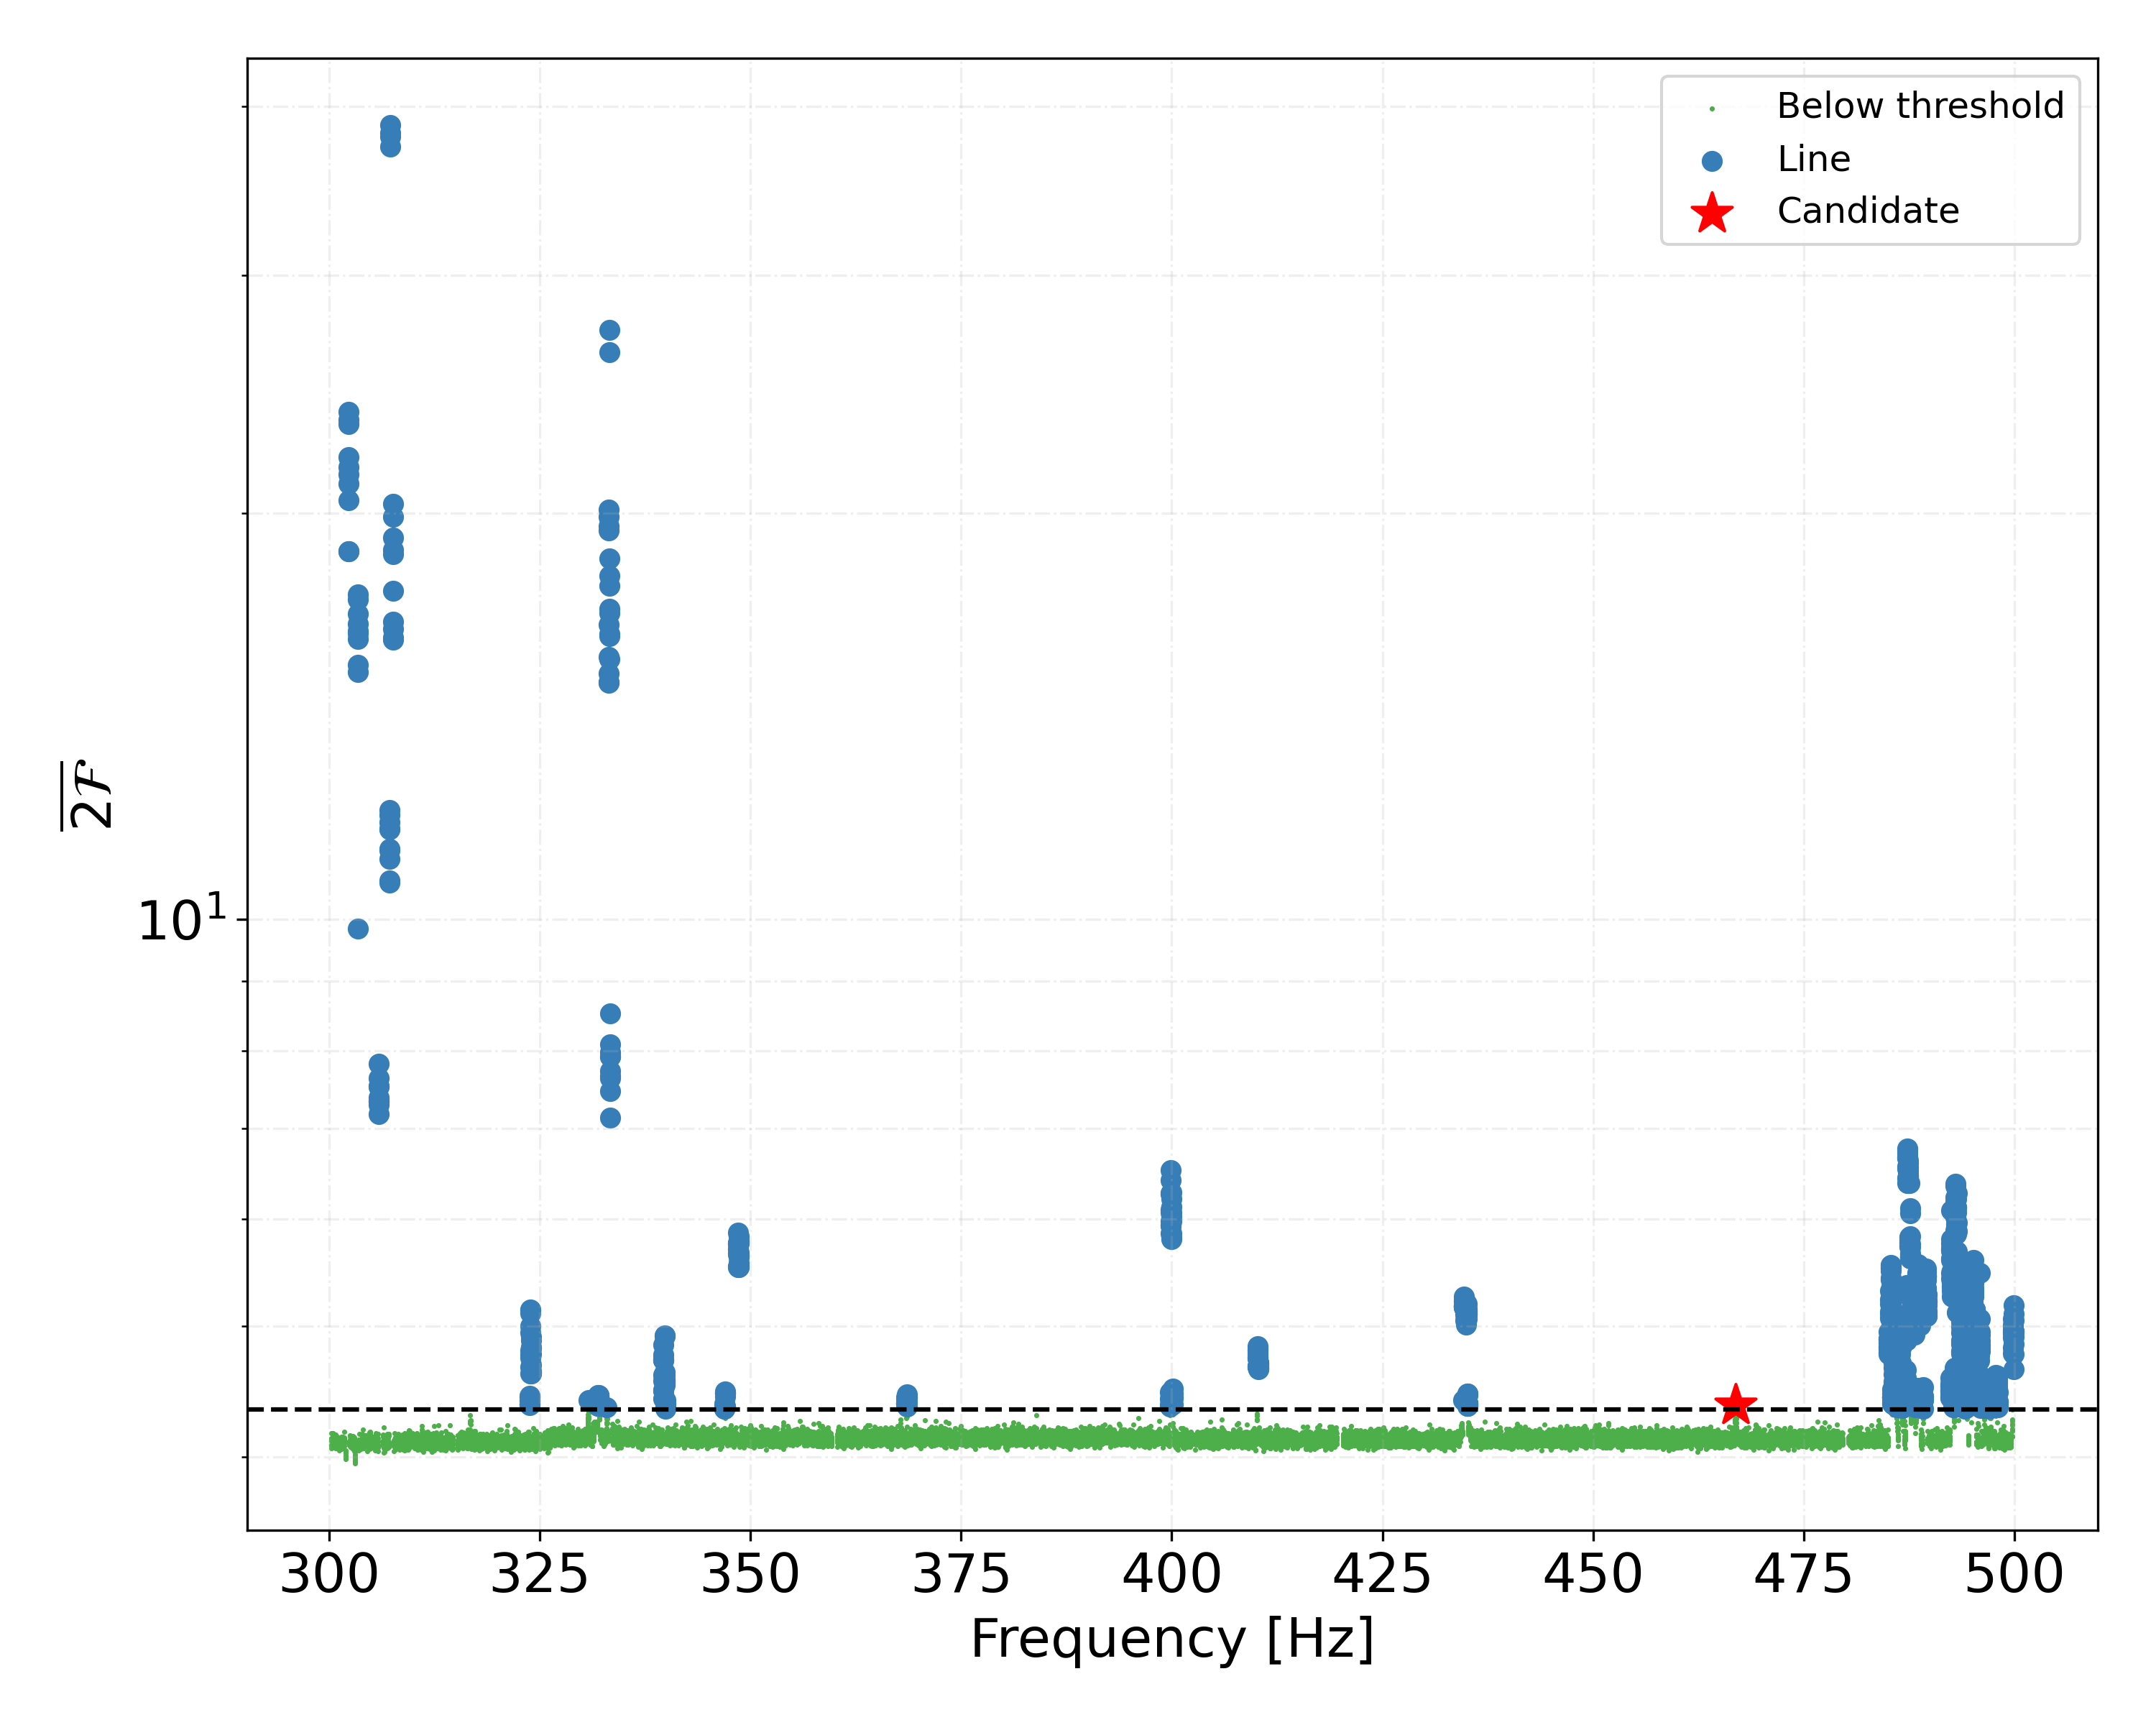
The distribution of for our candidates is shown in Figure 6: only one candidate out of the 19 044 survives, at Hz.
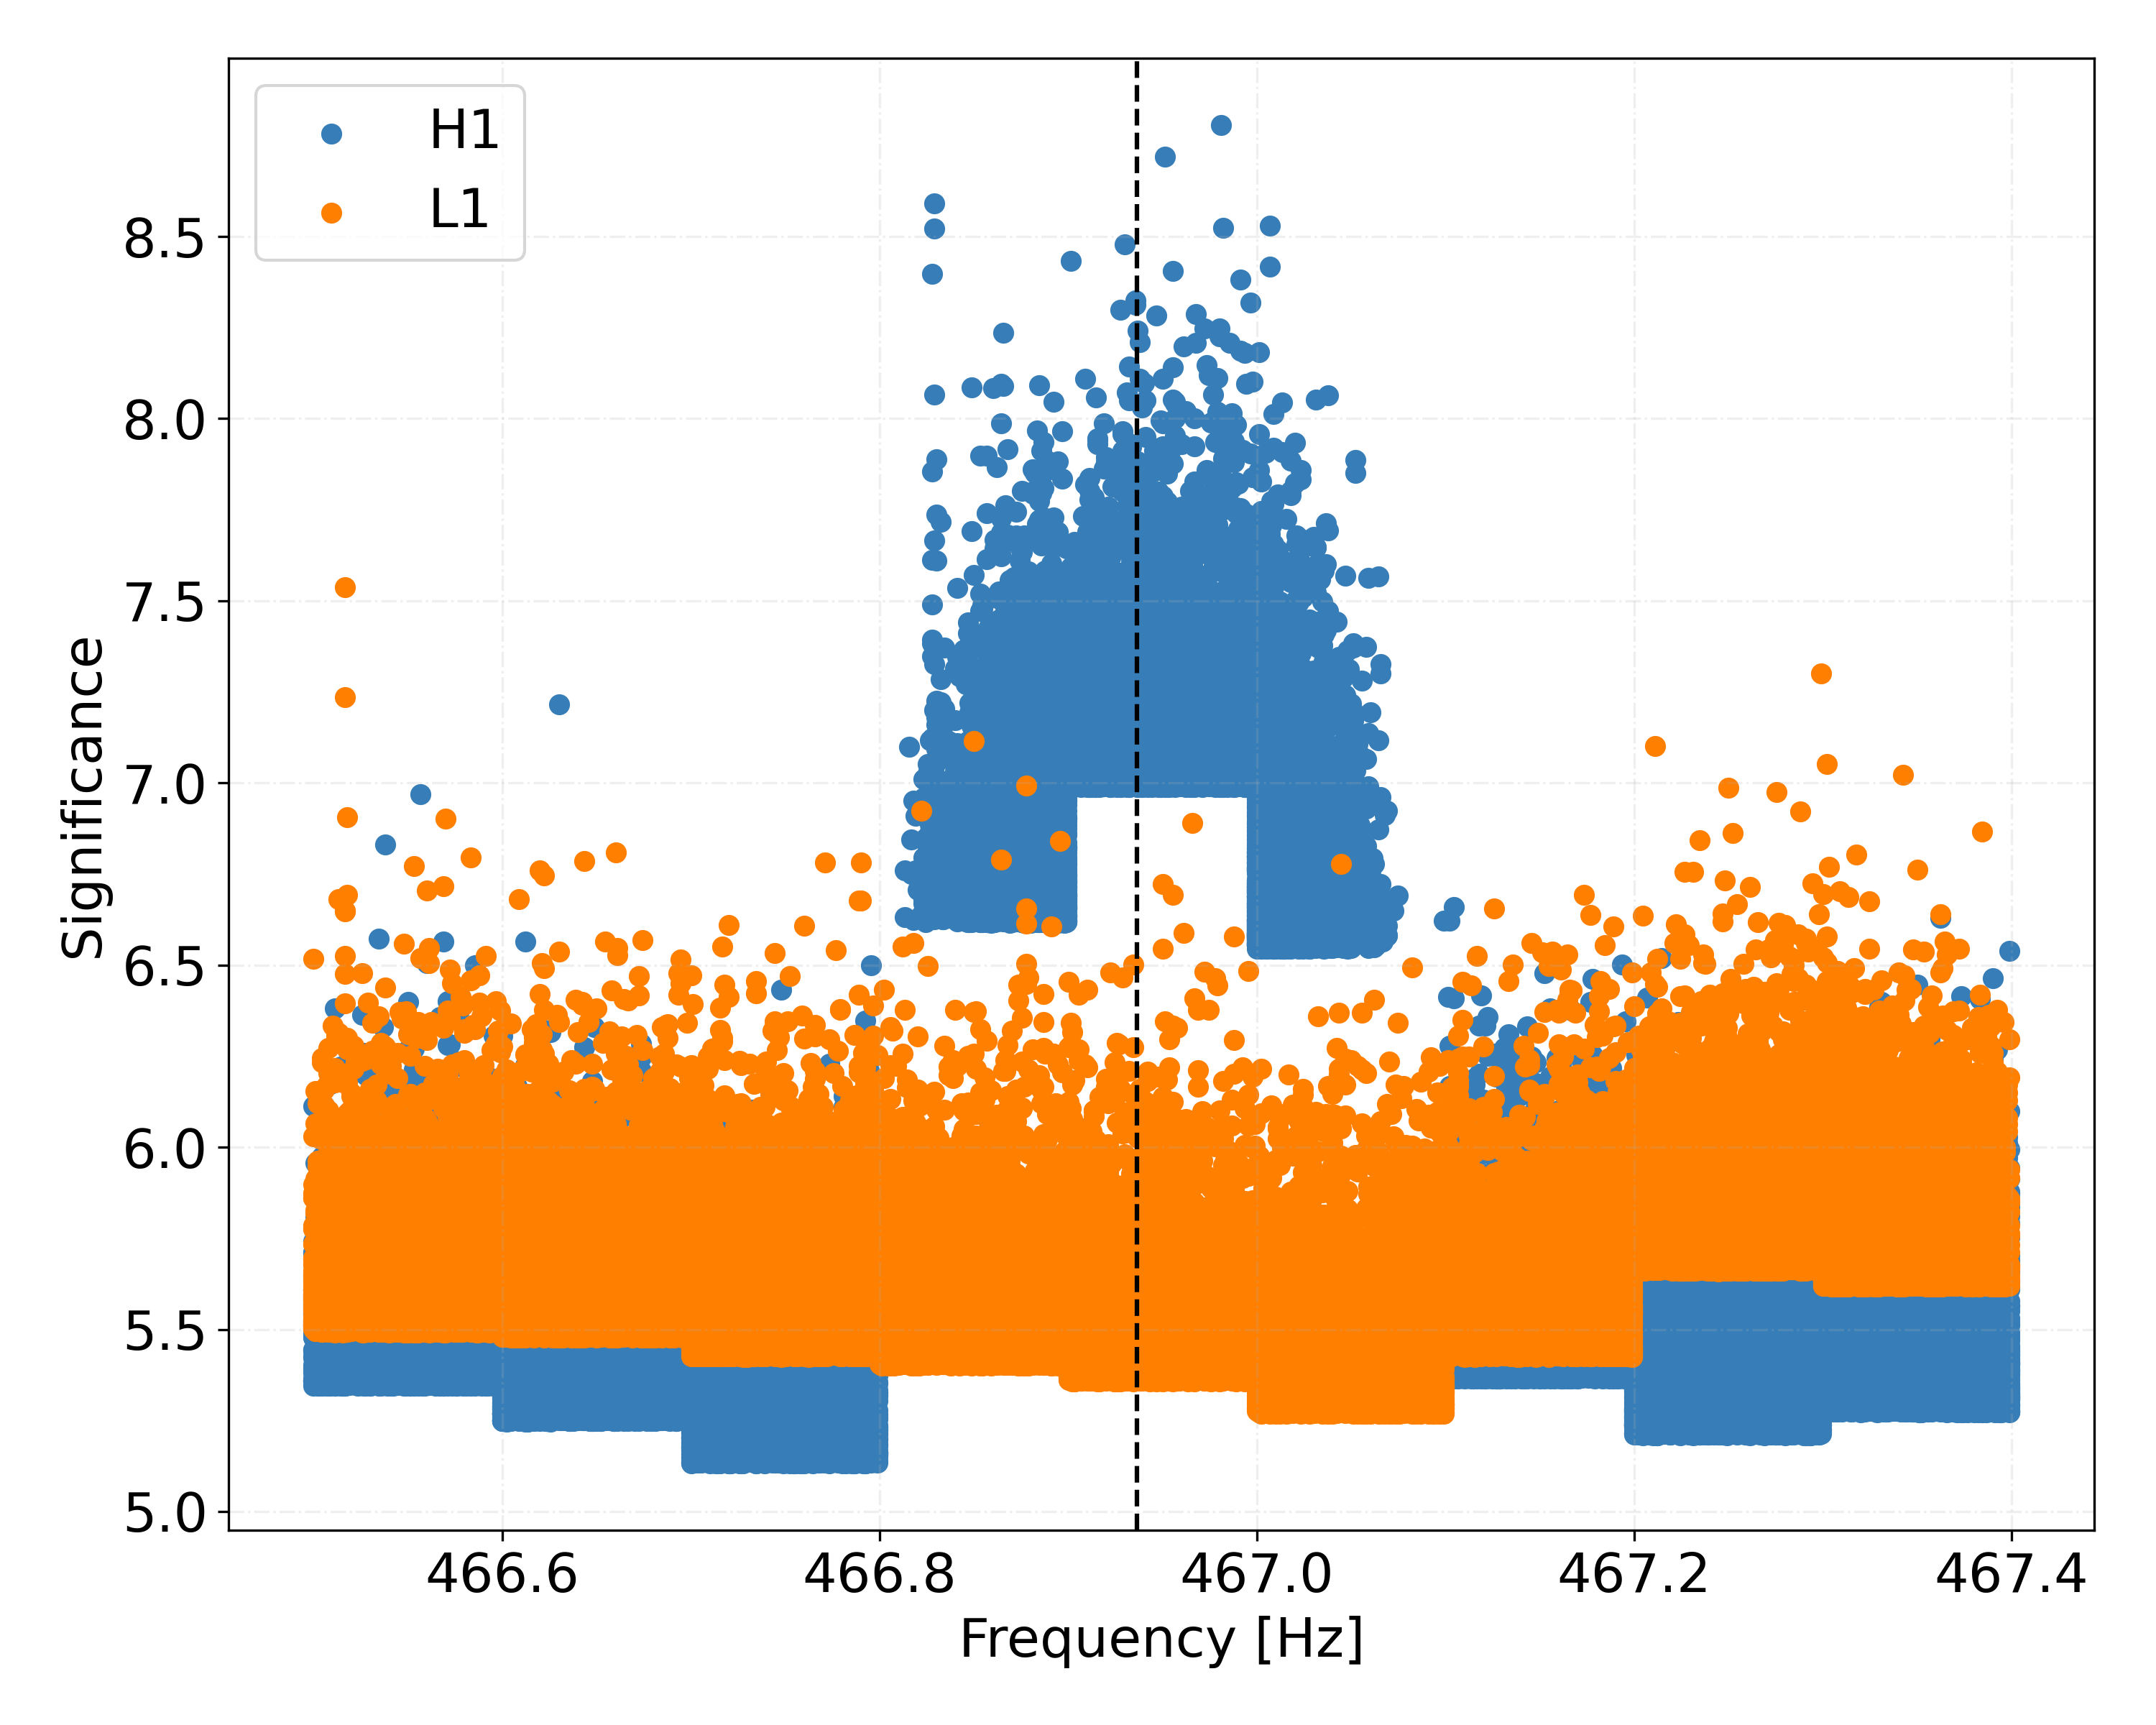
We investigate the candidate by performing single-detector searches with the same set-up as the initial search. This reveals higher detection statistic values from the H1 detector over a too broad range of frequencies ( Hz) to be consistent with an astrophysical signal (see Figure 7). Even though this spectral region does not display significant disturbances (see inset of Figure 1) and no line is present in the line-list (Goetz et al., 2021), the fact that the high detection statistic value comes from the least sensitive detector, further supports the idea that it is not of astrophysical origin. Additionally, we perform a s dedicated BinarySkyHou follow-up of this candidate with only L1 data (i.e. the undisturbed data), and the resulting detection statistic falls short of what is expected for a signal. Therefore no candidates survive the follow-up stage.
We note that no hardware injections (artificially added signals) are present in the frequency range covered by this search, so we do not expect any surviving candidates from hardware-injected signals.
4.2 Upper limits
We calculate the 95%-confidence upper limits on the intrinsic gravitational-wave amplitude in every 0.1 Hz band. This is the amplitude such that 95% of a population of signals with frequency in that band and with the values of the other parameters in our search range, would have been detected. The detection criterion for a signal is that it makes it in the top-ten list for the relevant band and that it passes the MCMC-output threshold.
We determine the in four representative 0.1 Hz bands in the lower and upper frequency regions. In each band we compute the percentage of detected signals from 500 search-and-recoveries, with signals added to the data at a fixed value of . This is a standard procedure, recently also employed by Abbott et al. (2021d); Covas & Sintes (2020); Steltner et al. (2021).
We can associate to each 0.1 Hz upper limit a corresponding sensitivity depth (Behnke et al., 2015; Dreissigacker et al., 2018), defined as
| (6) |
where is the power spectral density of the data. In reasonably well-behaved noise this quantity does not vary much with frequency, and is a good measure of the sensitivity of the search since it quantifies how far below the noise floor the smallest detectable signal lies. The average sensitivity depth for the low- and high-frequency band of Table 2 is and , respectively, with the uncertainties. We use these sensitivity depth values as scale factors to determine the upper limits in the remaining bands, from measurements of the noise floor . The upper limit values in machine-readable format are available in the Supplementary Materials222Upper limit values in machine-readable format are also available at https://www.aei.mpg.de/continuouswaves/O3aAllSkyBinary.
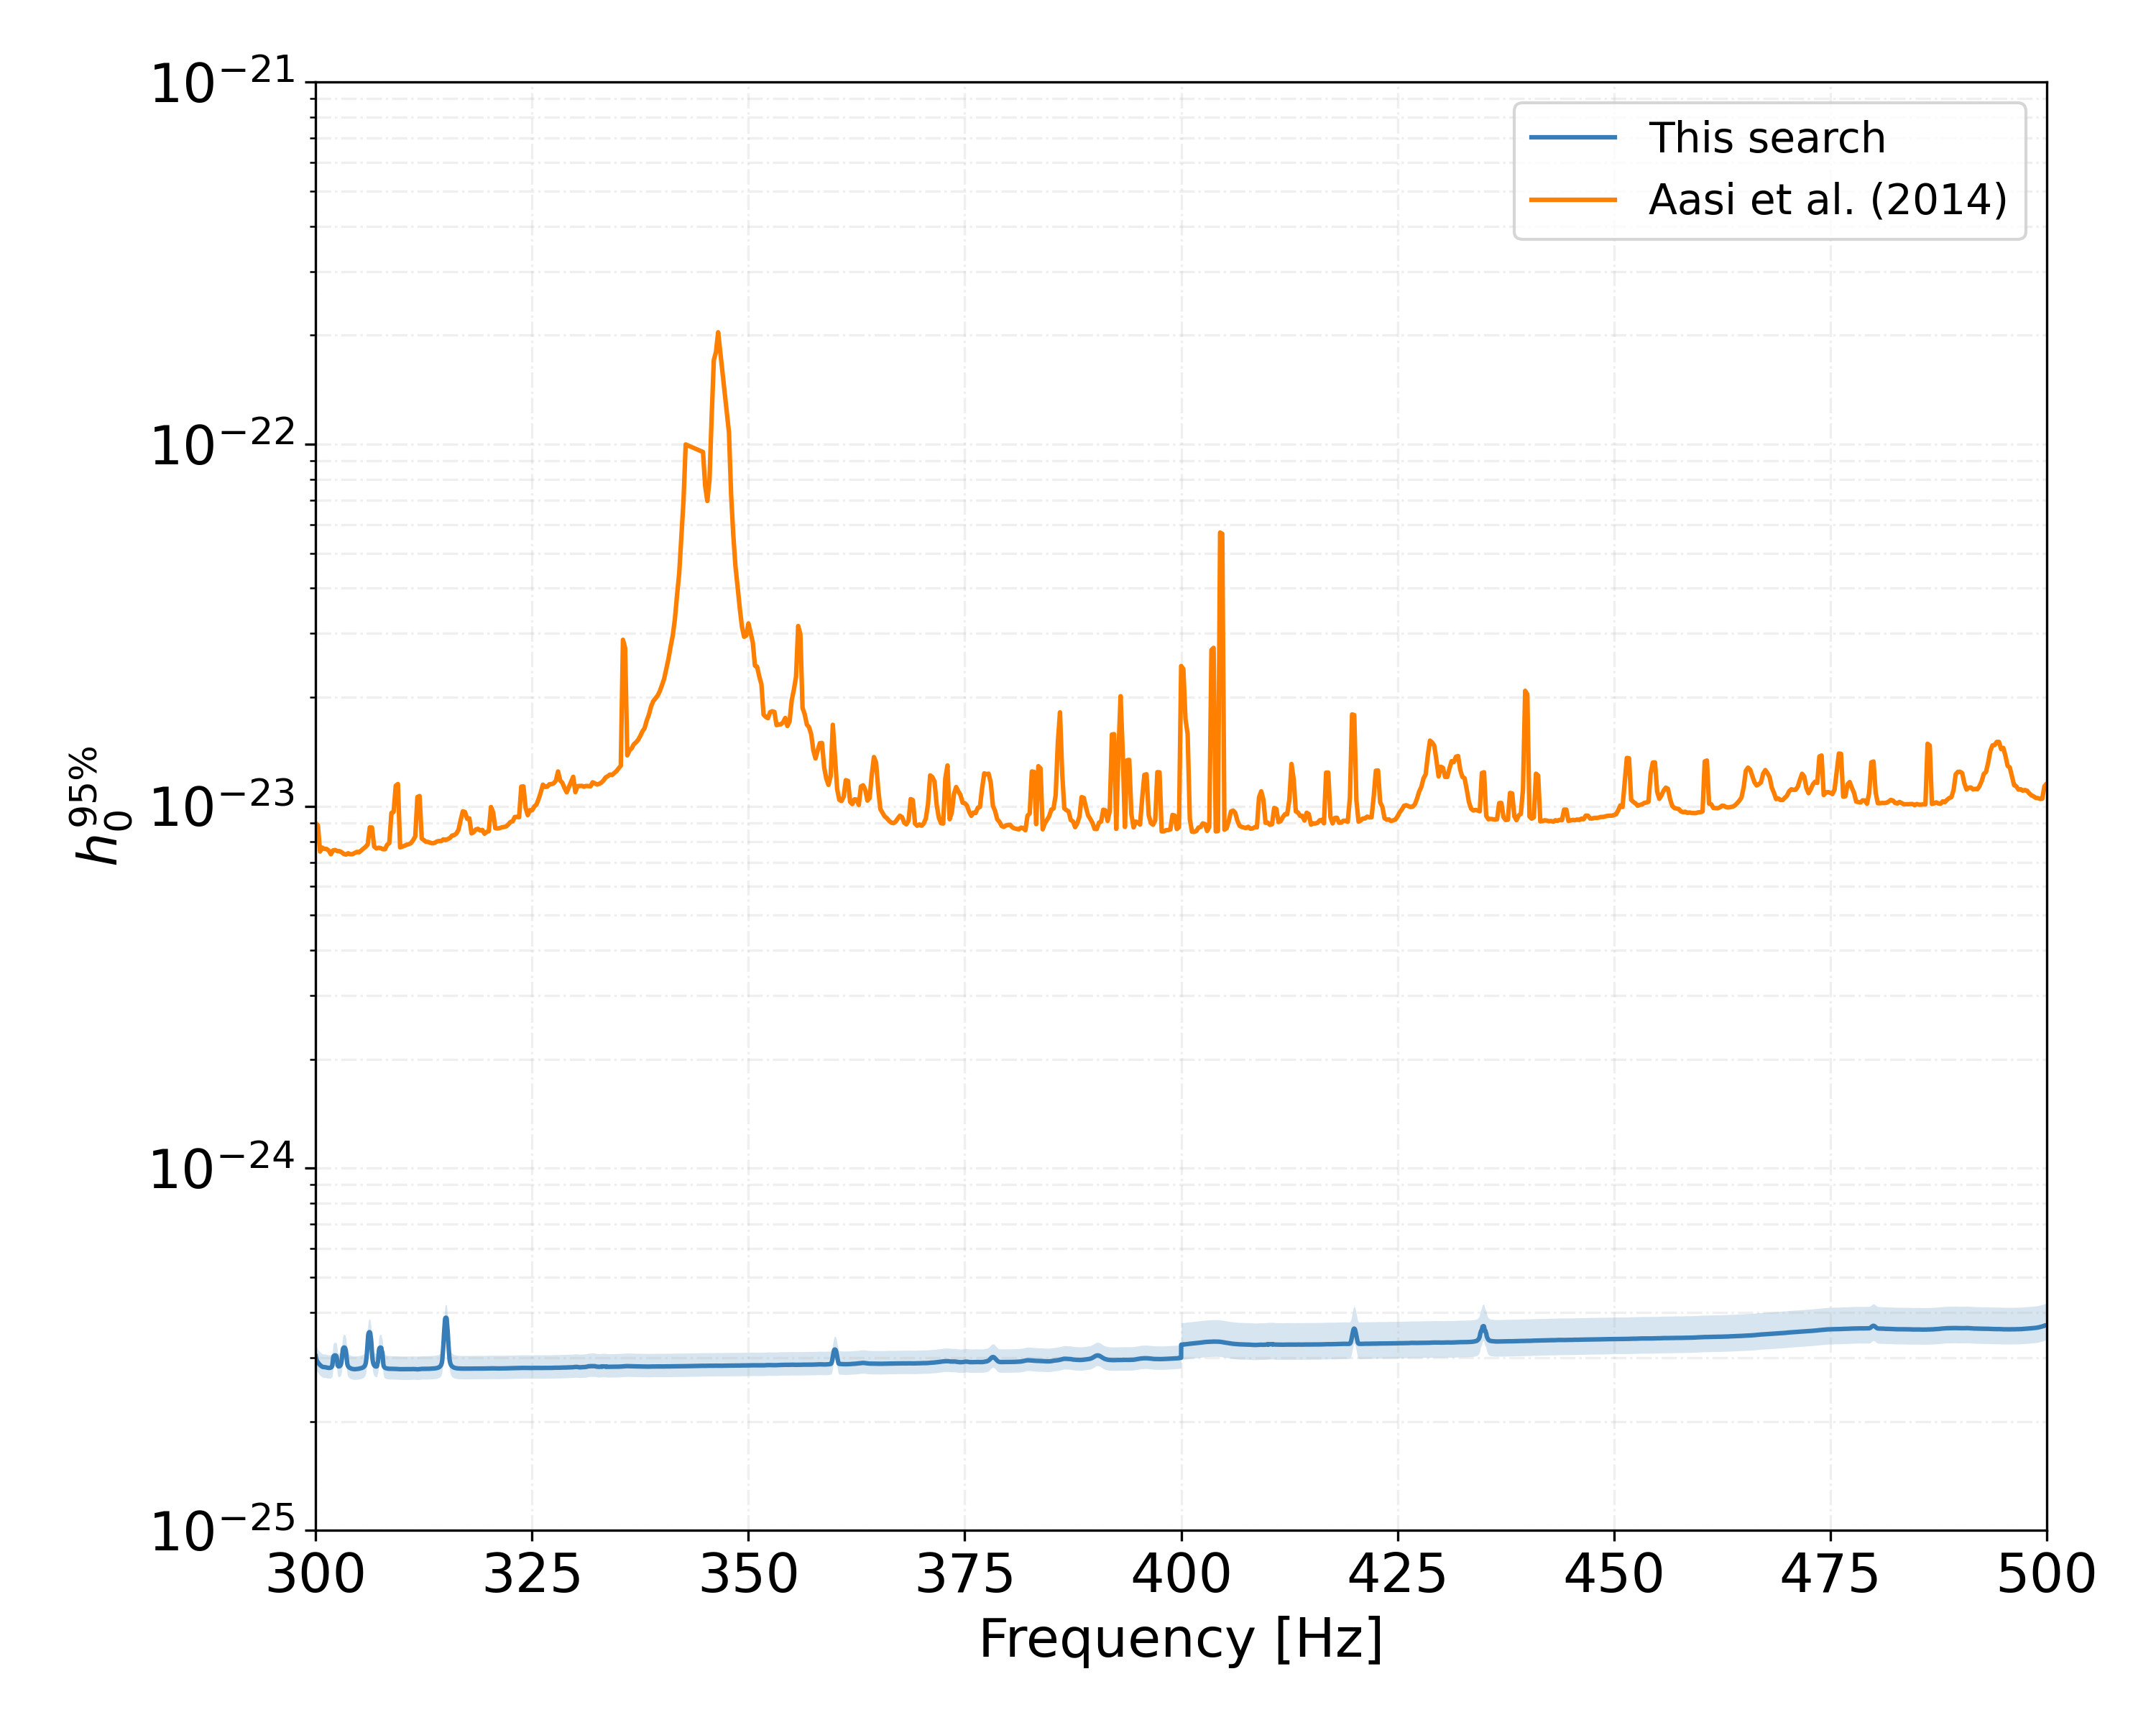
The results of this procedure are shown in Figure 8. The most sensitive upper limit is of at 311.7 Hz. Compared with the only previous search that analyzed this region of parameter space using S6 data (Aasi et al., 2014), this search is over 27 times more sensitive, due to the more sensitive dataset and a more sensitive pipeline. Abbott et al. (2021d) also searched O3a data (but only up to 300 Hz) and attained a sensitivity comparable to ours.
4.3 Astrophysical reach
The gravitational-wave amplitude emitted due to an equatorial ellipticity is
| (7) |
where , is the moment of inertia of the star with respect to the principal axis aligned with the rotation axis, is the distance, and is the gravitational-wave frequency, which in this model is equal to twice the rotational frequency.
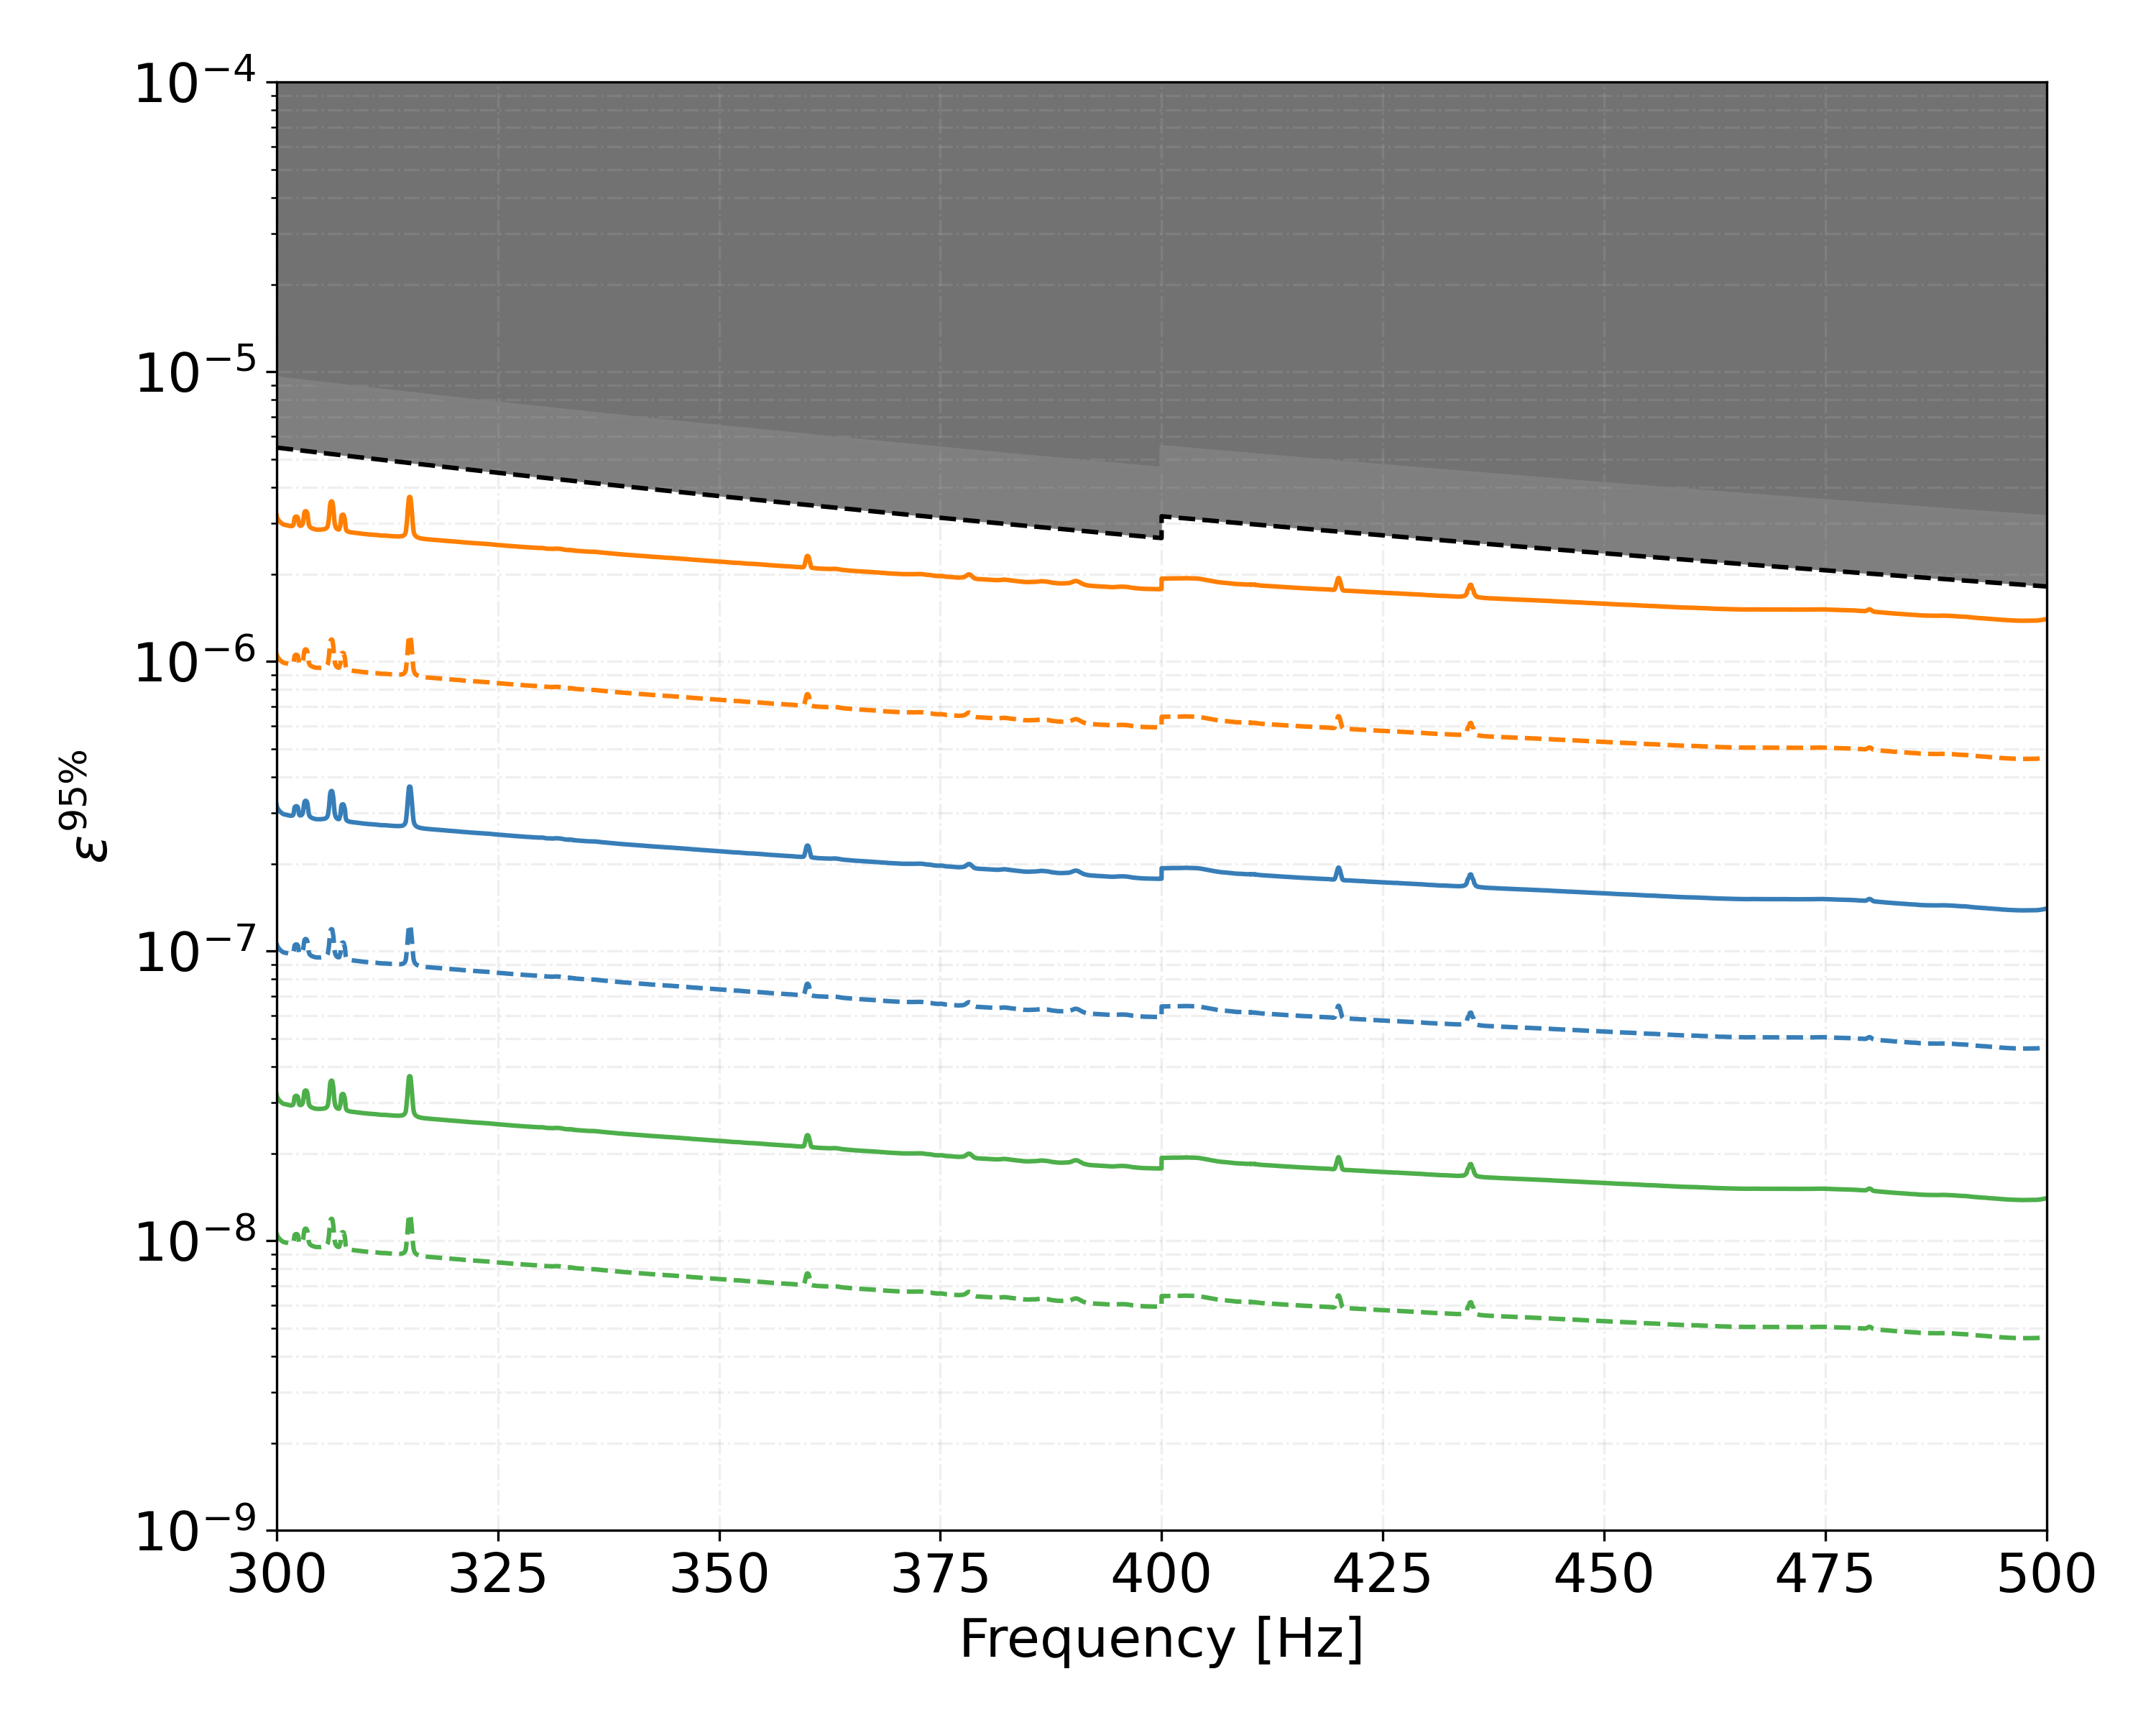
The upper limits on can hence be used to calculate upper limits on the asymmetry of the targeted neutron star population by rearranging equation 7. These ellipticity upper limits depend on choosing a value for the unknown moment of inertia of the neutron star, which is uncertain by around a factor of three (see section 4B of Abbott et al., 2007), although more exotic neutron star models such as quark stars or lower-mass neutron stars could have even higher moments of inertia (Horowitz, 2010; Owen, 2005). Figure 9 shows these results at three different distances and two values of the moment of inertia.
These upper limits on the ellipticity are the most restrictive up to date for searches of unknown neutron stars in binary systems. If the true minimum elipticity is as suggested by some studies (such as Woan et al., 2018; Gittins & Andersson, 2019), we are about one order of magnitude above that limit for neutron stars at 10 pc and two orders of magnitude for stars at 100 pc. For sources at 1 kpc, with kg m2 and emitting continuous waves at 500 Hz, the ellipticity can be constrained at , while at 10 pc we have . If we assume kg m2 (as could be due to an equation of state that supports neutron stars with larger radii), the upper limits are more stringent, as shown by the dashed traces. For example, at 100 pc and 500 Hz, the upper limit is around a factor of 60 from the claimed minimum at .
An alternative way to present these upper limits is to use the quadrupole moment , which is directly related to the product :
| (8) |
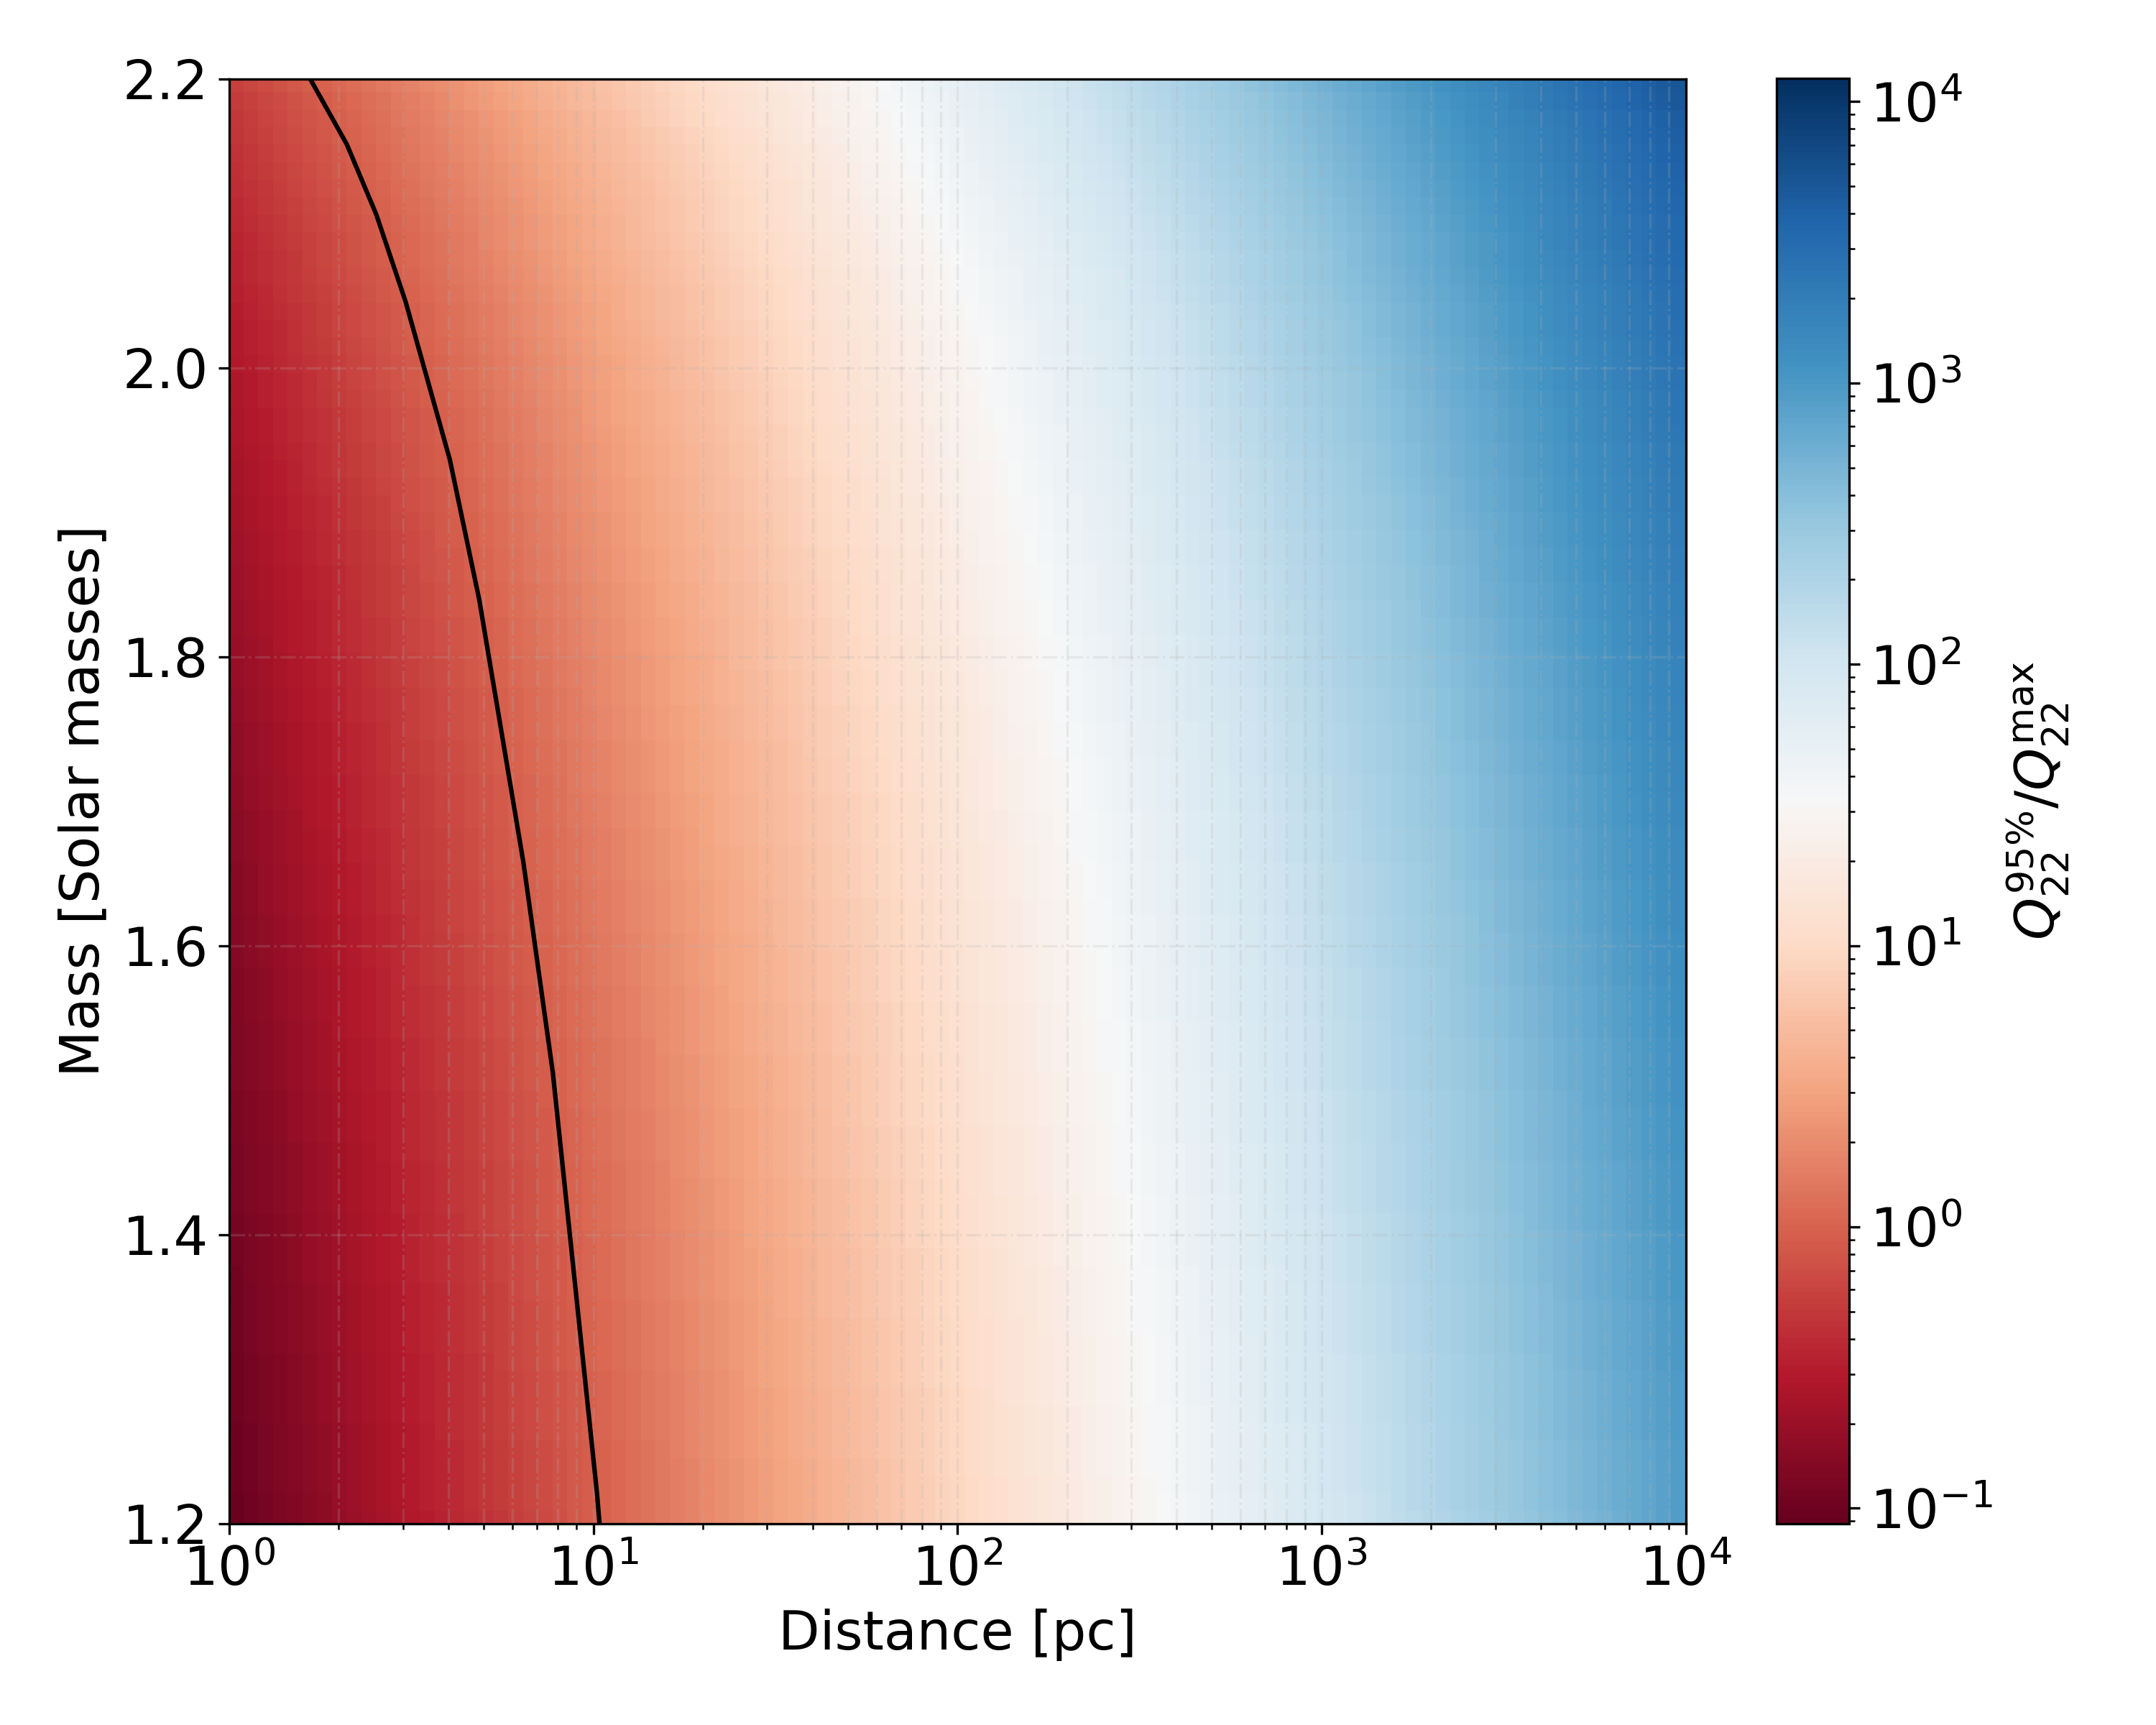
By using the quadrupole there is no need to choose a value for the moment of inertia . We can compare these upper limits on the quadrupole moment with the results obtained in Gittins & Andersson (2021), where the maximum quadrupole moment attainable by a neutron star with a certain mass was calculated. In this way, instead of plotting the absolute upper limit value reached by our search, we can show the ratio by which our search is constraining the maximum value, in a similar way to what is done in targeted continuous gravitational-wave searches where the gravitational-wave amplitude spin-down limit is used (Ashok et al., 2021).
This result can be seen in Figure 10, where the color indicates the ratio between the calculated upper limits and the maximum quadrupole of Gittins & Andersson (2021) for a 500 Hz signal. For a neutron star with 1.2 solar masses, our results exclude maximally strained neutron stars within 10 pc distance from Earth. Figure 10 also shows that we are more sensitive to neutron stars with lower masses, as previously discussed by Horowitz (2010).
The considerations above must be taken with a grain a salt, because the maximum quadrupole is highly dependent on the star’s unknown formation history, its equation of state, and the breaking strain and shear module of the elastic crust. Furthermore, if the neutron star contains exotic states of matter, the maximum quadrupole moment could be higher (Owen, 2005). For the fiducial value of the moment of inertia of , the quadrupoles of Gittins & Andersson (2021) correspond to relatively low ellipticities of and this results in a limited reach in Figure 10.
If the continuous gravitational waves are emitted by r-modes, apart from a weak dependence on the degree of central condensation of the star, their amplitude is
| (9) |
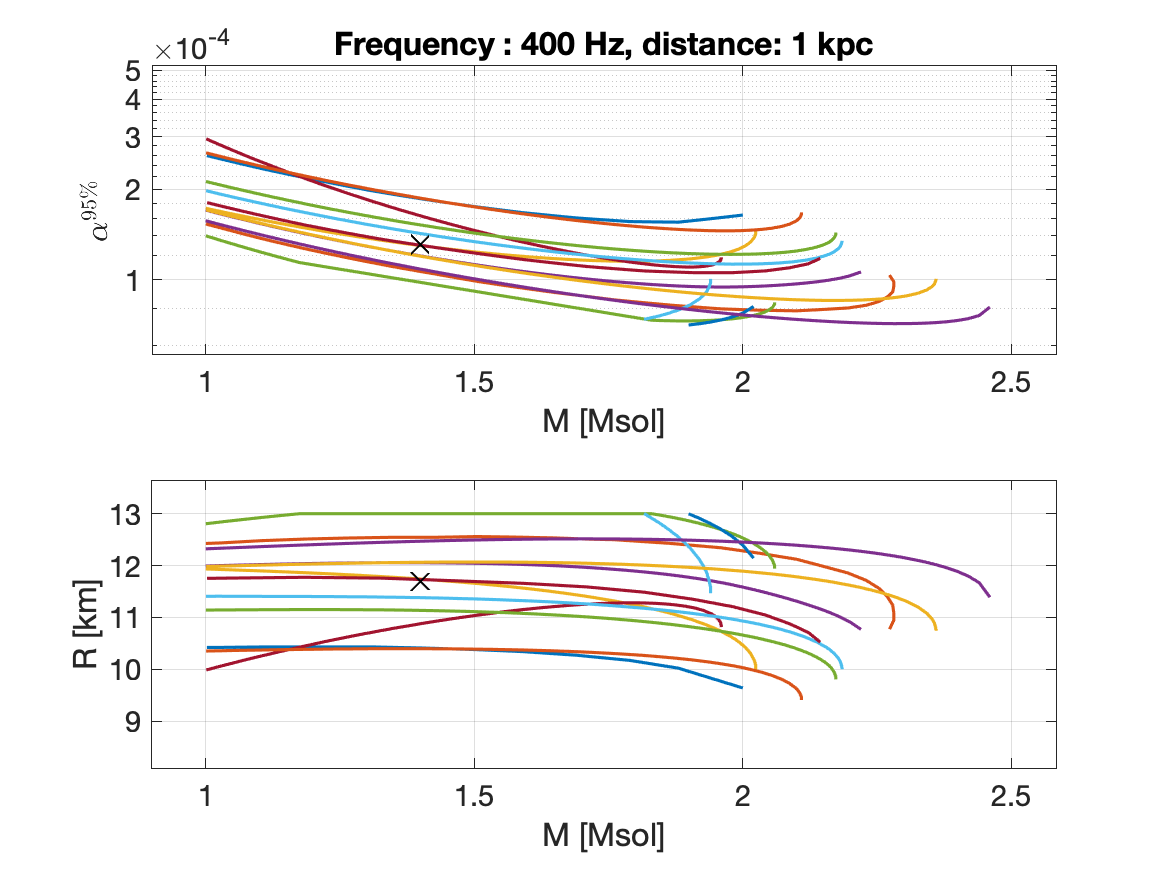
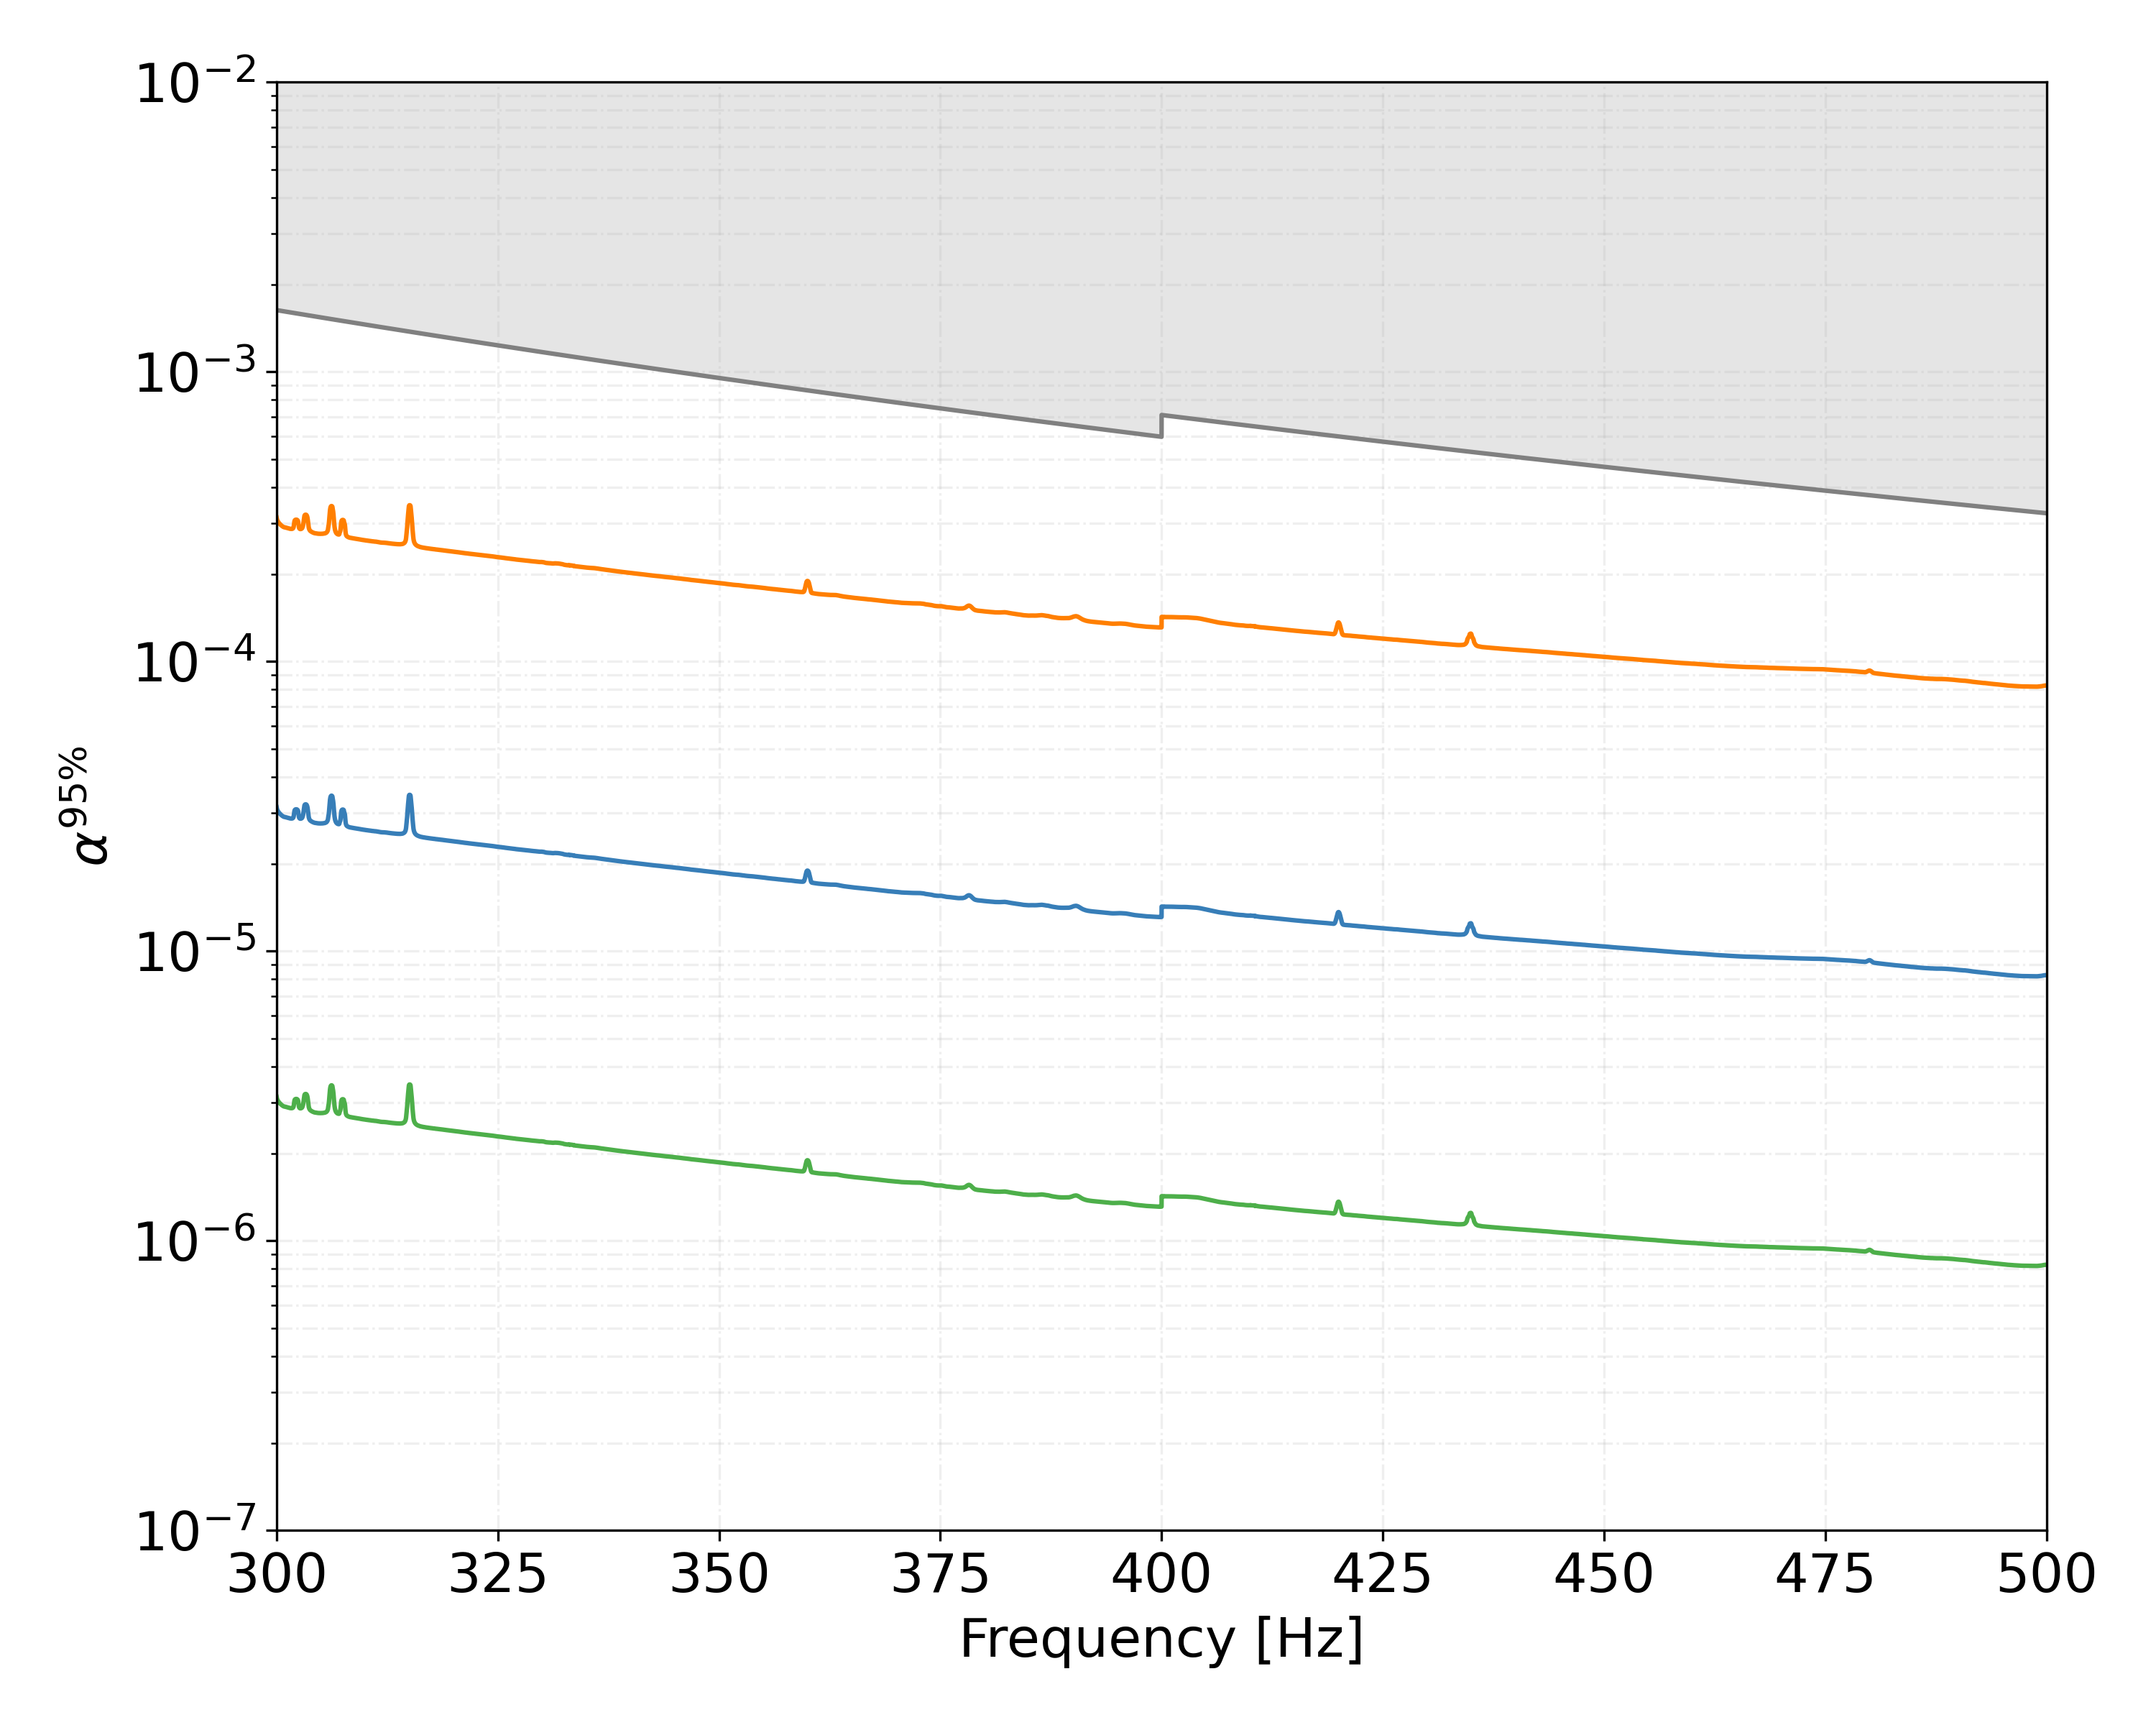
From this Equation we derive upper limits on the r-mode amplitude corresponding to different equations of state, in the range at 400 Hz for sources within a distance of 1 kpc, see Figure 11. The range of theoretical predictions in the literature on r-mode amplitudes is (Gusakov et al., 2014a, b) or (Bondarescu et al., 2007).
Maccarone et al. (2022) have argued that within 1 kpc there should exist a substantial galactic population of fast rotating neutron stars in quiescent LMXBs (qLMXBs). This is intriguing because Kantor et al. (2021); Gusakov et al. (2014a); Chugunov et al. (2014) have suggested the existence of a class of hot fast rotating non-accreting neutron stars that look very much like qLMXBs (HOFNARs) that would support very long-lasting r-modes. Our searches begin to probe such hypotheses.
5 Conclusions
In this paper we have presented the most sensitive search to date for continuous gravitational waves from unknown neutron stars in binary systems, with gravitational-wave frequencies between 300 and 500 Hz and orbital periods between 15 and 60 days. We have not detected any astrophysical signal, and we provide the most constraining upper limits in this region of parameter space, improving on existing upper limits by more than an order of magnitude. At spin periods near 4 ms, and distances between 10 and 100 pc, we are approximately within one order of magnitude of the minimum ellipticity value of O() proposed by Woan et al. (2018). In this frequency range, a factor of ten improvement in sensitivity is expected with data from the next generation of detectors. Before these come online a factor of a few may be gained with longer coherent segment lengths – which our new BinarySkyHou enables.
Our r-mode amplitude upper limits are well within the range of saturation values for sources up to 1 kpc over the entire frequency range, and begin to probe the existence of galactic HOFNARs.
The amplitude of continuous gravitational waves depends on the square of the frequency, while the noise floor of the detectors increases with a lower power of the frequency, thus making higher frequency searches particularly interesting. On the other hand, for neutron stars in unknown binary systems the resolution in parameter space increases with at least the fifth power of the frequency, making high-frequency searches a real challenge. These results demonstrate that it is now possible to explore the high-frequency range at interesting sensitivity depths.
References
- Aasi et al. (2014) Aasi, J., et al. 2014, Phys. Rev. D., 90, 062010, doi: 10.1103/PhysRevD.90.062010
- Aasi et al. (2015) —. 2015, Class. Quant. Grav., 32, 074001, doi: 10.1088/0264-9381/32/7/074001
- Abbott et al. (2007) Abbott, B., et al. 2007, Phys. Rev. D., 76, 042001, doi: 10.1103/PhysRevD.76.042001
- Abbott et al. (2021a) Abbott, R., et al. 2021a. https://arxiv.org/abs/2111.13106
- Abbott et al. (2021b) —. 2021b, Astrophys. J., 922, 71, doi: 10.3847/1538-4357/ac0d52
- Abbott et al. (2021c) —. 2021c. https://arxiv.org/abs/2111.15116
- Abbott et al. (2021d) —. 2021d, Phys. Rev. D., 103, 064017, doi: 10.1103/PhysRevD.103.064017
- Abbott et al. (2021e) —. 2021e, SoftwareX, 13, 100658
- Abbott et al. (2022a) —. 2022a. https://arxiv.org/abs/2201.00697
- Abbott et al. (2022b) —. 2022b, Phys. Rev. D., 105, 022002, doi: 10.1103/PhysRevD.105.022002
- Allen & Mendell (2004) Allen, B., & Mendell, G. 2004, SFT (Short-Time Fourier Transform) Data Format Version 2 Specification, Tech. Rep. T040164, LIGO DCC. https://dcc.ligo.org/LIGO-T040164/public
- Andersson (1998) Andersson, N. 1998, Astrophys. J., 502, 708, doi: 10.1086/305919
- Andersson et al. (1999) Andersson, N., Kokkotas, K. D., & Stergioulas, N. 1999, Astrophys. J., 516, 307, doi: 10.1086/307082
- Antoniadis et al. (2013) Antoniadis, J., et al. 2013, Science, 340, 6131, doi: 10.1126/science.1233232
- Ashok et al. (2021) Ashok, A., et al. 2021, Astrophys. J., 923, 85, doi: 10.3847/1538-4357/ac2582
- Ashton et al. (2020) Ashton, G., Keitel, D., Prix, R., & Tenorio, R. 2020, PyFstat, Zenodo, doi: 10.5281/zenodo.3967045
- Behnke et al. (2015) Behnke, B., Papa, M. A., & Prix, R. 2015, Phys. Rev. D., 91, 064007, doi: 10.1103/PhysRevD.91.064007
- Bondarescu et al. (2007) Bondarescu, R., Teukolsky, S. A., & Wasserman, I. 2007, Phys. Rev. D., 76, 064019, doi: 10.1103/PhysRevD.76.064019
- Bondarescu et al. (2009) —. 2009, Phys. Rev. D., 79, 104003, doi: 10.1103/PhysRevD.79.104003
- Bondarescu & Wasserman (2013) Bondarescu, R., & Wasserman, I. 2013, Astrophys. J., 778, 9, doi: 10.1088/0004-637X/778/1/9
- Chugunov et al. (2014) Chugunov, A. I., Gusakov, M. E., & Kantor, E. M. 2014, MNRAS, 445, 385, doi: 10.1093/mnras/stu1772
- Covas (2022) Covas, P. B. 2022, in preparation
- Covas & Prix (2022) Covas, P. B., & Prix, R. 2022. https://arxiv.org/abs/2203.08723
- Covas & Sintes (2020) Covas, P. B., & Sintes, A. 2020, Phys. Rev. Lett., 124, 191102, doi: 10.1103/PhysRevLett.124.191102
- Covas & Sintes (2019) Covas, P. B., & Sintes, A. M. 2019, Phys. Rev. D., 99, 124019, doi: 10.1103/PhysRevD.99.124019
- Cromartie et al. (2019) Cromartie, H., et al. 2019, Nature Astron., 4, 72, doi: 10.1038/s41550-019-0880-2
- Cutler & Schutz (2005) Cutler, C., & Schutz, B. F. 2005, Phys. Rev. D, 72, 063006, doi: 10.1103/PhysRevD.72.063006
- Dergachev & Papa (2021) Dergachev, V., & Papa, M. A. 2021, Phys. Rev. D., 104, 043003, doi: 10.1103/PhysRevD.104.043003
- Dreissigacker et al. (2018) Dreissigacker, C., Prix, R., & Wette, K. 2018, Phys. Rev. D., 98, 084058, doi: 10.1103/PhysRevD.98.084058
- Fesik & Papa (2020) Fesik, L., & Papa, M. 2020, Astrophys. J., 895, 11, doi: 10.3847/1538-4357/ab8193
- Friedman & Morsink (1998) Friedman, J. L., & Morsink, S. M. 1998, Astrophys. J., 502, 714, doi: 10.1086/305920
- Gittins & Andersson (2019) Gittins, F., & Andersson, N. 2019, MNRAS, 488, 99–110, doi: 10.1093/mnras/stz1719
- Gittins & Andersson (2021) —. 2021, MNRAS, 507, 116, doi: 10.1093/mnras/stab2048
- Glampedakis & Gualtieri (2018) Glampedakis, K., & Gualtieri, L. 2018, Astroph. Space Sci. Lib., 457, 673, doi: 10.1007/978-3-319-97616-7_12
- Goetz et al. (2021) Goetz, E., et al. 2021, O3a lines and combs in found in self-gated C01 data, LIGO DCC. https://dcc-llo.ligo.org/LIGO-T2100153/public
- Gusakov et al. (2014a) Gusakov, M. E., Chugunov, A. I., & Kantor, E. M. 2014a, Phys. Rev. Lett., 112, 151101, doi: 10.1103/PhysRevLett.112.151101
- Gusakov et al. (2014b) —. 2014b, Phys. Rev. D., 90, 063001, doi: 10.1103/PhysRevD.90.063001
- Hebeler et al. (2013) Hebeler, K., Lattimer, J. M., Pethick, C. J., & Schwenk, A. 2013, Astrophys. J., 773, 11, doi: 10.1088/0004-637X/773/1/11
- Holgado et al. (2018) Holgado, A. M., Ricker, P. M., & Huerta, E. A. 2018, Astrophys. J., 857, 38, doi: 10.3847/1538-4357/aab6a9
- Horowitz (2010) Horowitz, C. J. 2010, Phys. Rev. D., 81, 103001, doi: 10.1103/PhysRevD.81.103001
- Idrisy et al. (2015) Idrisy, A., Owen, B. J., & Jones, D. I. 2015, Phys. Rev. D., 91, 024001, doi: 10.1103/PhysRevD.91.024001
- Jaranowski et al. (1998) Jaranowski, P., et al. 1998, Phys. Rev. D., 58, 063001, doi: 10.1103/PhysRevD.58.063001
- Kantor et al. (2021) Kantor, E. M., Gusakov, M. E., & Dommes, V. A. 2021, Phys. Rev. D., 103, 023013, doi: 10.1103/PhysRevD.103.023013
- Keitel et al. (2021) Keitel, D., Tenorio, R., Ashton, G., & Prix, R. 2021, Journal of Open Source Software, 6, 3000, doi: 10.21105/joss.03000
- Krishnan et al. (2004) Krishnan, B., et al. 2004, Phys. Rev. D., 70, 082001, doi: 10.1103/PhysRevD.70.082001
- Kurkela et al. (2014) Kurkela, A., Fraga, E. S., Schaffner-Bielich, J., & Vuorinen, A. 2014, Astrophys. J., 789, 127, doi: 10.1088/0004-637X/789/2/127
- Lasky (2015) Lasky, P. 2015, Pub. Astron. Soc. Aust., 32, doi: 10.1017/pasa.2015.35
- Leaci & Prix (2015) Leaci, P., & Prix, R. 2015, Phys. Rev. D, 91, 102003, doi: 10.1103/PhysRevD.91.102003
- Lindblom et al. (1998) Lindblom, L., Owen, B. J., & Morsink, S. M. 1998, Phys. Rev. Lett., 80, 4843, doi: 10.1103/PhysRevLett.80.4843
- LVC (2021) LVC. 2021, The O3a Data Release, doi: 10.7935/nfnt-hm34
- Maccarone et al. (2022) Maccarone, T. J., Degenaar, N., Tetarenko, B. E., et al. 2022. https://arxiv.org/abs/2202.09503
- Ming et al. (2022) Ming, J., et al. 2022, Astrophys. J., 925, 8, doi: 10.3847/1538-4357/ac35cb
- Mukherjee et al. (2018) Mukherjee, A., Messenger, C., & Riles, K. 2018, Phys. Rev. D., 97, 043016, doi: 10.1103/PhysRevD.97.043016
- Owen (2005) Owen, B. J. 2005, Phys. Rev. Lett., 95, 211101, doi: 10.1103/PhysRevLett.95.211101
- Owen et al. (1998) Owen, B. J., Lindblom, L., Cutler, C., et al. 1998, Phys. Rev. D, 58, 084020, doi: 10.1103/PhysRevD.58.084020
- Özel & Freire (2016) Özel, F., & Freire, P. 2016, Ann. Rev. Astron. Astrophys., 54, 401, doi: 10.1146/annurev-astro-081915-023322
- Rajbhandari et al. (2021) Rajbhandari, B., et al. 2021, Phys. Rev. D, 104, 122008, doi: 10.1103/PhysRevD.104.122008
- Reisenegger & Bonacic (2003) Reisenegger, A., & Bonacic, A. A. 2003, Phys. Rev. Lett., 91, 201103, doi: 10.1103/PhysRevLett.91.201103
- Singh et al. (2020a) Singh, N., Haskell, B., Mukherjee, D., & Bulik, T. 2020a, MNRAS, 493, 3866, doi: 10.1093/mnras/staa442
- Singh et al. (2020b) Singh, N., et al. 2020b, MNRAS, 493, 3866, doi: 10.1093/mnras/staa442
- Steltner et al. (2022) Steltner, B., Papa, M., & Eggenstein, H.-B. 2022, Phys. Rev. D., 105, 022005, doi: 10.1103/PhysRevD.105.022005
- Steltner et al. (2021) Steltner, B., et al. 2021, Astrophys. J., 909, 79, doi: 10.3847/1538-4357/abc7c9
- Tenorio et al. (2021) Tenorio, R., Keitel, D., & Sintes, A. M. 2021, Universe, 7, 474, doi: 10.3390/universe7120474
- van Eysden & Melatos (2008) van Eysden, C. A., & Melatos, A. 2008, Class. Quant. Grav., 25, 225020, doi: 10.1088/0264-9381/25/22/225020
- Woan et al. (2018) Woan, G., et al. 2018, Astrophys. J., 863, L40, doi: 10.3847/2041-8213/aad86a
- Yoshida et al. (2005) Yoshida, S., Yoshida, S., & Eriguchi, Y. 2005, MNRAS, 356, 217, doi: 10.1111/j.1365-2966.2004.08436.x
- Zhang et al. (2021) Zhang, Y., et al. 2021, Astrophys. J. Lett., 906, L14, doi: 10.3847/2041-8213/abd256