Deep upper limit on the optical emission during a hard X-ray burst from the magnetar SGR J1935+2154
Abstract
In September 2021 the magnetar SGR J1935+2154 entered a stage of burst/flaring activity in the hard X-ray band. On September 10, 2021 we observed SGR J1935+2154 with the fiber-fed fast optical photon counter IFI+Iqueye, mounted at the 1.22 m Galileo telescope in Asiago. During one of the IFI+Iqueye observing windows a hard X-ray burst was detected with the Fermi Gamma-ray Burst Monitor. We performed a search for any significant increase in the count rate on the 1-s, 10-ms and 1-ms binned IFI+Iqueye light curves around the time of the Fermi burst. No significant peak was detected with a significance above 3 in an interval of 90 s around the burst. Correcting for interstellar extinction ( mag), the IFI+Iqueye upper limits to any possible optical burst from SGR J1935+2154 are mag, mag and mag for the 1-s, 10-ms and 1-ms binned light curves, respectively. The corresponding extinction corrected upper limits to the fluence (specific fluence) are erg cm-2 (0.35 Jy s), erg cm-2 (4.8 Jy 10 ms), and erg cm-2 (17.9 Jy ms), orders of magnitude deeper than any previous simultaneous optical limit on a magnetar burst. The IFI+Iqueye measurement can also place a more stringent constraint to the spectral index of the optical to hard X-ray fluence of SGR J1935+2154, implying a spectrum steeper than . Fast optical timing observations of bursts associated with radio emission have then the potential to yield a detection.
1 Introduction
SGR J1935+2154 is a Galactic magnetar, a non-accreting neutron star powered mainly by magnetic energy dissipation (see Mereghetti et al. 2015; Turolla et al. 2015; Kaspi & Beloborodov 2017 for recent reviews). This class of high energy sources is characterized by strong variability and recurrent bursts of hard X-rays/soft gamma-rays (hence the name soft gamma-ray repeaters, SGRs), that have typical duration 1 s and peak luminosity erg s-1. Hyper-energetic bursts with peak luminosity reaching erg s-1, known as giant flares, have also been emitted sporadically by a handful of magnetars (e.g. Palmer et al. 2005).
SGR J1935+2154 was discovered through the detection of a short burst with the Neil Gehrels Swift Observatory/Burst Alert Telescope in 2014 (Stamatikos et al., 2014). Follow-up observations in the X-ray band revealed that the source is a magnetar with spin period s and period derivative s s-1 (Israel et al., 2016), leading to a characteristic age of 3.6 kyr and a dipole magnetic field of G. A very faint (H ) near infrared counterpart was identified with the Hubble Space Telescope (Levan et al., 2018). No pulsed radio emission has been observed so far (e.g. Tang et al. 2021), although a tentative detection was recently reported (Zhu et al., 2020).
The source is projected in the direction of the Galactic plane and could be associated with the supernova remnant G57.2+0.8 for which several distance estimates are reported in the literature (see e.g. Zhou et al. 2020 and references therein). In the following, we will adopt the distance derived from an analysis of the dust-scattering ring observed in X-ray images taken with the Swift X-ray Telescope instrument in 2020 ( kpc; Mereghetti et al. 2020), which is independent of the supernova remnant association.
SGR J1935+2154 has sporadically gone through phases of hard X-ray burst/flaring activity (e.g. Borghese et al. 2020; Lin et al. 2020a). The outburst episode observed in 2020 culminated in tens of bursts emitted in a few days (see e.g. Mereghetti et al. 2020 and references therein). During this outburst, on 2020 April 28 an extremely bright millisecond-duration radio burst (FRB 200428) was emitted by SGR J1935+2154 and detected with the Canadian Hydrogen Intensity Mapping Experiment (CHIME; CHIME/FRB Collaboration et al. 2020) and STARE2 (Bochenek et al., 2020) telescopes. The radio burst turned out to be temporally coincident with a bright hard X-ray burst detected with the INTEGRAL (Mereghetti et al., 2020), Konus-Wind (Ridnaia et al., 2021), Insight Hard X-ray Modulation Telescope (HXMT; Lin et al. 2020b) and AGILE (Tavani et al., 2021) satellites. No optical counterpart was detected in a simultaneous observation performed with the BOOTES telescope (Lin et al., 2020b) down to an extinction-corrected fluence of 4400 Jy ms. A near infrared campaign was also carried out with Palomar Gattini-IR observing system in the J band, placing an upper limit on the second-timescale extinction-corrected fluence of Jy ms (De et al., 2020).
In the period between Sep 9 and Sep 22, 2021 SGR J1935+2154 entered a new stage of burst/flaring activity, detected with several satellites (GECAM, Xiao et al. 2021; Konus-Wind, Ridnaia et al. 2021; Fermi, Roberts et al. 2021; AGILE, Ursi et al. 2021). We then decided to target the source with our fast photon counter Iqueye (Naletto et al., 2009), which is fiber-fed at the 1.22 m Galileo telescope at the Asiago Astrophysical Observatory through the Iqueye Fiber Interface111https://web.oapd.inaf.it/zampieri/aqueye-iqueye/ (IFI; Zampieri et al. 2019). Our main goal was exploiting the exquisite time resolution (up to ns) and high sensitivity of our instrumentation to search for second or sub-second optical flashes possibly associated to X-ray and/or radio bursts from SGR J1935+2154.
The observations presented here are part of a multiwavelength programme devoted to searching for prompt/delayed optical flashes from Fast Radio Bursts (FRBs) and Magnetars (e.g. Pilia et al. 2020). In Sect. 2 we present the observations of SGR J1935+2154 carried out on Sep 10, 2021 with IFI+Iqueye and the Fermi Gamma-ray Burst Monitor (GBM) instrument. In Sect. 3 we show the results of the analysis, while in Sect. 4 we discuss them within the framework of previous measurements.
| Observation ID | Start time | Exposure | Rate |
|---|---|---|---|
| (UTC) | (s) | (kc/s) | |
| 20210911-002926 | 2021-09-10 22:39:29.0 | 1197.4 | 1.8 |
| 20210911-011727 | 2021-09-10 23:17:30.0 | 1797.6 | 2.0 |
| 20210911-014851 | 2021-09-10 23:48:54.0 | 1797.6 | 2.3 |
2 Observations and data analysis
2.1 IFI+Iqueye
On the night of September 10, 2021 we observed the area of the sky centered at the position of SGR J1935+2154 (RA=19 34 55.606, Dec=+21 53 47.45, J2000, error 0.2”; Levan et al. 2018) with the fiber-fed fast optical photon counter IFI+Iqueye (Naletto et al., 2009; Zampieri et al., 2019), mounted at the 1.22 m Galileo telescope at the Asiago Astrophysical Observatory. The log of the observations, performed in white light without filters, and the average count rate (not background subtracted) measured at the position of SGR J1935+2154 are reported in Table 1. At the beginning and at the end of each acquisition a nearby sky region and a reference star close to the position of the source were also observed to monitor the quality and transparency of the sky. The first 10 minutes of the first observation (Obs. ID 20210911-002926) were affected by passage of slight veils and were then discarded, leaving a useful observing window of 20 minutes.
The target was carefully centered on the IFI instrument camera in such a way to match the position of the optical fiber injecting the light into Iqueye (Zampieri et al., 2019). To this aim, an image of the field was previously acquired and astrometrically calibrated using nine stars in the field. The error of the target position registered on the image is 0.6”, significantly smaller than the optical fiber diameter.
The photon event lists acquired with Iqueye were reduced using a dedicated software222QUEST v. 1.1.5, see Zampieri et al. (2015).. Light curves binned at 1 ms, 10 ms and 1 s were computed from the reduced event lists and searched for any significant rate increase.
2.2 Fermi GBM
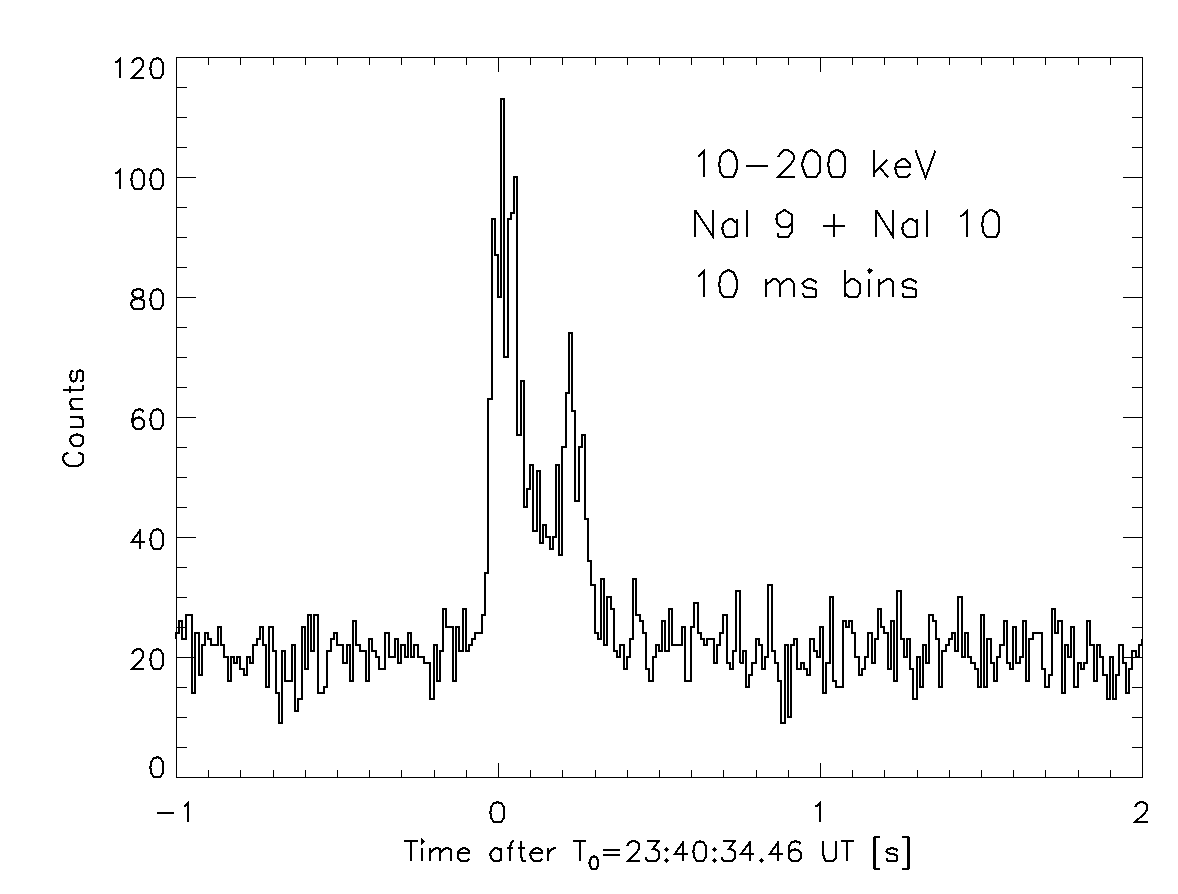
In September 2021 the Fermi GBM instrument revealed several bursts from the direction of SGR J1935+2154 (Roberts et al., 2021). One of them occurred on September 10, during our IFI+Iqueye observations (GBM trigger n. 653010039, at T0= 23:40:34.46 UTC). Figure 1 shows the 10-200 keV light curve of this burst binned at 10 ms, as derived by summing the counts of the two NaI detectors with the best orientation for the magnetar direction (n. 9 and n. 10).
In order to measure the burst fluence, we performed a spectral analysis by extracting the spectra of the two GBM NaI detectors with the RMFIT software in the time interval [T s, T s], as well as those of the corresponding background. The latter was estimated by fitting with a linear function the count rates measured in time intervals of about 30 s before and after the burst. We fitted the two spectra simultaneously in the energy range from 10 to 200 keV with an exponentially cut-off power law function defined as photons cm-2 s-1 keV-1.
A good fit was obtained with photon index , peak energy keV and flux erg cm-2 s-1 in the 10-200 keV range. For a burst duration of 0.42 s, this corresponds to a fluence of erg cm-2.
3 Results
Figure 2 shows the 1-s binned light curve of the second IFI+Iqueye observation. We performed a search for any significant increase in the count rate on the 1-s, 10-ms and 1-ms binned optical light curves around the time of the Fermi GBM burst.
We assume a Poisson distribution with the average rate of 2030 counts/s and fix a 3 detection threshold corresponding to a chance probability of in any of the bins during an interval of 90 s around T0. is the total number of bins in the interval and depends on the bin size. We obtain counts/bin for the 1-s, 10-ms and 1-ms binned light curves, respectively. No significant peak was detected above in any of the light curves (see Figure 3).
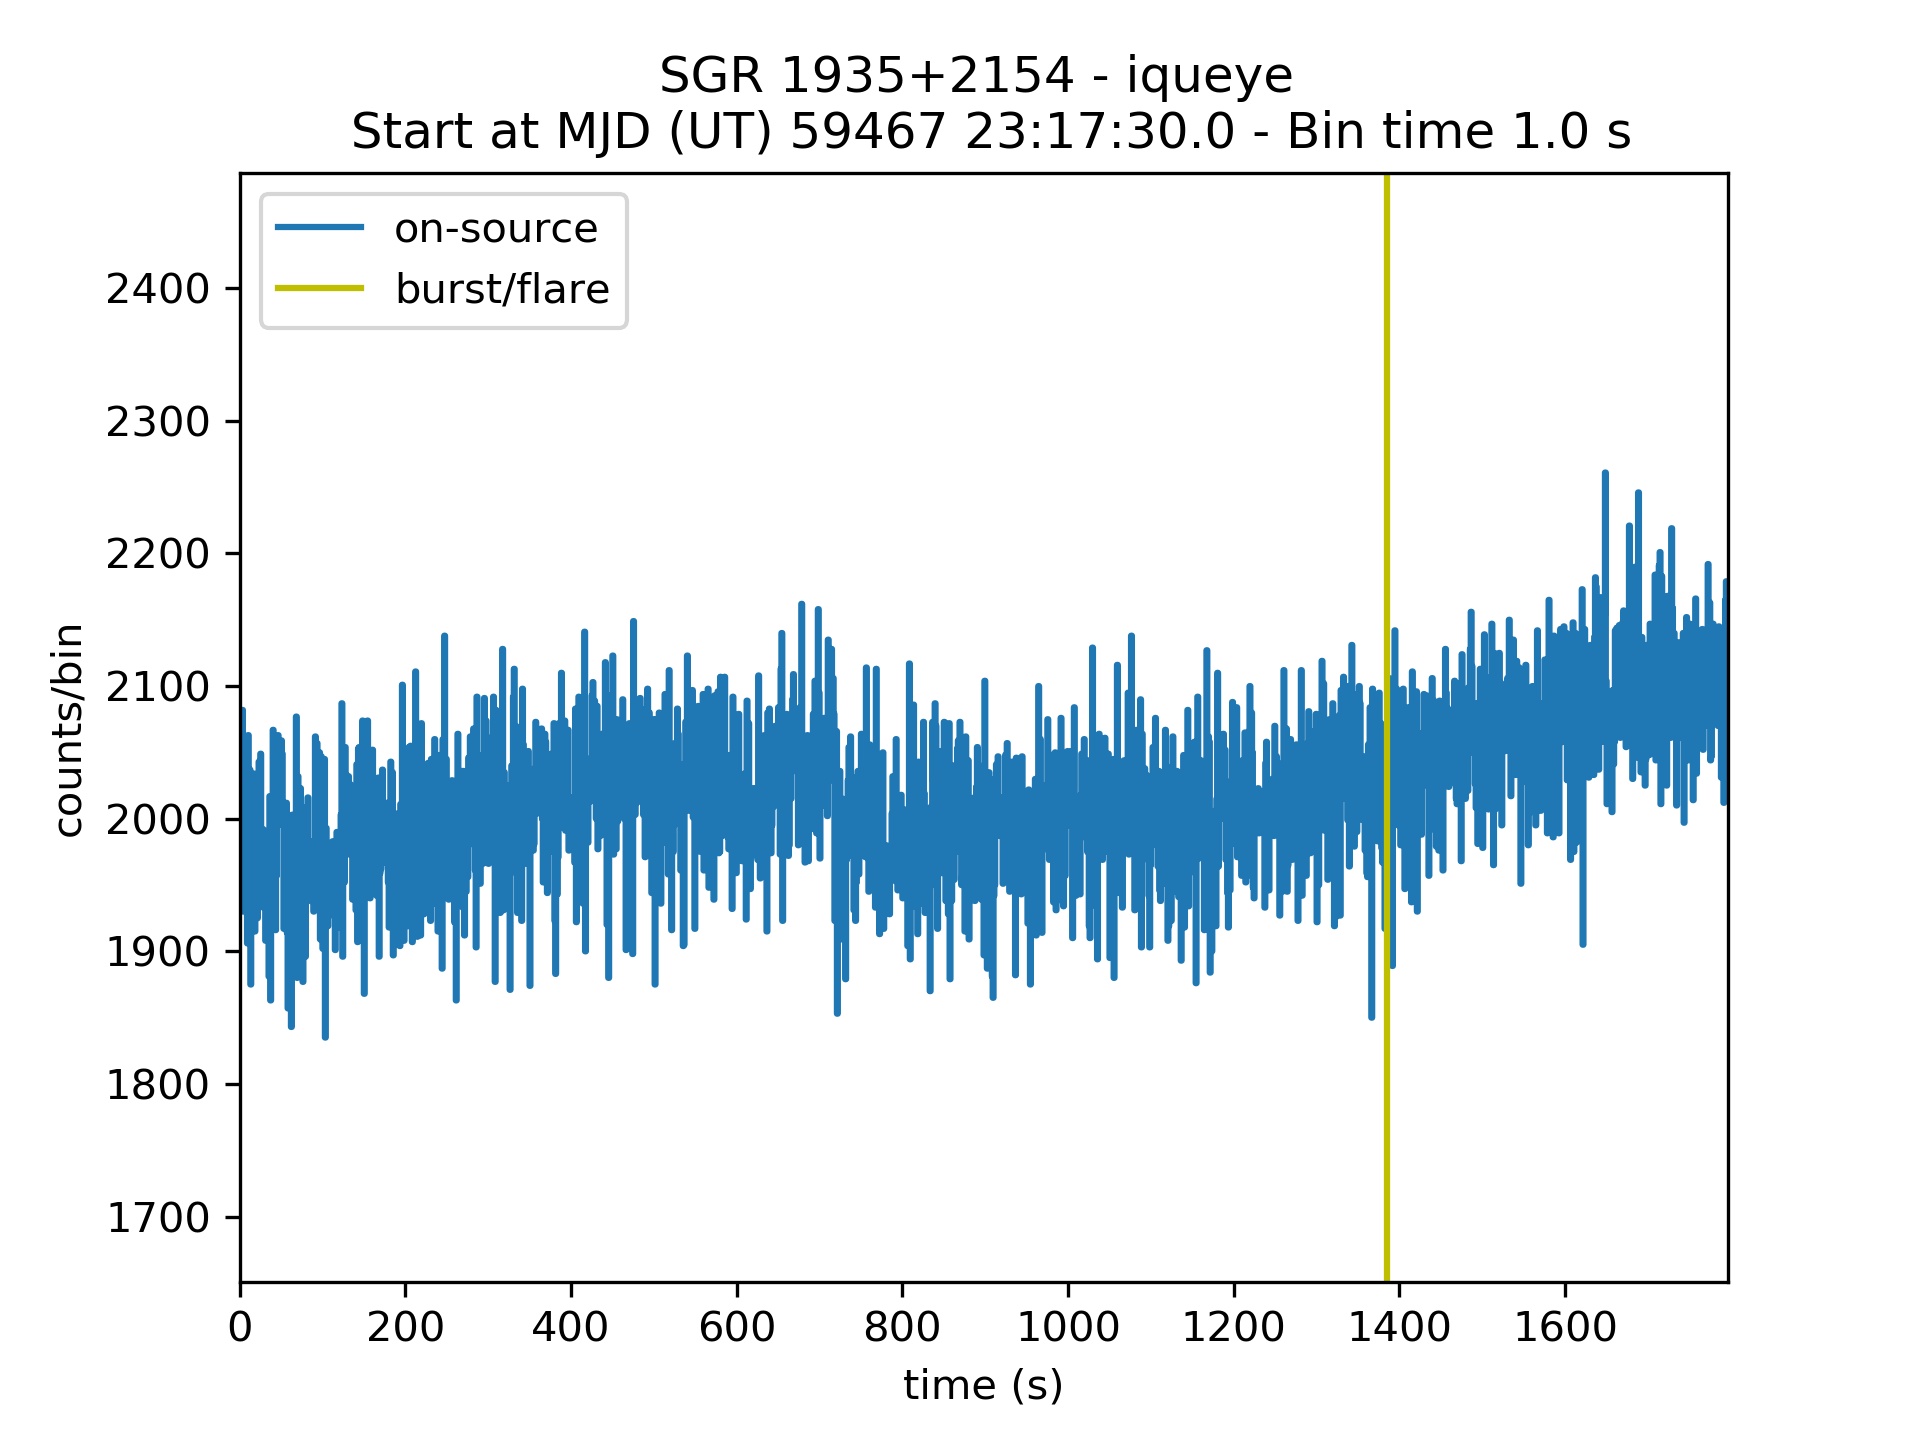
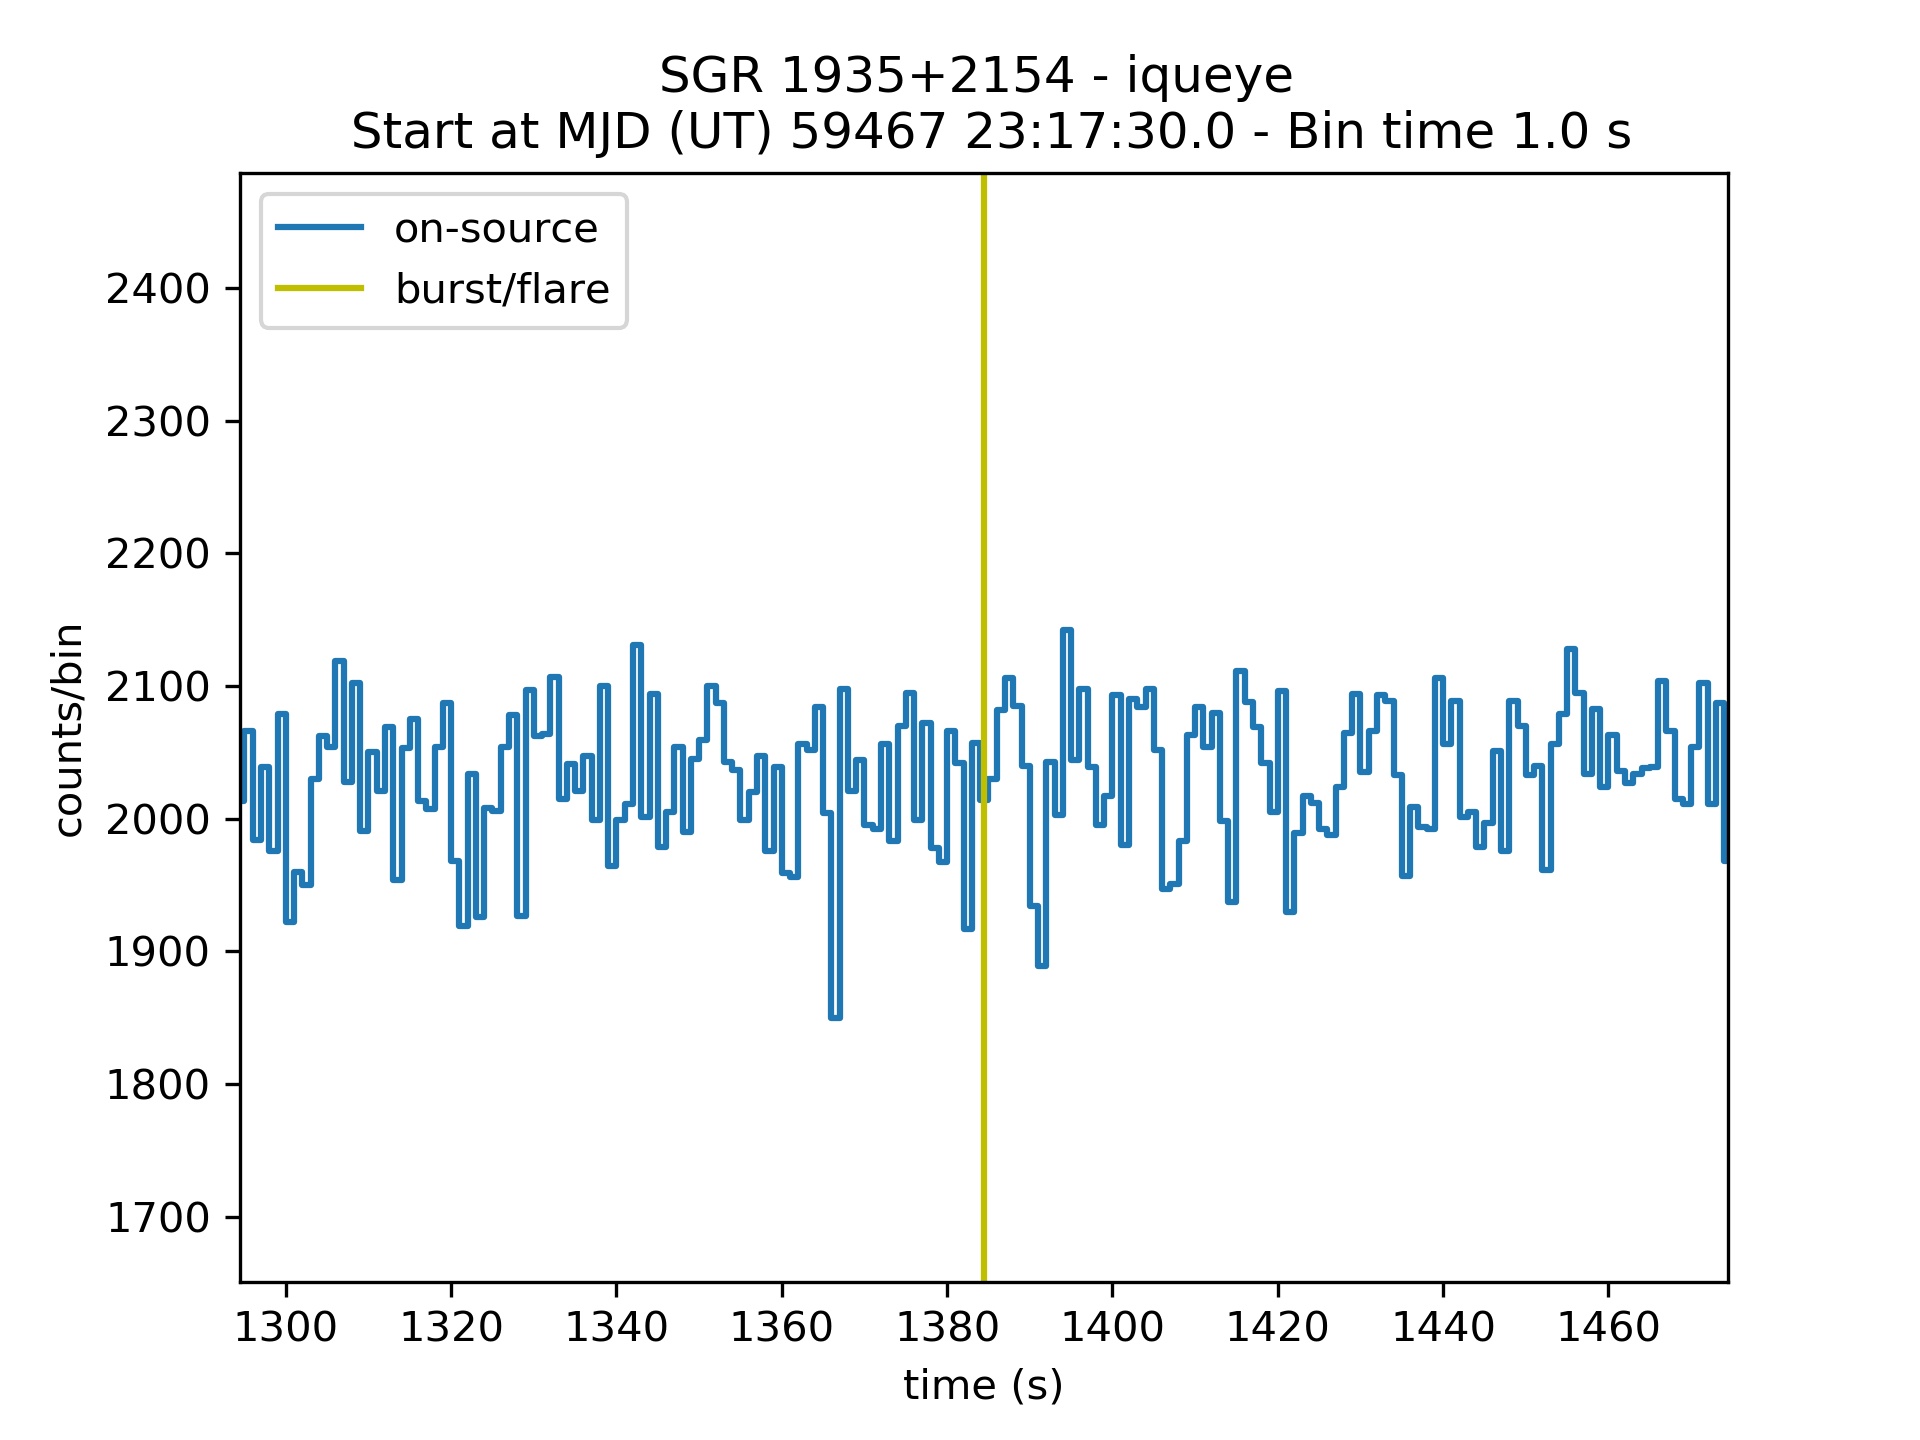
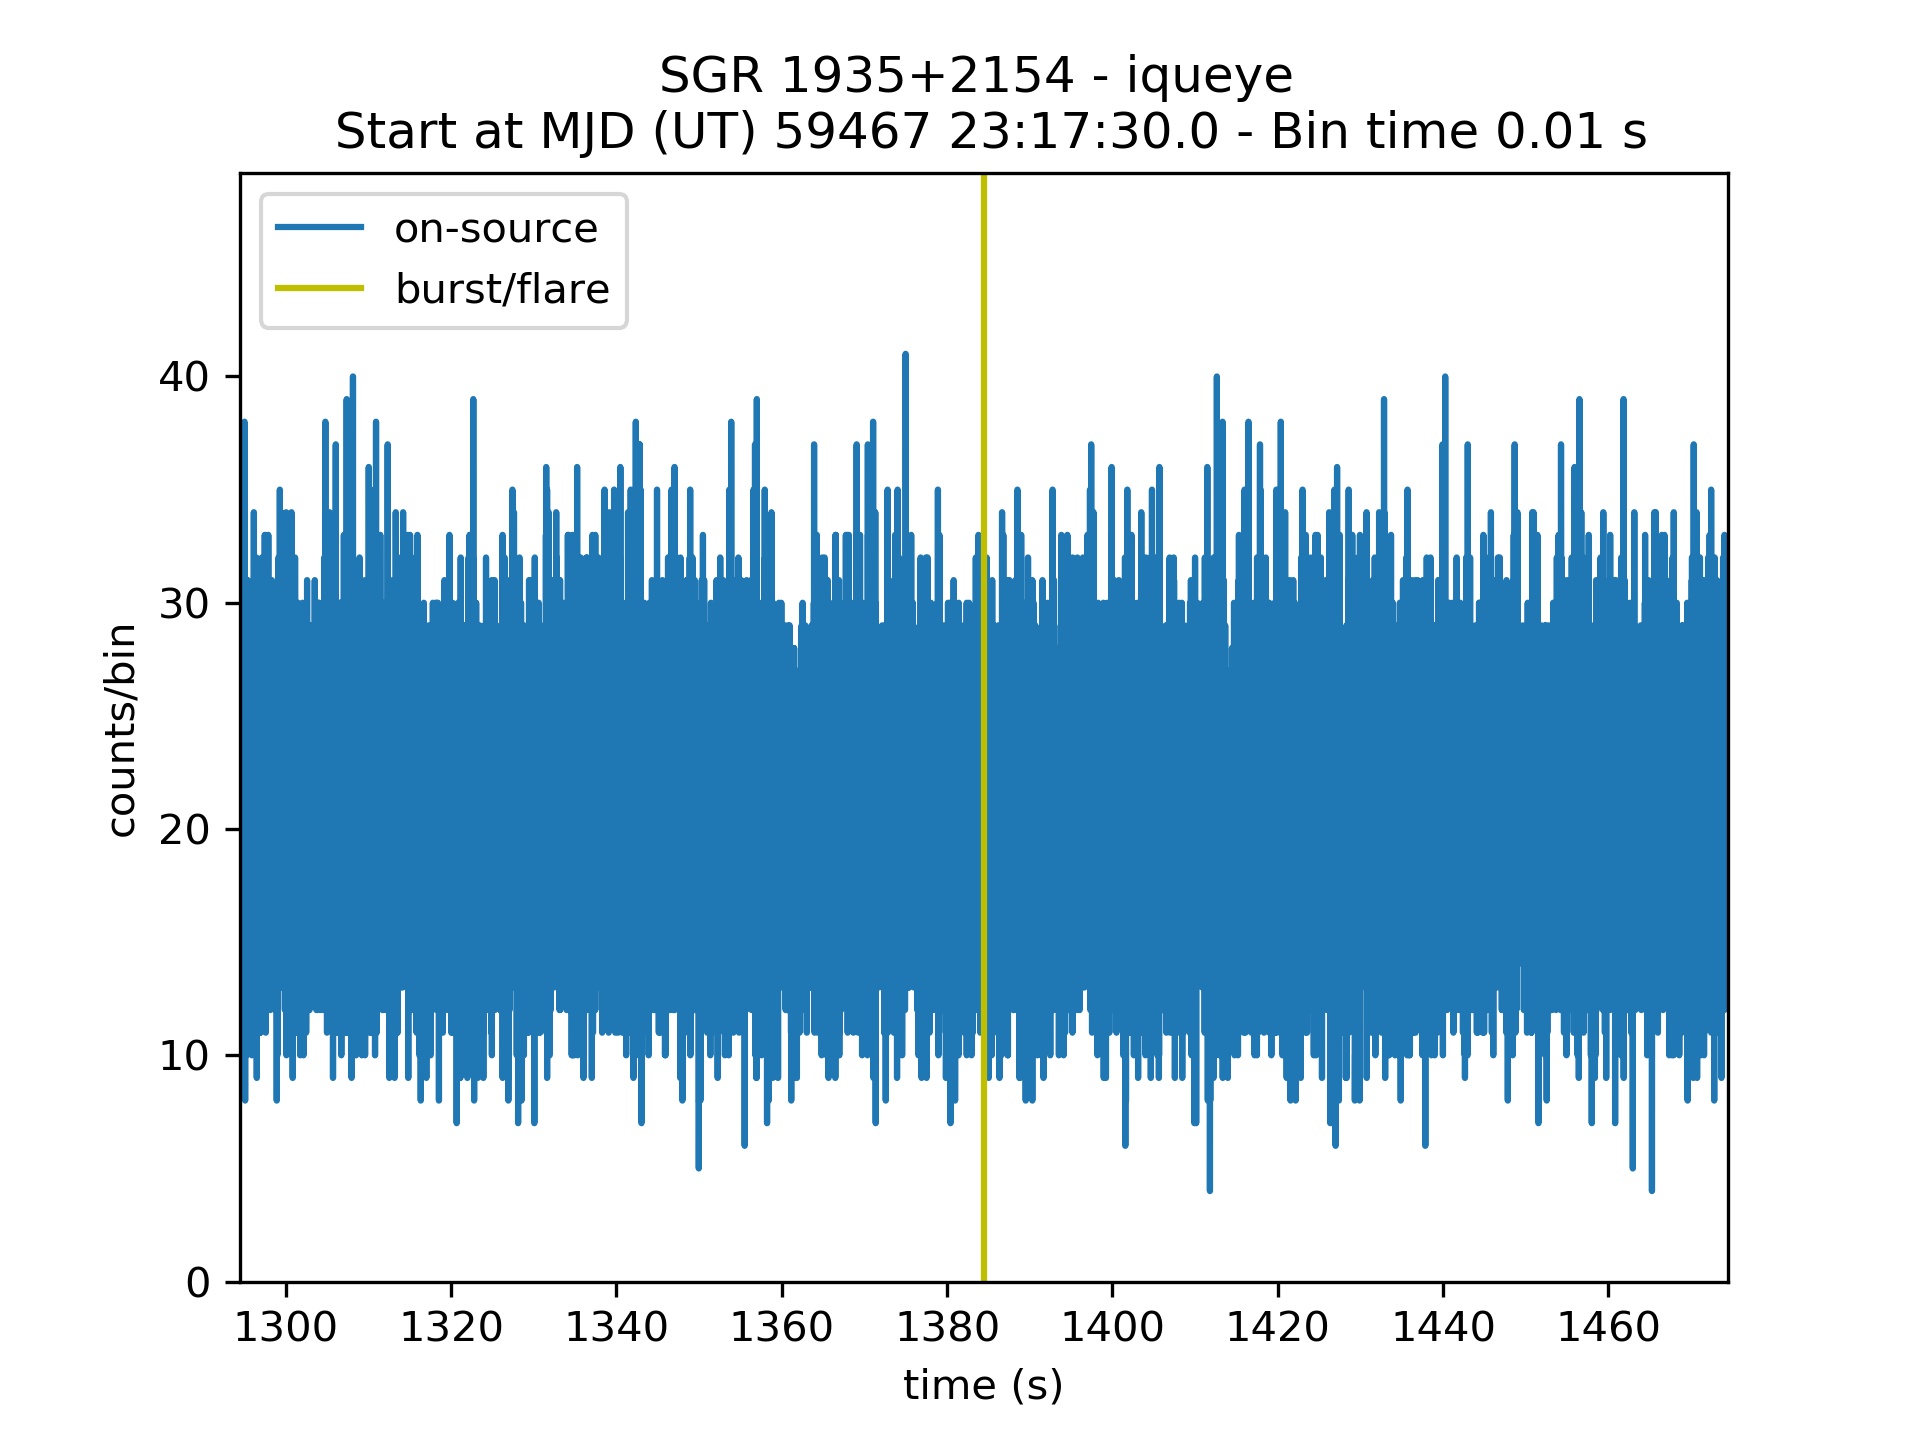
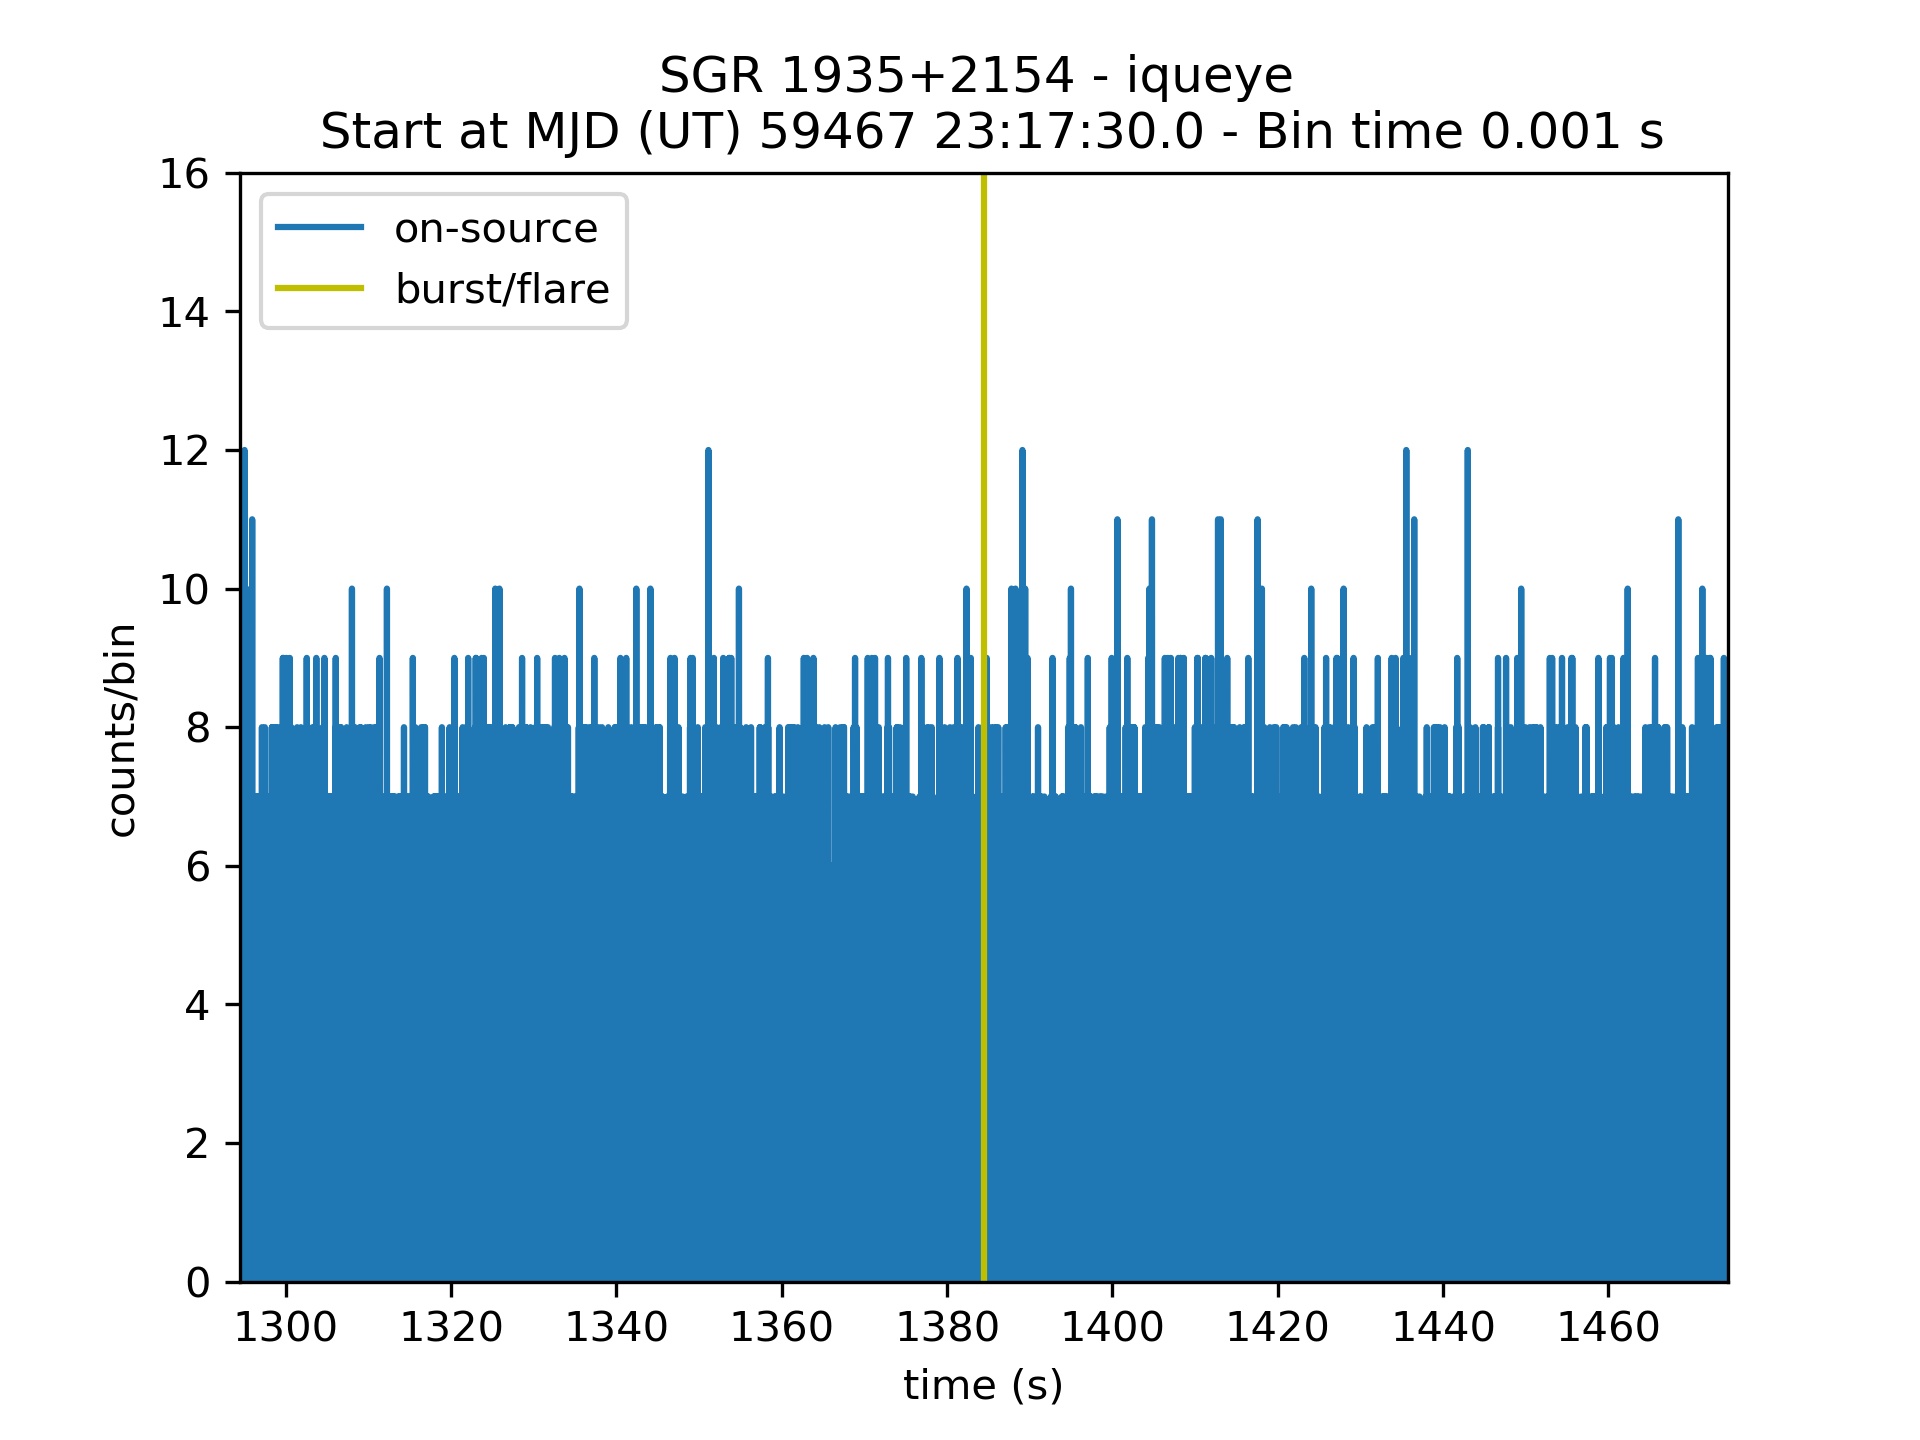
The highest peak in the 1-s binned light curve (2140 counts/bin) translates into an upper limit to the signal of 230 counts/bin at the 3 confidence level, after subtracting a rate per bin that has a high Poissonian probability (99.73%) to be exceeded by chance in a single bin (1910 counts/bin). Using the band calibration of IFI+Iqueye (Zampieri et al., 2016) and taking into account for the actual fiber-coupling efficiency at the time of the observation (59%), a value of 230 counts/bin corresponds to an average optical brightness over 1 s of mag. Similarly, for the 10-ms and 1-ms binned light curve, the upper limits to the signal in the same interval are 32 counts/bin and 12 counts/bin (3 c.l.), respectively, corresponding to an average optical brightness of mag and mag.
We performed also a blind search for any significant increase in the count rate of the 1-s binned light curves of all the IFI+Iqueye observations. During each observation the count rate changes significantly because the sky diffuse background light increases with decreasing altitude of the target. For this reason, the blind search was performed after removing the increasing-background trend from the data. The upper limits to the signal in the 1-s binned detrended light curves of the three observations are: 290 counts/bin for observation 20210911-002926, 320 counts/bin for observation 20210911-011727, 290 counts/bin for observation 20210911-014851. The corresponding limits to the optical magnitudes are: mag, mag and mag, respectively.
The limits reported above refer to the apparent magnitude and do not take into account the extinction along the line of sight that, for SGR 1935+2154, is significant. We estimate the optical extinction in the direction of SGR J1935+2154 using the interstellar dust maps reported in Green (2018)333http://argonaut.skymaps.info/, based on Pan-STARRS and 2MASS photometry and Gaia parallaxes of hundreds million stars (Green et al., 2019). Using these maps and the distance estimate reported in Mereghetti et al. (2020) ( kpc), we find a reddening . The variation of within most of the distance uncertainty range is small ( mag). Only for a distance larger than 7 kpc, close to the upper boundary, the reddening increases significantly (). From the transformation relations reported in Yuan et al. (2013), we finally derive a band extinction of mag. This value is smaller but consistent within the uncertainties with the value mag (De et al., 2020) inferred from the neutral hydrogen column density along the line of sight obtained from XMM-Newton spectral fittings (Israel et al., 2016), although the latter is more uncertain and model-dependent.
Correcting for an extinction mag, the IFI+Iqueye upper limits to any possible optical burst from SGR J1935+2154 in an interval of 90 s around T0 become mag for the 1-s binned light curve, mag for the 10-ms binned light curve, and mag for the 1-ms binned light curve. The corresponding extinction corrected upper limits to the fluence (specific fluence) are erg cm-2 (0.35 Jy s), erg cm-2 (4.8 Jy 10 ms), and erg cm-2 (17.9 Jy ms).
4 Discussion
The upper limits to the fluence of SGR J1935+2154 measured with IFI+Iqueye and the fluence of the simultaneous hard X-ray burst detected with the Fermi GBM are shown in Figure 4 as a function of frequency. For comparison, we also report the measurements of the fluence of the radio and X-ray burst detected on 2020 April 28 (CHIME/FRB Collaboration et al., 2020; Bochenek et al., 2020; Mereghetti et al., 2020), the fluence of two other X-ray bursts detected few days later (2020 May 2-5) with HXMT Lin et al. (2020b), and the X-ray de-absorbed fluence (Swift measurement, integrated over 1 s; Israel et al. 2016) of the quiescent (pre-outburst) counterpart of SGR J1935+2154.
We note that the radio to hard X-ray fluence ratio for the 2020 April 28 burst from SGR J1935+2154 is , while the limits for extragalactic FRBs imply a ratio (Nicastro et al. 2021; see also the limit of for the closest extragalactic FRB in M81, Mereghetti et al. 2021). Both on Apr 28 and May 2-5 there were simultaneous observations in the optical or near infrared bands at low time resolution (1 s or larger): with the BOOTES telescope (Lin et al., 2020b) the former and with the Palomar-Gattini telescope (De et al., 2020) the latter (see again Figure 4).
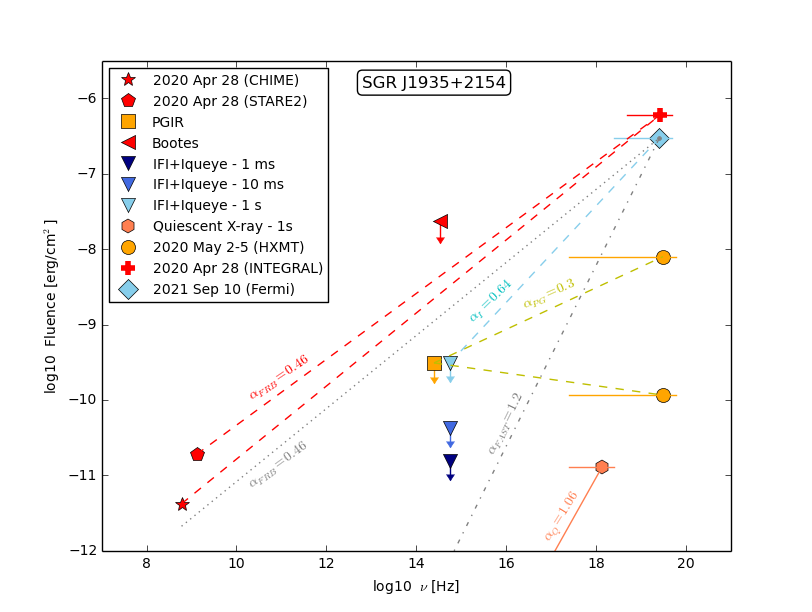
The results presented here appear to fit well within the framework of previous measurements and, at the same time, provide more stringent constraints on any possible optical impulsive counterpart to the SGR J1935+2154 bursts. Interestingly, the 2020 April 28 burst and that revealed with Fermi have comparable fluences. However, the 1-s IFI+Iqueye upper limit (extinction corrected) is two orders of magnitude deeper than the previous limit obtained with the BOOTES telescopes. We also note that the BOOTES limit was obtained with an integration time of 60 seconds. Our inferred limit to the optical to gamma-ray fluence ratio is . This value is consistent with the extinction-corrected fluence ratio observed in SGR J1935+2154 and other X-ray pulsars during long-term (days-weeks) correlated X-ray/near-infrared outbursts (, e.g. Levan et al. 2018).
The mechanism producing magnetar bursts is still debated. They can be associated to the fast acceleration of magnetospheric particles after spontaneous magnetic field reconnection (see Lyutikov 2003; Woods et al. 2005; see also Elenbaas et al. 2016), or to emission from a magnetically confined pair fireball, driven by the conversion into a hot, optically thick electron-positron plasma of large-amplitude magnetospheric oscillations (Thompson & Duncan, 1995, 2001). The spectral properties of the burst radiation have been investigated in some detail for the latter scenario, although a number of open issues still remain (Lyubarsky, 2002; Yang & Zhang, 2015; van Putten et al., 2016; Taverna & Turolla, 2017). Emission from the fireball itself is thermal, likely described by the superposition of two blackbodies, at an effective temperature of keV, in agreement with observations (see e.g. the analysis of the “burst forest” of SGR J1900+14 by Israel et al. 2008). Accordingly, no low-energy emission should be expected in a burst. However, energetic photons from the hot pair plasma heat the neutron star surface, ablating material which is then carried away in the form of a baryon-rich outflow, as first pointed out by Thompson & Duncan (2001) (see also van Putten et al. 2016), giving rise to a much more complicated picture.
It has been recently suggested that the ultrarelativistic blast wave produced by the interaction of the plasmoid ejected in a magnetar (giant) flare with the magnetar wind in the tail of a previous flare can result in an optical flash via (incoherent) synchrotron emission (Beloborodov, 2020; Chen et al., 2020). The energetics of the burst considered here is much below that of a giant flare, so it is unclear whether these considerations still hold. However, by applying to SGR J1935+2154 the scaling between the optical and the total energy released in the burst proposed by Beloborodov (2020), the expected optical fluence is – the high energy one, depending on the magnetization parameter of the wind. Our present upper limit, , would be still compatible with such a picture, possibly pointing to a somehow large magnetization.
The IFI+Iqueye measurement can also place a more stringent constraint to the spectral index of the optical to gamma-ray fluence of SGR J1935+2154. Assuming hereafter a single power-law dependence for the fluence , the index has to be larger than to be consistent with the optical non detection (see Figure 4). Interestingly, the optical limit lies above the extrapolation of the GBM spectral fit (for which , where ; see Sect. 2.2). While the Palomar-Gattini near infrared fluence limit is similar to that obtained with IFI+Iqueye, the simultaneous X-ray burst detected with HXMT was weaker than the Fermi one and the inferred limit on the slope of the fluence is less constraining (, De et al. 2020). Similarly, the BOOTES upper limit is not sufficiently deep to even rule out a single power-law with the spectral index calculated from the simultaneous radio-gamma-ray detections of FRB 200428 (). For comparison, we also report the fluence slope () of the counterpart of SGR J1935+2154, calculated using the de-absorbed pre-outburst Swift X-ray fluence ( erg cm-2, Israel et al. 2016) and the extinction corrected quiescent Hubble Space Telescope (HST) infrared fluence ( erg cm-2, Levan et al. 2018), both integrated over 1 s. For this purpose, we neglected the long timescale variability of the infrared source and considered only the dimmest reported measurement (Levan et al., 2018; Lyman et al., 2021). The fluence slope of the counterpart is somewhat steeper than the one that IFI+Iqueye can probe in the case optical outbursts of comparable magnitude accompany the X-ray bursts.
Evidence for a steep spectral index for some bursts was also reported by Lin et al. (2020b). They found that 29 bursts from SGR J1935+2154 detected with Fermi GBM were not simultaneously detected in the radio band with FAST. The inferred limit to the radio fluence for these bursts imply a rather steep spectral index for the radio to gamma-ray fluence (, Lin et al. 2020b) for the majority of the bursts from SGR J1935+2154. This fact led De et al. (2020) to conclude that the Palomar-Gattini near infrared measurements would not be sufficiently deep to detect possible counterparts of the majority of the bursts.
If we assume that there are two types of bursts in SGR J1935+2154, the rarer “2020 Apr 28”-type bursts and the more common “FAST”-type bursts, and that they are characterized by a single power-law dependence for the fluence, there are two important consequences for the reported measurements. First, the IFI+Iqueye non-detection of the Fermi Sep 10, 2021 burst is consistent with the “FAST”-type event, as the FAST limit on the fluence slope () is steeper than that from IFI+Iqueye () and hence the extrapolation of the FAST power-law dependence is expected to fall below the 1-s optical upper limit (dot-dashed line in Figure 4). Indeed, if the majority of the bursts from SGR J1935+2154 are of the “FAST”-type, they will not be detectable with IFI+Iqueye. Conversely, in the same assumptions, a smaller number of “2020 Apr 28”-type bursts, characterized by a much flatter radio-through-hard-X-ray slope (), are in principle detectable in the optical band with a simultaneous IFI+Iqueye observation, as the extrapolation of the power-law dependence for the 2020 Apr 28 fluence is above the 1-s IFI+Iqueye upper limit (dotted line in Figure 4). Therefore, future observations with fast photometers like IFI+Iqueye, simultaneous with “2020 Apr 28”-type radio+X-ray bursts, have the potential to yield an optical detection. Even if this type of bursts is rare, these findings represent a strong motivation for undertaking dedicated fast optical timing campaigns during future outburst episodes of SGR J1935+2154.
Finally, we note that, as shown in Figure 4, the IFI+Iqueye upper limit to the fluence for 10-ms and 1-ms optical bursts is a factor 7 and 20, respectively, deeper than that of the 1-s binned light curve. While these are not the typical durations of the bursts from SGR J1935+2154, in the future it will be interesting to investigate what limits can be derived by comparing the fluence of 1-10 ms substructures in the radio, X-ray and gamma-ray bursts with simultaneous fast optical timing observations on these (or even shorter) timescales.
References
- Astropy Collaboration et al. (2018) Astropy Collaboration, Price-Whelan, A. M., Sipőcz, B. M., et al. 2018, AJ, 156, 123. doi:10.3847/1538-3881/aabc4f
- Beloborodov (2020) Beloborodov, A. M. 2020, ApJ, 896, 142. doi:10.3847/1538-4357/ab83eb
- Bochenek et al. (2020) Bochenek, C. D., Ravi, V., Belov, K. V., et al. 2020, Nature, 587, 59. doi:10.1038/s41586-020-2872-x
- Borghese et al. (2020) Borghese, A., Coti Zelati, F., Rea, N., et al. 2020, ApJ, 902, L2. doi:10.3847/2041-8213/aba82a
- Chen et al. (2020) Chen, K.-J., Woosley, S. E., & Whalen, D. J. 2020, ApJ, 893, 99. doi:10.3847/1538-4357/ab7db0
- CHIME/FRB Collaboration et al. (2020) CHIME/FRB Collaboration, Andersen, B. C., Bandura, K. M., et al. 2020, Nature, 587, 54. doi:10.1038/s41586-020-2863-y
- De et al. (2020) De, K., Ashley, M. C. B., Andreoni, I., et al. 2020, ApJ, 901, L7. doi:10.3847/2041-8213/abb3c5
- Elenbaas et al. (2016) Elenbaas, C., Watts, A. L., Turolla, R., et al. 2016, MNRAS, 456, 3282. doi:10.1093/mnras/stv2860
- Ginsburg et al. (2019) Ginsburg, A., Sipőcz, B. M., Brasseur, C. E., et al. 2019, AJ, 157, 98. doi:10.3847/1538-3881/aafc33
- Green (2018) Green, G. M. 2018, The Journal of Open Source Software, 3, 695. doi:10.21105/joss.00695
- Green et al. (2019) Green, G. M., Schlafly, E., Zucker, C., et al. 2019, ApJ, 887, 93. doi:10.3847/1538-4357/ab5362
- Hunter (2007) Hunter, J. D. 2007, Computing in Science and Engineering, 9, 90. doi:10.1109/MCSE.2007.55
- Israel et al. (2008) Israel, G. L., Romano, P., Mangano, V., et al. 2008, ApJ, 685, 1114. doi:10.1086/590486
- Israel et al. (2016) Israel, G. L., Esposito, P., Rea, N., et al. 2016, MNRAS, 457, 3448. doi:10.1093/mnras/stw008
- Kaspi & Beloborodov (2017) Kaspi, V. M. & Beloborodov, A. M. 2017, ARA&A, 55, 261. doi:10.1146/annurev-astro-081915-023329
- Levan et al. (2018) Levan, A., Kouveliotou, C., & Fruchter, A. 2018, ApJ, 854, 161. doi:10.3847/1538-4357/aaa88d
- Lin et al. (2020a) Lin, L., Göğüş, E., Roberts, O. J., et al. 2020a, ApJ, 893, 156. doi:10.3847/1538-4357/ab818f
- Lin et al. (2020b) Lin, L., Zhang, C. F., Wang, P., et al. 2020b, Nature, 587, 63. doi:10.1038/s41586-020-2839-y
- Lyman et al. (2021) Lyman, J. D., Levan, A. J., Wiersema, K., et al. 2021, arXiv:2112.07023
- Lyubarsky (2002) Lyubarsky, Y. E. 2002, MNRAS, 332, 199. doi:10.1046/j.1365-8711.2002.05290.x
- Lyutikov (2003) Lyutikov, M. 2003, MNRAS, 346, 540. doi:10.1046/j.1365-2966.2003.07110.x
- Mereghetti et al. (2015) Mereghetti, S., Pons, J. A., & Melatos, A. 2015, Space Sci. Rev., 191, 315. doi:10.1007/s11214-015-0146-y
- Mereghetti et al. (2020) Mereghetti, S., Savchenko, V., Ferrigno, C., et al. 2020, ApJ, 898, L29. doi:10.3847/2041-8213/aba2cf
- Mereghetti et al. (2021) Mereghetti, S., Topinka, M., Rigoselli, M., et al. 2021, ApJ, 921, L3. doi:10.3847/2041-8213/ac2ee7
- Naletto et al. (2009) Naletto, G., Barbieri, C., Occhipinti, T., et al. 2009, A&A, 508, 531. doi:10.1051/0004-6361/200912862
- Nicastro et al. (2021) Nicastro, L., Guidorzi, C., Palazzi, E., et al. 2021, Universe, 7, 76. doi:10.3390/universe7030076
- Palmer et al. (2005) Palmer, D. M., Barthelmy, S., Gehrels, N., et al. 2005, Nature, 434, 1107. doi:10.1038/nature03525
- Pilia et al. (2020) Pilia, M., Burgay, M., Possenti, A., et al. 2020, ApJ, 896, L40. doi:10.3847/2041-8213/ab96c0
- Ridnaia et al. (2021) Ridnaia, A., Svinkin, D., Frederiks, D., et al. 2021, Nature Astronomy, 5, 372. doi:10.1038/s41550-020-01265-0
- Ridnaia et al. (2021) Ridnaia, A., Frederiks, D., Golenetskii, S., et al. 2021, GRB Coordinates Network, Circular Service, No. 30804, 30804
- Roberts et al. (2021) Roberts, O. J., Wood, J., & Fermi GBM Team 2021, GRB Coordinates Network, Circular Service, No. 30806, 30806
- Stamatikos et al. (2014) Stamatikos, M., Malesani, D., Page, K. L., et al. 2014, GRB Coordinates Network, Circular Service, No. 16520, #1 (2014), 16520
- Tang et al. (2021) Tang, Z., Zhang, S., Dai, S., et al. 2021, arXiv:2106.04821
- Tavani et al. (2021) Tavani, M., Casentini, C., Ursi, A., et al. 2021, Nature Astronomy, 5, 401. doi:10.1038/s41550-020-01276-x
- Taverna & Turolla (2017) Taverna, R. & Turolla, R. 2017, MNRAS, 469, 3610. doi:10.1093/mnras/stx1086
- Thompson & Duncan (1995) Thompson, C. & Duncan, R. C. 1995, MNRAS, 275, 255. doi:10.1093/mnras/275.2.255
- Thompson & Duncan (2001) Thompson, C. & Duncan, R. C. 2001, ApJ, 561, 980. doi:10.1086/323256
- Turolla et al. (2015) Turolla, R., Zane, S., & Watts, A. L. 2015, Reports on Progress in Physics, 78, 116901. doi:10.1088/0034-4885/78/11/116901
- Ursi et al. (2021) Ursi, A., Menegoni, E., Foffano, L., et al. 2021, GRB Coordinates Network, Circular Service, No. 30835, 30835
- van der Walt et al. (2011) van der Walt, S., Colbert, S. C., & Varoquaux, G. 2011, Computing in Science and Engineering, 13, 22. doi:10.1109/MCSE.2011.37
- van Putten et al. (2016) van Putten, T., Watts, A. L., Baring, M. G., et al. 2016, MNRAS, 461, 877. doi:10.1093/mnras/stw1279
- Woods et al. (2005) Woods, P. M., Kouveliotou, C., Gavriil, F. P., et al. 2005, ApJ, 629, 985. doi:10.1086/431476
- Xiao et al. (2021) Xiao, S., Xiong, S. L., Zhao, Y., et al. 2021, GRB Coordinates Network, Circular Service, No. 30793, 30793
- Yang & Zhang (2015) Yang, Y.-P. & Zhang, B. 2015, ApJ, 815, 45. doi:10.1088/0004-637X/815/1/45
- Yuan et al. (2013) Yuan, H. B., Liu, X. W., & Xiang, M. S. 2013, MNRAS, 430, 2188. doi:10.1093/mnras/stt039
- Zampieri et al. (2015) Zampieri, L., Naletto, G., Barbieri, C., et al. 2015, Proc. SPIE, 9504, 95040C. doi:10.1117/12.2179547
- Zampieri et al. (2016) Zampieri, L., Naletto, G., Barbieri, C., et al. 2016, Proc. SPIE, 9907, 99070N
- Zampieri et al. (2019) Zampieri, L., Naletto, G., Barbieri, C., et al. 2019, Contributions of the Astronomical Observatory Skalnate Pleso, 49, 85
- Zhou et al. (2020) Zhou, P., Zhou, X., Chen, Y., et al. 2020, ApJ, 905, 99. doi:10.3847/1538-4357/abc34a
- Zhu et al. (2020) Zhu, W., Wang, B., Zhou, D., et al. 2020, The Astronomer’s Telegram, 14084