[1]Jerzy Pryga
Analysis of capability of detection of extensive air showers by simple scintillator detectors
Abstract
One of the main objectives of the CREDO project is to search for so-called Cosmic-Ray Ensembles (CRE) [1]. To confirm the existence of such phenomena a massive scale observation of even relatively low energy Extensive Air Showers (EAS) and an analysis of their correlations in time must be performed. To make such observations possible, an infrastructure of widely spread detectors connected in a global network should be developed using low-cost devices capable of collecting data for a long period of time. For each of these detectors or small detector systems the probability of detection of an EAS has to be determined. Such information is crucial in the analysis and interpretation of collected data. In the case of large number of systems with different properties the standard approach based on detailed and extensive simulations is not possible, thus a faster method is developed. Knowing the characteristics of EAS from more general simulations any required probability is calculated using appropriate parameterization taking into account EAS spectrum, energy dependence of particle density and zenith angle dependence. This allows to estimate expected number of EAS events measured by a set of small detectors [2] and compare results of calculations with these measurements.
1 Introduction
The main motivation for this work is to provide helpful information about one of methods of detection of Extensive Air Showers (EAS) proposed for Cosmic Rays Extremely Distributed Observatory (CREDO) [1]. As the goal of this project, which is a search of cosmic rays ensembles, require monitoring of cosmic rays and EAS on a global scale, demand for a simple, cheap and reliable detector rises. One of proposed ideas is analysed in this work: several scintillator detectors connected in a coincidence system. When several devices give signal at almost the same time it indicates an occurrence of a cosmic ray cascade. Performed analysis aims to give answer if such very simple systems can be reliable and efficient enough to use in a bigger network of devices and collect useful data.
2 Analysis
2.1 Simulations
First step in the analysis was to perform shower simulations using CORSIKA software [3]. These data is later analysed to characterise density of particles form the shower on the ground as a function of cascade parameters. Currently simulations of protons as a primary particle are used, with 18 different energies starting from 1 TeV up to 4000 TeV. For now, no heavier nuclei were included but it is planned. For each energy 1000 to 20 000 cascades were simulated. To examine angular distribution of produced particles, simulations of cascades at several selected zenith angles with energy of 100 TeV were analysed.
2.2 Analysed system
Systems which are analysed in this work consists of several flat scintillator detectors connected in a coincidence. It is assumed that particles can be detected from all directions and different types of them can not be distinguished. Time interval in which two or more signals from different devices are considered a coincidence is called here coincidence time . Other properties of considered detectors are their area of the surface , efficiency and frequency of non cosmic background signals . All devices in the system are identical and are placed very close to each other. With those properties it is possible to analyse such systems in easy and relatively realistic way.
2.3 Background
Starting point in the analysis is to evaluate flux of background particles, and probability of fake signals i.e. not caused by EAS. In this work, term background means uncorrelated, single cosmic-rays which comes from all direction with constant flux indicated as .
For short measurement time the probability of a fake signal to happen is approximately:
| (1) |
After that, chance of coincidence signals is computed for system made of detectors. With probability of detection for each device equal it is denoted as and given by binomial distribution. Expected number of such events in the time of measurement is computed using following formula:
| (2) |
2.4 Signals from the cascades
Before starting any fitting or calculations some assumptions about EAS has to be taken. All showers are treated as circularly symmetrical and produced by protons. Because protons constitute about 78 % of primary cosmic rays, the spectrum for all cosmic-ray particles was used. Frequency of those protons is constant in time and indicated here as [4]. This function is obviously a model confirmed by various experiments [5].
The next step is to extract information from simulations. The easiest way to characterise EAS is by is particles density . In this work it is a function of parameters such as energy of primary particle , distance from its centre , zenith angle of primary particle approach direction and total number of produced particles . Each of these quantities were analysed more or less exhaustively and pre-defined functions were fitted to data.
Final function is a product of all this factors given by following formula:
| (3) |
-
•
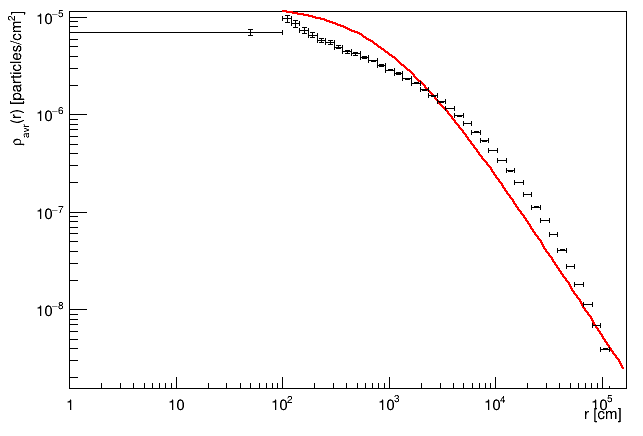
- The most important factor which represents relation between particle density and distance from the centre of the shower. This function is fitted for certain vertical cascade of chosen energy to which other factors are normalised. Figure 1 presents shape of this function.
(a) 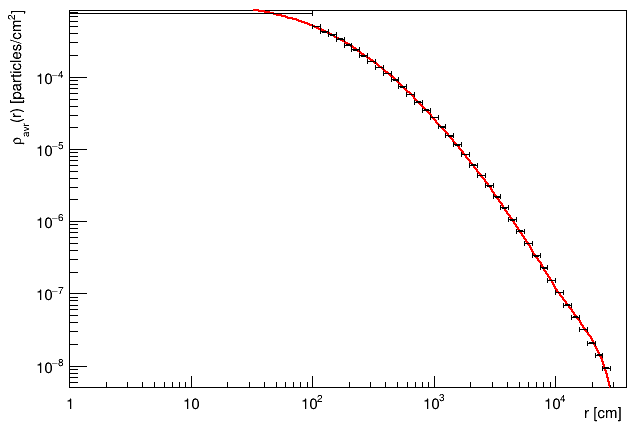
(b) Figure 1: function fitted to data for 1(a) muons and 1(b) photons. -
•
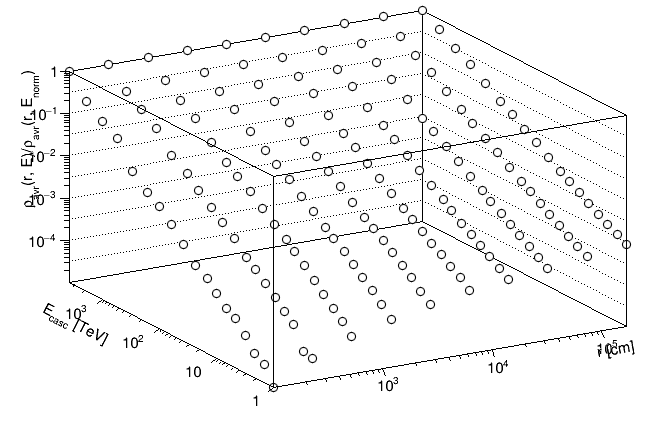
- This factor scales the density with different energy and modifies its distance distribution. It is presented on figure 2.
(a) 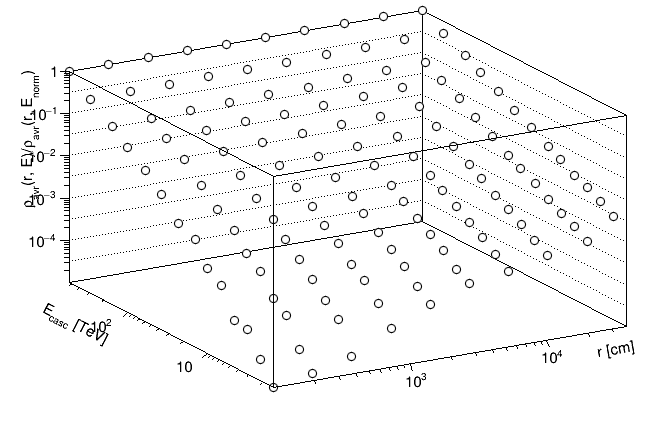
(b) Figure 2: Graph of for 2(a) muons and 2(b) photons. -
•
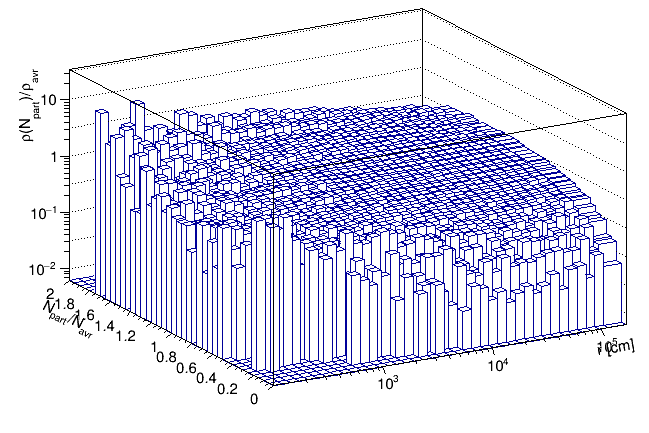
- Scales the density and its distance distribution as total number of produced particles changes. Their amount is strongly connected with the altitude at which the cascade started to form, but is a more convenient parameter to work with. It must be mentioned that their form vary for different particle types and currently for electromagnetic component of the showers factor is just a linear proportion of without dependence on distance . It is presented in Figure 3.
(a) 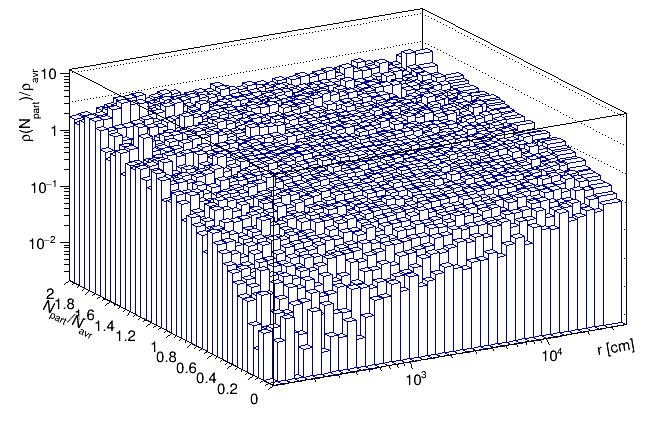
(b) Figure 3: Histograms of for 3(a) muons and 3(b) photons. -
•
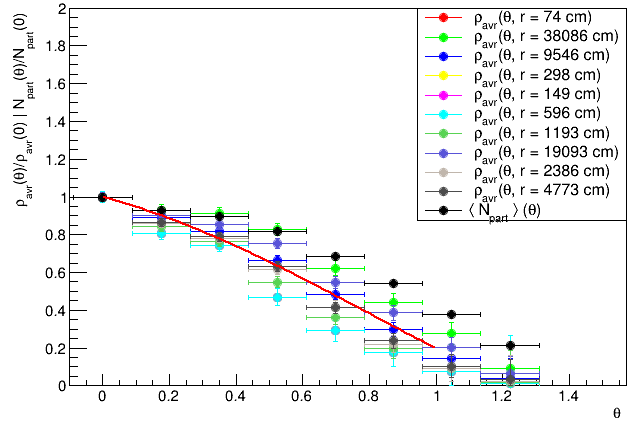
- This factor scales the density as zenith angle of primary particle approach direction changes. Here a simplification was made. Namely, the shape of shower footprint is not circularly symmetrical as this angle increase. However, EAS comes from all directions with equal probability thus this effect can be neglected. Figure 4 presents its shape.
(a) 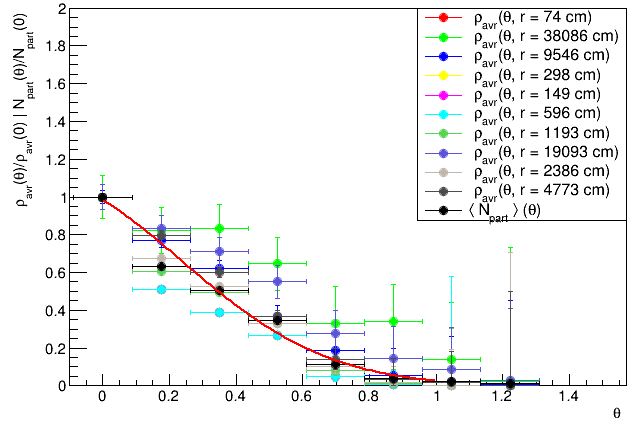
(b) Figure 4: function fitted to data for 4(a) muons and 4(b) photons.
Next step is to calculate probability of a signal to happen when there is a cascade near the detector. Formula for a single signal probability is as follows:
| (4) |
There is also another effect in the cascades that could have impact on the probability of coincidence signals. It is currently under investigation, but early results suggest that when one particle that originates from the shower is detected, then probability of finding another one in close region of such event should increase be higher than it results from particles density function. This "clustering" effect could be most likely explained by fact, that particles in the shower are produced in at least pairs. Thus, when originating not very high in the atmosphere they should hit the ground close to each other as they may not have time to travel further. In this work this results are included in calculations. The function which scale the probability of multiple signals is a function of particles density and it impacts signals of 2 and more coincidences.
To evaluate expected number of events caused by EAS an integration over all energies of primary particles, area around the devices and spherical angle of the sky must be performed. Obviously, assumption that cascades are circularly symmetrical reduces integral over horizontal angle to the factor of . Formula below shows how it is computed:
| (5) |
During numerical integration the number of produced particles in cascades was chosen randomly according to distributions found earlier. Examples of those are presented in figure 5.
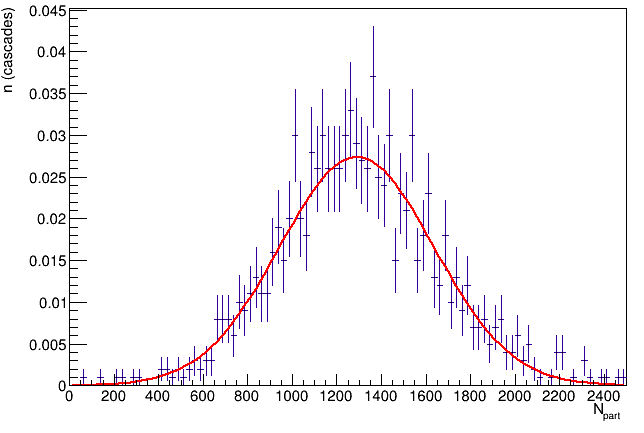
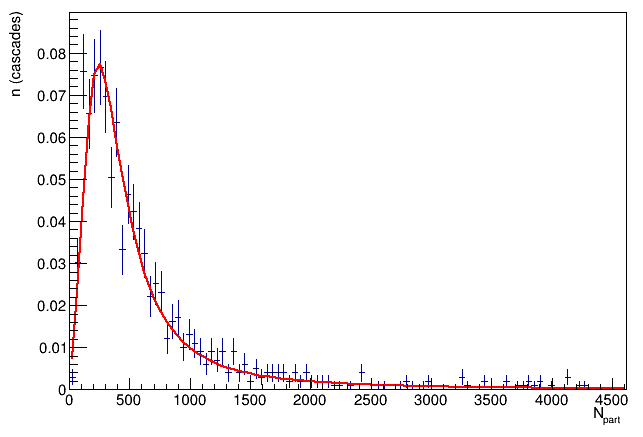
Of course the integration must be performed in certain limits, thus the primary cosmic-rays energy range and maximal distance from the shower must be chosen. Integration up to over zenith angle is obvious as it was assumed that particles from all directions can be detected. Criteria of choice of the maximal distance may be different and in this work three were considered. First one was a radius in which percent of particles produced by the cascade are included . Another one is a radius in which shower particles density is greater than the average background . Last one was just a fixed value , chosen in a way that cuts off the region in which particles density is relatively low. First two of those quantities were analysed and characterised as a function of energy of primary particle.
3 Comparison with simpler method
To check if the performed analysis was done right another approach to the problem was tested. As muons have been studied for many years, an approximate function for its density on the ground level can be found in the literature [5]. It depends on total number of produced muons, which is a function of the energy of primary particle, and distance from the centre of the shower. This was also used for electromagnetic component of the cascades, however this extrapolation is very rough as electrons and photons in EAS behave very differently from muons. Thus, used formula is as follows:
| (6) |
Where and further steps in the analysis are the same as described in 2.4. This comparison should help to judge if analysis described earlier, which is more general and gives more information about the behaviour of the system, is reasonable and does not consist any unrealistic assumptions.
4 Results
Finally, in this sections results of above analysis calculated for exemplary system are presented. Assumed properties of considered system are as follows. It is a system built of 4 devices, namely Cosmic Watches [6] which surface area is for each one. Coincidence time is set to and efficiency of every device is . Particles that gives signal are muons, electrons, positrons and photons which energy is greater than . The choice of above parameters are not arbitrary. They are meant to be the same as in the system tested by prof. Tadeusz Wibig in his work [2], thus the time of measurement has to be taken equal to this in the performed experiment which is days. However, there are some uncertainties like which particles really gives signal as well as efficiency and , here chosen arbitrary.
Assumptions described earlier imply that the flux of background particles should be around . Frequency of non cosmic background noise was chosen to be .
To perform final results also integration limits had to be chosen. Reasonable choice of energy limits was range between and , as less energetic particles almost does not produce cascades and more energetic are very unlikely to occur in such measurement time. Maximal distance from the system in which showers were considered was described in 2.4.
Because chronically first assumptions was that only muons should give signal also this case is presented here to show the difference in final results that yields from such changes in assumptions. After carrying all steps of the analysis the results are as follows:
| Background | Analysis | Simpler method | Measurement | ||||
|---|---|---|---|---|---|---|---|
| Only | , , | Only | , , | Only | , , | ||
| 1 | - | ||||||
| 2 | 94 | ||||||
| 3 | 2 | ||||||
| 4 | 1 | ||||||
As presented in table 1, measured number of events lay somewhere between results of calculations which considered only muons and those that included also electromagnetic component. Additional information about the measurement is that it was held on the windowsill, which when assuming that electromagnetic component of EAS can pass only through the window could be taken into account in calculations. Considering that only of cascades for which contribute and to density, the results are as follows:
| 2 | ||||
| 3 | ||||
| 4 |
.
5 Summary
There are several important conclusions that can be made from presented results. As expected the average number of coincidence signals caused by EAS is significantly higher than for the background. Thus, the level of confidence that certain event indicates occurrence of the cascade in a close surrounding of the system should be high. Assuming that only muons give signal is clearly wrong, however not all electrons and photons should be able do it as well. It must be clarified at which energy particles of each type give signal. Possibly the electromagnetic component of the showers is blocked in the structure of the building but more measurements in different conditions have to be performed. There are still many significant assumptions and simplifications like treating all showers as originating from protons while heavier nuclei should contribute differently to the results. Background and effects like particles production in the upper layers of the building are also poorly understood and require more study. Therefore, one should treat presented results with caution.
According to this analysis, this method of detection could even provide some clues about primary energy of detected shower, which is easy to see when the expected number of events for different number of coincidence signals is plotted over energy spectrum:
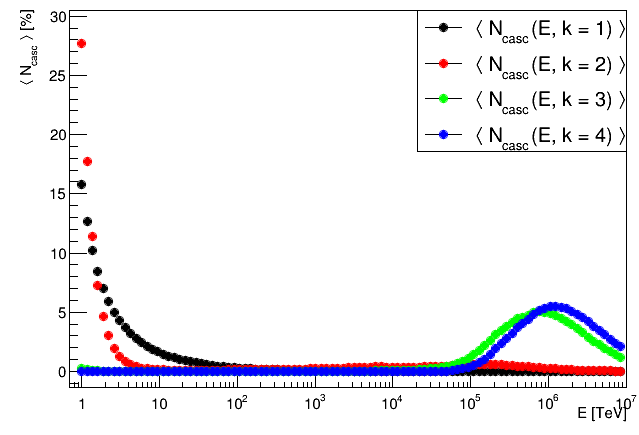
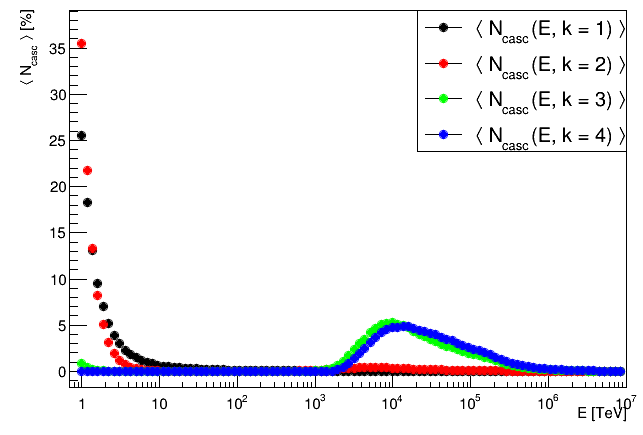
Future development of this work will include more groups of heavier primary nuclei and different energy thresholds of individual components of the showers hopefully compared with more measurements.
References
- [1] P. Homola, D. Beznosko, G. Bhatta, Ł. Bibrzycki, M. Borczyńska, Ł. Bratek et al., Cosmic-ray extremely distributed observatory, Symmetry 12 (2020) 1835.
- [2] M. Karbowiak, T. Wibig, D. Alvarez-Castillo, D. Beznosko, A.R. Duffy, D. Góra et al., The first CREDO registration of extensive air shower, Physics Education 55 (2020) 055021.
- [3] D. Heck, G. Schatz, J. Knapp, T. Thouw and J. Capdevielle, Corsika: A monte carlo code to simulate extensive air showers, Tech. Rep. (1998).
- [4] M. Aartsen, R. Abbasi, Y. Abdou, M. Ackermann, J. Adams, J. Aguilar et al., Measurement of the cosmic ray energy spectrum with icetop-73, Physical Review D 88 (2013) 042004.
- [5] P.D. Group et al., Review of particle physics, The European Physical Journal C-Particles and Fields 3 (1998) 1.
- [6] S.N. Axani, K. Frankiewicz and J.M. Conrad, The cosmicwatch desktop muon detector: a self-contained, pocket sized particle detector, Journal of Instrumentation 13 (2018) P03019.
Full Authors List: CREDO Collaboration
Jerzy Pryga1,
Weronika Stanek2,
Piotr Homola3,
Tadeusz Wibig19,
Oleksandr Sushchov3,
Peter Kovacs8,
Vahab Nazari17,3,
Jilberto Zamora-Saa20,
Dmitriy Beznosko3,
Mikhail V. Medvedev10,11,
Jarosław Stasielak3,
Bartosz Łozowski9,
Nikolai Budnev4,
Alok C. Gupta5,
Arman Tursunov18,
Karel Smolek16,
Bohdan Hnatyk6,
David E. Alvarez Castillo3,17,
Katarzyna Smelcerz12,
Alona Mozgova6,
Michał Niedźwiecki12,
Marcin Kasztelan7,
Matías Rosas15,
Krzysztof Rzecki2,
Sławomir Stuglik3.
1Jagiellonian University, Gołębia 24, 31-007 Kraków.
2AGH University of Science and Technology, Mickiewicz Ave., 30-059 Kraków, Poland.
3Institute of Nuclear Physics Polish Academy of Sciences, Radzikowskiego 152, 31-342 Kraków, Poland.
4Irkutsk State University, Russia.
5Aryabhatta Research Institue of Observational Sciences (ARIES), Manora Peak, Nainital 263001, India.
6Astronomical Observatory of Taras Shevchenko National University of Kyiv, 04053 Kyiv, Ukraine.
7National Centre for Nuclear Research, Andrzeja Soltana 7, 05-400 Otwock-Świerk, Poland.
8Institute for Particle and Nuclear Physics, Wigner Research Centre for Physics, 1121 Budapest, Konkoly-Thege Miklós út 29-33, Hungary.
9Faculty of Natural Sciences, University of Silesia in Katowice, Bankowa 9, 40-007 Katowice, Poland.
10Department of Physics and Astronomy, University of Kansas, Lawrence, KS 66045, USA.
11Laboratory for Nuclear Science, Massachusetts Institute of Technology, Cambridge, MA 02139, USA.
12Department of Computer Science, Faculty of Computer Science and Telecommunications, Cracow University of Technology, Warszawska 24, 31-155 Kraków, Poland.
13ACC Cyfronet AGH-UST, 30-950 Kraków, Poland.
14Clayton State University, Morrow, Georgia, USA.
15Liceo 6 Francisco Bauzá, Montevideo, Uruguay.
16Institute of Experimental and Applied Physics, Czech Technical University in Prague.
17Joint Institute for Nuclear Research, Dubna, 141980 Russia.
18Research Centre for Theoretical Physics and Astrophysics, Institute of Physics, Silesian University in Opava, Bezručovo nám. 13, CZ-74601 Opava, Czech Republic.
19University of Łódź, Faculty of Physics and Applied Informatics, 90-236 Łódź, Pomorska 149/153, Poland.
20 Universidad Andres Bello, Departamento de Ciencias Fisicas, Facultad de Ciencias Exactas, Avenida Republica 498, Santiago, Chile.