Few-femtosecond resolved imaging of laser-driven nanoplasma expansion
Abstract
The free expansion of a planar plasma surface is a fundamental non-equilibrium process relevant for various fields but as-yet experimentally still difficult to capture. The significance of the associated spatiotemporal plasma motion ranges from astrophysics and controlled fusion to laser machining, surface high-harmonic generation, plasma mirrors, and laser-driven particle acceleration. Here, we show that x-ray coherent diffractive imaging can surpass existing approaches and enables the quantitative real-time analysis of the sudden free expansion of laser-heated nanoplasmas. For laser-ionized SiO2 nanospheres, we resolve the formation of the emerging nearly self-similar plasma profile evolution and expose the so far inaccessible shell-wise expansion dynamics including the associated startup delay and rarefaction front velocity. Our results establish time-resolved diffractive imaging as an accurate quantitative diagnostic platform for tracing and characterizing plasma expansion and indicate the possibility to resolve various laser-driven processes including shock formation and wave-breaking phenomena with unprecedented resolution.
Keywords: coherent diffractive imaging, plasma expansion, laser nanoparticle interaction
1 Introduction
The sudden free expansion of a plasma with an initially sharp density step is a key model process for astrophysical flows [1], fusion pellet ablation [2, 3], and plasma dynamics initiated by discharges [4] or wire explosions [5, 6]. Especially the occurrence and structure of expansion modes with self-similar density evolution [7] has been subject of vivid debate and intense analytical and numerical analysis [8, 9, 10, 11]. The significance of free plasma expansion culminates in the realm of intense laser-matter interactions at surfaces due to its central role for laser-driven monoenergetic ion beam generation [12, 13], vacuum acceleration of electrons [14], high-harmonic generation through relativistic oscillating mirrors [15, 16, 17] or coherent wake emission [18, 19], and pulse cleaning via transient plasma mirrors [20]. In all these cases, the plasma density profile at the surface is a pivotal element or critical control parameter for the main process. Moreover, access to the surface expansion speed of isochorically heated plasmas enables characterization of thermophysical properties of warm dense matter [21, 22], underlining the far-reaching implications of an accurate characterization and understanding of plasma profile and expansion velocity dynamics.
Established approaches for the experimental charactization of laser-induced plasma expansion include shadowgraphy and fluorescence imaging [21, 23], optical interferometry [24], Doppler spectroscopy [25], and proton imaging [26], each with its specific merits. However, for the complete characterization of the microscopic expansion process including the formation and evolution of self-similar expansion modes, simultaneous resolution of density and velocity profiles on nanometer spatial and femtosecond temporal scales or even beyond is essential, which exceeds current capabilities and is so far restricted to simulations.
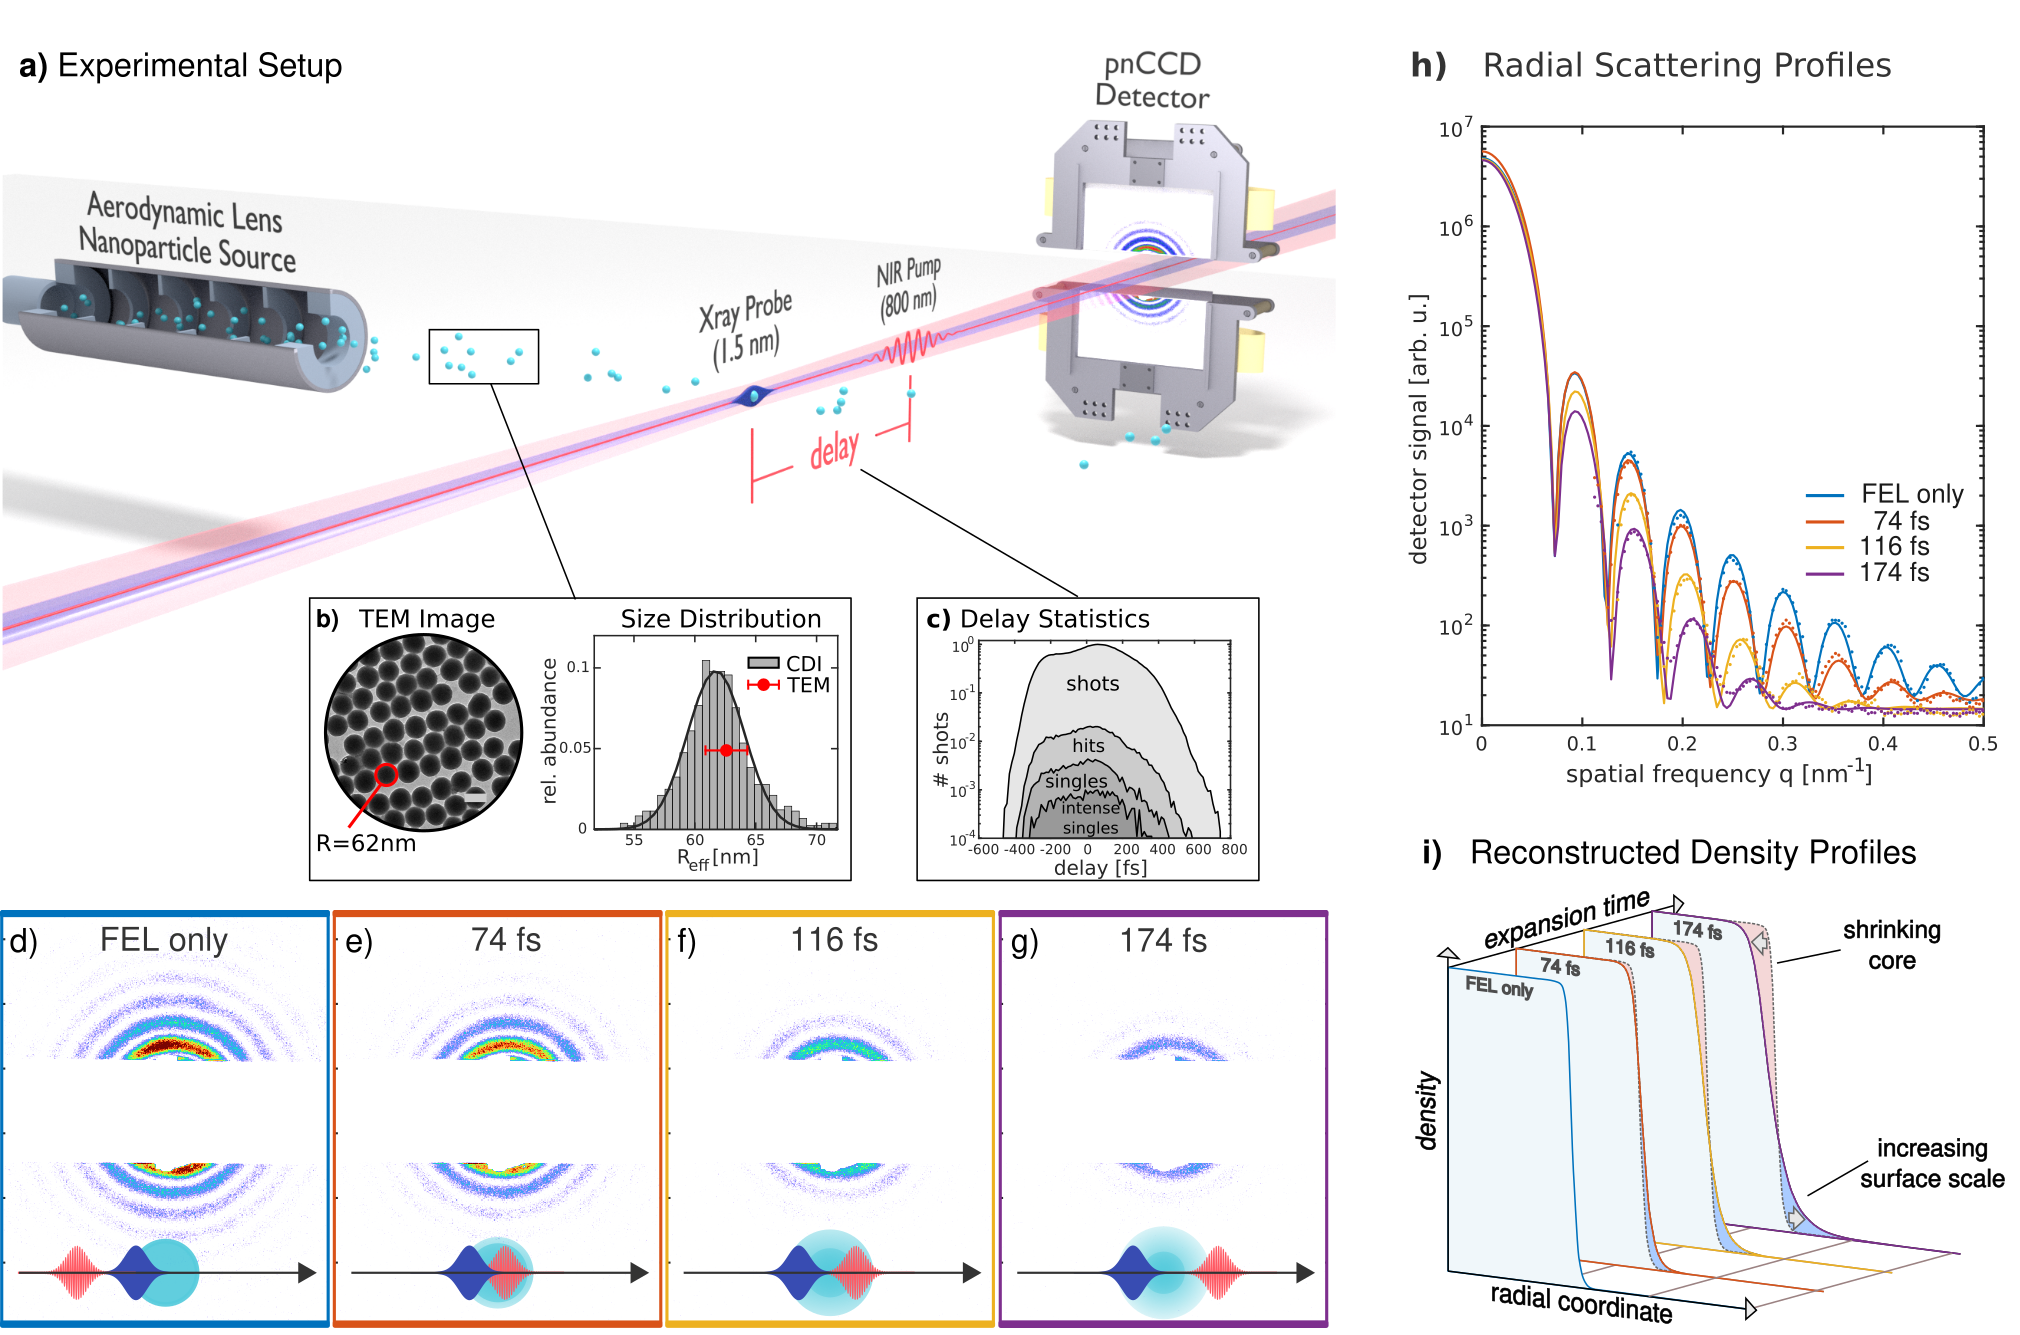
An emerging alternative towards ultrafast and accurate tracing of plasma dynamics is time-resolved coherent diffractive imaging of laser-driven free nanoparticles using x-ray free electron lasers (XFEL) [27]. Complete atomistic pump-probe simulations of ultrafast near-infrared (NIR) laser-driven ionization and heating of hydrogen nanospheres have predicted the rapid formation of a nearly self-similar expansion mode for the initially step-like density profile [28]. The main short-term dynamics is predicted to unfold within few femtoseconds and includes an inward-motion of the rarefaction front expressed by a decreasing radius of the dense plasma core, an increasing softness of the density edge, and the spreading of the expanding surface layer that maintains a density profile with an asymptotically exponential radial decay. Most importantly, a direct mapping between x-ray scattering patterns and the associated plasma profile parameters has been identified for nearly spherical particles, promising the experimental characterization of the density profile evolution with high spatial and temporal resolution.
In a pioneering study, Gorkhover et al. demonstrated a substantial expansion of the surface layer of laser-heated Xe clusters on the few hundred fs time scale [29] by analyzing the evolution of the angular decay of the ring-shaped diffraction fringes. Wide-angle Bragg scattering with hard XFEL pulses can yield insights into the dynamics of strongly pumped nanoplasmas [30], indicating that the loss of order proceeds from the surface to the inner core of the cluster [31]. These results reflect a natural extension of previous successful studies on ultrafast structural changes associated with non-thermal heating and nonequilibrium phase transitions via time-resolved Bragg scattering at surfaces [32, 33]. Diffraction experiments on laser-driven metal gratings further support high sensitivity of scattering patterns to the ultrafast density profile evolution at the surface [34]. However, the envisaged complete tracing of the laser-induced plasma expansion has so far remained a challenge as it requires the combination of (i) accurate knowledge of the target’s initial size and shape, (ii) an unambigous profile reconstruction based on an appropriate few-parameter profile model, (iii) precise single-shot pulse timing to remedy the otherwise pathological time jitter of free-electron laser sources when operated in self-amplified spontaneous emission (SASE) mode, and (iv) a sufficently large dataset to trace the profile evolution systematically.
Here, we report simultaneous realization of all the above prerequisites and demonstrate quantitative time-resolved imaging of laser-induced nanoplasma expansion. The NIR pump x-ray diffraction probe experiment was performed for isolated SiO2 nanospheres at the Linac Coherent Light Source (LCLS) at SLAC and exposes the density profile evolution with unprecedented temporal and spatial resolution. Moreover, our analysis provides access to the so far inaccessible shell-resolved expansion startup delay and velocity buildup as well as the associated rarefaction front velocity. These results define not only a critcal benchmark for theory but also enable the systematic study of the impact of laser characteristics and material properties on the ultrafast formation and relaxation of laser-driven nanoplasmas.
2 Experiment
The measurement was performed at the AMO hutch of LCLS using the LAMP multipurpose endstation, see schematic setup in Fig. 1(a). The beam of SiO2 nanospheres with narrow distribution of size (62 nm mean radius, see Appendix A) and deformation crossed the optical axis of the collinear NIR and x-ray pulses. For the employed 50 fs NIR pulses at 800 nm central wavelength and peak intensity 81014Wcm-2 (see Appendix B), strong and nearly homogeneous ionization of the resulting nanoplasma to atomic charge states up to is expected [28, 35]. The single-shots scattering images resulting from the temporally synchronized illumination of the particles with 40 fs x-ray pulses at 800 eV photon energy are recorded with two rectangular pnCCD detector panels [36] that were covered by a spectral filter (see Appendix C) to suppress NIR photons and XUV fluorescence from the heated nanoplasma. Employing a smaller x-ray spot size and selecting only bright diffraction images enables the exclusive analysis of particle scattering images from a region that was homogeneously pumped by the NIR laser. Downstream the optical axis, the accurate relative timing of the x-ray and NIR pulses is measured on a single shot basis with few-femtosecond accuracy (see Appendix D) [37, 38, 39].
The single-shot diffraction images were systematically recorded as function of pulse delay. While scattering patterns with bright, nearly spherical fringes from unpumped particles are observed for negative pulse delay (x-rays first), the fringe features begin to move and fade with increasing delay for pumped particles (positive delays), see Fig. 1(d-g). The evolution of the fringe pattern represents our main observable and encodes the plasma density dynamics. Note that images from unpumped particles enable the in-situ characterization of the initial target size distribution (see Fig. 1b).
3 Analysis
3.1 Shot Statistics
From recorded scattering images we found 24500 clearly identifiable hits. After removing faint images, multiparticle hits that display Newton rings [40, 41], and hits from clustered nanoparticles, a dataset of 5700 bright single-shot images with clear fringe structures has been systematically analyzed as described below. Out of that, a subset of 1070 images was assigned to the high intensity region of the x-ray focus which is associated with homogeneous NIR pumping. It should be emphasized that the latter discrimination step cannot be made based on the scatting pattern alone but requires the quantitative fit of the image with our model to determine the associated incident x-ray fluence (see Appendix E.6). The distributions of classified images versus pulse delay are displayed in Fig. 1c.
3.2 Individual Image Analysis
In the small-angle scattering limit, the far-field scattering pattern encode a two-dimensional projection of the particle density. Nevertheless, for three-dimensional targets with spherical symmetry, the unique and unrestricted reconstruction of the radial density profile would still be possible if the complete scattering image can be recorded. In real-world experiments, however, a substantial part of information is lost due to the unavoidable detector gaps in pump-probe experiments and limited signal at larger scattering angles. For the quantitative reconstruction of the density profile from the available information contained in the single-shot scattering images an appropriate shape model is imperative. In our analysis we use a simulation-guided few-parameter density profile [28] and retrieve the profile parameters by systematically fitting simulated scattering patterns to the individual measured scattering images. The employed shape model is based on an electron density profile described by a modified Fermi function with
| (1) |
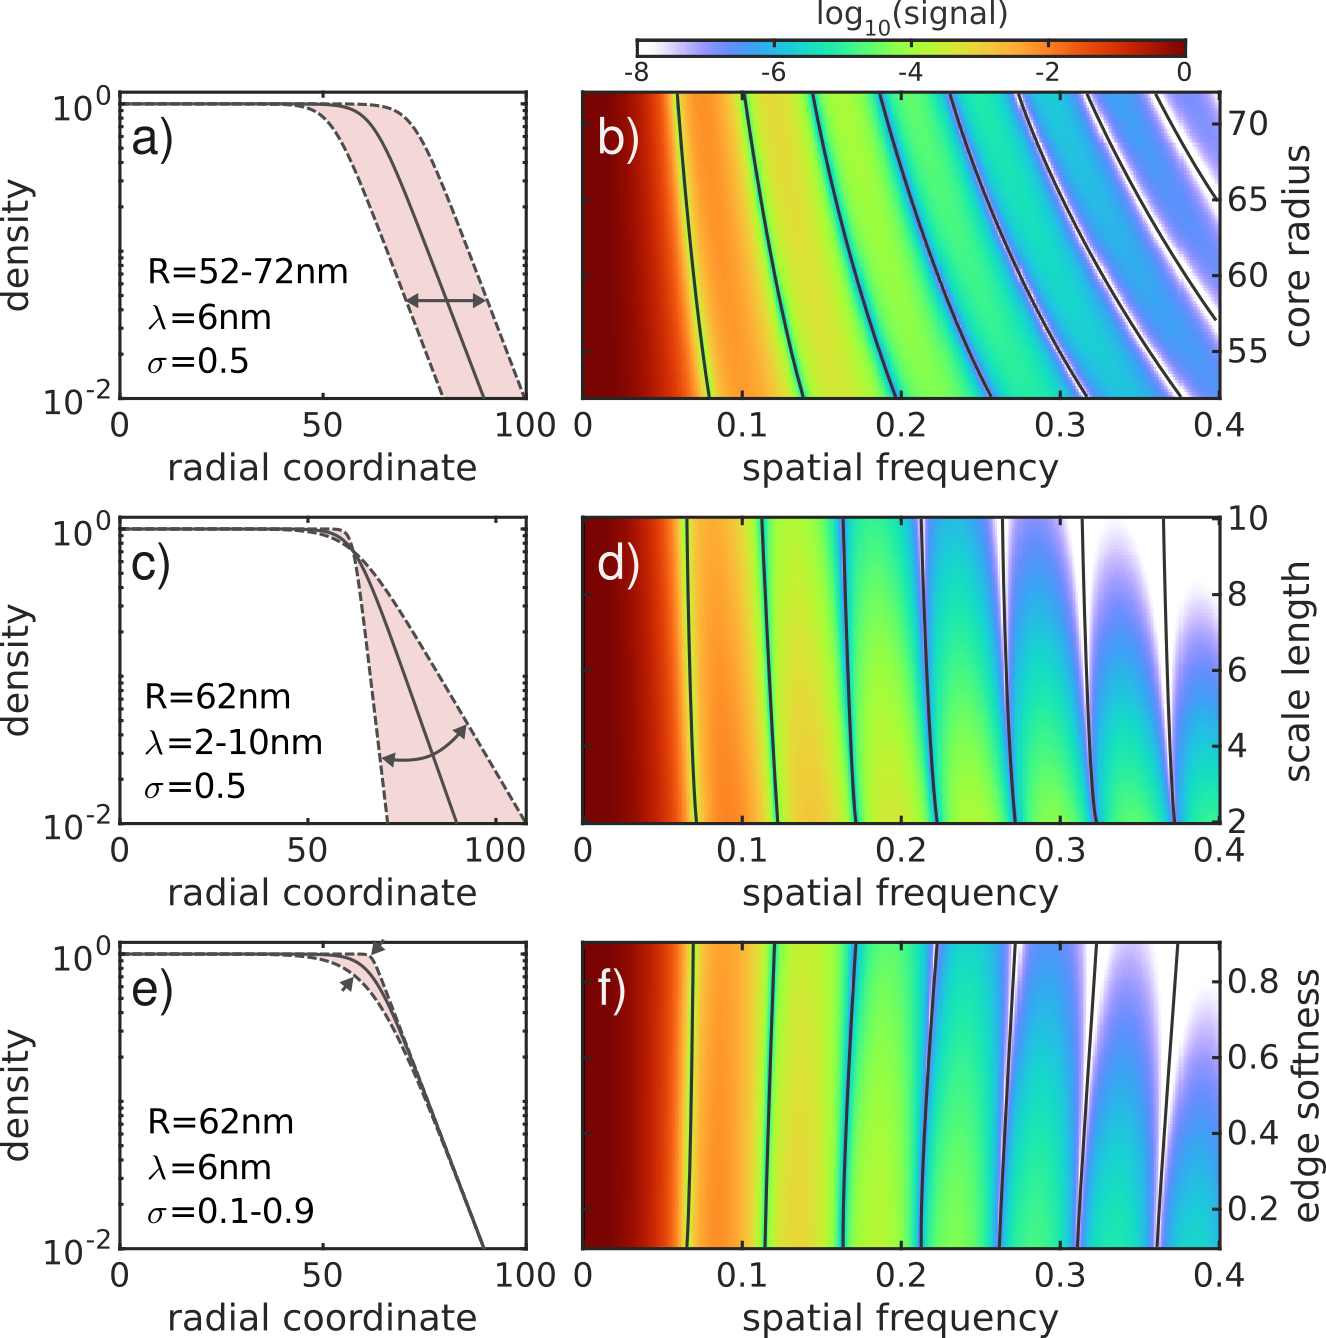
Here is the core electron density, is the local surface offset of the sampling point , is the edge softness parameter, and is the scale length of the density decay. A sharp density edge corresponds to the limit . For a spherical system with a reference surface at radius , the surface offset is . The variation of radius, scale length, and softness are connected with specific signatures in the scattering pattern, as illustrated in Fig. 2 for a spherical system. For a fixed softness parameter, the radius and scale length are almost independently coupled to the fringe spacing and angular decay of the radial scattering profile (cf. Figs. 2 a-d), respectively. As the underlying mapping between these profile parameters and the signatures in the scattering images is a function of the softness, the latter must be known or has to be determined independently for a unique parameter reconstruction. This requirement is illustrated in Fig. 2e-f, where the variation of the edge softness is shown to also modify the fringe spacing and the angular decay of the scattering profile. It should be noted that in previous work, the problem was usually circumvented by assuming an unphysical sharp edge (). In our analysis we determine the finite edge softness using an additional constraint, as described in detail below.
In the description of the scattering process, both plasma electrons as well as atomically bound electrons with binding energies smaller than the X-ray photon energy can be treated as free electrons. In contrast, the scattering contribution of strongly bound electrons is negligible, such as in the case of the silicon K-shell electrons in our scenario. It should further be noted, that the K-shell electrons of Si are effectively unreachable for the NIR-driven ionization. Hence the Si K-shell can be neglected for both ionization and the scattering process. As a result and assuming that the fraction of emitted electrons is negligible for the large particles considered here, the density of actively scattering electrons is representative for the atomic density and their number can be assumed to be constant.
In our analysis the slight ellipsoidal deformation of the nanospheres resulting from the particle synthesis must be included for high accuracy fits (see Appendix E). For the resulting ellipsoidal reference surface with direction dependent radius, the local surface offset is defined as , where specifies the closest point on the reference surface and is the associated unit vector of the surface normal. The neglect of directional variations of the remaining relevant parameters and is justified by the small anisotropy predicted by microscopic calculations [28].
For a given value of the edge softness parameter , high quality fits of individual images can be performed and yield the scale length and the minimal and maximal core radii and that characterize the minor and major axis of the projected density associated with the ellipsoidal control surface. For further analysis we use the effective radius . So far, however, the remaining dependence of the scale length and core radius on the edge softness results in an apparent critical ambiguity for the analysis. We resolve this ambiguity by exploiting the conservation of the number of scattering electrons (i.e conservation of mass in the case of charge neutrality), as described in the following.
3.3 Determining the edge softness evolution
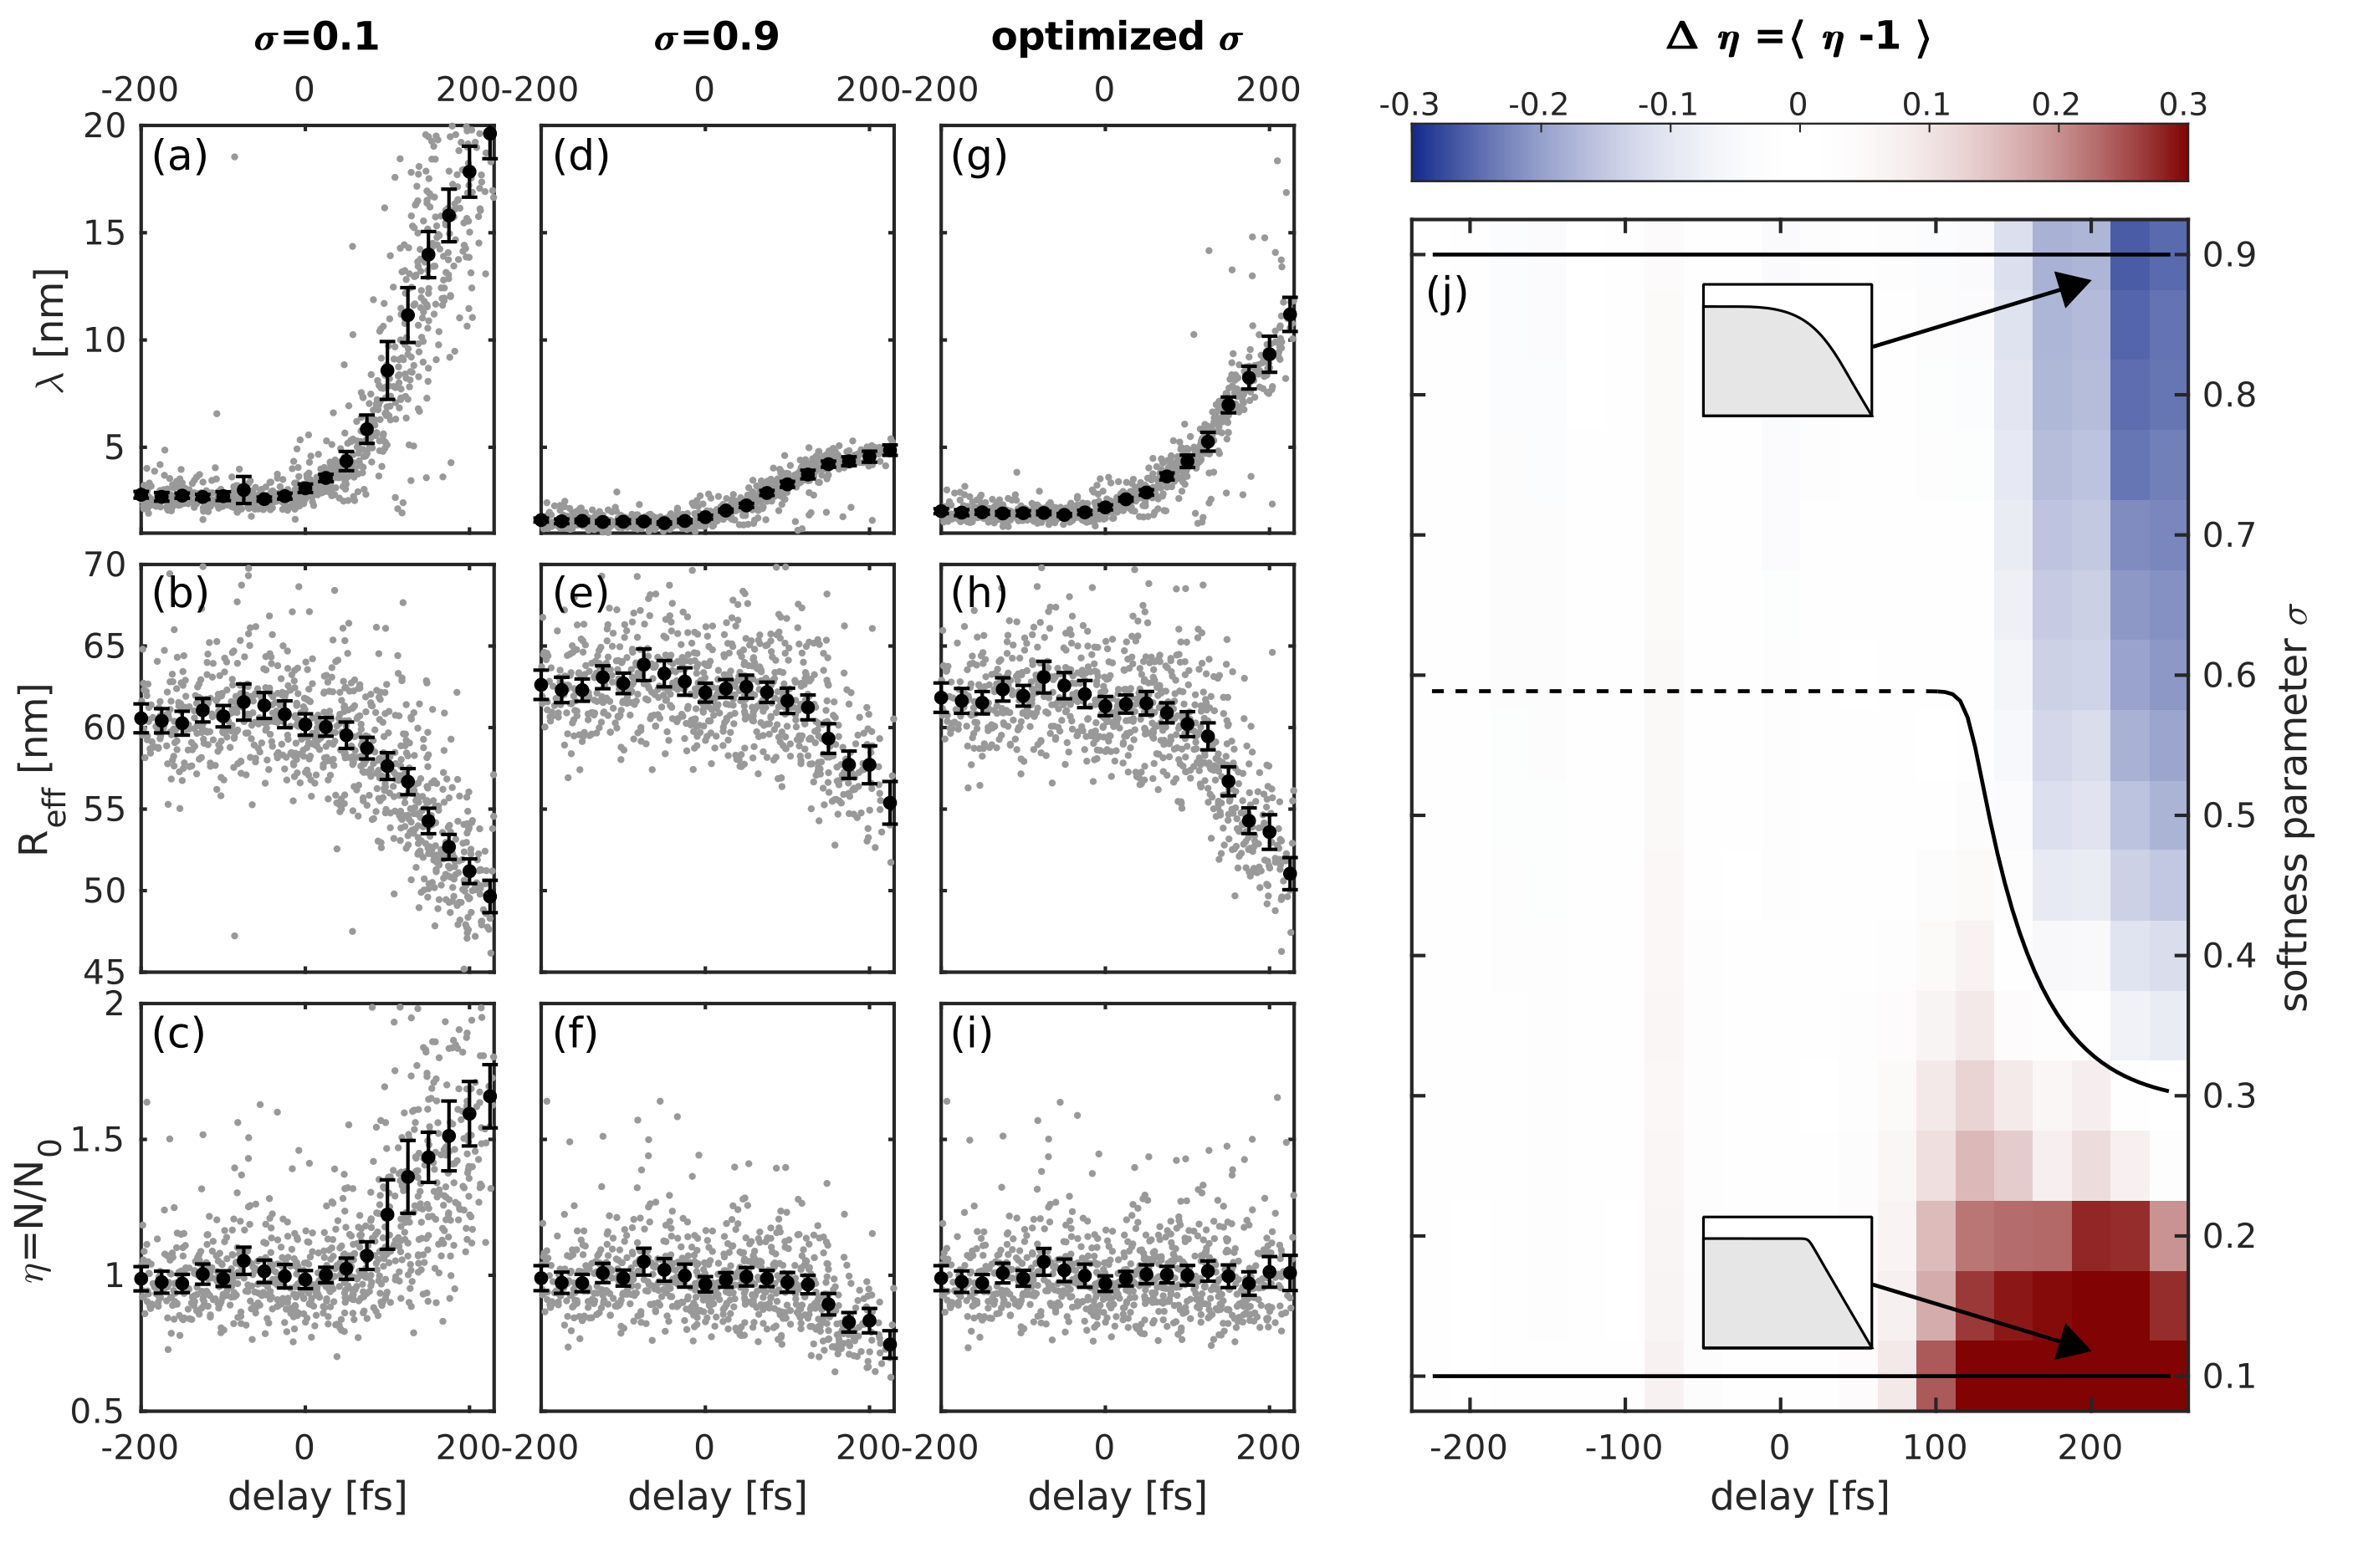
The treatment of the scattering problem via the few-parameter profile enables systematic forward fitting of a large dataset with thousands of scattering images. Figure 3a,b displays fit results for the delay dependent evolution of scale length and effective radius when assuming a fixed very sharp edge (). In this case, the associated total mass (number of electrons contributing to the scattering as given by the integral of the electron density) would increase by almost 90% during the first of the expansion (Fig. 3c), which is obviously unphysical. The profile parameters retrieved assuming a very soft edge () differ substantially (Fig. 3d,e) and, in turn, would correspond to a mass decrease by more than 20% (Fig. 3f). The mass mismatch evolution map resulting from fits with systematically varied softness parameters is shown in false color representation in Fig. 3j, where the above discussed representative cases are indicated by horizontal lines (top and bottom). While the impact of the edge softness on the mismatch is little for unpumped particles as its effect vanishes in the limit of small scale length (sharp density step), the map shows that mass conservation during expansion requires a dynamical change of the softness parameter, expressed by the path of mass conservation (white color) in Fig. 3j. The delay dependent softness associated with conserved total mass (black curve) defines the final and physically consistent evolution of all parameters and their mean values, i.e. softness, scale length and core radius, see Figs. 3g-j. Only these parameters have been used for further analysis and in Fig. 1.
4 Results and discussion
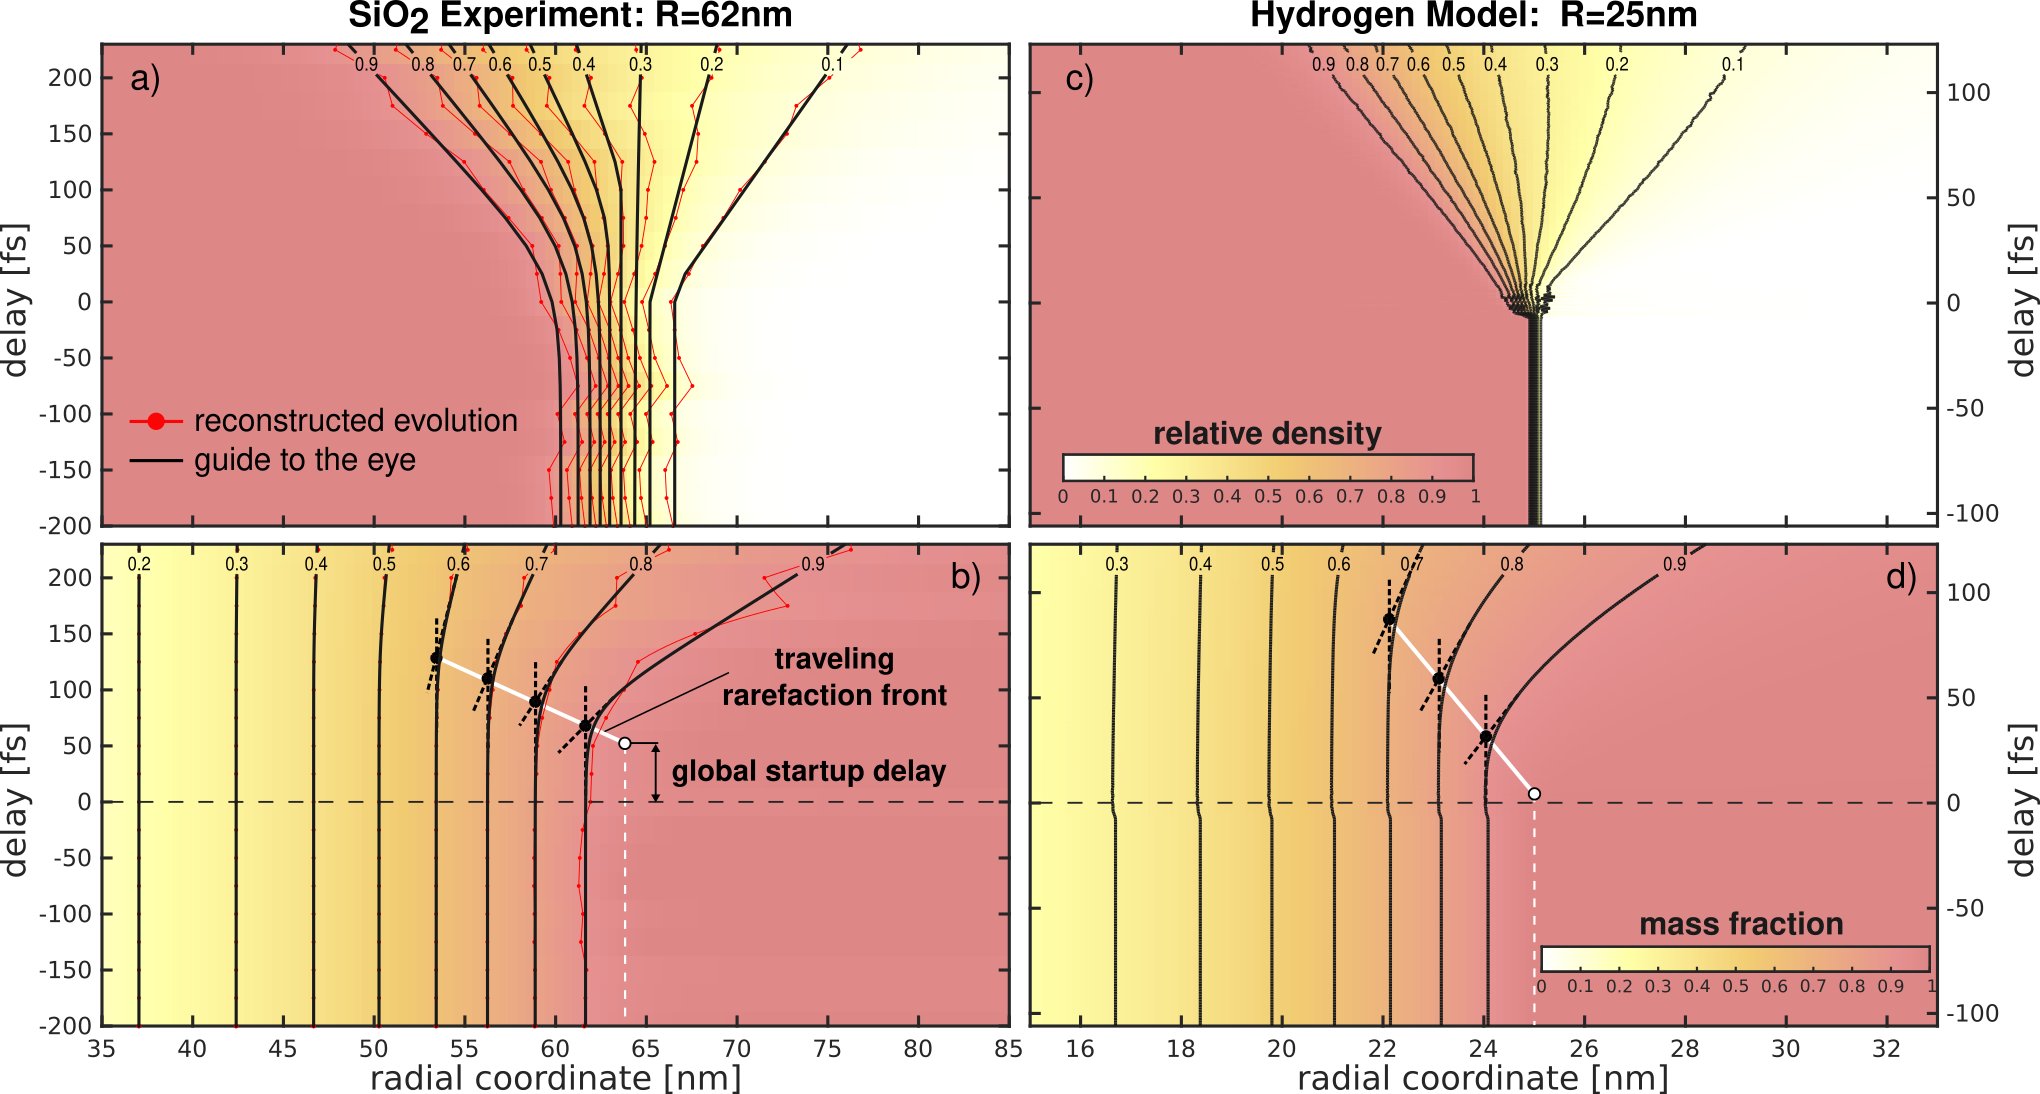
The resulting time-dependent density map in Fig. 4a displays the retrieved mean density profile evolution and reflects the core depletion and ablation dynamics of the nanoplasma. Both the decreasing radius of the remaining high-density core as well as the increasing width of the surface layer can be clearly identified and tracked in time, see the evolution of density isolines. Note that the initial finite width of the density step in the experimental data for unpumped particles (negative delays) is attributed to surface roughness and deviations from an ellipsoidal shape. Minimizing the initial roughness and surface porosity via advanced target preparation techniques is expected to remedy this effect [42]. Most importantly, the continuous sampling of the mean density profile along the time axis further allows to track the expansion startup and velocity buildup for individual shells - an information that could not be accessed with existing plasma imaging techniques. To that end we analyze the evolution of the normalized radial density integral. The resulting mass fraction map (Fig. 4b) reflects the relative particle mass enclosed in a given radius as function of time. Contours of equal mass fraction (see lines), in turn, reflect the expansion of individual shells and define meaningful shell-specific trajectories if overrun effects (i.e. if inner shells overrun outer ones) can be excluded. Note that the employed geometry model is ideally suited to describe the expansion dynamics after laser excitation. It is not constructed to capture e.g. the sub-cycle dynamics during laser excitation and thus describes an averaged density dynamics during the excitation.
The evolution of adjacent shell trajectories shows that the surface layer expansion does not proceed with a single speed. From the shell-resolved trajectories we can extract the specific buildup and saturation of the respective shell velocities as well as the associated start-up delay. A comparison of the shell-specific start-up delays (symbols in Fig. 4b), however, shows an almost constant velocity of the inward-traveling rarefaction front with radial speed and defines a global startup delay of fs via interpolation to the initial surface radius (see Fig. 4b). The global startup delay has been determined only from the dynamics outside the NIR-excitation window and is therefore independent of the sub-cycle dynamics during laser excitation. It does not necessarily specify the actual beginning of the plasma motion, but reflects a meaningful parameter to characterize the rarefaction wave. Both central parameters, i.e. the front velocity and the global start-up delay, are assumed to be characteristic observables for the dependence of the plasma formation and relaxation dynamics on laser parameters and material properties and are thus of particular interest for comparison with theory.
With existing models, a full microscopic modelling of the expansion dynamics for the experimental scenario is still out of reach. However, to evaluate the significance and generic character of the observed features, we perform a qualitative comparison with the published microscopic particle-in-cell simulations for hydrogen spheres [28], see Fig. 4c,d. The simulation results are displayed for axis limits that correspond to similar relative changes of parameters as in the experiment. Though absolute spatial and temporal scales are different, the general structure of the density evolution and shell-resolved expansion trajectories shows excellent agreement. In particular, a finite start-up delay of fs and a nearly constant rarefaction front velocity of are predicted by the simulations, supporting general applicability of our analysis and the significance of these key parameters. In particular, our results demonstrate the accessibility of these parameters in time-resolved diffraction studies, highlighting their potential for the quantitative characterization of both laser-driven plasma formation and the resulting relaxation in both experiment and theory. The development of theoretical models that can explain the impact of material and laser parameters is expected to allow the description and optimization of such processes for arbitrary target shapes and laser configurations.
5 Conclusions
Our time-resolved diffraction experiment has revealed the quantitative density profile evolution emerging in the early stage of sudden laser-induced nanoplasma expansion for silica nanospheres. The work exposes the so-far inaccessible onset, buildup, and stabilization of the shell-resolved expansion velocity. The observed rarefaction front velocity is comparable with the disorder front velocity reported in [31, 43], indicating a potential connection between the two observables that remains to be clarified. The current results provide a critical reference for theory and underpin the unprecedented potential of diffractive imaging for the precise characterization of ultrafast laser-plasma processes, with far-reaching implications for both fundamental research on laser-induced self-similar plasma expansion and applications of intense laser-matter interactions at plasma surfaces in general. The feasibility of ultrafast imaging with simultaneous high spatial and temporal resolution [44] is expected to also enable tracking of other ultrafast plasma dynamics, such as bunching and shock formation in the expansion process [9] or nonlinear plasma wave formation and breaking [35]. Such experiments, however, require an appropriately adjusted geometry model to capture and parametrize the relevant features, e.g. to describe density jumps in case of shocks or regular density modulations in case of wave phenomena. Our method is further anticipated to be transferable to thin cylindrical or even flat jets, opening routes to the systematic tracking of plasma formation, wave dynamics, and the initial phases of ablation in various materials including biologically relevant liquids such as liquid water.
Appendix
Appendix A Target preparation and characterization
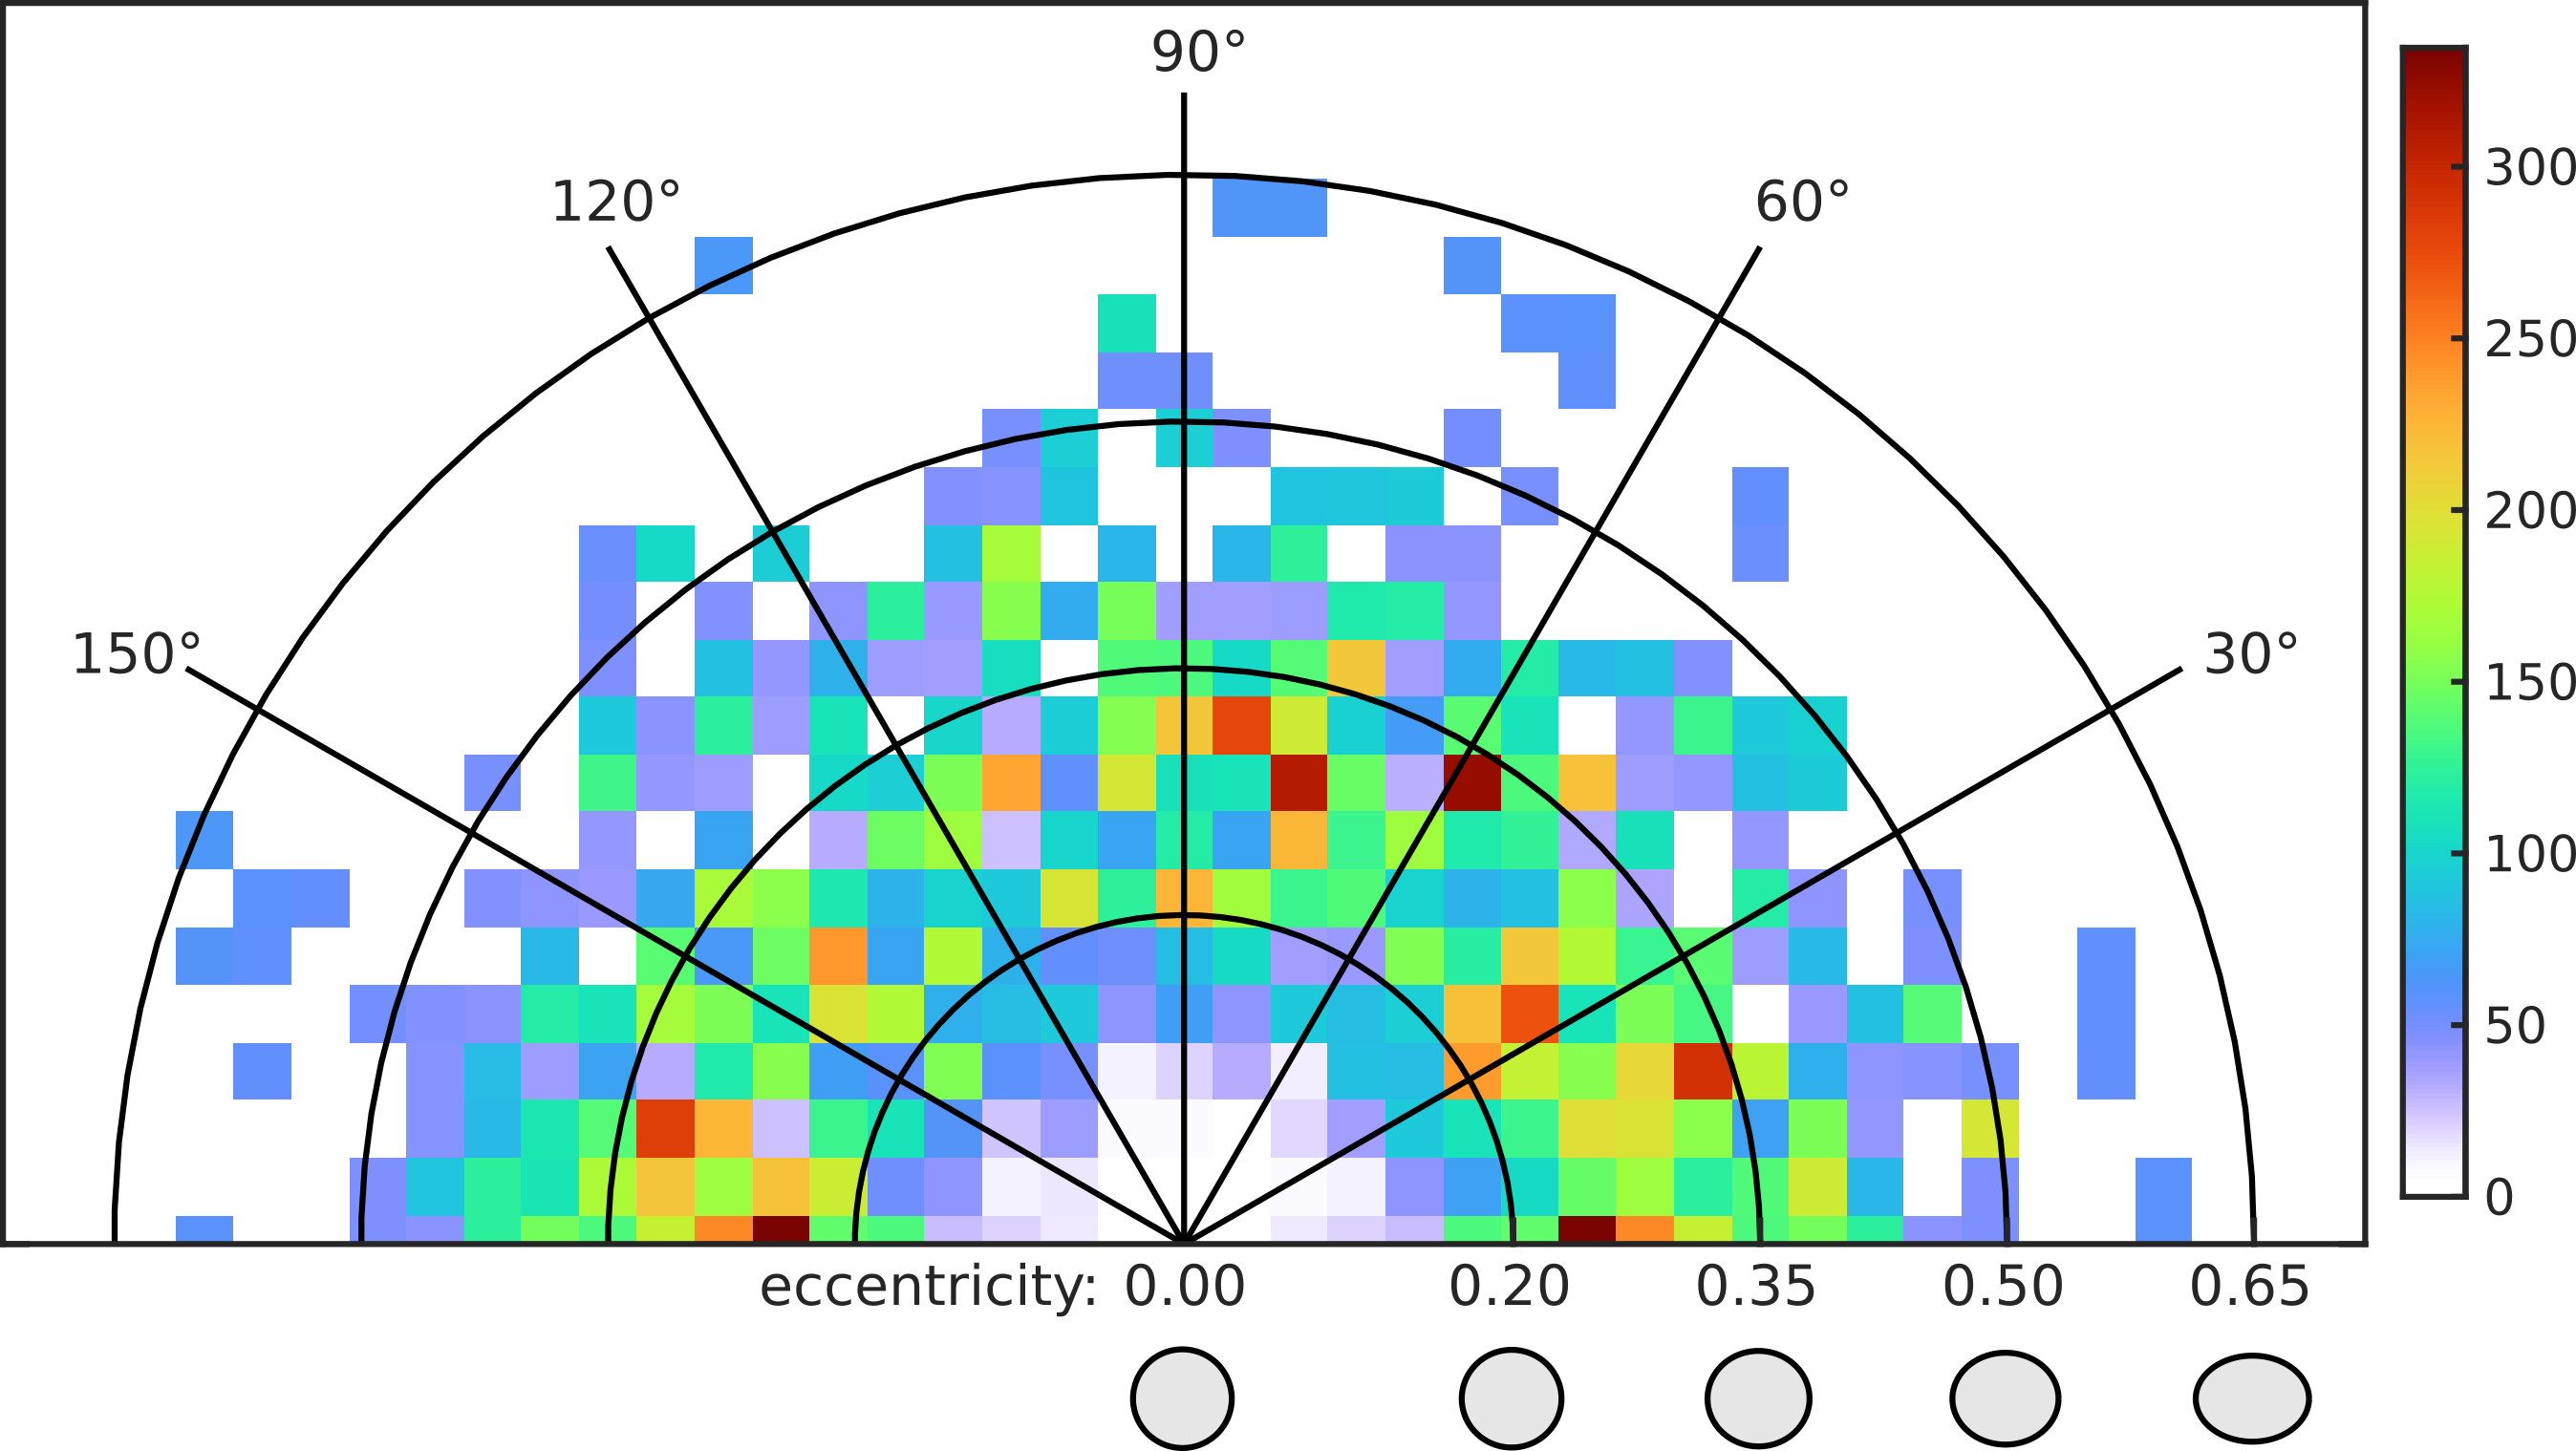
Silica nanoparticles were produced by the Stöber method [45]. First, small seed nanoparticles were prepared by adding 21 g of TEOS, 28 mL of ammonia solution (25%wt. in water) and 1 mL of water to 530 mL of ethanol and stirring the mixture for 24 h. A further shell was grown on the seed nanoparticles via the seeded growth method [46] until the desired particle size was reached. All samples were stored in ultra-pure ethanol after cleaning. The used particle batch was characterized by means of transmission electron microscopy (TEM) as well as by fits of the scattering pattern from unpumped particles (cf. Fig. 1b). The TEM analysis yields an average diameter of nm and a polydispersity of 1.8 while a mean diameter of nm and a polydispersity of 2.3 is determined from the scattering pattern. Note that these values are consistent when considering the estimated systematic error of ca. 2 in the analysis of the diffraction data due to uncertainty of the exact distance of the active detector plane from the interaction point and the fluctuation of the central X-ray wavelength. Further, the systematic analysis of the scattering pattern reveals an average eccentricity of around 0.3 for unpumped particles (cf. Fig. 5). The associated differences in the ring positions along the minor and major axes in the scattering image would result in significant overlap of neighboring maxima and minima when performing circular averaging. The high accuracy reproduction of the scattering images necessary for our forward fitting approach can therefore only be achieved when the elliptic nature of the particles is taken directly into account (see E for more details on the forward fitting method). Suitable aliquots of the mother suspension were dispersed in larger volumes in deionized water at a concentration of 1 g/l, then briefly sonicated, and used in the experiments. The nanoparticles are aerosolized with nitrogen. The aerosol was subsequently dried in a counterflow membrane dryer employing dry nitrogen, introduced into the vacuum chamber through a glass nozzle, and collimated by a differentially pumped aerodynamic lens to form a beam of nanoparticles.
Appendix B IR-Intensity Calibration
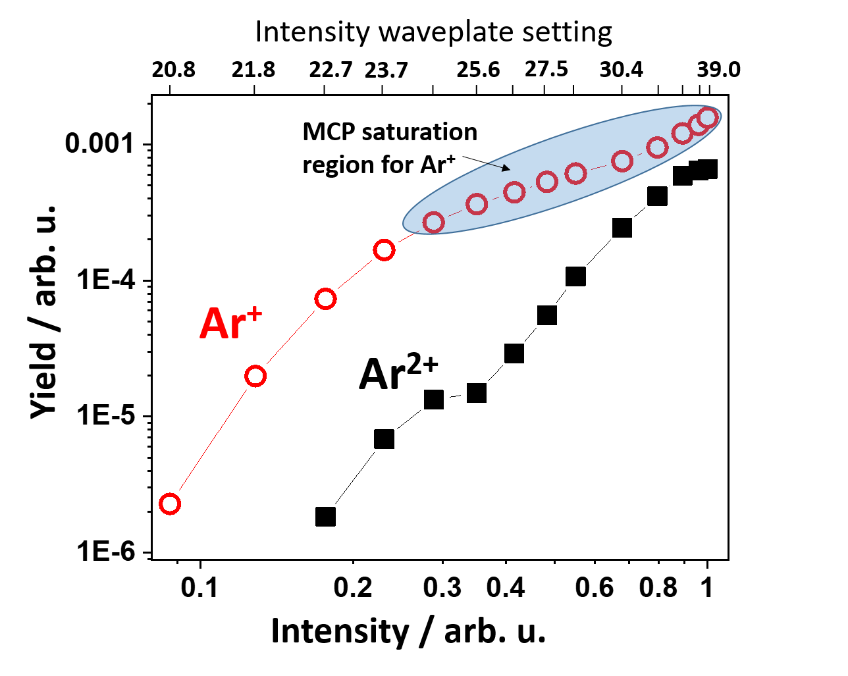
Because neither the NIR pulse energy on target (after the holey mirror) nor its focus profile was directly measured, the absolute calibration of the peak intensity of the NIR pulses was performed based on the intensity-dependent yields of Ar+ and Ar2+ ions recorded using an ion time-of-flight spectrometer. The intensity of the NIR pulse was controlled using a /2 wave plate set in front of a polarizing beam splitter. The measured Ar+ and Ar2+ ion yields are shown in Fig. 6 as a function of the wave plate settings. Since the detector signal for Ar+ was saturated in the high-intensity region, we used the intensity-dependent Ar2+ signal for the calibration. By matching the Ar2+ yield curve to the literature data [47, 48], we estimate that the highest intensity value for Fig. 6 corresponds to 8W/cm2.
Appendix C Scattering detector and spectral filters
Scattering images are recorded in single-shot mode using the front pixel detectors of the LAMP endstation at LCLS [36, 49]. The front pixel detector consists of two movable detector panels, each containing 1024x512 pixel with 75x75 m pixel size. The detectors are covered with a 50nm Al coating to suppress signal from visible light and plasma emission from the target into the extreme ultraviolet spectral regime. For the current experiments with intense 800nm laser pulses, an additional optical filter of 220nm Al on a 0.77m LUXfilm polyimide is used and a baffle system is implemented to guide the optical laser pulses through the detector system. The spectral transmission of the filter combined with the detector response [36] result in a net quantum efficiency of 0.48 for detection of the 800 eV XFEL photons employed for the diffractive imaging with single photon sensitivity.
Appendix D Laser pulse characterization and timing analysis
Our results rely on the accurate determination of the relative delay between the NIR pump pulses and the x-ray scattering probe pulses. The Self Amplification of Spontaneous Emission (SASE) process for Free Electron Lasers as used here produces X-ray pulse shapes whose average temporal shape is well behaved but the individual shots are a near stochastic collection of longitudinal optical modes. When we speak of the “duration” of the x-ray pulse, we are therefore speaking of the average duration that is typically a majority fraction of the electron bunch length used to produce the FEL pulse. In our case the electron bunch was measured to correspond to a duration of about 40–50 fs, where the average x-ray pulse duration would be expected in the vicinity of 30–40 femtoseconds FWHM, though we note that the average intensity distribution is not necessarily Gaussian in shape. The NIR pump pulse used in this experiment has been repeatedly measured consistent with 50 fs duration FWHM at the interaction point. We used the conventional method of optimizing this duration in situ by optimizing the ratio of high/low charge states of the strong field ionization of Argon and N2.
D.1 Calibration of relative delay
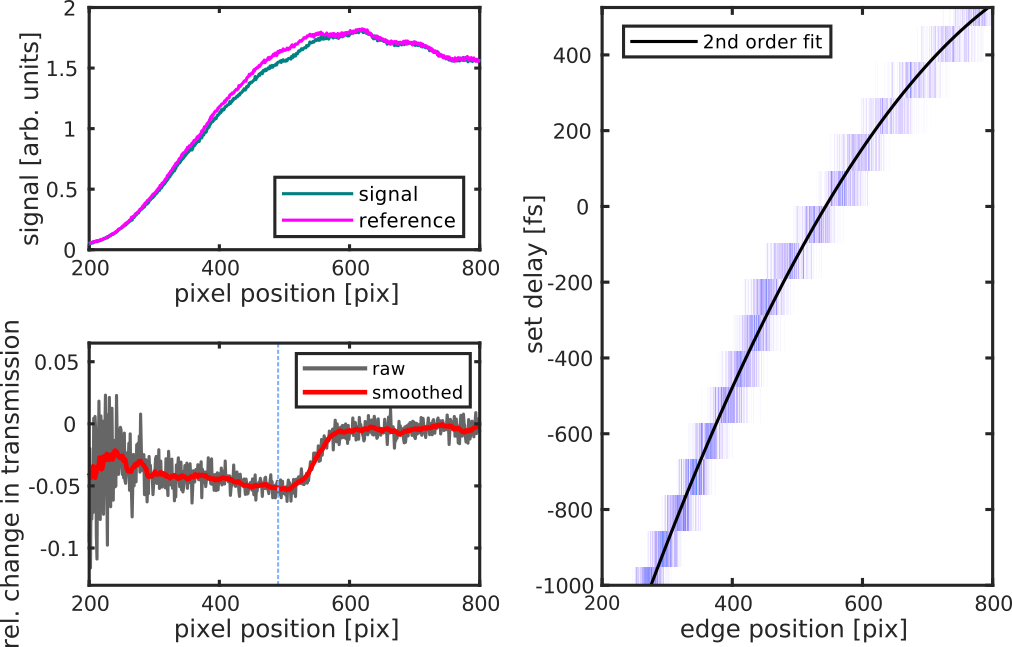
The NIR pump laser and the FEL are independent sources, and as such their relative timing can only be controlled at the accuracy level of the radio-frequency synchronization system. At the LCLS, this synchronization is typically on the order of a 150 fs rms and must be corrected by the use of a single-shot x-ray optical cross correlation method [37, 38]. The cross correlation method used here is based on the idea of encoding time onto the spectrum of an optical reference [50, 51]. This so-called “spectral encoding” allows for relative measurements with precision below 10 fs [39].
The basic observable of the timing tool is the change in the frequency resolved transmission of a super-continuum, generated from a replica of the NIR pulse, through a dielectric plate with (signal) and without (reference) the co-propagating x-ray pulse, see Fig. 7(a) and (b) for exemplary raw signals and the corresponding relative X-ray induced transmission change, respectively. Due to a spectral chirp of the super-continuum, the spectral transmission change exhibits a step that is associated with the pulse overlap and can be translated into a relative pulse delay. To this end, a systematic scan of the relative pulse delay, e.g. via electronic delay settings, is performed that yields a map for the correlation of the edge position and pulse delay, still including the jitter. A second order polynomial fit to that map provides a mapping function for position and relative delay, see Fig. 7(c).
D.2 Finding absolute zero
In order to identify the absolute time overlap between the NIR and the x-ray pulse, we used the method described in [52] whereby the photo-dissociation of quasi-bound N dications into N+ fragment ions [53] serves as an indication of the x-ray induced appearance of N via the x-ray core ionization and subsequent normal Auger decay. In particular the delay dependent abundance of the resulting low and high energy cations serves as a measure for the pulse order. Due to the high ionization potential of , the attenuated NIR-pulse is unable to excite or ionize the neutral molecule, leaving the ionization by the subsequent X-ray pulse and the resulting population of quasi-bound almost unchanged. However, initial irradiation of the neutral molecules by the X-ray generates a population of quasi-bound that, after further excitation by the NIR pulse, results in dissociation into a pair of with corresponding recoil energy due to Coulomb repulsion.
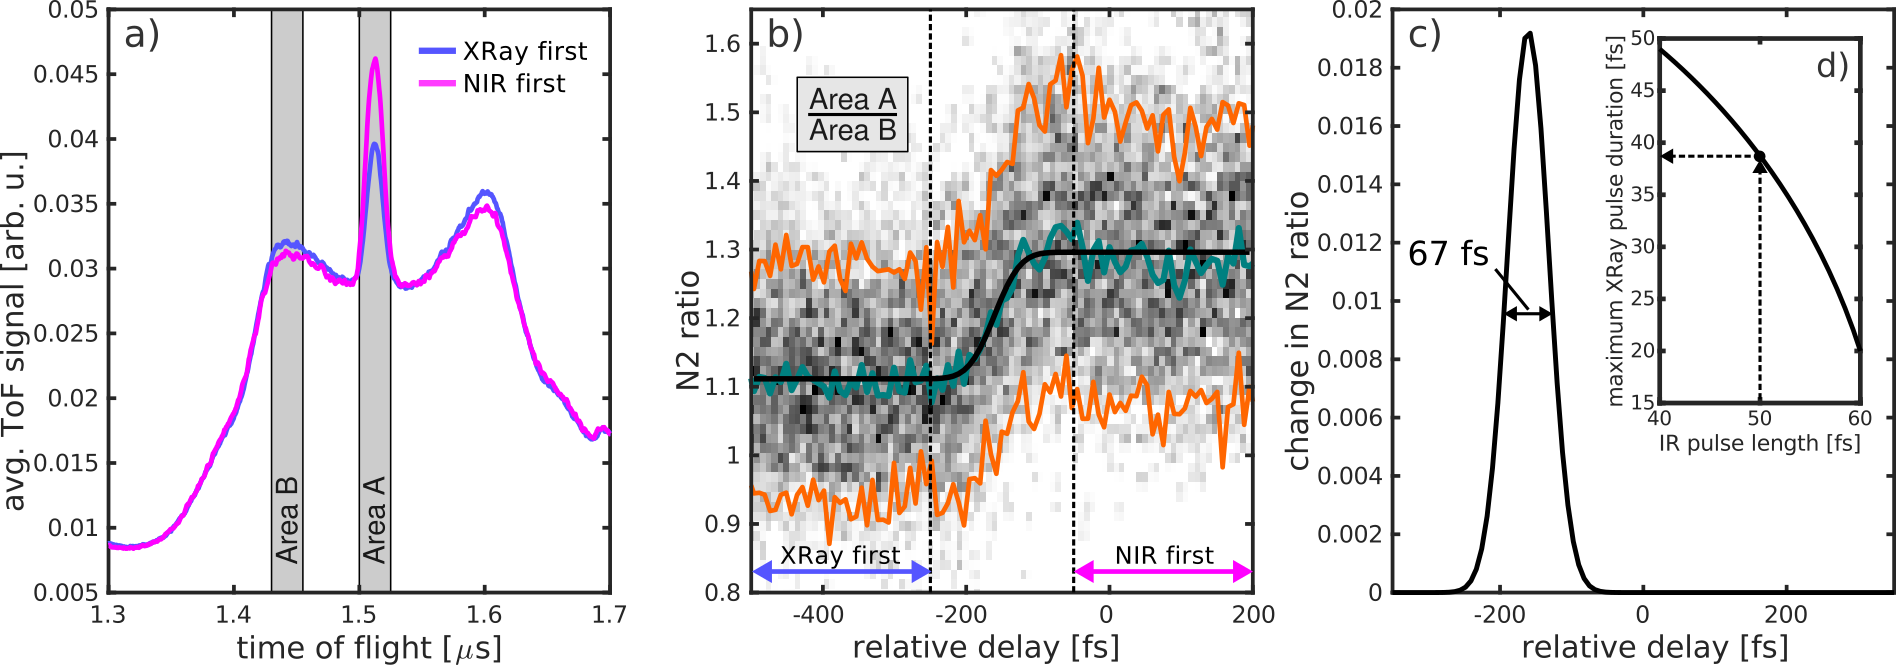
Fig. 8(a) presents averaged time-of-flight spectra for shots with the X-ray pulse first (blue) or the NIR pulse first (purple). Note that area A indicates the recoil-free signal from that exhibits higher yield if the NIR arrives first. Area B is representative for signal with recoil and shows increased yield when the NIR is late. The ratio of the signals integrated within these areas is used to trace the pulse order as function of the (not offset corrected) delay. Fig. 8(b) shows the distribution of the single-shot yield ratios from a systematic delay scan. For each delay bin, the distribution can be described well by a Gaussian envelope. The resulting delay-dependent center position (width) of the Gaussian fits is shown as cyan (orange) curve. The step around -160fs is indicative of pulse overlap, i.e. zero delay.
Assuming no-depletion and linear response for both the X-ray and NIR excitations processes, the derivative of the delay-dependent ratio signal directly reflects the cross correlation of the pulses envelopes
| (2) |
A fit of the step feature in the evolution of the delay-dependent centers in Fig. 8(b) with an error function (black) and taking the derivative of the latter yields the cross-correlation in Fig. 8(c), whose peak is located at -160fs, defining zero delay. Assuming Guassian pulses the FWHM-width of the cross correlation of 67fs can be used to estimate the mean X-ray pulse duration to about 38 fs from the knowledge of the NIR pulse duration of 50 fs (see inset).
Appendix E Small angle scattering of ellipsoids in the weak scattering limit
E.1 Evaluation of the scattering integral in Born approximation
To derive the formalism used to describe the scattering of ellipsoids in our study we depart from the general solution to the classical scattering problem in the limit of weak scattering, i.e. neglecting multiple scattering (Born approximation). Assuming a linearly polarized incident electric field with wave vector and an arbitrarily shaped scattering object defined via the scattering electron density we can calculate the scattered field amplitude from
| (3) |
with momentum transfer vector defined as the difference between incoming and outgoing wave vector according to , classical electron radius and detector distance . Note that the angular dependence of the scattered field amplitude due to polarization effects can be neglected for small scattering angles.
For the following discussion we consider, without loss of generality, an incident wave vector along the z-axis . We further limit the discussion to a small angle scattering scenario with ) such that we can now assume and rewrite Eq. 3 as follows:
| (4) | |||||
which reflects that the scattering intensity in the small angle scattering limit is determined by the Fourier transform of the projected density .
If we are only interested in a line profile instead of the full 2d scattering image, e.g. for , we can further simplify the expression and write:
| (5) | |||||
which relates the scattered field along a specific polar angle with the Fourier transform of the density projected onto the corresponding axis. Based on the above equation we will now derive solution strategies for the density distributions that are most relevant to our work, i.e. that of homogeneous spheres and ellipsoids with sharp and soft surfaces.
E.2 Analytic solution for a homogeneous sphere with a sharp surface
As the first step we will revisit the well-known solution for a homogeneous sphere with a sharp surface described by the density profile
with the homogeneous electron density . Due to the radial symmetry we only need to calculate the scattering for a single scattering direction, i.e. we are only interested in the double projected density . The corresponding integral can be calculated in polar coordinates
where describes the radial extension of the sphere for the given position on the projection axis with
Inserting this result yields
| (10) |
and allows to obtain the scattered field by solving the corresponding Fourier integral
It is often beneficial to work with the normalized scattered field () which reads
Note, that we can drop the subscript of the momentum transfer vector due to the radial symmetry.
E.3 Analytic solution for a homogeneous ellipsoid with a sharp surface
The doubly-projected density that is needed to evaluate the scattering integral in Eq. 5 for an object is also an important quantity in the field of reconstruction algorithms in computer tomography (CT), where it is known as the Radon transform. In particular, the Radon transform of arbitrarily shaped and oriented ellipsoids are of wider interest and are analytically known [54]
| (13) |
where is the normalized vector characterizing the direction the density is projected on and is the remaining coordinate along this direction. The parameters , and determine the ellipsoids length along the x, y and z direction for an unrotated ellipsoid. The effects of the dimension and orientation of the ellipsoid are now encapsulated in the factor :
which gives us the effective dimension of the projected ellipsoid along the direction of the projection vector . The angles and are Euler angles in x-convention for the rotation of the ellipsoid (rotation first by angle about the z-axis, secondly by angle about the x-axis, and finally by angle about the z-axis again). For our purposes we can, without loss of generality, assume a detector in the x-y plane (our propagation direction is z), i.e. such that the angle is essentially the polar angle defining the line-out from the 2d scattering pattern. Doing this already simplifies the above expressions considerably:
For any given projection direction the expression for the double projected density is structure-wise identical to that for a homogeneous sphere, c.f. Eq. 10. However, the value of the radius equivalent changes as a function of the projection direction. Before we discuss the implications of this aspect, we further reduce the complexity of the expression for with the help of trigonometrical identities such that
where . It can be shown, that for any given set of parameters , , , , , and the description of can be reduced to an even simpler functional form:
where the effective parameters and describe the dimensions of the projection and describes its orientation in the x-y plane.
Now we can solve the Fourier integral for each projection direction individually in full analogy to the spherical case discussed above. The result is a scattered field that resembles the scattering of a sphere for any given direction , but with a direction dependent radius . The result for the scattered field amplitude reads
The corresponding normalized fields () can be written as
| (14) |
which resembles the solution of a sharp sphere, but with an angular dependent radius.
E.4 Solution for a sphere with a soft surface
Next, we will consider spherical objects with a soft surface density profile, akin to the one used in the main manuscript, i.e.
where is the core density, is the core radius, is the edge softness parameter, and is the scale length of the density decay. Again, due to the radial symmetry we only need to calculate the scattering for a single scattering direction, i.e. we are only interested in the double projected density . The corresponding integral can be calculated in polar coordinates
In contrast to the scenarios with a sharp surface discussed above, this integral can in general not be solved analytically. However, since only a single one-dimensional integral has to be evaluated to calculate the 2D scattering pattern, a direct numerical integration is a fast and viable approach.
E.5 Approximation for an ellipsoid with a soft surface
Eventually we are looking for an efficient way to compute the scattering pattern for an arbitrarily dimensioned and oriented ellipsoid with a softened density profile given by
| (15) |
where is the core density, is the local surface offset of the sampling point (i.e. its distance to the closest point on the ellipsoidal control surface, see main text), is the edge softness parameter, and is the scale length of the density decay. For this type of profile no general solutions for the singly- or doubly-projected densities and are known. An apparent alternative way to obtain these projections involves the three-dimensional sampling of the density on a grid and subsequent numerical projection. This requires the evaluation of the perpendicular distance from the control ellipsoid surface for all given sampling points. In the limit of a sphere this turns into the radial distance from the surface, i,e, , which is easily calculated. However, in the general case of an ellipsoid, the evaluation of the perpendicular (or closest) distance is not trivial. In fact, its computation involves numerical root finding procedures [55], which practically precludes application of this method in forward fitting approaches.
To solve this problem, we propose an approximation that is based on a combination of the solution for a homogeneous ellipsoid with sharp surface and the solution for a soft sphere. To recall, for an ellipsoid with sharp surface the scattering profile for any given scattering direction is given by that of sharp sphere, the ellipsoidal character enters the description in the form of an angular dependent effective sphere radius. Here, for the ellipsoid with a soft surface, we use a similar approach by replacing the solution of a sharp sphere with that of a soft sphere for a given scattering direction. This approximation will work best for small eccentricities and even becomes exact for a sphere. A systematic analysis of the approximation quality is shown in figure 9. Note that the eccentricity of the particles used in Fig. 9 has been chosen larger than the average eccentricity of the particle in the experiment to show the outstanding quality of the approximation in the considered parameter regime.
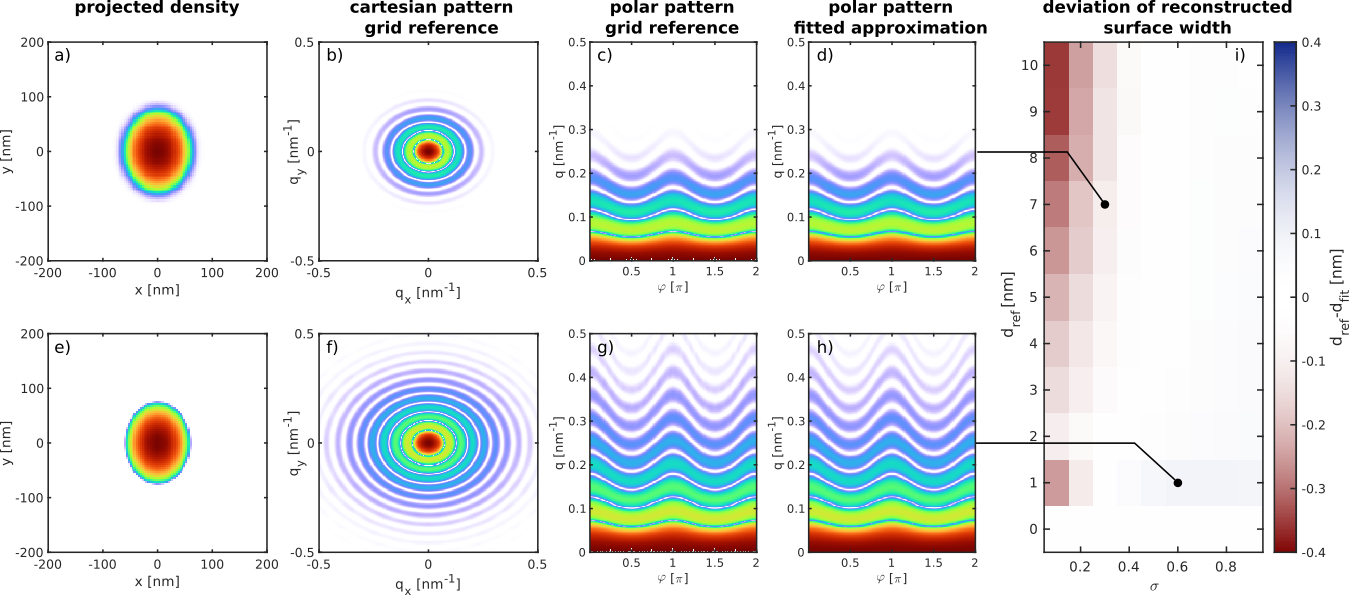
E.6 Forward fitting procedure
The main tool for the fitting procedure will be the above approximation of the scattering pattern of a soft ellipsoid by that of a soft sphere with angle dependent effective radius. In a first step the recorded experimental scattering pattern is transformed into a polar representation. Polar coordinates are the natural coordinates of the numerical scheme for ellipsoid scattering described above and are therefore optimally suited for a comparison of experiment and theory. Furthermore, for properly chosen resolution this step intrinsically applies a sub-sampling of the scattering signal at large scattering angles where the signal strength and therefore the signal-to-noise ratio naturally decreases.
In our approach a simulated scattering image is fully defined by a set of 7 parameters. Besides the parameters defined above, i.e. the density projection dimensions and , the surface scale length , the projections orientation and the edge softness that are necessary to compute the normalized scattering pattern , we consider the incident field intensity and a constant background signal .
| (16) |
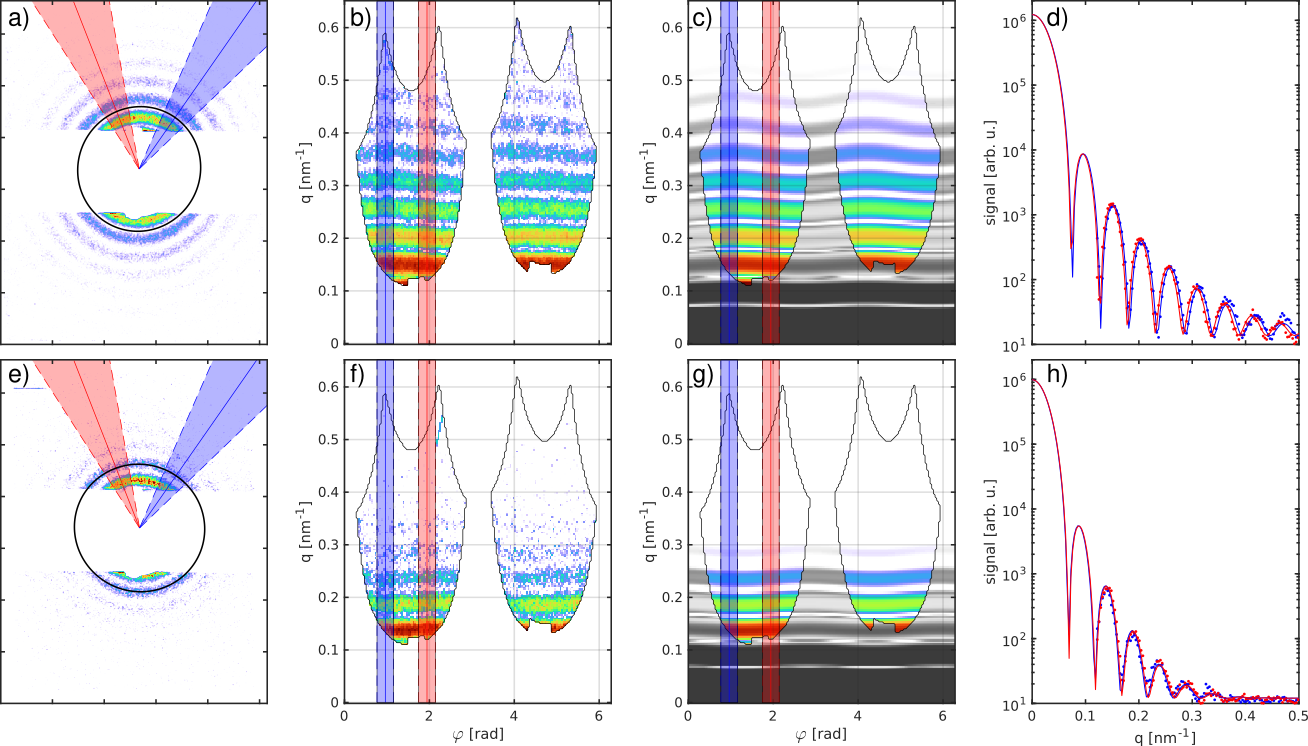
In our forward fitting procedure parameter optimization has been achieved using the “trust-region-reflective” algorithm embedded in Matlabs optimization toolbox. Figure 10 shows two representative exemplary optimization results in comparison with the experimental reference pattern for a sharp surface (top panels) and a soft surface (bottom panels).
References
References
- [1] Borovsky J, Pongratz M, Rousseldupre R and Tan T 1984 Astrophys. J. 280 802–808 URL https://doi.org/10.1086/162054
- [2] Chang C, Jorgensen L, Nielsen P and Lengye L 1980 Nucl. Fusion 20 859–893 URL https://doi.org/10.1088/0029-5515/20/7/008
- [3] Milora S, Houlberg W, Lengyel L and Mertens V 1995 Nucl. Fusion 35 657–754 URL https://doi.org/10.1088/0029-5515/35/6/I04
- [4] Tanberg R 1930 Phys. Rev. 35 1080–1089 URL https://doi.org/10.1103/PhysRev.35.1080
- [5] Eiselt B 1952 Z. Phys. 132 54–71 URL https://doi.org/10.1007/BF01338576
- [6] Nash C and Mcmillan W 1961 Phys. Fluids 4 911–917 URL https://doi.org/10.1063/1.1706424
- [7] Gurevich A V, Pariiska L and Pitaevskii L 1966 Sov. Phys. JETP 22 449
- [8] True M, Albritton J and Williams E 1981 Phys. Fluids 24 1885 URL https://doi.org/10.1063/1.863270
- [9] Sack C and Schamel H 1987 Phys. Rep. 156 311–395 URL https://doi.org/10.1016/0370-1573(87)90039-1
- [10] Murakami M and Basko M 2006 Phys. Plasmas 13 URL https://doi.org/10.1063/1.2162527
- [11] Beck A and Pantellini F 2009 Plasma Phys. Control. Fusion 51 URL https://doi.org/10.1088/0741-3335/51/1/015004
- [12] Mora P 2003 Phys. Rev. Lett. 90 185002 URL https://doi.org/10.1103/PhysRevLett.90.185002
- [13] Daido H, Nishiuchi M and Pirozhkov A S 2012 Rep. Prog. Phys. 75 056401 URL https://doi.org/10.1088/0034-4885/75/5/056401
- [14] Thevenet M, Leblanc A, Kahaly S, Vincenti H, Vernier A, Quere F and Faure J 2016 Nat. Phys. 12 355–361 URL https://doi.org/10.1038/NPHYS3597
- [15] Bulanov S, Naumova N and Pegoraro F 1994 Phys. Plasmas 1 745–757 URL https://doi.org/10.1063/1.870766
- [16] Mourou G A, Tajima T and Bulanov S V 2006 Rev. Mod. Phys. 78 309–371 URL https://doi.org/10.1103/RevModPhys.78.309
- [17] Roedel C, an der Bruegge D, Bierbach J, Yeung M, Hahn T, Dromey B, Herzer S, Fuchs S, Pour A G, Eckner E, Behmke M, Cerchez M, Jaeckel O, Hemmers D, Toncian T, Kaluza M C, Belyanin A, Pretzler G, Willi O, Pukhov A, Zepf M and Paulus G G 2012 Phys. Rev. Lett. 109 125001 URL https://doi.org/10.1103/PhysRevLett.109.125002
- [18] Quere F, Thaury C, Monot P, Dobosz S, Martin P, Geindre J and Audebert P 2006 Phys. Rev. Lett. 96 URL https://doi.org/10.1103/PhysRevLett.96.125004
- [19] Borot A, Malvache A, Chen X, Jullien A, Geindre J P, Audebert P, Mourou G, Quere F and Lopez-Martens R 2012 Nat. Phys. 8 416–421 URL https://doi.org/10.1038/NPHYS2269
- [20] Thaury C, Quere F, Geindre J P, Levy A, Ceccotti T, Monot P, Bougeard M, Reau F, D’Oliveira P, Audebert P, Marjoribanks R and Martin P H 2007 Nat. Phys. 3 424–429 URL https://doi.org/10.1038/nphys595
- [21] Bang W, Albright B J, Bradley P A, Gautier D C, Palaniyappan S, Vold E L, Cordoba M A S, Hamilton C E and Fernandez J C 2015 Sci. Rep. 5 14318 URL https://doi.org/10.1038/srep14318
- [22] Bang W, Albright B J, Bradley P A, Vold E L, Boettger J C and Fernandez J C 2016 Sci. Rep. 6 29441 URL https://doi.org/10.1038/srep29441
- [23] Harilal S S, Skrodzki P J, Miloshevsky A, Brumfield B E, Phillips M C and Miloshevsky G 2017 Phys. Plasmas 24 063304 URL https://doi.org/10.1063/1.4985678
- [24] Wang J, Coppari F, Smith R F, Eggert J H, Lazicki A E, Fratanduono D E, Rygg J R, Boehly T R, Collins G W and Duffy T S 2015 Phys. Rev. B 92 174114 URL https://doi.org/10.1103/PhysRevB.92.174114
- [25] Mondal S, Lad A D, Ahmed S, Narayanan V, Pasley J, Rajeev P P, Robinson A P L and Kumar G R 2010 Phys. Rev. Lett. 105 105002 URL https://doi.org/10.1103/PhysRevLett.105.105002
- [26] Romagnani L, Fuchs J, Borghesi M, Antici P, Audebert P, Ceccherini F, Cowan T, Grismayer T, Kar S, Macchi A, Mora P, Pretzler G Schiavi A, Toncian T and Willi O 2005 Phys. Rev. Lett. 95 195001 URL https://doi.org/10.1103/PhysRevLett.95.195001
- [27] Chapman H N, Hau-Riege S P, Bogan M J, Bajt S, Barty A, Boutet S, Marchesini S, Frank M, Woods B W, Benner W H, London R A, Rohner U, Szoke A, Spiller E, Moller T, Bostedt C, Shapiro D A, Kuhlmann M, Treusch R, Plonjes E, Burmeister F, Bergh M, Caleman C, Huldt G, Seibert M M and Hajdu J 2007 Nature 448 676 URL https://doi.org/10.1038/nature06049
- [28] Peltz C, Varin C, Brabec T and Fennel T 2014 Phys. Rev. Lett. 113(13) 133401 URL https://doi.org/10.1103/PhysRevLett.113.133401
- [29] Gorkhover T, Schorb S, Coffee R, Adolph M, Foucar L, Rupp D, Aquila A, Bozek J D, Epp S W, Erk B, Gumprecht L, Holmegaard L, Hartmann A, Hartmann R, Hauser G, Holl P, Hoemke A, Johnsson P, Kimmel N, Kuehnel K U, Messerschmidt M, Reich C, Rouzee A, Rudek B, Schmidt C, Schulz J, Soltau H, Stern S, Weidenspointner G, White B, Kuepper J, Strueder L, Schlichting I, Ullrich J, Rolles D, Rudenko A, Moeller T and Bostedt C 2016 Nat. Photon. 10 93 URL https://doi.org/10.1038/NPHOTON.2015.264
- [30] Ferguson K R, Bucher M, Gorkhover T, Boutet S, Fukuzawa H, Koglin J E, Kumagai Y, Lutman A, Marinelli A, Messerschmidt M, Nagaya K, Turner J, Ueda K, Williams G J, Bucksbaum P H and Bostedt C 2016 Sci. Adv. 2 e1500837 URL https://doi.org/10.1126/sciadv.1500837
- [31] Nishiyama T, Kumagai Y, Niozu A, Fukuzawa H, Motomura K, Bucher M, Ito Y, Takanashi T, Asa K, Sato Y, You D, Li Y, Ono T, Kukk E, Miron C, Neagu L, Callegari C, Di Fraia M, Rossi G, Galli D E, Pincelli T, Colombo A, Kameshima T, Joti Y, Hatsui T, Owada S, Katayama T, Togashi T, Tono K, Yabashi M, Matsuda K, Bostedt C, Nagaya K and Ueda K 2019 Phys. Rev. Lett. 123(12) 123201 URL https://doi.org/10.1103/PhysRevLett.123.123201
- [32] Rousse A, Rischel C, Fourmaux S, Uschmann I, Sebban S, Grillon G, Balcou P, Foster E, Geindre J, Audebert P, Gauthier J and Hulin D 2001 Nature 410 65–68 ISSN 0028-0836 URL https://doi.org/10.1038/35065045
- [33] Lindenberg A, Larsson J, Sokolowski-Tinten K, Gaffney K, Blome C, Synnergren O, Sheppard J, Caleman C, MacPhee A, Weinstein D, Lowney D, Allison T, Matthews T, Falcone R, Cavalieri A, Fritz D, Lee S, Bucksbaum P, Reis D, Rudati J, Fuoss P, Kao C, Siddons D, Pahl R, Als-Nielsen J, Duesterer S, Ischebeck R, Schlarb H, Schulte-Schrepping H, Tschentscher T, Schneider J, von der Linde D, Hignette O, Sette F, Chapman H, Lee R, Hansen T, Techert S, Wark J, Bergh M, Huldt G, van der Spoel D, Timneanu N, Hajdu J, Akre R, Bong E, Krejcik P, Arthur J, Brennan S, Luening K and Hastings J 2005 Science 308 392–395 ISSN 0036-8075 URL https://doi.org/10.1126/science.1107996
- [34] Kluge T, Roedel M, Metzkes-Ng J, Pelka A, Garcia A L, Prencipe I, Rehwald M, Nakatsutsumi M, McBride E E, Schoenherr T, Garten M, Hartley N J, Zacharias M, Grenzer J, Erbe A, Georgiev Y M, Galtier E, Nam I, Lee H J, Glenzer S, Bussmann M, Gutt C, Zeil K, Roedel C, Huebner U, Schramm U and Cowan T E 2018 Phys. Rev. X 8 031068 URL https://doi.org/10.1103/PhysRevX.8.031068
- [35] Varin C, Peltz C, Brabec T and Fennel T 2012 Phys. Rev. Lett. 108 175007 URL https://doi.org/10.1103/PhysRevLett.108.175007
- [36] Strüder L, Eppa S, Rolles D, Hartmann R, Holl P, Lutz G, Soltau H, Eckart R, Reich C, Heinzinger K, Thamm C, Rudenko A, Krasniqi F, Kuehnel K U, Bauer C, Schroeter C D, Moshammer R, Techert S, Miessner D, Porro M, Haelker O, Meidinger N, Kimmel N, Andritschke R, Schopper F, Weidenspointner G, Ziegler A, Pietschner D, Herrmann S, Pietsch U, Walenta A, Leitenberger W, Bostedt C, Moeller T, Rupp D, Adolph M, Graafsma H, Hirsemann H, Gaertner K, Richter R, Foucar L, Shoeman R L, Schlichting I and Ullrich J 2010 Nuclear Instrum. Methods A 614 483 URL https://doi.org/10.1016/j.nima.2009.12.053
- [37] Schorb S, Gorkhover T, Cryan J P, Glownia J M, Bionta M R, Coffee R N, Erk B, Boll R, Schmidt C, Rolles D, Rudenko A, Rouzee A, Swiggers M, Carron S, Castagna J C, Bozek J D, Messerschmidt M, Schlotter W F and Bostedt C 2012 Applied Physics Letters 100 121107 URL https://doi.org/10.1063/1.3695163
- [38] Beye M, Krupin O, Hays G, Reid A H, Rupp D, Jong S d, Lee S, Lee W S, Chuang Y D, Coffee R, Cryan J P, Glownia J M, Föhlisch A, Holmes M R, Fry A R, White W E, Bostedt C, Scherz A O, Durr H A and Schlotter W F 2012 Appl. Phys. Lett. 100 121108 URL https://doi.org/10.1063/1.3695164
- [39] Harmand M, Coffee R, Bionta M R, Chollet M, French D, Fritz D M, Lemke H, Medvedev N, Ziaja B, Toleikis S and Cammarata M 2013 Nat. Photon. 7 215 URL https://doi.org/10.1038/nphoton.2013.11
- [40] Bostedt C, Adolph M, Eremina E, Hoener M, Rupp D, Schorb S, Thomas H, de Castro A R B and Moeller T 2010 J. Phys. B: At. Mol. Opt. Phys. 43 URL https://doi.org/10.1088/0953-4075/43/19/194011
- [41] Rupp D, Adolph M, Gorkhover T, Schorb S, Wolter D, Hartmann R, Kimmel N, Reich C, Feigl T, de Castro A R B, Treusch R, Strueder L, Moeller T and Bostedt C 2012 New. J. Phys. 14 URL https://doi.org/10.1088/1367-2630/14/5/055016
- [42] Raschpichler C, Goroncy C, Langer B, Antonsson E, Wassermann B, Graf C, Klack P, Lischke T and Rühl E 2020 J. Phys. Chem. C 124 16663–16674 URL https://doi.org/10.1021/acs.jpcc.0c04308
- [43] Niozu A, Kumagai Y, Fukuzawa H, Yokono N, You D, Saito S, Luo Y, Kukk E, Cirelli C, Rist J, Vela-Pérez I, Kameshima T, Joti Y, Motomura K, Togashi T, Owada S, Katayama T, Tono K, Yabashi M, Young L, Matsuda K, Bostedt C, Ueda K and Nagaya K 2021 Phys. Rev. X 11(3) 031046 URL https://link.aps.org/doi/10.1103/PhysRevX.11.031046
- [44] Duris J, Li S, Driver T, Champenois E G, MacArthur J P, Lutman A A, Zhang Z, Rosenberger P, Aldrich J W, Coffee R, Coslovich G, Decker F J, Glownia J M, Hartmann G, Helml W, Kamalov A, Knurr J, Krzywinski J, Lin M F, Nantel M, Natan A, O’Neal J, Shivaram N, Walter P, Wang A L, Welch J J, Wolf T J A, Xu J Z, Kling M F, Bucksbaum P H, Zholents A, Huang Z, Cryan J P, Marinelli A and Marangos J P 2020 Nat. Photon. 14 30+ ISSN 1749-4885 URL https://doi.org/10.1038/s41566-019-0549-5
- [45] Stöber W, Fink A and Bohn E 1968 J. Colloid Interf. Sci. 26 62–69 URL https://doi.org/10.1016/0021-9797(68)90272-5
- [46] Graf C and van Blaaderen A 1968 J. Colloid Interf. Sci. 26 62–69 URL https://doi.org/10.1016/0021-9797(68)90272-5
- [47] Larochelle S, Talebpour A and Chin S L 1998 Journal of Physics B: Atomic, Molecular and Optical Physics 31 1201–1214 URL https://doi.org/10.1088/0953-4075/31/6/008
- [48] Guo C, Li M, Nibarger J P and Gibson G N 1998 Phys. Rev. A 58(6) R4271–R4274 URL https://link.aps.org/doi/10.1103/PhysRevA.58.R4271
- [49] Ferguson K R, Bucher M, Bozek J D, Carron S, Castagna J C, Coffee R, Curiel G I, Holmes M, Krzywinski J, Messerschmidt M, Minitti M, Mitra A, Moeller S, Noonan P, Osipov T, Schorb S, Swiggers M, Wallace A, Yin J and Bostedt C 2015 J. Synchrot. Radiat. 22 492–497 URL https://doi.org/10.1107/S1600577515004646
- [50] Bionta M R, Lemke H T, Cryan J P, Glownia J M, Bostedt C, Cammarata M, Castagna J C, Ding Y, Fritz D M, Fry A R, Krzywinski J, Messerschmidt M, Schorb S, Swiggers M L and Coffee R N 2011 Opt. Express 19 21855–21865 URL https://doi.org/10.1364/OE.19.021855
- [51] Bionta M R, Hartmann N, Weaver M, French D, Nicholson D J, Cryan J P, Glownia J M, Baker K, Bostedt C, Chollet M, Ding Y, Fritz D M, Fry A R, Kane D J, Krzywinski J, Lemke H T, Messerschmidt M, Schorb S, Zhu D, White W E and Coffee R N 2014 Rev. Sci. Instrum. 85 083116 URL https://doi.org/10.1063/1.4893657
- [52] Glownia J M, Cryan J, Andreasson J, Belkacem A, Berrah N, Blaga C I, Bostedt C, Bozek J, DiMauro L F, Fang L, Frisch J, Gessner O, Gühr M, Hajdu J, Hertlein M P, Hoener M, Huang G, Kornilov O, Marangos J P, March A M, McFarland B K, Merdji H, Petrovic V S, Raman C, Ray D, Reis D A, Trigo M, White J L, White W, Wilcox R, Young L, Coffee R N and Bucksbaum P H 2010 Opt. Express 18 17620–17630 URL https://doi.org/10.1364/OE.18.017620
- [53] Coffee R N, Fang L and Gibson G N 2006 Phys. Rev. A 73(4) 043417 URL https://doi.org/10.1103/PhysRevA.73.043417
- [54] Zhu J, Lee S W, Ye Y, Zhao S and Wang G 2004 J. X-Ray Sci. Technol. 12 215–229
- [55] Eberly D 2019 Distance from a point to an ellipse, an ellipsoid, or a hyperellipsoid https://www.geometrictools.com/