Rapid build-up of the stellar content in the protocluster core SPT234956 at
Abstract
The protocluster SPT234956 at contains one of the most actively star-forming cores known, yet constraints on the total stellar mass of this system are highly uncertain. We have therefore carried out deep optical and infrared observations of this system, probing rest-frame ultraviolet to infrared wavelengths. Using the positions of the spectroscopically-confirmed protocluster members, we identify counterparts and perform detailed source deblending, allowing us to fit spectral energy distributions in order to estimate stellar masses. We show that the galaxies in SPT234956 have stellar masses proportional to their high star-formation rates, consistent with other protocluster galaxies and field submillimetre galaxies (SMGs) around redshift 4. The galaxies in SPT234956 have on average lower molecular gas-to-stellar mass fractions and depletion timescales than field SMGs, although with considerable scatter. We construct the stellar-mass function for SPT234956 and compare it to the stellar-mass function of galaxy clusters, finding consistent shapes between the two. We measure rest-frame galaxy ultraviolet half-light radii from our HST-F160W imaging, finding that on average the galaxies in our sample are similar in size to typical star-forming galaxies at these redshifts. However, the brightest HST-detected galaxy in our sample, found near the luminosity-weighted centre of the protocluster core, remains unresolved at this wavelength. Hydrodynamical simulations predict that the core galaxies will quickly merge into a brightest cluster galaxy, thus our observations provide a direct view of the early formation mechanisms of this class of object.
keywords:
galaxies – formation: galaxies – evolution: submm – galaxies1 Introduction
In the present day, the large-scale structure of our Universe is made up of filaments, nodes, and voids, a structure that is often described as the ‘cosmic web’. The nodes of this cosmic web are comprised of galaxy clusters, which are the largest gravitationally bound objects in the Universe. Being such fundamental building blocks, galaxy clusters are well-studied objects; we know that they are seeded by small-amplitude density fluctuations of the sort observed in the cosmic microwave background (CMB), which then grew and collapsed into the massive structures that we see today (e.g., Wright et al., 1992; Bennett et al., 2003; Springel et al., 2005). While the CMB is very well understood (e.g. Planck Collaboration I, 2020), and the details of present-day galaxy clusters are well-described (e.g., Biviano, 1998; Giodini et al., 2013; Bykov et al., 2015), the intermediate phase of evolution, which has become known as the realm of galaxy ‘protoclusters’, still lacks sufficient observations to pin down the models (e.g. Overzier, 2016).
Traditional galaxy cluster searches have made use of the fact that these objects are virialized, allowing the intergalactic gas to heat up and be detected by X-ray facilities (e.g., Rosati et al., 2009; Gobat et al., 2011; Andreon et al., 2014; Wang et al., 2016; Mantz et al., 2018) or at millimetre wavelengths via the Sunyaev-Zeldovich (SZ) effect (e.g., Planck Collaboration XXVII, 2016; Bleem et al., 2015; Huang et al., 2020). However, beyond redshifts of around 2, these signatures become too faint for practical detection. Protocluster-detection techniques now include searching large optical and infrared sky maps for overdensities of red galaxies (e.g., Martinache et al., 2018; Greenslade et al., 2018), Lyman-break galaxies (LBGs; e.g., Steidel et al., 2000; Dey et al., 2016), or Lyman- emitters (LAEs; e.g., Shimasaku et al., 2003; Tamura et al., 2009; Chiang et al., 2015; Dey et al., 2016; Harikane et al., 2019), and searching the area surrounding rare and luminous sources or groups of sources such as radio-loud active galactic nuclei (AGN; e.g., Steidel et al., 2005; Venemans et al., 2007; Wylezalek et al., 2013; Dannerbauer et al., 2014; Noirot et al., 2018) or submillimetre galaxies (SMGs; e.g., Chapman et al., 2009; Umehata et al., 2015; Casey et al., 2015; Hung et al., 2016; Oteo et al., 2018; Lacaille et al., 2019; Long et al., 2020).
Another protocluster-selection technique that has recently been gaining attention comes from experiments designed to map the CMB. These experiments typically aim to cover huge areas of the sky at submillimetre and millimetre wavelengths with resolution on the order of a few arcminutes, and in the process find some of the brightest and rarest submillimetre and millimetre sources in the sky. After the application of various selection criteria to remove Galactic sources and quasars/blazars, follow-up observations with higher-resolution telescopes have subsequently revealed that many of the remaining sources are gravitational lenses (Negrello et al., 2010; Hezaveh et al., 2013; Cañameras et al., 2015; Spilker et al., 2016), or genuine overdensities of luminous star-forming galaxies, representing ideal protocluster candidates (Planck Collaboration XXVII, 2015; Flores-Cacho et al., 2016; Miller et al., 2018; Kneissl et al., 2019; Hill et al., 2020; Wang et al., 2021; Koyama et al., 2021).
One such source, SPT234956, was discovered in the South Pole Telescope (SPT)’s extragalactic mm-wave point-source catalogue (Vieira et al., 2010; Mocanu et al., 2013; Everett et al., 2020), and is now known to contain dozens of spectroscopically-confirmed star-forming galaxies through Atacama Large Millimeter/submillimeter Array (ALMA; Wootten & Thompson, 2009) observations (Miller et al., 2018; Hill et al., 2020), several LBGs through Gemini Multi-Object Spectrograph (GMOS; Hook et al., 2004) and near-infrared wide-field imager (FLAMINGOS-2; Eikenberry et al., 2006) observations (Rotermund et al., 2021), and a number of LAEs, alongside a Lyman- blob (Apostolovski et al. in prep.), through observations with the Very Large Telescope (VLT)’s Multi Unit Spectroscopic Explorer (MUSE; Bacon et al., 2010). This protocluster lies at a redshift of 4.3, and based on observations with the Atacama Pathfinder Experiment (APEX) telescope’s Large APEX BOlometer CAmera (LABOCA; Kreysa et al., 2003; Siringo et al., 2009), has an integrated star-formation rate (SFR) of over 10,000 Myr-1 within a diameter of about 500 proper kiloparsecs, well above what is seen for a single cluster in a wide variety of cosmological simulations (Lim et al., 2021). Hydrodynamical simulations using the known galaxies in SPT234956 as the initial conditions predict that most of the galaxies in the centre of this object will merge into a single brightest cluster galaxy (BCG; Rennehan et al., 2020) over a timescale of a few hundred million years. SPT234956 is believed to be the core of a Mpc-scale protocluster, as evidenced by several infalling subhalos found around it (Hill et al., 2020).
In addition to optical observations of SPT234956 with GMOS and FLAMINGOS-2, the Spitzer Space Telescope’s InfraRed Array Camera (IRAC; Fazio et al., 2004) was used to observe this protocluster core in the infrared (Rotermund et al., 2021). These data were used to obtain rest-frame ultraviolet photometry for nine out of the 14 galaxies originally reported by Miller et al. (2018), as well as identifying four LBGs at the same redshift as the structure. While the photometric coverage was sparse, owing to the faintness of the known galaxies in the optical, initial spectral energy distribution (SED) fits suggested that the core has a stellar mass of at least M⊙, and the nine detected galaxies appeared to show significant scatter around the galaxy main sequence (MS). A search for an overdensity of LBGs out to about 1 Mpc found that the overdensity was too low to meet large-field optical survey criteria, meaning that SPT234956 would not be picked up by traditional optical surveys searching for distant protoclusters.
We have now significantly bolstered our optical and infrared coverage of SPT234956 using the Hubble Space Telescope (HST), and by increasing our Spitzer-IRAC integration time by a factor of 10. In addition, we have now identified over 30 galaxy protocluster members. In this paper, we use these new data to analyse the ultraviolet and infrared properties of this much larger sample of protocluster members.
In Section 2 we describe these new observations in detail. In Section 3 we outline our data reduction procedure, including deblending, source matching, flux density extraction, SED fitting, and profile fitting. In Section 4 we show our results, in Section 5 we discuss the implications of these observations, and the paper is concluded in Section 6.
2 Observations
2.1 HST
HST observed SPT234956 with the Wide Field Camera 3 (WFC3) instrument in the F110W and F160W filters during Cycle 26 (proposal ID 15701, PI S. Chapman). Two orbits were carried out for the F110W filter, totalling 1.6 hours on-source, and three orbits were carried out for the F160W filter, totalling 2.4 hours on-source. Since the WFC3 detector pixels undersample the PSF (the plate scale is 0.13 arcsec pixel-1, with a full width at half maximum, FWHM, around 1 pixel), the observations utilized a standard sub-pixel dither pattern in order to fully sample the PSF. The field-of-view of the WFC3 instrument is about 4.7 arcmin2, sufficiently large to image all of the protocluster members in the core, as well as the northern component. Hill et al. (2020) found CO(4–3) line emission at from three galaxies in a targeted Atacama Large Millimeter/submillimeter Array (ALMA; Wootten & Thompson, 2009) Band 3 observation of a red Herschel-SPIRE source (named ‘SPIREc’) located about 1.5 Mpc from the main structure, but these three galaxies are not covered by the HST imaging.
The data were calibrated using calwf3, part of the standard HST WFC3 pipeline wfc3tools available in python.111https://github.com/spacetelescope/wfc3tools The individual exposures were stacked using astrodrizzle; the stacking method used was the median, and sky subtraction was performed. We set the final pixel scale to be 0.075 arcsec pixel-1, approximately Nyquist sampling (i.e. sampling by a factor of 2) the beam. The final rms reached in these images is 0.50 nJy for the F110W filter (corresponding to a 5 AB magnitude limit of 30.4), and 0.79 nJy for the F160W filter (corresponding to a 5 AB magnitude limit of 29.9). 2 armin 2 arcmin cutouts of the images, smoothed by a 3-pixel FWHM Gaussian, are shown in Fig. 1.
2.2 IRAC
The Spitzer Space Telescope was used to observe SPT234956 at two wavelengths: 3.6 m and 4.5 m. A total of four observations have now been carried out since 2009, the first two of which were presented in Rotermund et al. (2021), where further details can be found. The two subsequent observations used in this paper were carried out in January 2018 (proposal ID 13224, PI S. Chapman) and October 2019 (proposal ID 14216, PI S. Chapman), and uniformly covered 3.6 m and 4.5 m with 324 100 s dithered exposures (162 exposures per observation for each channel). These new data provide a factor of 10 more exposure time, reducing the instrumental rms by a factor of about 3. Given IRAC’s very large field-of-view (about 27 arcmin2), all protocluster members known to date (including the three SPIREc sources) were covered by these observations.
Data from all four observations were combined and set to a pixel scale of 0.6 arcsec pixel-1. The final rms levels of the stacked data are 6.9 nJy at 3.6 m (corresponding to a 5 AB magnitude limit of 27.5), and 6.5 nJy at 4.5 m (corresponding to a 5 AB magnitude limit of 27.6). Cutouts showing the 2 armin 2 arcmin region around the main structure are shown in Fig. 1.
2.3 Gemini
The Gemini observations used in this paper were presented in Rotermund et al. (2021), where details of the imaging, calibration, and data reduction can be found. Here we only provide a brief summary. Since the data were taken before many new protocluster members had been confirmed, we also outline which of these new galaxies are covered by the observations.
Data were taken in the , , and bands using the GMOS instrument (Hook et al., 2004), and similarly in the band using the FLAMINGOS-2 instrument (Eikenberry et al., 2004), both of which are part of the Gemini South Observatory. The rms levels reached in these images are 0.2, 0.3, 0.6, and 15.0 nJy, respectively. For the GMOS instrument, the -, -, and -band images have a field-of-view of 5.5 arcmin2 and cover all of the core and northern sources, but not the three SPIREc galaxies located 1.5 Mpc away from the core.
Apostolovski et al. (in prep.) also reports eight LAEs at , four of which are in the central component of the protocluster, while the remaining four are found in the northern component. These eight galaxies are also covered by the GMOS imaging, and will be included in the analysis below. Finally, Rotermund et al. (2021) identified four LBGs around the core of SPT234956; they identify one of the LBGs (LBG1) with a galaxy from Hill et al. (2020) found in the ALMA data (C17), one (LBG4) with an LAE (LAE3), with the remaining two LBGs being unique. However, they note that one of their unique LBGs, LBG2, lies close to galaxy C2 from Hill et al. (2020), and could also be a counterpart. In this paper, we treat LBG2 as the counterpart to C2 as it lies within the 1 arcsec search radius criteria we outline in Section 3.3, and we include the other unique LBG, LBG3, as a separate source in our analysis below.
For the FLAMINGOS-2 instrument, the field-of-view is circular with a diameter of 6.1 arcmin. While this field-of-view is large enough to cover all of the core and northern sources described above, due to a lack of nearby guide stars within the field, we were only able to cover the central sources and a few northern sources down to a depth suitable for the detection of the target galaxies in our sample. These include the 23 galaxies from Hill et al. (2020) found through their [Cii] emission, NL1, NL3, N3, five LAEs, and the LBG. Fig. 1 shows 2 armin 2 arcmin cutouts for each of these four Gemini fields, smoothed by a 3-pixel FWHM Gaussian.


3 Data analysis
3.1 Gemini and HST flux density measurements
We first matched our GEMINI GMOS, FLAMINGOS-2, and HST F110W astrometry to our HST-F160W astrometry using the python package astroalign (Beroiz et al., 2020), which identifies bright stars in source and target images and estimates a transformation matrix that aligns the stars in the target image with the same stars in the source image. We note that we are unable to apply this step to our ALMA data because there are no bright sources easily identifiable in both our HST-F160W imaging and our ALMA imaging; however, as shown below, after matching sources across both images we do not find any significant systematic offsets.
We ran source-extractor (Bertin & Arnouts, 1996) on our GEMINI-GMOS and FLAMINGOS-2 images to extract a catalogue of sources and measure their flux densities. The detection images were smoothed with circular Gaussian kernels having FWHMs of three pixels, equivalent to 0.225 arcsec, as part of the source detection process. Sources were required to consist of at least 3 connected pixels lying 0.8 above the local background. – in source-extractor this means setting DETECT_MINAREA to 3 and DETECT_THRESH to 0.8. These parameters are similar to the ones used by Rotermund et al. (2021), who set DETECT_MINAREA to 3 and varied DETECT_THRESH between 1.1 and 2.5, depending on the band.
The photometry was measured in the unsmoothed images at the locations of the sources identified in the smoothed detection images using the FLUX_BEST option in source-extractor, which selects either the flux measured in an adaptively-scaled elliptical aperture (FLUX_AUTO) or sums the pixels found above the chosen threshold, with a correction for missing flux in the wings of the objects (FLUX_ISOCOR). When crowding becomes an issue, the FLUX_AUTO apertures start double counting the flux densities in pixels. For a given source, if 10 per cent of the FLUX_AUTO measurement comes from other sources, FLUX_ISOCOR is chosen, otherwise FLUX_AUTO is chosen.
HST WFC3 source catalogues were produced using source-extractor as well, using the same input parameters described above, except we required nine adjacent pixels to be above 1.2 times the background rms. This setup is similar to the source-extractor parameters used in the Cosmic Assembly Near-infrared Deep Extragalactic Legacy Survey (CANDELS; Galametz et al., 2013) in the ‘hot’ mode, which is optimized to detect small and faint galaxies.
3.2 IRAC deblending and flux density measurements
Owing to Spitzer’s poor angular resolution compared to Gemini and HST, source blending can become a serious issue, especially in crowded regions like the centre of SPT234956. To tackle this issue, we use the publicly-available code t-phot (Merlin et al., 2015, 2016), which uses a high-resolution source catalogue as a prior to deblend a low-resolution, blended image.
To construct an optimal high-resolution catalogue, we stacked (as a weighted mean) both of our F110W and F160W HST images. We then ran source-extractor with a higher detection threshold (DETECT_MINAREA 9 and DETECT_THRESH 2.0), since having too many faint galaxies used as priors with t-phot leads to unrealistic deblending. We also turned off source deblending by setting DEBLEND_MINCONT to 1. This means that within a collection of pixels found above the predefined threshold, local maxima will not be classified as individual sources. This step is necessary because t-phot becomes unreliable when given blended priors. We output a segmentation map from source-extractor, which is used in conjunction with the catalogue in t-phot.
The code t-phot requires that the pixel scale of the input prior catalogue is an integer multiple of the low-resolution image, and is also aligned to the same pixel grid. To satisfy these criteria, we used the same astroalign code to align our IRAC data to our high-resolution HST data, and then we used the python function reproject_interp from the module reproject to reproject our IRAC images onto our combined HST image, thus making the IRAC pixels a factor of 8 smaller.
t-phot also requires a convolution kernel that can be used with the high-resolution segmentation image to produce the low-resolution template. Assuming that the galaxies in our HST image are resolved, the appropriate kernel would simply be the IRAC PSF. However, owing to the variation in sensitivity across each IRAC pixel, a more complex point response function (PRF) is more appropriate. A set of 5 5 PRFs are available from the NASA/IPAC Infrared Science Archive,222https://irsa.ipac.caltech.edu/data/SPITZER/docs/irac/calibrationfiles/psfprf/ where each PRF is the response from a point source illuminating a position on a pixel divided up into a 5 5 grid. For the convolution kernel, we selected the PRF corresponding to a point source illuminating the centre of a pixel. The provided PRFs have a pixel scale of 0.24 arcsec pixel-1, and we used the same reproject function to reproject these pixels to the high-resolution pixel scale of 0.075 arcsec pixel-1.
Some sources of interest are not detected in the combined HST image, but are clearly seen in both channels of the IRAC data. For these sources, t-phot enables one to provide a second catalogue of unresolved priors as a list of positions that will be treated as delta functions before being convolved with the kernel. Five galaxies from Hill et al. (2020) fit this category, and were provided to t-phot as unresolved priors, namely C4, C5, C9, C10, and NL1.
With these inputs in hand, we then ran t-phot in two passes. The first pass convolves the high-resolution segmentation image with the kernel, and fits an amplitude to each source to best match the low-resolution image. The second pass cross-correlates the model image with the low-resolution image in order to compute small positional shifts for each source, and then fits for the amplitudes a second time.
Since our high-resolution HST imaging did not cover the SPIREc sources, their flux densities were measured independently. We performed aperture photometry at the positions of the three SPIREc sources, using an aperture with a radius of 4 pixels (2.4 arcsec), and applied aperture corrections of 1.208 and 1.220 for the 3.6 m band and the 4.5 m band, respectively (from the IRAC Instrument Handbook333https://irsa.ipac.caltech.edu/data/SPITZER/docs/irac/iracinstrumenthandbook/1/). SPIREc1 and SPIREc3 are both clearly detected and we were able to measure their flux densities with high signal-to-noise ratio (SNR). SPIREc2 is not a clear detection by eye, and the flux density in the aperture at 3.6 m is consistent with noise, but at 4.5 m we were able to measure a signal.
3.3 Source matching
In order to perform a multiwavelength analysis of the SEDs of these galaxies, we need to match our sources detected in high-resolution (sub)millimetre imaging to their counterparts in our optical and infrared imaging. This becomes complicated due to the fact that the (sub)millimetre imaging is detecting emission from dust, while the ultraviolet to near-infrared imaging is detecting emission from starlight (including extinction by dust). A galaxy’s morphology can be quite complicated in detail, with patches of dust and stars that will not necessarily overlap one another from our line of sight (e.g. Goldader et al., 2002). Additionally, although we have tied the all of the optical and infrared astrometry to the HST F160W frame, we are not able to perform this step to our submm imaging, although the ALMA astrometry relative to that of HST has been measured to be accurate within 0.1 arcsec (e.g., Dunlop et al., 2017; Franco et al., 2018).
Theoretically, the 1 uncertainty of our ALMA-derived positions is given by
| (1) |
where FWHM is the size of the synthesized beam, and SNR is the signal-to-noise ratio of the peak pixel (Ivison et al., 2007). For our ALMA positions, the synthesized beam is about 0.5 arcsec (Hill et al., 2020), so we expect the 1 angular position uncertainty to be 0.3 arcsec/SNR. Since the probability density of finding a source at an angle from its true position is proportional to , one must go out to a distance of 3.42 in order to find a correct match with 99.7 per cent (or 3) certainty. For our ALMA positions, the lowest (spatial) SNR used to measure a position was about 4, meaning a 3 search should go out to about 0.3 arcsec. However, this becomes more complicated in practice due to the fact that the (sub)millimetre and optical images could have different morphologies, especially for the case of mergers. Previous studies matching ALMA galaxies to HST counterparts have used radial searches around 0.6–1 arcsec (e.g., Dunlop et al., 2017; Long et al., 2020), and here we also adopt 1 arcsec, corresponding to about 6.9 proper kiloparsecs. For comparison, the typical submm size of the galaxies in our sample is about 4 proper kiloparsecs (twice the half-light radius, see Hill et al., 2020).
A source is thus considered a match if it lies within 1 arcsec from the ALMA-derived positions provided in Hill et al. (2020), and we allow the possibility of multiple matches; multiple optical counterparts to a submm source are possible if the submm source is a merging galaxy, for example. For cases where a counterpart is less than 1 arcsec from two ALMA galaxies, we assign the match to the closest ALMA galaxy. Despite the comparatively large beamsize of the IRAC imaging, we use the same 1 arcsec matching criteria, since the IRAC positions are nearly identical to the high-resolution HST imaging, which is simply a result of using t-phot for the photometry. Also, for reference, 1 arcsec corresponds to 6.3 pixels in the GMOS images, 13.4 pixels in our WFC3 images, 5.6 pixels in the FLAMINGOS-2 image, and 1.7 pixels in the IRAC images.
Next, we take advantage of our extensive wavelength coverage by imposing the additional constraint that a counterpart is not detected in the band – this is simply because at , the band probes a galaxy’s rest-frame SED at 900 Å, where these galaxies should be much fainter than the sensitivity limit of our Gemini data because of neutral hydrogen’s efficiency at absorbing light at this wavelength. In other words, if we find a counterpart within 1 arcsec that is also bright in the band, we assume that it is a line-of-sight interloper, and remove the match from our sample. This criteria removes the matches to C1, C11, C20, C23, and N3. For the LAEs, this criteria removes LAE1. A galaxy 0.4 arcsec east of LAE4 is also detected in the band, but we see that in the and bands an extension appears 0.4 arcsec to the north of this source, which our HST data resolves as a second galaxy. Since the eastern galaxy is detected in the band but the northern one is not, we only call the northern galaxy a match to LAE4.
The Gemini-detected source near C1 (bright in the band and removed from our sample) was confirmed to be a foreground 2.54 galaxy by Rotermund et al. (2021) using spectroscopy with the VLT, validating our submm-matching criteria. However, the observed [Oiii] line strength suggests a stellar mass much smaller than what the IRAC flux densities (2.6 and 2.9 Jy at 3.6 and 4.5 m, respectively) would imply. Quantitatively, Rotermund et al. (2021) place an upper limit on the stellar mass of the foreground galaxy of M⊙ based on an [Oiii] linewidth of 53 km s-1. Zhu et al. (2010) propose a scaling relation between stellar mass and IRAC continuum flux densities using colours as a proxy for star-formation history, which we use to place an upper limit to the contribution of the measured IRAC flux density from this foreground galaxy. We measure a colour of , corresponding to upper limits of L⊙ and L⊙ at 3.6 and 4.5 m, respectively, or Jy and Jy. Thus, since this foreground galaxy likely contributes less than 2 per cent to the measured IRAC flux density at the position of C1, we assign all of the measured IRAC flux density to C1.
Lastly, we look by eye for consistent matches across all the data and make sure sources are not double-matched. C3, C12, C13, C16, C22, and C23 are very close to C6, which is clearly the dominant galaxy in the core of the protocluster at the wavelengths covered by HST. In the IRAC imaging, C6 and these six sources are blended within a single beam, yet we expect that nearly all of the measured flux density can be attributed to only C6, as it is 25 times brighter than its surrounding galaxies in the HST imaging. We thus assign all of the flux density within a larger 1.5 arcsec region to C6, while providing upper limits for the nearby galaxies.
In Appendix A, Fig. 13, we show the resulting positional differences between our matching criteria outlined above and the ALMA positions given in Hill et al. (2020), defined as the ALMA position minus the optical/infrared position. We find counterparts in at least one image to 21/29 ALMA-identified galaxies, as well as the single LBG, and 4/6 LAEs. Four galaxies are found to have two counterparts in our F110W image, three have two counterparts in our F160W image, and one has three counterparts in our F110W image. In Fig. 13 we show the mean offset found in each band surrounded by a circle whose semi-major and semi-minor axes are equal to the standard deviations of the offsets in each direction. We find a slight offset in the negative direction of RA arcsec (consistent across all wavebands, since the astrometry has been tied to a single frame); this could mean that there is a slight mismatch between the HST astrometry and the ALMA astrometry, but an adjustment of this size would have no effect on our results.
We investigate the purity of our source matches by running our matching algorithm on random locations within each map, allowing us to calculate a false positive rate by taking the ratio of the matches to the number of random locations tested. Using 1000 random locations, we find false positive rates of 0.08, 0.06, 0.23, 0.20, and 0.12 for the , , F110W, F160W, and bands, respectively. For reference, our detection rates are 0.32, 0.34, 0.61, 0.47, and 0.25 for the same bands, which are factors of 2–5 higher than the false positive rates. These values are upper limits to the true false positive rates, since we are requiring an optical/infrared-detected galaxy to be less than 1 arcsec from a submm source (i.e. an ALMA-detected galaxy), which is much less common than a match between two optical/infrared-detected galaxies.
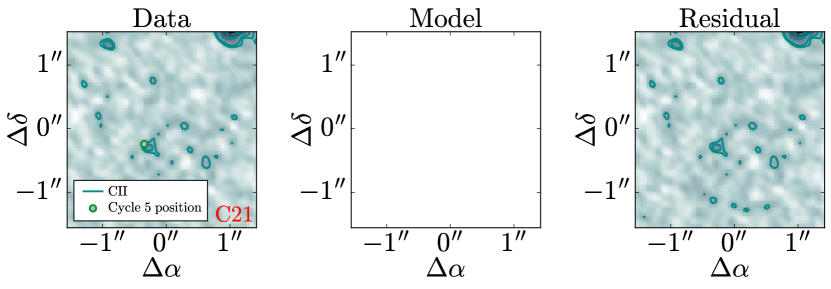
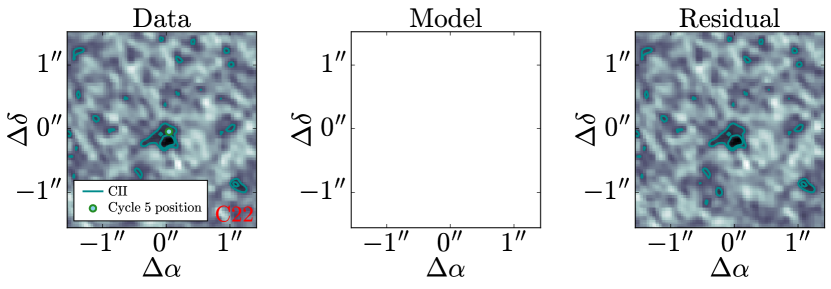
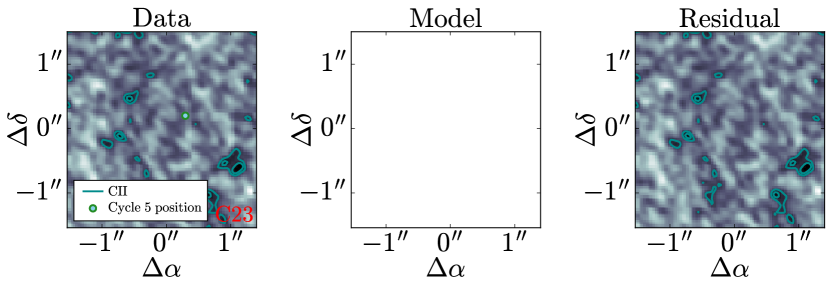
For cases where we found no counterpart match, we estimate upper limits by calculating the mean flux density measurement uncertainty within a given band. We also add the local background to these non-detection upper limits, calculated within a 3 pixel-diametre circular region centred on the source. This takes into account the fact that C1 is blocked by a foreground galaxy in the GMOS and HST imaging (see Rotermund et al., 2021), so the only upper limit we can place is that it must be fainter than the interloping foreground galaxy. This is also necessary in the IRAC imaging where confusion and source blending is a reason for many non-detections around galaxy C6. Lastly, we make a 2 cut to the photometry measurements of the matched sources. In Table 1 we provide the resulting flux densities and upper limits for each source, and in Appendix B we show 1212 arcsec cutouts of each source at each wavelength. We note that there are known bad pixels in our HST data near C21 (in both the F110W and F160W filters as it is a property of the WFC3 detector), but they are outside of the aperture used to measure the flux density of this source.
We compare our resulting optical measurements to the flux densities reported in Rotermund et al. (2021), who used slightly different apertures (a fixed diametre of 1.6 arcsec for the , , and images, and FLUX_AUTO for the image) and source-extractor parameters. We find that we do not detect C2 in the band, nor C6 in the band, but that we detect sources C2 and C14 in the image, and C2 and C14 in the image. In terms of the overlapping detections, we find good agreement between the flux density measurements. In the IRAC infrared imaging, we identify counterparts to all the galaxies in Rotermund et al. (2021), except C3 and C13 that are blended with C6, which is expected because the data used here are significantly deeper. The IRAC measurements reported in Rotermund et al. (2021) are systematically larger than those reported here, by average factors of 1.7 and 2.1 at 3.6 and 4.5 m, respectively. This is also expected, since Rotermund et al. (2021) did not attempt to deblend the IRAC sources while here we did, meaning that the flux inside their fixed apertures should be larger on average due to surrounding source leakage.
| Name | ||||||||
|---|---|---|---|---|---|---|---|---|
| [Jy] | [Jy] | [Jy] | [Jy] | [Jy] | [Jy] | [Jy] | [Jy] | |
| C1 (A) | 0.032 | 0.043 | 0.045 | 0.057 | 0.103 | 0.19 | 2.60.3 | 2.90.3 |
| C2 (J) | 0.010 | 0.0710.013 | 0.1830.020 | 0.2950.009 | 0.3810.020 | 0.25 | 2.70.4 | 3.20.3 |
| C3 (B) | 0.006 | 0.006 | 0.013 | 0.034 | 0.055 | 0.26 | 5.4 | 5.6 |
| C4 (D) | 0.002 | 0.014 | 0.019 | 0.028 | 0.052 | 0.17 | 1.10.3 | 1.10.3 |
| C5 (F) | 0.003 | 0.003 | 0.019 | 0.031 | 0.060 | 0.22 | 0.90.3 | 1.00.3 |
| C6 (C) | 0.006 | 0.0610.011 | 0.014 | 0.3620.006 | 1.6010.012 | 4.780.28 | 9.80.4 | 9.80.3 |
| C7 (K) | 0.006 | 0.009 | 0.012 | 0.0820.010 | 0.1960.019 | 0.10 | 2.10.3 | 2.20.3 |
| C8 (E) | 0.006 | 0.0240.008 | 0.1460.020 | 0.2610.014 | 0.2420.015 | 1.370.34 | 3.90.4 | 4.20.3 |
| C9 (I) | 0.006 | 0.006 | 0.014 | 0.034 | 0.054 | 0.44 | 0.90.3 | 1.30.3 |
| C10 (H) | 0.005 | 0.006 | 0.022 | 0.0370.004 | 0.060 | 0.510.18 | 0.70.3 | 0.70.3 |
| C11 (L) | 0.013 | 0.001 | 0.017 | 0.030 | 0.054 | 0.31 | 1.2 | 1.3 |
| C12 | 0.007 | 0.019 | 0.022 | 0.034 | 0.064 | 0.22 | 3.8 | 4.0 |
| C13 (G) | 0.007 | 0.013 | 0.024 | 0.0280.004 | 0.055 | 0.57 | 4.5 | 4.3 |
| C14 (N) | 0.012 | 0.0370.008 | 0.0510.011 | 0.1640.013 | 0.1670.015 | 0.450.13 | 2.10.3 | 1.80.3 |
| C15 | 0.011 | 0.015 | 0.0760.021 | 0.1470.009 | 0.2130.018 | 0.27 | 1.30.3 | 1.10.3 |
| C16 | 0.013 | 0.010 | 0.021 | 0.034 | 0.063 | 0.21 | 3.0 | 2.7 |
| C17 (M) | 0.009 | 0.1200.012 | 0.3170.025 | 0.3710.009 | 0.5510.020 | 0.990.19 | 1.60.5 | 1.20.4 |
| C18 | 0.012 | 0.017 | 0.011 | 0.2400.010 | 0.2230.017 | 0.17 | 0.7 | 0.8 |
| C19 | 0.006 | 0.007 | 0.022 | 0.032 | 0.062 | 0.16 | 0.9 | 1.0 |
| C20 | 0.016 | 0.010 | 0.021 | 0.026 | 0.061 | 0.23 | 1.7 | 1.8 |
| C21 | 0.013 | 0.027 | 0.3510.016 | 0.3730.009 | 0.3430.014 | 0.32 | 1.30.4 | 1.10.4 |
| C22 | 0.011 | 0.006 | 0.012 | 0.030 | 0.055 | 0.37 | 1.0 | 1.0 |
| C23 | 0.013 | 0.016 | 0.024 | 0.034 | 0.051 | 0.19 | 1.4 | 1.3 |
| NL1 | 0.005 | 0.012 | 0.021 | 0.026 | 0.058 | 0.30 | 0.90.3 | 1.60.3 |
| NL3 | 0.2300.012 | 0.4150.019 | 0.5420.033 | 1.6280.018 | 3.3080.029 | 5.150.36 | 8.80.4 | 10.40.3 |
| N1 | 0.009 | 0.006 | 0.015 | 0.1150.007 | 0.1990.017 | … | 2.20.3 | 3.00.3 |
| N2 | 0.009 | 0.003 | 0.1120.019 | 0.0940.007 | 0.0930.014 | … | 1.00.3 | 0.70.3 |
| N3 | 1.1760.018 | 1.5610.027 | 1.9240.039 | 5.6440.027 | 8.2890.044 | 10.760.46 | 18.80.4 | 22.30.4 |
| NL2 | 0.0610.006 | 0.0720.009 | 0.1800.016 | 0.3370.012 | 0.4420.018 | … | 1.90.4 | 1.70.3 |
| SPIREc1 | … | … | … | … | … | … | 13.00.3 | 19.40.3 |
| SPIREc2 | … | … | … | … | … | … | 0.8 | 0.70.3 |
| SPIREc3 | … | … | … | … | … | … | 4.90.3 | 6.80.3 |
| LBG3 | 0.011 | 0.0770.011 | 0.4370.024 | 0.2510.014 | 0.3290.020 | 0.36 | 1.1 | 1.1 |
| LAE1 | 0.031 | 0.040 | 0.056 | 0.051 | 0.088 | 0.37 | 0.8 | 0.7 |
| LAE2 | 0.007 | 0.005 | 0.026 | 0.033 | 0.047 | 0.31 | 1.0 | 0.9 |
| LAE3 | 0.005 | 0.0540.011 | 0.016 | 0.0500.005 | 0.061 | 0.12 | 0.3 | 0.3 |
| LAE4 | 0.021 | 0.028 | 0.043 | 0.0440.006 | 0.0660.008 | 0.530.17 | 0.5 | 0.4 |
| LAE5 | 0.010 | 0.1070.010 | 0.0570.011 | 0.0780.006 | 0.0890.009 | … | 0.4 | 0.3 |
| LAE6 | 0.013 | 0.006 | 0.010 | 0.0300.004 | 0.057 | … | 0.5 | 0.5 |
| LAE7 | 0.008 | 0.006 | 0.013 | 0.0520.007 | 0.052 | … | 0.5 | 0.4 |
| LAE8 | 0.003 | 0.0820.012 | 0.1390.018 | 0.2040.010 | 0.0520.006 | 0.17 | 1.6 | 1.2 |
-
•
aGemini-GMOS continuum flux densities at 0.48 m (the band), 0.63 m (the band), and 0.78 m (the band).
-
•
bHST-WFC3 continuum flux densities at 1.1 m (the F110W filter) and 1.5 m (the F160W filter).
-
•
cGemini-FLAMINGOS-2 continuum flux densities at 2.1 m (the band).
-
•
dSpitzer-IRAC continuum flux densities at 3.6 m and 4.5 m.
3.4 SED fitting
To estimate the physical properties of the galaxies belonging to the SPT234956 protocluster system, we used CIGALE (Burgarella et al., 2005; Noll et al., 2009; Boquien et al., 2019) to fit SEDs to the available photometry. This includes all of the photometric data provided in Table 1, as well as the 850 m, 1.1 mm, and 3.2 mm photometry from Hill et al. (2020). We also input 1 upper limits to the photometry for non-detections, and include Herschel-SPIRE 250, 350, and 500 m constraints from Miller et al. (2018).
CIGALE models a galaxy’s rest-frame optical and ultra-violet spectrum using simple stellar population models with variable star-formation histories, including nebular emission lines, and incorporates a flexible dust attenuation curve that allows the slope and strength of the ultraviolet bump to vary. The thermal dust emission is modeled assuming a power-law dust temperature distribution, and energy balance is imposed such that the energy absorbed by dust, primarily at rest-frame ultraviolet and optical wavelengths, is approximately equal to that re-radiated in the infrared, allowing for discrepancies due to non-isotropy from the ultraviolet and optical emission. In our fits we assumed a delayed star-formation history with a single exponential timescale. The SFR as a function of time is parameterized by
| (2) |
where is the timescale, effectively the time at which the star-formation peaks, and a free parameter of the model. The total current stellar mass, , in this model is found by varying the duration of the star-formation, assuming a Chabrier initial mass function (IMF; Chabrier, 2003) with solar metallicity. The assumed star-formation history can have an effect on the resulting stellar mass (up to a factor of 2, see Michałowski et al. 2012), although we did not find a large variation in the results after testing several of the available models. Another free parameter is the dust attenuation, given by the amount of extinction present in the band in magnitudes, , which we model using the Calzetti et al. (2000) attenuation curve with a variable power-law slope. The dust is modeled following Draine et al. (2014), where the dust is separated into a diffuse component heated by the interstellar radiation field, and a compact component linked to star-forming regions and heated by a variable radiation field. The total dust mass sets the overall normalization.
To obtain posterior distributions for the parameters in the fits, CIGALE generates a grid of possible SEDs, and calculates for each SED. These values are then translated to a global likelihood function, assuming the likelihood is proportional to . Marginalized posterior distributions are then calculated for the free parameters, and CIGALE returns the mean values and standard deviations of these distributions. The resulting stellar masses are given in Table 2, and the best-fit SEDs are shown in Appendix C. Where parameter uncertainties overlap with 0, we provide 1 upper limits. For galaxies C12, C16, C20, C22, C23, LAE1, and LAE2, only upper limits are available for their photometry across all wavelengths (both submm and optical/infrared), so we do not attempt to fit SEDs and derived stellar masses.
The best-fit CIGALE ttoal stellar masses range from about 1010–10M⊙. The Rotermund et al. (2021) stellar masses are larger than those estimated here in proportion to their reported IRAC flux densities (they differ because we use t-phot to improve the IRAC flux density estimates). As a final check, from the fits we calculated the SFR averaged over the past 100 Myr, and compared these to the SFRs estimated from fitting modified blackbody functions to the far-infrared photometry in Hill et al. (2020); the two estimates are in good agreement considering the simple SFH adopted by our SED models, with a median ratio of far-infrared SFR-to-CIGALE SFR of 1.1.
3.4.1 Galaxy N3
In Fig. 14 we see that the centroid of N3 lies right on top of a bright and fully resolved spiral galaxy. N3 was initially identified by Hill et al. (2020) using ALMA in Band 3 through the detection of a CO line at 86.502 GHz, consistent with the frequencies of the CO lines detected in the other protocluster galaxies, and it was assumed that the CO transition was 4–3, placing the redshift at 4.3. However, the coincident position of the CO emission with a resolved spiral galaxy could mean that the CO emission observed is actually from another transition at lower redshift. While an alternative explanation is that there is a genuine protocluster galaxy responsible for the CO emission behind this nearby spiral galaxy, here we investigate the photometric redshift of the spiral galaxy to see if it could in fact emit a CO line at the frequency where a line was observed.
To do this, we used all of our available photometry (Table 1 plus the photometry in Hill et al. 2020) to estimate a photometric redshift using CIGALE. When CIGALE is not provided a spectroscopic redshift, it includes a photometric redshift as an additional free parameter, generating an extra dimension of redshifted SEDs before calculating the of each model. Photometric redshift uncertainties are computed by converting the of each model to a likelihood, and computing the corresponding marginalized probability distribution for the redshift. The resulting photometric redshift is found to be 1.70.3; the only CO transition consistent with this redshift is the 2–1 transition at 230.538 GHz, which would make the spectroscopic redshift of N3 1.665. Since this redshift matches the photometric redshift quite well, for the remainder of this paper we take this galaxy to be a foreground source at and remove it from the subsequent analyses.
3.4.2 Submm sources with no line detection
Three galaxies were found in our ALMA observations of SPT234956 through their continuum only (designated NL in Hill et al. 2020), making them potential line-of-sight interlopers. In order to verify this hypothesis, we ran CIGALE on the complete set of photometry available for these galaxies (Table 1, and the photometry provided in Hill et al. 2020) in order to estimate photometric redshifts. For NL1, we found a photometric redshift of 4.30.7; while this is consistent with the redshift of SPT234956, we do not include it in any subsequent analyses because the uncertainties are still large. Further follow-up will be needed to confirm the membership of this source. For the remaining two galaxies, NL2 has a photometric redshift of 2.70.7, and for NL3 the photometric redshift is 2.20.5, so these are indeed most likely galaxies in the foreground of the protocluster.
| Name | |||||
|---|---|---|---|---|---|
| [kpc] | [kpc] | [1010 M⊙] | [Gyr] | ||
| C1 (A) | – | 2.910.02 | 22.221.3 | 0.340.32 | 0.0740.018 |
| C2 (J) | 1.260.76 | 2.570.03 | 4.51.9 | 0.460.21 | 0.1000.026 |
| C3 (B) | – | 1.330.04 | 112.6 | – | 0.0460.011 |
| C4 (D) | – | 1.900.01 | 24.0 | – | 0.0530.013 |
| C5 (F) | – | 2.220.02 | 21.8 | – | 0.0240.007 |
| C6 (C) | 0.470.16 | 1.300.04 | 10.93.4 | 0.310.10 | 0.0580.014 |
| C7 (K) | – | 2.220.03 | 3.01.9 | 0.330.22 | 0.1190.033 |
| C8 (E) | 1.450.71 | 1.210.03 | 11.14.1 | 0.210.08 | 0.0510.013 |
| C9 (I) | – | 1.420.03 | 18.0 | – | 0.0490.014 |
| C10 (H) | – | 1.140.03 | 1.51.1 | 0.770.57 | 0.0600.016 |
| C11 (L) | – | 1.400.04 | 6.7 | – | 0.0840.043 |
| C12 | – | – | – | – | – |
| C13 (G) | – | 1.000.09 | 7.56.8 | 0.110.10 | 0.0430.011 |
| C14 (N) | – | 0.390.10 | 3.41.3 | 0.060.04 | 0.0460.030 |
| C15 | – | – | 1.20.6 | – | – |
| C16 | – | – | – | – | – |
| C17 (M) | 1.760.83 | 1.590.06 | 1.20.5 | – | – |
| C18 | – | – | 0.60.4 | – | – |
| C19 | – | – | 4.8 | – | – |
| C20 | – | – | – | – | – |
| C21 | – | – | 1.00.5 | – | – |
| C22 | – | – | – | – | – |
| C23 | – | – | – | – | – |
| NL1 | – | – | – | – | – |
| NL3 | – | – | – | – | – |
| N1 | 1.040.87 | … | 4.71.7 | 2.560.96 | 0.0750.019 |
| N2 | – | … | 1.00.6 | 4.842.68 | 0.0660.022 |
| N3 | – | … | – | – | – |
| NL2 | – | … | – | – | – |
| SPIREc1 | … | … | 39.334.0 | 0.170.15 | – |
| SPIREc2 | … | … | 4.5 | – | – |
| SPIREc3 | … | … | 12.311.0 | 0.200.18 | – |
| LBG3 | 1.090.62 | … | 0.60.4 | – | – |
| LAE1 | – | … | – | – | – |
| LAE2 | – | … | – | – | – |
| LAE3 | – | … | 0.1 | – | – |
| LAE4 | – | … | 0.50.4 | – | – |
| LAE5 | – | … | 0.10.1 | – | – |
| LAE6 | – | … | 0.8 | – | – |
| LAE7 | – | … | 0.40.3 | – | – |
| LAE8 | – | … | 0.8 | – | – |
-
•
aBest-fit rest-frame ultraviolet half-light radius, obtained by fitting Sérsic profiles to all sources detected in our HST F160W imaging with sufficient SNR (see Section 3.5).
- •
- •
-
•
dMolecular gas-to-stellar mass fraction, , with values taken from Hill et al. (2020).
-
•
eDepletion timescale, SFR, with and SFR values taken from Hill et al. (2020).
3.5 Rest-frame ultraviolet profile fitting
We next investigate the morphological profiles of some of the brighter galaxies detected in our F160W image (observed-frame 1.54 m, or 290 nm in the rest-frame). We are interested in the characteristic sizes of the unobscured stellar emission, compared to their sizes as seen in the submm, where the emission is due to dust and star-formation, thus we choose the longest wavelength covered by our HST data. However, 290 nm is still in the ultraviolet, where most of the flux density is due to young O and B stars.
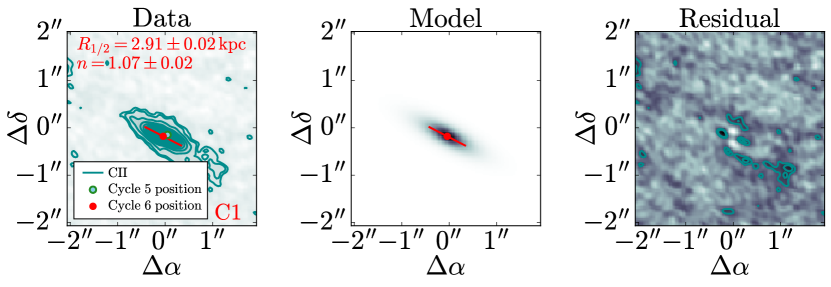
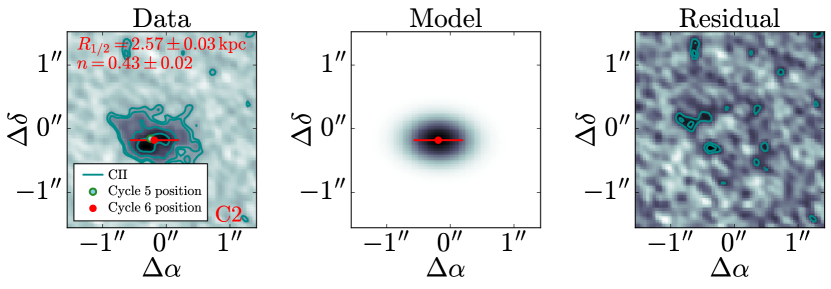
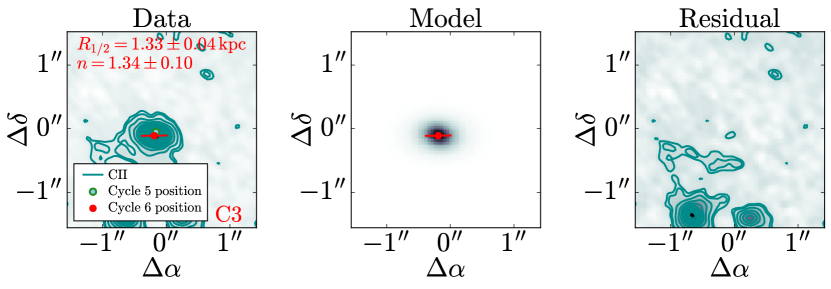
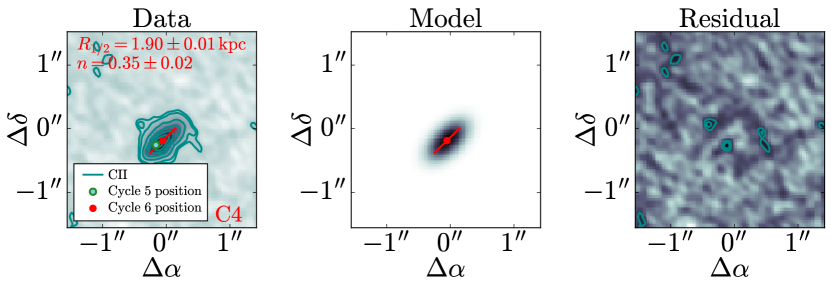
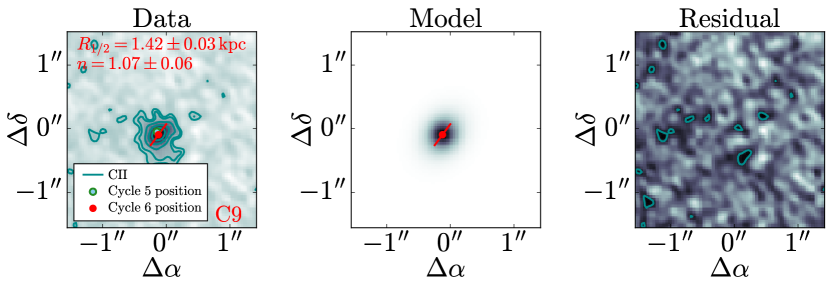
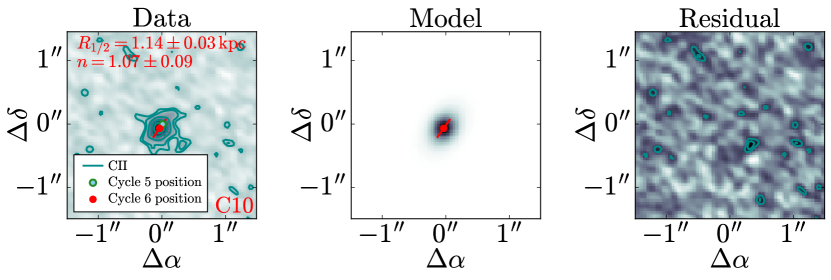
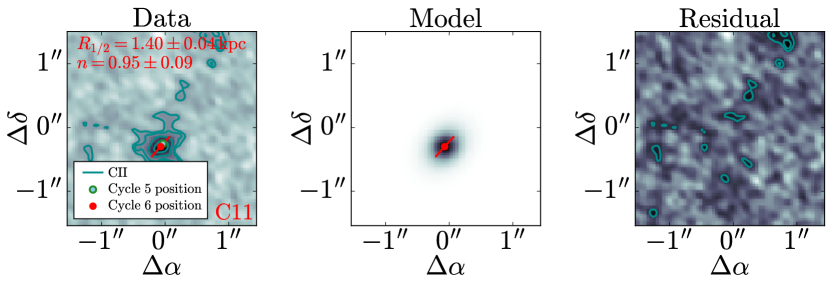
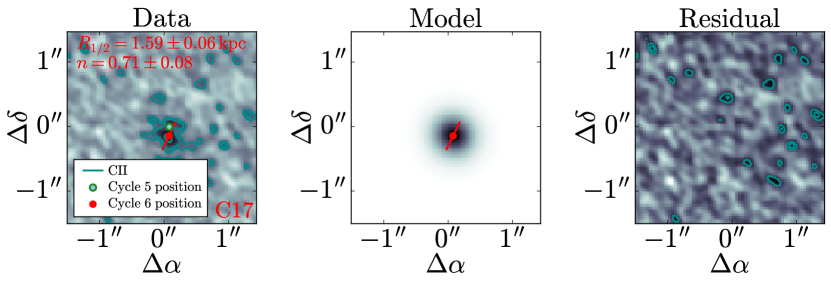
We created 2 arcsec2 arcsec cutouts around each protocluster member galaxy in our sample (except for NL3 and LAE1 where we made 3 arcsec3 arcsec cutouts), and fit elliptical 2D Sérsic profiles (allowing the Sérsic index to vary) convolved with the HST beam to the sources with optical counterparts containing pixels greater than 5 times the background rms; the relevant sources are C2, C6, C8, C17, N1, and LBG3. While C21 reaches 5 times the background rms as well, we remove it from this analysis due to the nearby bad pixels. We use the HST F160W PSF available from the Space Telescope Science Institute (STScI) instrumentation website,444https://www.stsci.edu/HST/instrumentation/wfc3/data-analysis/psf taking the PSF corresponding to the response from a point source illuminating the centre of a pixel. The available PSF model supersamples the pixel plate scale of 0.13 arcsec by a factor of 4, and we regrid the PSF model to match the pixel scale of our F160W imaging. This PSF is convolved with each galaxy’s profile to produce our models; this is the same modelling technique used in popular profile-fitting packages such as galfit (Peng et al., 2002, 2010). The resulting beam-deconvolved half-light radii (the length of the semi-major axes of an ellipse containing half the total flux density) are provided in Table 2, and our models are shown in Appendix D. We find half-light radii ranging from 1.1 kpc to 1.8 kpc, except for one outlying source, C6, where we find a half-light radius of 0.5 kpc. For reference, the corresponding half-light radius of the HST F160W beam is about 0.5 kpc, implying that only galaxy C6 is not resolved. The Sérsic indices range from 0.3 to 2.3.
Since most of our HST detections are faint and cannot be fit on an individual basis, we performed a stacking analysis in order to evaluate the average rest-frame ultraviolet profile. As we ultimately want to compare this to the average submm profile, we focused on the subset of our sample with corresponding high-resolution ALMA data at 850 m (as detailed in the section below). These include all of the galaxies in the core region of SPT234956 (C1–C23). We removed C1 from the analysis as the HST detection at its position is a foreground galaxy, and we removed C21 due to the nearby bad pixels. We also excluded C6 since it is clearly an outlier in terms of brightness at this wavelength, and this galaxy will be subject to its own separate analysis.
The position at which to centre each cutout for the stack is crucial. In order to obtain an unbiased image of the rest-frame ultraviolet light of submm sources, one should centre the rest-frame ultraviolet images on the positions of the submm sources. However, in practice there are physical offsets between rest-frame ultraviolet light and submm light, so this may not be the best choice. Here we choose to centre the cutouts at the position of the peak HST counterpart for cases where one is detected, and otherwise at the position of the peak pixel in each galaxy’s average [Cii] map, which provides the highest positional accuracy owing to the brightness of the line (see Hill et al., 2020). We also masked pixels above 25 (after verifying that this did not mask any sample sources) to remove bright nearby objects not associated with the galaxies in the stack.
The resulting image is shown in Fig. 2. Following the same steps as above, we fit a Sérsic profile to the stack, and our best-fit model and residual are shown alongside the data. We find a half-light radius of 1.240.29 kpc and a Sérsic index of 0.75 0.60, consistent with the sizes found for the individual galaxies and an exponential profile of . Similarly, we find an axis ratio of 1.0 0.3, as expected for stacking random orientation angles.
Systematic uncertainties in structural parameters are known to be important for low SNR sources; for example, van der Wel et al. (2012) found that basic size parameterizations can be determined for galaxies detected in the F160W filter down to about 24.5 mag. For reference, the galaxies in our sample with a peak pixel SNR used to obtain size measurements span a range of 23.4–25.7 mag, thus we wish to investigate possible systematic uncertainties and biases. To do this, we simulate F160W maps at the SNRs of the sources where we have fit Sérsic profiles. Our simulation covers a grid of Sérsic indices from 0.3 to 2.5 and half-light radii from 0.4 to 2 kpc, and for each Sérsic index and half-light radius we generate three independent maps. Sérsic profiles are convolved with the F160W beam, and Gaussian random noise is added to the background such that the peak pixel has the SNR of the given source. For each input half-light radius we calculate the mean and standard deviation of the recovered half-light radii for all values of input Sérsic indices (effectively marginalizing over this parameter). For the wide range of Sérsic indices tested, our algorithm recovers an unbiased estimate of the true half-light radius at all SNRs tested, with scatters of around 0.6 kpc at SNR 5 and 0.4 kpc at SNR 10. In Table 2 we include this systematic uncertainty in quadrature with the statistical errors. The uncertainties in our Sérsic indices are large (often overlapping with 0), and a similar test of the recovered Sérsic indices from our simulation indicates systematic uncertainties of order at a SNR of 5. For the lowest SNR sources our best-fit Sérsic indices are therefore not likely meaningful, however at the SNRs of our stack and C6 (16 and 112, respectively), the systematic uncertainties are smaller than the statistical uncertainties.
3.6 [Cii] sizes
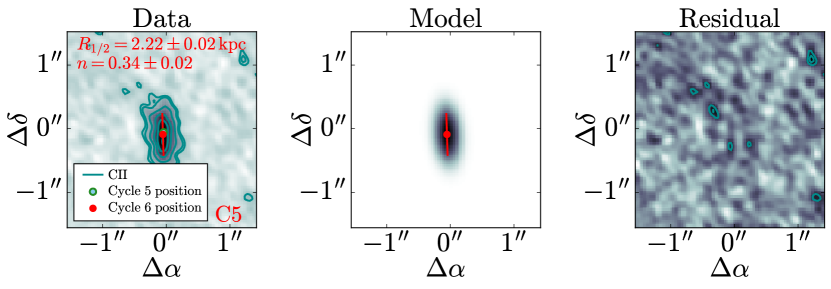
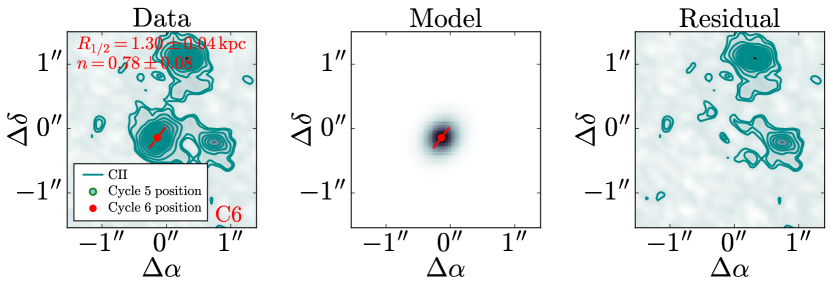
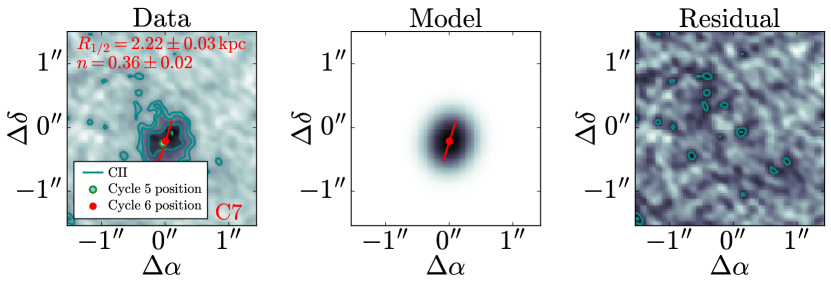
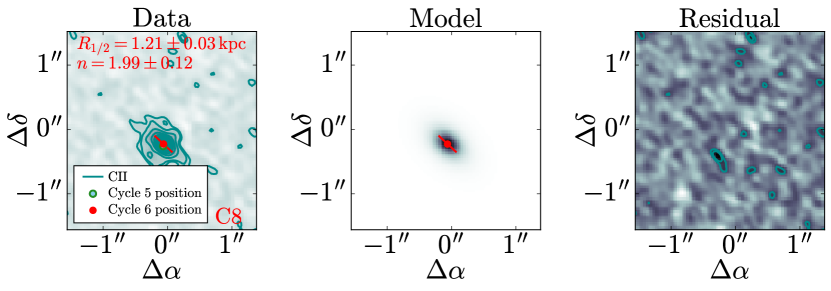
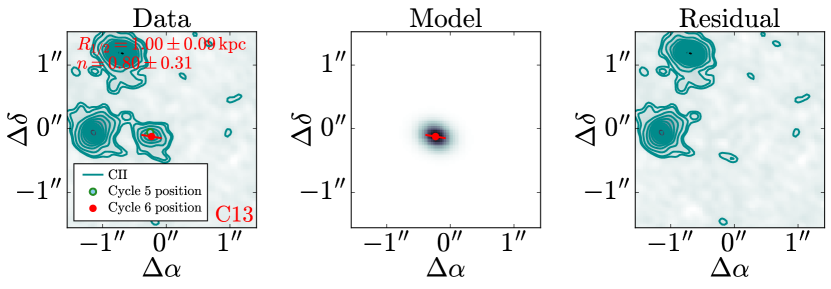
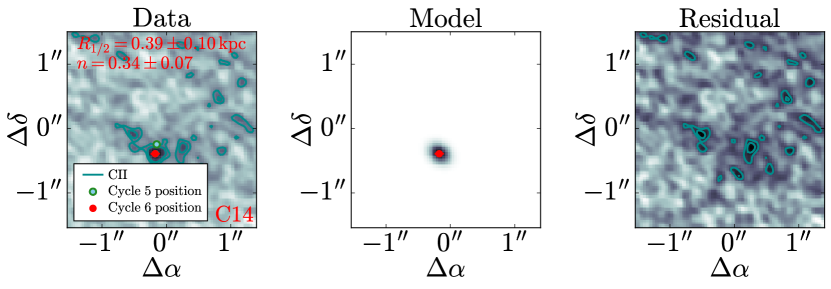
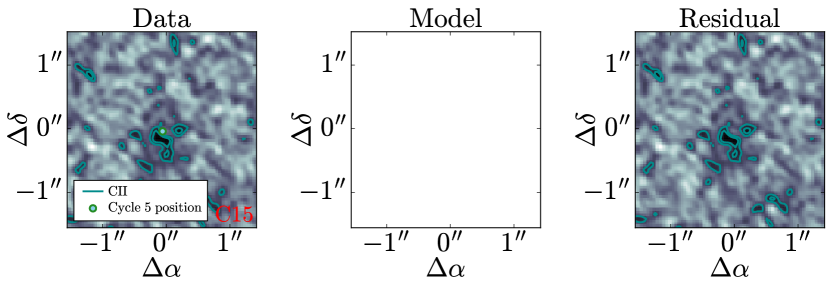
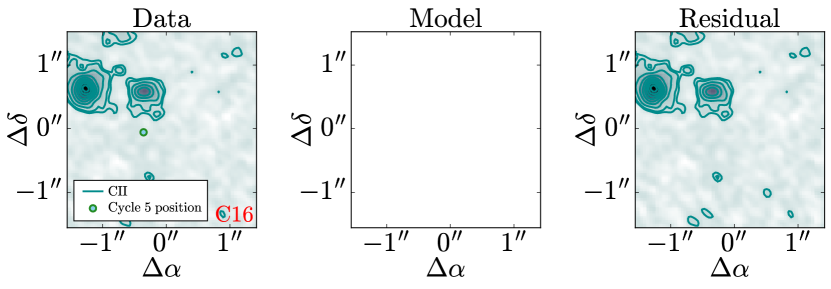
Following the method outlined above and in Hill et al. (2020), we also fit Sérsic profiles to cutouts of each galaxy’s extended [Cii] emission. Line emission channels were determined from lower-resolution, deeper ALMA data by fitting Gaussian profiles to the spectra, from which we averaged the high-resolution channels from to (where is the standard deviation of the best-fitting linewidth), or for cases where two Gaussians was a better fit, from to , where and are from the left and right Gaussian fits, respectively. 2 arcsec2 arcsec cutouts were made around each source, and models were fit to sources with pixels detected above 5 times the background rms by convolving a Sérsic profile with the data’s synthesized beam. We allowed the position, position angle, ellipticity, half-light radius, and Sérsic index to vary in our fits. The results are provided alongside our ultraviolet profile fits in Table 2, and the models are shown in Appendix E. We find half-light radii in the range of 1.0 to 2.9 kpc, except for one outlying source, C14, which has a half-light radius of about 0.4 kpc. For reference, the half-light radius of the ALMA synthesized beam is about 0.7 kpc, implying that only C14 is not resolved. The Sérsic indices found range from 0.3 to 2.0.
We next determined the average submm-continuum profile following the same stacking procedure done for our HST data. High resolution continuum maps were already presented in Hill et al. (2020), obtained by stacking the line-free channels. We selected the same galaxies as in the HST analysis (i.e. each core galaxy except for C1, C6, and C20), and centred the cutouts on the peak of the average [Cii] map. We then fit a Sérsic profile to the stack, and found a half-light radius of 1.180.01 kpc with a Sérsic index of 1.22 0.03. Similarly, we find an axis ratio of 0.9 0.1, overlapping with 1 as expected for stacking random orientation angles. The stack, along with the fit, is shown in Fig. 2.


4 Results
4.1 The galaxy main sequence
A primary quantity of interest is the galaxy main-sequence (MS), which is the SFR of a galaxy as a function of its stellar mass (e.g. Elbaz et al., 2011), and is commonly used to identify starbursts and quenched galaxies and therefore can place these protocluster galaxies in the context of galaxy evolution. Recently, Rotermund et al. (2021) estimated stellar masses for 14 member galaxies of SPT234956 using SED fits to Gemini and Spitzer photometry, albeit shallower than presented here, and compared these to the MS. With our improved optical, infrared, and mm-wavelength coverage, as well as a more detailed IRAC deblending algorithm and an expanded catalogue of protocluster galaxies, we are able to expand on this work in much greater detail.
In Fig. 3 (top left panel) we show the stellar masses derived in this paper as a function of SFR. The SFRs shown here were derived in Hill et al. (2020) by fitting modified blackbody distributions to the far-infrared photometry observed by ALMA, since the SFRs produced from our SED fitting could be less reliable due to dust obscuration. In the fits, was fixed to 2, and the dust temperature, , was fixed to 39.6 K (the temperature consistent with the mean ratio of the measured 850 m flux density to the measured 3.2 mm flux density of the sample). In Hill et al. (2020) the best-fit SEDs were then integrated between 42 and 500 m to obtain far-infrared luminosities, but here we integrate from 8 to 1000 m to obtain more complete infrared luminosities in order to be consistent with comparison samples; this increases the luminosities by a factor of 1.17. These values were converted to SFRs using a factor of 0.95M⊙ yr-1 L (from Kennicutt 1998, modified for a Chabrier initial mass function; see Chabrier 2003). The core galaxies of SPT234956 (defined as those lying within a 90 kpc-radius of the far-infrared luminosity-weighted centre, where the primary-beam response of the ALMA observation used to find protocluster members falls to 0.5, see Hill et al. 2020) are of interest because simulations predict that they will merge into a BCG on a timescale of a few hundred Myr (Rennehan et al., 2020). We have highlighted these galaxies in black in Fig. 3. We also show the LAEs and LBGs of this sample as squares in order to distinguish them from the primary submm-selected galaxies making up the core of this protocluster.
For comparison, we also show in Fig. 3 the galaxies found in a similar star-forming protocluster, the Distant Red Core (DRC; Oteo et al., 2018; Long et al., 2020), found at redshift 4. For these protocluster galaxies, the stellar masses were also obtained through optical and infrared SED fitting, while infrared luminosities were derived by scaling the mean template from the ALMA follow-up programme of the LABOCA ECDF-S Submillimetre Survey (ALESS; Simpson et al., 2014) to match their continuum observations at 2 mm; we applied the same scale factor used in our work to obtain SFRs.
To see how these protocluster galaxies compare with field galaxies, we focus on samples of high-redshift SMGs, since the SFRs of SMGs typically exceed 100 M⊙, which accounts for the majority of our sample. We show the SMGs from the ALESS survey, originally selected as bright 870-m point sources in the Extended Chandra Deep Field South (ECDF-S; Simpson et al., 2015), with stellar masses derived by da Cunha et al. (2015) by fitting SEDs to optical and infrared photometry, and for the SFRs we converted the infrared luminosities from Swinbank et al. (2014) (obtained by fitting a modified blackbody SED to the available far-infrared photometry) to SFRs using a conversion factor of MyrL. We also show a sample of field SMGs around from Scoville et al. (2016) that were initially selected in a representative fashion from the Cosmic Evolution Survey (COSMOS) field; for these galaxies, stellar masses were also estimated from SED fits to optical and infrared photometry, and the SFRs were derived from rest-frame ultraviolet and infrared continuum measurements, adopting a factor of 2 uncertainty as recommended in the paper. The final field sample in this comparison comes from a follow-up survey of 707 SMGs detected in the Ultra Deep Survey (UDS) field (Dudzevičiūtė et al., 2020), from which we have taken all galaxies with photometric redshifts between 4 and 5. Here the stellar masses and far-infrared luminosities were obtained by fitting SEDs to photometric data ranging from rest-frame optical to radio wavelengths, and we have converted the far-infrared luminosities to SFRs using the standard conversion factor. While we cannot entirely rule out the possibility that some of these field galaxies are in fact in protocluster environments, none of them are in known protoclusters, nor are any of them located in environments as overdense in the submm as SPT234956 or the DRC.
Next, we show galaxies from the ALMA Large Program to INvestigatE (ALPINE) survey (Le Fèvre et al., 2020; Béthermin et al., 2020; Faisst et al., 2020) between and ; for the ALPINE galaxies, stellar masses were obtained by fitting SEDs to optical and infrared photometry, and we have taken their infrared luminosities (scaled from 850 m continuum detections assuming a model template of MS galaxies) and converted these to SFRs using the same factor of 0.95M⊙ yr-1 L. We then show the best-fit MS obtained from the ALPINE survey (Khusanova et al., 2021); we note that the parameterization found by the ALPINE survey is consistent with previously-derived MS parameterizations from e.g. Speagle et al. (2014) at . For reference, we show a scatter of a factor of 2 around the MS, the intrinsic scatter proposed by Schreiber et al. (2015).
We see that the galaxies in SPT234956 follow the MS derived by the ALPINE survey, although with considerable scatter, along with the other samples of field SMGs and the star-forming galaxies from the ALPINE survey. To investigate this in detail, in Fig. 3 (top right panel) we show the SFRs in SPT234956 divided by the SFRs predicted by the ALPINE MS for each galaxy’s measured stellar mass. We include the field SMGs from the samples described above, as well as the individual star-forming galaxies from the ALPINE survey.
In order to assess the difference between protocluster galaxies to field galaxies around , we combine our sample of protocluster galaxies with those from the DRC, and compare them to the ALESS, COSMOS, and UDS SMGs. Since the SFR is log-normally distributed at a given stellar mass (e.g. Speagle et al., 2014; Schreiber et al., 2015), we compute the weighted mean and weighted standard deviation of the logarithm of the two samples. The weighted mean SFRSFRMS for the protocluster galaxies is 0.13, with a weighted standard deviation of 0.46, while for the field SMGs the weighted mean SFRSFRMS is 0.16, with a weighted standard deviation of 0.43. These values are plotted on Fig. 3 for reference.
We perform an unequal-variance -test on the SFRSFRMS values of each sample. Assuming the two samples in question are drawn from Gaussian distributions, the unequal-variance score is a statistic used to test the hypothesis that the two distributions have equal means and arbitrary variances. It is worth noting that we are only testing the means of the two samples, meaning that even if they have overlapping scatter, we may still reject the null hypothesis that the means are equal. Using this test, we find a -value of 0.72, which can be interpreted as the probability that the means are the same. From this comparison we cannot reject the null hypothesis that the protocluster galaxies in these samples are different from field galaxies in terms of the MS. However, we emphasize that there could be large systematic errors present, owing from differences in modelling the SEDs used to fit the available photometry to obtain stellar masses; for example, different functional forms for the SFH can be assumed, and there are numerous models of dust extinction available.


4.2 Molecular gas-to-stellar mass fractions
Another mass measurement available for the protocluster galaxies in SPT234956 is the molecular mass, and a useful evolutionary diagnostic is to see if the molecular gas-to-stellar mass fraction scales with the total stellar mass built-up so far. We define the molecular gas-to-stellar mass fraction as
| (3) |
where is the molecular gas mass and is the stellar mass.
We use the molecular gas masses derived in Hill et al. (2020). Briefly, the CO(4–3) transition was observed by ALMA, and line strengths were measured for sources where the line was detected. The CO(4–3) line strength was converted to a CO(1–0) line strength using a factor of 0.60 (the mean line strength ratio of the SPT-SMG sample from Spilker et al. 2014), and then this was converted to a molecular gas mass using a conversion factor of M(K km s-1 pc2), similar to other studies of SMGs (see e.g., Aravena et al., 2016; Bothwell et al., 2017). The resulting molecular gas-to-stellar mass fractions are given in Table 2; we find values ranging from about 0.04 to 5. Interestingly, since our stellar masses are lower than the values provided by Rotermund et al. (2021), we estimate larger values of , which is in better agreement with the simulations analyzed by Lim et al. (2021). However, these simulations still predict that protocluster galaxies have values between 1 and 5, which is only reached by two galaxies (N1 and N2) in our sample.
Figure 3 (bottom left panel) shows our molecular gas-to-stellar mass fractions as a function of stellar mass (with the core galaxies again highlighted), compared with the galaxies from the DRC (Oteo et al., 2018; Long et al., 2020), where we have converted their CO(6–5) line intensities to molecular gas masses using an factor of 0.46 (the mean ratio found for the SPT-SMG sample, see Spilker et al. 2014) and an of 1 M(K km s-1 pc2) (the same scale factor used for our sample).
To compare protocluster galaxies with field galaxies around , we require a sample with molecular gas masses estimated with similar CO transition tracers. A recent CO survey of SMGs selected from the COSMOS field, the UDS field, and the ALESS sample spanning –5 was carried out by Birkin et al. (2021), and we have selected the galaxies from this survey with to use as a field comparison here; this corresponds to four galaxies from the COSMOS field, two galaxies from the UDS field, and nine galaxies from the ALESS sample. All of the galaxies in this sample were originally detected as bright submm sources in large single-dish surveys with SCUBA-2 and LABOCA, and have extensive multiwavelength follow-up observations. The detected lines range from CO(5–4) to CO(2–1), and we use the mean line ratios of the sample to convert these line intensities to the CO(1–0) transition, with the CO(2–1)-to-CO(1–0) ratio fixed to 0.9 (for reference, the mean CO(4–3)-to-CO(1–0) ratio was found to be 0.32, compared to 0.60 used for the SPT234956 galaxies). We then adopt an of 1 M(K km s-1 pc2) for this reference sample. Stellar masses are provided for each source, derived by fitting SEDs to the extensive photometry available in these fields. For comparison with a sample of high- galaxies that are not SMGs, we include the galaxies from the ALPINE survey here by deriving molecular gas masses from the published [Cii] luminosities, following the prescription outlined in Dessauges-Zavadsky et al. (2020); however, since the [Cii] line is a different tracer, we cannot provide any quantitative comparisons with the samples of CO-derived gas masses.
We again combine our sample of protocluster galaxies with the DRC, and compare this to the sample from Birkin et al. (2021). Looking at Fig. 3 (bottom left panel) we see that the molecular gas-to-stellar mass also appears log-normally distributed, so we calculate the weighted mean and weighted standard deviation of the logarithm of each sample. The weighted mean of protocluster galaxies is 0.45, with a weighted standard deviation of 0.54, while for the field galaxies we find a weighted mean of 0.05, with a weighted standard deviation of 0.72 (see Fig. 3). A similar unequal-variance -test on the values results in a -value of 0.04. While these results do provide evidence that the mean molecular gas-to-stellar mass fractions of protocluster galaxies are not the same as those of field galaxies (the null hypothesis can be rejected with per cent confidence), we nonetheless note that there could still be systematic uncertainties unaccounted for in this analysis.
4.3 Depletion timescales
A similar quantity of interest is the gas depletion timescale, which is a measure of the amount of time required to convert all of the available mass in gas into mass in stars if the current star-formation rate were to remain constant. This quantity is defined as
| (4) |
where this time is divided by the SFR.
In Table 2 we provide estimates of the depletion timescale for each galaxy with a measurement of molecular gas mass (via CO(4–3) line detection) and SFR (via far-infrared photometry). The galaxies in SPT234956 have depletion timescales ranging from 0.05 to 0.1 Gyr.
In Fig. 3 (bottom right panel) we show our depletion timescales as a function of stellar mass. In order to compare with the same field SMGs from Birkin et al. (2021), we take their provided far-infrared luminosities, obtained by fitting SEDs with the available photometry, and multiply them by the usual factor of 0.95M⊙ yr-1 L. We also show the protocluster galaxies from the DRC, and we include the same ALPINE galaxies for reference to a sample of non-SMGs.
We find that the depletion timescales appear on average smaller in protocluster galaxies than in field SMGs. We take the same log-normal approach to quantify this difference, finding that the weighted mean for the protocluster galaxies (again combining SPT234956 and the DRC) is 1.28, with a weighted standard deviation of 0.18, and the weighted mean for the field galaxies from Birkin et al. (2021) is 0.85, with a weighted standard deviation of 0.26 (see Fig. 3). We therefore find that the depletion timescales for protocluster galaxies are smaller than for field galaxies, as there is very little overlap between the two distributions. The resulting -value from an unequal-variance -test is 5.3, thus we can reject the null hypothesis that the mean values of the two populations are the same. Lastly, the star-forming galaxies from the ALPINE survey have longer depletion timescales than all of the SMGs in this comparison.
4.4 The stellar mass function
Our large sample of protocluster galaxies with stellar mass estimates allows us to compute the stellar mass function of star-forming galaxies in several different ways. Of most interest is what the stellar mass function of the whole protocluster looks like in comparison to lower- clusters. However, we know that the core galaxies in SPT234956 will merge into a single BCG within a few hundred Myr (Rennehan et al., 2020), so we would also like to know what the stellar mass function will look like after the merger by summing their masses.
To start, we address the stellar mass completeness of our sample. Most of the galaxies in our sample were selected from line emission surveys in the submm, but others were found through their Ly- emission or selected as LBGs, making a detailed completeness calculation difficult. Therefore, we begin by simply considering the initial sample of [Cii] and CO(4–3)-selected galaxies (C1–C23, N1, and N2), and include LBG3 as this galaxy also shows significant [Cii] emission (Rotermund et al., 2021). We do not include the three SPIREc sources, since they are at a large projected distance where our submm imaging is not complete.
Next, in Table 2 we see that 15 of the 26 galaxies in this subsample have stellar mass estimates available, thus a lower limit to the completeness of all of our stellar masses is about 60 per cent. We also have stellar mass upper limits available for most of the undetected sources, however they are of the order M⊙ and are not very constraining. Instead, we can turn to our IRAC 3.6 m imaging, which is a good tracer of stellar mass, probing rest-frame wavelengths of 680 nm with good resolution where the large populations of low-mass stars emit. In Fig. 4 we show our derived stellar masses as a function of for all of the galaxies in our subsample with both quantities available. We see a tight correlation between the two quantities, as expected, and a best-fit power law of the form , with fixed to 1 Jy, gives M⊙ and . Using this functional form, we can take the 3.6 m flux density measurements and upper limits for the 11 remaining galaxies with no stellar mass measurements and calculate their expected stellar masses and stellar mass upper limits. We again find that all of the galaxies have upper limits of M⊙, meaning that our stellar mass subsample is 100 per cent complete above M⊙, while five galaxies have upper limits of M⊙, so our stellar mass subsample is about 80 per cent complete above M⊙. However, this completeness estimate does not take into account potentially variable dust extinctions between the galaxies, and given the large overall uncertainties in stellar mass estimates, we are not able to provide completeness corrections, so below we present the number counts of our complete subsample and stress the uncertainties.
Figure 5 (top panels) shows the differential and cumulative number counts of the stellar masses of all the galaxies in our restricted sample. We have normalized our counts by the volume of a sphere of radius 360 kpc, which is the distance between the core and northern components of SPT234956 (see Hill et al., 2020). The true normalization is highly uncertain, but in this analysis we are only interested in the shape of the mass function. We compare this protocluster star-forming stellar mass function to the stellar mass function of a typical galaxy cluster (van der Burg et al., 2013), obtained by stacking cluster galaxies from a sample of 10 clusters (including their BCGs) within 1 Mpc of the cluster cores. (van der Burg et al., 2013) separate star-forming galaxies from field galaxies, but we have taken their total number counts as we expect our sample to be more representative of the total counts of SPT234956. We set the normalizing volume to be the volume of 10 spheres of radius 1 Mpc, and again emphasize that the absolute normalization here is uncertain but has no effect on the shape of the counts. While this reference sample contains galaxies within a larger proper volume than probed by our ALMA data (1 Mpc versus 360 kpc), previous studies of galaxy clusters have found that best-fit parameterizations of stellar mass number counts do not vary considerably when calculated within radii ranging from 0.5 to 2 (where is around 1 Mpc, see van der Burg et al., 2018); the slope, , ranges from 0.8 to 1.0, while the characteristic mass, , remains constant within the uncertainties. Therefore, we expect our conclusions would remain unchanged if the comparison sample were limited to galaxies within 360 kpc, as with our sample. Qualitatively, we see that the shapes of the number counts are in agreement with one another for masses above 10M⊙.
Next, we compute the differential and cumulative number counts of the molecular gas masses in SPT234956 using the values provided in Hill et al. (2020) for the same galaxies in our restricted sample. These functions are shown alongside the stellar mass function in Fig. 5 (top panels). We find that the molecular gas mass function effectively tracks the stellar mass function.
We then assess the state of the number counts after the merger of the BCG galaxies by summing the masses of all the galaxies within 90 kpc of the far-infrared luminosity-weighted centre (i.e. the region simulated by Rennehan et al. 2020 where the mergers will take place), and treating this as a single point. These are shown alongside our other number counts in Fig. 5 (bottom panels) for comparison. We see that the shapes become linear (in log-log space), and the final mass of the merged galaxies is comparable to the masses of the largest galaxies in the sample. The amplitude of our counts is also larger than the cluster counts at these high-mass bins, although since the normalizations are highly uncertain, we cannot draw any conclusions from this excess.


We next fit our protocluster mass functions to functional forms using a maximum-likelihood approach (e.g., Marshall et al., 1983; Wall et al., 2008; Hill et al., 2020), where we minimize the negative log-likelihood of our stellar mass measurements assuming that all sources were selected from data of equal depth:
| (5) |
In this equation is the sample size, is the model differential stellar mass number count (in units of M Mpc-3), is the volume of the survey, and are the mass limits of the sample (which we take to be between the smallest and largest masses in the sample), and is a constant independent of the model. We investigate two models, a single power-law and a Schechter function. The single power-law has two free parameters, a normalization and a power-law index; explicitly,
| (6) |
where is the slope of the power law, is the overall normalization, and is fixed to M⊙ and is not a free parameter of the model. For the Schechter function, is not fixed but treated as a free parameter, describing the point at which the number counts transition from a power law to an exponential:
| (7) |
We use a Markov chain Monte Carlo (MCMC) approach to minimize the log-likelihood, and calculate the odds ratio between a single power-law fit and a Schechter fit (simply ) to assess which model better-describes the data. We find that a Schechter function is more appropriate for the total protocluster number counts, and that a single power-law function is more appropriate for the protocluster containing a BCG. The resulting fit parameters are provided in Table 3 (where the values are the means of the posterior distributions, and the uncertainties are 68 per cent confidence intervals), and in Fig. 5 we show the best-fit functions, where the shaded regions were calculated by varying the best-fit parameters within their 68 per cent confidence intervals and taking the largest difference.
We would now like to quantitatively compare our number counts to the stellar mass function of clusters found by van der Burg et al. (2013). To do this, we note that van der Burg et al. (2013) provide a best-fit Schechter function to the stellar mass number counts measured for a cluster. They find a characteristic stellar mass of M⊙ and a slope of 0.46 (we ignore the normalization here because it is highly uncertain for our sample). For reference, in Fig. 5 we show their best-fit Schechter function as a shaded region encompassing the uncertainties of their best-fit parameters. The characteristic stellar mass found for our total protocluster is M⊙ and the slope found is 0.4, which is not statistically different from the parameters of van der Burg et al. (2013) given the uncertainties, although we emphasize that the uncertainties are large both due to our small sample size and incompleteness and so we cannot make any further conclusions about the evolution of the star-forming stellar mass function.
| Component | Function | |||
|---|---|---|---|---|
| [10M] | [10M⊙] | |||
| Protocluster, stellar mass | 8 | 10.6 | -0.4 | |
| Protocluster, gas mass | 22 | 4.9 | -0.1 | |
| BCG, stellar mass | 7 | 1a | -1.2 | |
| BCG, gas mass | 39 | 1a | -1.6 |
-
•
aThis parameter was fixed during the fitting.
4.5 Ultraviolet versus far-infrared sizes
Many studies have looked at the physical extent of stellar emission compared to dust emission in SMGs (e.g. Simpson et al., 2015; Lang et al., 2019), finding that the dust emission (and hence the star formation), probed by rest-frame far-infrared observations, is typically more smooth and compact, while the optical stellar emission is clumpy and extended, likely due to patchy dust attenuation (e.g. Cochrane et al., 2019). Although the HST imaging probes a slightly different population of stars in the ultraviolet, we emphasize that HST is still currently the best facility for performing these measurements on objects at such high redshift. The forthcoming James Webb Space Telescope (JWST) will operate at the longer wavelengths needed to resolve the average stellar populations in SPT234956, and we will carry out the measurements when the facility becomes available. On the other hand, our 850-m ALMA observations probe the rest-frame at 160 m where the dust is expected to be bright. There are also known correlations between a galaxy sizes and quantities such as SFR, stellar mass, and redshift, the most studied likely being the size-mass relation (e.g., Shen et al., 2003; van der Wel et al., 2014; Mowla et al., 2019). All these correlations can be examined in a high-redshift protocluster environment using the galaxies in SPT234956.
Figure 6 (left panel) shows the derived rest-frame ultraviolet galaxy sizes as a function of SFR, compared to a sample of field SMGs from Swinbank et al. (2010) (with corresponding SFR estimates from Chapman et al. 2005), which were observed by the ACS instrument onboard HST in the F775W filter (observed wavelength 770 nm). These SMGs were selected from SCUBA surveys of various other cosmological fields, and the rest wavelengths probed by the observations range from 170 to 450 nm, comparable to our coverage of 290 nm. We next show a sample of three field dusty star-forming galaxies from Barro et al. (2016) that were observed by the ACS F850LP filter (910 nm in the observed frame, 260 nm in the rest frame). These galaxies were selected from the CANDELS survey of the Great Observatories Origins Deep Survey-South (GOODS-S) field (Grogin et al., 2011) for their compact nature and brightness at far-infrared wavelengths, thus follow-up observations found them to be reasonably bright at submm wavelengths (mJy at 870 m) and have large SFRs (M⊙ yr-1), so we simply refer to them as SMGs. In these comparison samples, the Sérsic index was allowed to vary, and the half-light radii are the semi-major axes of an ellipse containing half the total flux density, consistent with our definition of the half-light radius.
We also include star-forming galaxies in the range –5 from the ALPINE survey with reliable fits to imaging in both HST’s F160W filter and in ALMA moment-0 maps of [Cii] line emission (Fujimoto et al., 2020); for these galaxies, the rest-wavelength observed in the ultraviolet ranges from 230 to 280 nm. For these measurements, the Sérsic index was fixed to , but the authors note that fixing affected their size measurements only at the per cent level. For comparison, the mean Sérsic index from our fits is 0.84. Fujimoto et al. (2020) only provides circularized sizes, defined with respect to our size measurements as , where is the semi minor-to-semi major axis ratio. In order to statistically convert this sample to semi-major axis sizes, we assume that the galaxies are circular discs with finite thickness parameterized by the ratio of the scale height to the disc radius, , thus the relationship to the observed semi minor-to-semi major axis ratio is (e.g. Förster Schreiber et al., 2018), where is the inclination angle. We take (e.g., Genzel et al., 2008; Law et al., 2012; van der Wel et al., 2014), and calculate the average expected assuming an isotropic distribution of galaxy orientations following the method outlined in Appendix A of Law et al. (2009). We find , so we divide the ALPINE size measurements by this value. As a check, we calculated circularized sizes for our sample using the best-fit axis ratios from our Sérsic modelling and compared these directly to the ALPINE circularized size measurements, but did not find any systematic differences. For reference, we show the half-light radius of the HST F160W PSF (approximately half the FWHM of 0.151 arcsec) as a horizontal dashed line.
Figure 7 (left panel) shows the rest-frame ultraviolet sizes as a function of stellar mass. Also shown are the same comparison samples, with stellar masses taken from the same studies except for the field SMGs from Swinbank et al. (2010), where we use stellar masses obtained by Michałowski et al. (2012), and we show the size of our stack (arbitrarily placed at 10M⊙) and the HST F160W PSF. Lastly, in Fig. 8 (left panel) we show rest-frame ultraviolet sizes as a function of spectroscopic redshift. Although no trends in SFR or stellar mass are apparent, the Swinbank et al. (2010) SMGs are typically larger than the other comparison samples shown here, although this is to be expected owing to their larger stellar masses (Fig. 7) and the known size-mass relation (e.g. van der Wel et al., 2014).
We next turn to our rest-frame far-infrared sizes of galaxies in SPT234956, taken from Hill et al. (2020), which were calculated using the same procedure as the [Cii] sizes outlined in Section 3.6, only in this case after averaging the line-free ALMA channels. Fig. 6 (right panel) shows these size measurements as a function of SFR, and compare them to the same field galaxies from Barro et al. (2016) (which measure the rest-frame far-infrared at 250 m). In this comparison we have included the same galaxies from the ALPINE survey with [Cii] size measurements from Fujimoto et al. (2020) (corrected by the mean squareroot of the axis ratio expected from an isotropic distribution, ), and we have converted these [Cii] size measurements to rest-frame far-infrared size measurements using the mean ratio from our sample (described below). Again, the fits to the ALPINE galaxies were done with the Sérsic index fixed to 1, while the mean Sérsic index from our fits is 0.83, and we checked that a direct comparison between our circularized size measurements the the circularized ALPINE size measurements did not yield any systematic differences. This sample measures the rest-frame far-infrared at 160 m. We then include galaxies between and 5.8 with submm size measurements from the UDS field measured by ALMA (Gullberg et al., 2019), in this case probing rest wavelengths between 130 and 350 m, converted to the size of the semi-major axis using the axis ratios provided. We also include the size of the stacked image, arbitrarily placed at 100 M⊙ yr-1. For reference, we show the half-light radius of the ALMA synthesized beam (arcsec, where and are the major and minor FWHM, respectively) as a horizontal dashed line.
In Fig. 7 (right panel) we show the same size measurements, this time as a function of stellar mass, including our stack arbitrarily placed at 10M⊙, and the ALMA PSF. Lastly, Fig. 8 shows the same quantities as a function of redshift. The galaxies in SPT234956 span a range of sizes comparable to the literature samples, with no discernible trends in SFR, stellar mass, or redshift. This result is in agreement with the idea that not all SMGs are compact starbursts, and instead there is some heterogeneity in the SMG population (e.g., Hayward et al., 2012; Hayward et al., 2013).
We now turn to the size ratios of our sample, and compare them to the literature. These comparisons should not depend on the choice of circularized size versus semi-major axis length, since we expect that the observed ellipticities of galaxies are equal at ultraviolet and far-infrared lengths. Fig. 9 (right panel) shows the ratio of the rest-frame far-infrared size to the ultraviolet size, , for the galaxies in SPT234956, as well as the size ratio for the stacks. We plot these ratios as a function of SFR as the SFRs of our sample are better-constrained than the stellar masses. All of the galaxies here are core galaxies of SPT234956, since our high-resolution submm imaging only covered this region. The field SMGs from Barro et al. (2016) and Fujimoto et al. (2020) are shown alongside our sources on this plot, but the field SMGs from Swinbank et al. (2010) and (Gullberg et al., 2019) have not been observed at high resolution at both wavelengths and so are omitted from this comparison. Unfortunately, there are only three sources (C2, C6, and C8) for which we could measure both a far-infrared size and an ultraviolet size. To improve the sample size, we can look at the [Cii] sizes for some of our sources, where the emission is much brighter, and use this as a proxy for the dust sizes.
Figure 9 (left panel) plots the ratio as a function of SFR for all sources where both measurements are available. We find a relatively consistent ratio across all SFR values, with a mean of 1.30.2. Next, in Fig. 9 (right panel) we use the ratio divided by the mean ratio above to provide an estimate of the underlying continuum size of sources where such a measurement is not available; this adds one more galaxy (C17) to the sample.
The weighted mean of the size ratio for the galaxies in our sample is 1.4, with a standard deviation of 0.6, consistent with the size ratio of 0.90.2 from our stacked images, and in agreement with simulations of high- star-forming galaxies (e.g. Cochrane et al., 2019). Compared to the literature, given the large uncertainties and small sample sizes, we can only conclude that our galaxies show ratios consistent with the field.


4.6 Radial surface brightness distributions
In Figs. 6–8 we see that C6, the central galaxy of the SPT234956 protocluster, has a much smaller rest-frame ultraviolet half-light radius compared to the rest of the protocluster galaxies with an available size measurement. However, most of the galaxies in our sample are not well-enough detected to measure ultraviolet sizes, so to perform a more statistical analysis we can turn to our stacked F160W image (Fig. 2). In Fig. 10 (left panel) we show the surface brightness of the stack as a function of radius, calculated in elliptical annuli with widths of 1 pixel, where the shape of the annuli was set to the best-fit ellipticity and position angle from the Sérsic profile fit. In this plot the points and the error bars are the means and standard deviations of the pixel values within each annulus, respectively. Here we have converted our surface brightness measurements to units of Jy kpc-2 by dividing by the number of kpc2 in a pixel of our image. For the last point our measurement is consistent with zero, so we show the 1 upper-limit. We also show the best-fit Sérsic function as a shaded region, where the width is obtained by varying the best-fit parameters within their 68 per cent confidence intervals. In Fig. 10 (right panel) we show its surface brightness profile of C6, calculated in the same way as with the stack.
In order to assess whether or not we are seeing resolved emission in these surface brightness profiles, we compare them to the HST F160W PSF model described in Section 3.5. Figure 10 shows the surface profile of the model PSF for reference, normalized to the value of the central pixel of the stacked submm image (left panel) and galaxy C6 (right panel). Beyond about 2 pixels (or about 1 kpc) our stacked galaxy image shows significantly more emission compared to the stacked star, so we are indeed measuring extended emission, yet galaxy C6 is effectively indistinguishable from an unresolved point source, confirming that C6 is more compact than the average of the other galaxies in SPT234956.
A similar stacking analysis was performed for the 25 spectroscopically-confirmed 2 field SMGs of Swinbank et al. (2010) shown in Figs. 6–8, and any differences in the mean profile of this field population compared to the mean profile of our protocluster galaxies could indicate the presence of interesting environmental effects. Upon rescaling and stacking their detections, it was found that a Sérsic index of 2.61.0 best described their data, in agreement with our value of 1.720.30. In Fig. 10 (left panel) we show their fit as a grey shaded region, where the width corresponds to the uncertainties in their best-fit parameters. We set the scale radius to be 2.70.4 kpc, corresponding to the median half-light radius of their sample, and scale the amplitude to have the same integrated flux density as our stack, then convolve the 1-D profile with the HST beam in the F160W filter. We see that the surface brightness profile of our stack is consistent out to where our data are sensitive, thus we cannot conclude any differences are seen in the data.
We next turn to comparing galaxy C6 with the literature. The three GOODS-S galaxies at from Barro et al. (2016) observed in the F850LP filter (rest-wavelength 260 nm) were selected for their small rest-frame optical sizes and high stellar-mass densities, similar to what we are seeing with galaxy C6. In Fig. 10 (right panel) we show their resulting best-fit Sérsic profiles, with each normalization calculated by setting the ratio of the integrated flux density of a given galaxy to the integrated flux density of C6 equal to the ratio of the stellar mass of the same galaxy to the stellar mass of C6. We then convolve each profile with the HST beam in the F160W filter, converting the units of the beamsize from arcsec to kpc using the redshift of SPT234956 in order to provide a direct comparison with our observations. We have highlighted the range in surface brightness they span for clarity. We see that the compact SMGs in this sample would all effectively appear unresolved in our HST imaging, similar to C6.
We can also compare the current profile of galaxy C6 to a prediction of its profile from the hydrodynamical simulation presented by Rennehan et al. (2020). Briefly, the simulation evolved the 14 core galaxies initially discovered by Miller et al. (2018) for 1 Gyr in several separate and independent realizations. Each galaxy was initialized with a dark matter halo and a stable gas and stellar disc, with component masses scaled from the available gas mass estimates in Miller et al. (2018) and discs modeled following an exponentially decreasing surface density with a scale size related to the angular momentum (Robertson et al., 2006). In particular, we select four realizations where the stellar masses were computed assuming a molecular gas-to-stellar mass fraction of 2.3 (for reference, the range measured for these galaxies is 0.1 to 4.8), and the halo masses were scaled from the stellar masses by a factor of 100. In each realization the positions were randomly selected to lie within a 65 kpc-radius sphere, and the velocities were drawn from a Gaussian distribution matching the measured line-of-sight velocity dispersion. For each realization, we take the median mass profile between 700 and 800 Myr, then take the mean profile across these realizations. The overall normalization of the profile is highly uncertain in the simulation as it requires radiative transfer models to convert stellar mass into rest-frame ultraviolet flux density, so we simply normalize the profile by the peak pixel in our F160W imaging of C6. The resulting profile is shown in Fig. 10, and we see that after the merger, the BCG will remain quite compact. Nonetheless, we expect the dark matter halo to grow in size after the merger, so in Fig. 10 we also show the resulting shape of the dark matter halo, normalized in the same way for easy comparison with the stellar profile. We see that the shape of the dark matter halo after the merger is much more extended than the stellar mass profile.

5 Discussion
5.1 The stellar properties of SPT234956
The protocluster SPT234956 is a unique object when observed in the submm. We now know that the total SFR exceeds 10,000 M⊙ yr-1, and its extreme nature in this regard is due to the fact that it was specifically selected as one of the brightest unlensed point sources in the SPT mm-wavelength survey. Now that we have studied this protocluster at optical and infrared wavelengths, we have begun to probe the properties of the constituent stars themselves.
We have found that the stellar masses derived through SED fitting place these galaxies inconspicuously on the MS, as opposed to appearing as outliers above it; given their incredibly high SFRs, this means that they have correspondingly large stellar masses, which are simply hidden by dust. For reference, the total stellar mass of all the known galaxies in SPT234956 is (1.50.3)M⊙, which is comparable to a large BCG at .
Based on our unequal-variance -test between field SMGs and star-forming protocluster galaxies, assuming that the molecular gas-to-stellar mass fractions and depletion timescales are drawn from Gaussian distributions with arbitrary variances, we are able to reject the null hypothesis that the means of the two distributions are equal, although the scatter between the two populations can overlap. Interestingly, similar studies of CO lines at moderate redshift (–3) have found that star-forming galaxies in cluster/protocluster environments at this epoch have systematically higher molecular gas-to-stellar mass fractions and depletion timescales compared to scaling relations derived from the field (e.g., Noble et al., 2017; Hayashi et al., 2018; Tadaki et al., 2019), while at galaxy clusters have nearly depleted all of their gas and ceased forming stars (e.g., Young et al., 2011; Jablonka et al., 2013; Scott et al., 2013; Boselli et al., 2014; Zabel et al., 2019).
To quantify this, in Fig. 11 we show the molecular gas-to-stellar mass fraction (top panel) and depletion timescale (bottom panel) as a function of redshift for the galaxies in SPT234956, compared to other clusters and protoclusters with molecular gas mass estimations made through observations of CO, and with sufficient multiwavelength coverage to have stellar mass and SFR estimates. At we show the DRC (Oteo et al., 2018; Long et al., 2020), and we have converted CO(6–5) line intensities to molecular gas masses using an factor of 0.46 (the mean ratio found for the SPT-SMG sample, see Spilker et al. 2014) and an of 1 M(K km s-1 pc2) (the same scale factor used for our sample). At intermediate redshift (–3) we show results from observations of CO(3–2), CO(2–1), and CO(1–0) in members of three Spitzer Adaptation of the Red-sequence Cluster Survey (SpARCS) clusters (Noble et al., 2017), XMMXCS J2215.91738 (Hayashi et al., 2018), three Ly-selected protoclusters (Tadaki et al., 2019), and two potentially associated overdensities identified in the COSMOS field, CLJ1001 at (Wang et al., 2016, 2018) and PCL1002 at (Casey et al., 2015; Champagne et al., 2021). For the COSMOS structure, we show the measurements of the individual galaxies in CLJ1001 from Wang et al. (2018), and the properties of the single galaxy in PCL1002 with a CO(1–0) detection from Champagne et al. (2021); however, Champagne et al. (2021) independently derived the unresolved properties of CLJ1001, finding a 25 per cent shorter depletion timescale compared to the average reported by Wang et al. (2018). At low redshift () we take observations of CO(3–2), CO(2–1), and CO(1–0) in members of the Fornax cluster (Zabel et al., 2019), Abell 2192 and Abell 963 (Cybulski et al., 2016), CL1411.11148 (Spérone-Longin et al., 2021), CL002416 (Geach et al., 2009, 2011), and MACS J0717.53745, Abell 697, 963, 1763, and 2219 (Castignani et al., 2020). These comparison samples consistently used CO conversion factors of and , and 4 M(K km s-1 pc2), with small corrections for metallicity made in some cases. This conversion factor is appropriate for normal star-forming galaxies, which were the targets of these literature studies, and a lower conversion factor around 1 M(K km s-1 pc2) is typically used for SMGs, as with SPT234956 and the DRC. Some galaxies in the sample of Castignani et al. (2020) approach the high SFRs in the SMG regime, and they have adopted a smaller conversion factor for those sources. For each cluster in this figure, we show the mean molecular gas-to-stellar mass fraction and depletion timescale as a square symbol, with error bars representing the standard deviation for clusters with more than two galaxies with sufficient data.
To represent field galaxies in Fig. 11, we use the scaling relations for and (where denotes the average of the field population) estimated by Tacconi et al. (2018), derived from observations of CO lines and continuum flux densities up to millimetre wavelengths in over 1300 field galaxies between and 4 (including the sample from Scoville et al. 2016). They provide equations for calculating and as a function of redshift, , SFR, and the effective radius at rest-frame 500 nm; however, since we do not have access to size measurements for most of the galaxies in our comparison sample, we use their fits that do not include this parameter. Figure 11 shows several representative curves for and given different values of and SFR. In the bottom panels of Fig. 11 we show the ratios and (including the expected intrinsic scatter of dex, see Schreiber et al. 2015), obtained by dividing each galaxy’s molecular gas-to-stellar mass fraction and depletion timescale by the prediction from Tacconi et al. (2018), taking into account each galaxy’s redshift, , and SFR. We confirm that at –3 most cluster environments are gas-rich, as discussed in previous studies, and we see that the galaxies in SPT234956 and the DRC continue to fall below the expected molecular gas-to-stellar mass fractions and depletion timescales of field galaxies, although the intrinsic scatters of these populations are still large and often overlap.
In our comparison of the stellar mass function of SPT234956 with the stellar mass function of galaxy clusters, we found similar shapes well-described by Schechter functions. Since we know that the core galaxies will merge over a timescale of a few hundred Myr, we also computed the stellar mass function of SPT234956 after summing up the stellar masses of these galaxies and treating them as a single source. In this case we found that the number counts are better-fit by a single power law, indicating that if this structure is to continue along an evolutionary path to become a galaxy cluster, the remaining cluster stellar mass will come from lower-mass galaxies (e.g. Naab et al., 2009). However, we have not taken into account the observational biases and incompleteness inherent in our sample, and so it is not clear from the current data whether these galaxies are already within the 1 Mpc environment of SPT234956 and have not been detected, or have yet to fall into the galaxy protocluster. It is worth noting that this behaviour is consistent with the notion of ‘downsizing’, where the most massive galaxies formed the earliest times, which has been observed in numerous samples of galaxies (e.g., Cowie et al., 1996; Magliocchetti et al., 2013; Miller et al., 2015; Wilkinson et al., 2017).
Lastly, we have noted that the ratio of far-infrared size to ultraviolet size is comparable to star-forming galaxies found around the same redshift, and field SMGs at lower redshift (). A similar study at also found that the stellar emission in cluster galaxies is more compact than in field galaxies (Matharu et al., 2019), which is not what we are seeing here, although the sample sizes we are investigating are small, and there could be systematic differences in the size measurements. Nonetheless, we might not expect to see many differences between field galaxies and protocluster galaxies at high redshift as there has not been enough time for the clustering environment to shape the residing galaxies.


5.2 The properties of a BCG in formation
In our analysis above, we have paid special attention to separating the central galaxies of SPT234956 from the wider protocluster. In Rennehan et al. (2020), hydrodynamical simulations using the positions of these central galaxies as the initial conditions predicted a complete merger on timescales of a few hundred Myr, while in Hill et al. (2020) it was found that the velocity distribution within this region was consistent with a Gaussian distribution, and that the velocity dispersion predicted a central mass of M⊙. Summing up the stellar masses of each of these central galaxies yields a value of M⊙, consistent (within the uncertainties) with the mass of M⊙ estimated by Rotermund et al. (2021).
Looking at Fig. 3, we see that these central galaxies lie close to the MS found by Khusanova et al. (2021), with no statistically significant offsets given the large uncertainties. Similarly, the two galaxies from the northern component of SPT234956 are significantly above the MS, but small number statistics again mean that we cannot draw any statistically significant conclusions from this observation. The MS distribution of SPT234956 overall matches well with what is seen with the DRC, a similar star-forming protocluster from the literature, along with other samples of field SMGs at high redshift.
In Fig. 12 we explore the concept of environmental dependence further by plotting the cumulative mass enclosed within a circular aperture as a function of the area of the aperture, separating out the stellar mass and the molecular gas mass. In this plot the centre of SPT234956 is the luminosity-weighted centre, as in Hill et al. (2020). We see that the molecular gas mass and stellar mass track one another across all scales probed by our data, from the region of the forming BCG (90 kpc, or about 0.03 Mpc2) out to the northern component (about 0.5 Mpc away, or at 1 Mpc2). To quantify this, in the bottom panel of Fig. 12 we show the total enclosed molecular gas-to-stellar mass fraction, and we can see that it remains roughly constant at a level of about 0.8 (except for near the centre, but these fluctuations suffer from small-number statistics). For comparison, we show the same curve-of-growth for the DRC (Oteo et al., 2018; Long et al., 2020); the behaviour of this protocluster is similar.
We then compare the stellar mass profiles of these high- protoclusters to the stellar profile of a typical galaxy cluster from van der Burg et al. (2014), obtained from the stack of the same sample of 10 clusters discussed in Section 5. The authors found a best-fit Navarro-Frenk-White (NFW) profile concentration parameter of 7, which we use to plot the mass projected within a cylinder of a given area (see e.g. Łokas & Mamon, 2001), taking the scale stellar mass to be M⊙, the median of their sample. We see that the shapes of the stellar mass curves between the protoclusters and the clusters are similar, although the slope of the protoclusters becomes shallower than the slope of the clusters at large radii. It is interesting to note that a similar study (Alberts et al., 2021) investigating stacks of galaxy clusters between and 1.6 in the near-infrared (3–8 m in the rest-frame) found similarly-concentrated light profiles, with NFW concentration parameters around 7; this near-infrared light is expected to trace stellar mass. They also investigated stacks in the far-infrared (250–500 m in the rest-frame), tracing dust emission and SFR, and found concentration parameters comparable to the near-infrared light. It was found that 20–30 per cent of the integrated cluster far-infrared emission comes from high-mass galaxies, while in Hill et al. (2020) about 50 per cent of the low-resolution single-dish far-infrared emission resolved into massive galaxies.
Despite the fact that the galaxies on-track to merge into a BCG are not altogether distinguishable from the rest of the protocluster (or indeed, from most SMGs at these redshifts), galaxy C6 does stand out from our core sample as having the brightest flux density at all optical-through-infrared wavelengths. Our SED modelling found that this galaxy’s stellar mass is M⊙, or roughly half of the total stellar mass expected to make up the BCG after the mergers are complete, and our brightness profile analysis of this galaxy suggests that it is incredibly compact.
The region around galaxy C6 is clearly at the centre of this BCG-in-formation. Rotermund et al. (2021) already discussed a plausible evolutionary track for the growth of the stellar mass of C6. Around , BCG stellar masses range from 5–10M⊙ (e.g., Hilton et al., 2013), so C6 is already nearly there, and once the merging is complete, it will be at the upper end of BCG masses known. In Fig. 10 we see that C6 is expected to remain compact after the merger, and so if C6 is to continue to grow in stellar mass, we might also expect it to grow by a considerable amount in size. This could happen through dry mergers (mergers between galaxies with little gas, and thus little star formation), which has been found to play an important role in the growth of BCGs (e.g., Liu et al., 2009; Lin et al., 2010; Liu et al., 2015), and simulations predict that this process will increase a BCGs size and make it less compact (e.g., Khochfar & Silk, 2006; Oogi & Habe, 2012). This would need to occur after C6 merges with the core galaxies in its current vicinity, as these mergers will be gas-rich. From our simulation we see that the post-merger dark matter halo will have a large and extended profile, and this could become populated by further accretions and dry mergers if C6 grows following an inside-out scenario, where the slope of the outer profile becomes shallower with increasing mass (e.g., van Dokkum et al., 2010; Bai et al., 2014; Whitney et al., 2019). While we stress that the precise final mass and size of a BCG depends strongly on its detailed merger history, something we cannot know from system to system, we see that C6 is at least consistent with the picture that it is the progenitor of one of the most massive BCGs seen today, and that it has nearly formed all of its stars at this early epoch of formation.
These observations of a BCG in formation provide a direct measure of the ingredients that built up these massive galaxies in the early Universe. There are many studies of the stellar populations of BCGs that try to piece together their formation histories, which broadly point to a fast and early core formation phase (Gyr ago) followed by a slow and continuous accretion phase (Gyr ago) fuelled by minor mergers respondible for assembling the outer regions (e.g., De Lucia & Blaizot, 2007; Collins et al., 2009; Barbosa et al., 2016; Cooke et al., 2019; Edwards et al., 2020). Here we provide a direct observation of this formation in progress, where we have access to information that will likely be lost after the merger of the core galaxies in SPT234956 into a BCG. In particular, we see that the ingredients of this BCG are numerous galaxies with very high star-formation rates that, once merged, will already have formed most of the stars that make up a typical BCG. Furthermore, stellar population studies are only able to trace BCG histories back to their early star-forming phase, which in the case of SPT234956, will begin after the merger. But by observing these galaxies before they merge into a BCG, we now have access to information about the stellar history of a BCG back to a much earlier time, as traced by the stellar populations of the pre-merger galaxies.

6 Conclusion
SPT234956 was selected as the brightest protocluster candidate from the SPT-SZ 2500 deg2 mm-wavelength survey. This object has since been spectroscopically confirmed to be a true protocluster, containing over 30 submm-bright galaxies and dozens more LBGs and LAEs. In this paper we have described our results from an extensive optical-through-infrared follow-up campaign using observations from Gemini-GMOS and FLAMINGOS-2, HST-F110W and F160W, and Spitzer-IRAC.
Owing to the arcsec spatial resolution of the IRAC images, source blending is an issue that needs to be dealt with. We deblended our IRAC data using t-phot, which used galaxy positions from our HST imaging as a prior and subsequently convolved their profiles with the IRAC PRF to develop a catalogue of the underlying source distribution as seen by IRAC. Source catalogues for our Gemini and HST imaging were extracted using standard source-extractor routines.
We matched the known protocluster galaxies in SPT234956 discovered by ALMA to our optical and infrared catalogues using a simple radial cut of 1 arcsec. We found a match in at least one of the eight optical/infrared filters for all but six galaxies. In addition, we searched for ALMA counterparts to a small sample of LBGs and LAEs, and found matches for all but one galaxy.
Taking the photometry measured in these data and combining it with existing mm-wavelength photometry from Herschel-SPIRE and ALMA, we used CIGALE to fit SEDs to each galaxy, allowing stellar masses, dust extinctions, ages, star-formation timescales, and star-formation rates to vary.
We found that the galaxies in SPT234956 follow the galaxy main sequence, consistent with other samples of protocluster galaxies and field SMGs. However, we find small molecular gas-to-stellar mass fractions and short depletion timescales compared to field SMGs at similar redshifts. We perform unequal-variance -tests, rejecting the null hypothesis that the molecular gas-to-stellar mass fractions and depletion timescales of protocluster galaxies and field SMGs have molecular gas-to-stellar mass fractions and depletion timescales drawn from Gaussian distributions with equal means, although the scatter in both populations is large. We find the same result using known scaling relations calibrated from large samples of field galaxies up to redshift 4. This could mean that protocluster galaxies in SPT234956 are at a late stage in their star-formation phase and have already nearly depleted their gas reservoirs as they build up their stars.
We computed the stellar-mass function and gas-mass function of SPT234956 in two ways: first, for the entire sample of galaxies; and second, by collapsing the core galaxies into a single source, reflecting the fact that they are expected to merge within a timescale of a few hundred Myr. The stellar- and gas-mass functions track each other well. Comparing the total protocluster stellar mass function to the stellar-mass function of typical galaxy clusters, we find that the samples are consistent with one another and are well-fit by Schechter functions. The best-fit characteristic mass for the galaxy clusters is M⊙, and the slope is 0.46, compared to SPT234956, where we find a best-fit characteristic mass of M⊙ and a slope of 0.3. On the other hand, the protocluster with a merged BCG is better-fit by a single power-law. Thus if SPT234956 is to follow a similar trajectory as the galaxy clusters, then it must accrete numerous less-massive galaxies, or these less-massive galaxies must already be present but remain undetected in our observations. Due to incompleteness in our sample (about 80 per cent for M⊙), we are unable to distinguish between these two scenarios.
We measured the physical sizes of the galaxies in SPT234956 in our deep HST-F160W data, which probe rest-frame ultraviolet wavelengths. Upon comparing these measurements with typical star-forming galaxies between redshift 4 and 5, we found that our sample has comparable ultraviolet sizes. We stacked our HST data at the positions of the detected galaxies and compared this with a stack of the same galaxies at submm wavelengths imaged by ALMA, finding a consistent result. Galaxy C6, the brightest protocluster galaxy in our HST data, is the most compact rest-frame ultraviolet source and remains unresolved by our HST imaging. Hydrodynamical simulations predict that this galaxy is at the centre of a major merger, yet after the merger the emission will still remain compact.
Lastly, we investigated the total projected stellar and molecular gas mass of SPT234956 as a function of projected area. We found that the molecular gas mass and stellar mass track each other well, with no clear trend in the molecular gas-to-stellar mass fraction as a function of radius (the mean value being about 0.3). The stellar mass distribution of SPT234956 also does not appear to be markedly different from galaxy clusters, although we note that so far we have only probed the central Mpc of the structure, which is much smaller than the extent of clusters.
SPT234956 is a galaxy protocluster in a remarkable phase of its evolution, reaching a total SFR of over 10,000 M⊙ yr-1 within a volume of approximately 0.1 Mpc3. Having been selected specifically for its star-forming properties, it is interesting that at optical and infrared wavelengths, the galaxies making up SPT234956 are not very luminous and have fairly typical stellar masses. Galaxy C6 is however an exception; this source is at the centre of a massive merger of over 20 galaxies, and is a likely proto-BCG. The transition of galaxy C6 into a BCG is consistent with the ‘downsizing’ scenario of galaxy formation, and provides a direct observation of the constituents and formation mechanism of a BCG in the early Universe. In this case the high-redshift proto-BCG is undergoing a major merger with dozens of galaxies whose properties are similar to the field, explaining why present-day BCGs contain old cores that seemingly formed very quickly.
Acknowledgements
The authors wish to thank Dr. Adam Muzzin for a useful discussion about the stellar mass function of galaxy clusters around redshift 1. This paper makes use of the following ALMA data: ADS/JAO.ALMA#2017.1.00273.S; and ADS/JAO.ALMA#2018.1.00058.S. ALMA is a partnership of ESO (representing its member states), NSF (USA) and NINS (Japan), together with NRC (Canada), MOST and ASIAA (Taiwan), and KASI (Republic of Korea), in cooperation with the Republic of Chile. The Joint ALMA Observatory is operated by ESO, AUI/NRAO, and NAOJ. Herschel is an ESA space observatory with science instruments provided by European-led Principal Investigator consortia and with important participation from NASA. This paper is based on observations made with ESO Telescopes at the La Silla Paranal Observatory under programme ID 299.A-5045(A). The National Radio Astronomy Observatory is a facility of the National Science Foundation operated under cooperative agreement by Associated Universities, Inc. The SPT is supported by the National Science Foundation through grant PLR-1248097, with partial support through PHY-1125897, the Kavli Foundation, and the Gordon and Betty Moore Foundation grant GBMF 947. This work is based in part on observations made with the Spitzer Space Telescope, which was operated by the Jet Propulsion Laboratory, California Institute of Technology under a contract with NASA. This work was supported by the Natural Sciences and Engineering Research Council of Canada. The Flatiron Institute is supported by the Simons Foundation. M.A. has been supported by the grant “CONICYT+PCI+REDES 190194”. D.P.M., J.D.V., K.C.L., and K.P. acknowledge support from the US NSF under grants AST-1715213 and AST-1716127. K.C.L acknowledges support from the US NSF NRAO under grants SOSPA5-001 and SOSPA4-007, respectively. J.D.V. acknowledges support from an A. P. Sloan Foundation Fellowship. M.A. and J.D.V. acknowledge support from the Center for AstroPhysical Surveys at the National Center for Supercomputing Applications in Urbana, IL. S.J. acknowledges support from the US NSF NRAO under grants SOSPA5-001 and SOSPA7-006.
Data Availability
All of the data presented in this paper are publicly available. The HST data can be found under the programme 15701 (PI S. Chapman), the Spitzer-IRAC data can be found under the four programmes 60194 (PI J. Vieira), 80032 (PI S. Stanford), 13224 (PI S. Chapman), and 14216 (PI S. Chapman), the Gemini-South data can be found under the programme GS-2017B-Q-7 (PI A. Chapman), and the ALMA data can be found under the two programmes 2017.1.00273.S (PI S. Chapman) and 2018.1.00058.S (PI S. Chapman).
References
- Alberts et al. (2021) Alberts S., et al., 2021, MNRAS, 501, 1970
- Andreon et al. (2014) Andreon S., Newman A. B., Trinchieri G., Raichoor A., Ellis R. S., Treu T., 2014, A&A, 565, A120
- Aravena et al. (2016) Aravena M., et al., 2016, MNRAS, 457, 4406
- Bacon et al. (2010) Bacon R., et al., 2010, in McLean I. S., Ramsay S. K., Takami H., eds, Society of Photo-Optical Instrumentation Engineers (SPIE) Conference Series Vol. 7735, Ground-based and Airborne Instrumentation for Astronomy III. p. 773508, doi:10.1117/12.856027
- Bai et al. (2014) Bai L., et al., 2014, ApJ, 789, 134
- Barbosa et al. (2016) Barbosa C. E., Arnaboldi M., Coccato L., Hilker M., Mendes de Oliveira C., Richtler T., 2016, A&A, 589, A139
- Barro et al. (2016) Barro G., et al., 2016, ApJ, 827, L32
- Bennett et al. (2003) Bennett C. L., et al., 2003, ApJS, 148, 1
- Beroiz et al. (2020) Beroiz M., Cabral J. B., Sanchez B., 2020, Astronomy and Computing, 32, 100384
- Bertin & Arnouts (1996) Bertin E., Arnouts S., 1996, A&AS, 117, 393
- Béthermin et al. (2020) Béthermin M., et al., 2020, A&A, 643, A2
- Birkin et al. (2021) Birkin J. E., et al., 2021, MNRAS, 501, 3926
- Biviano (1998) Biviano A., 1998, in Mazure A., Casoli F., Durret F., Gerbal D., eds, Untangling Coma Berenices: A New Vision of an Old Cluster. p. 1 (arXiv:astro-ph/9711251)
- Bleem et al. (2015) Bleem L. E., et al., 2015, ApJS, 216, 27
- Boquien et al. (2019) Boquien M., Burgarella D., Roehlly Y., Buat V., Ciesla L., Corre D., Inoue A. K., Salas H., 2019, A&A, 622, A103
- Boselli et al. (2014) Boselli A., Cortese L., Boquien M., Boissier S., Catinella B., Gavazzi G., Lagos C., Saintonge A., 2014, A&A, 564, A67
- Bothwell et al. (2017) Bothwell M. S., et al., 2017, MNRAS, 466, 2825
- Burgarella et al. (2005) Burgarella D., Buat V., Iglesias-Páramo J., 2005, MNRAS, 360, 1413
- Bykov et al. (2015) Bykov A. M., Churazov E. M., Ferrari C., Forman W. R., Kaastra J. S., Klein U., Markevitch M., de Plaa J., 2015, Space Sci. Rev., 188, 141
- Cañameras et al. (2015) Cañameras R., et al., 2015, A&A, 581, A105
- Calzetti et al. (2000) Calzetti D., Armus L., Bohlin R. C., Kinney A. L., Koornneef J., Storchi-Bergmann T., 2000, ApJ, 533, 682
- Casey et al. (2015) Casey C. M., et al., 2015, ApJ, 808, L33
- Castignani et al. (2020) Castignani G., et al., 2020, A&A, 640, A64
- Chabrier (2003) Chabrier G., 2003, PASP, 115, 763
- Champagne et al. (2021) Champagne J. B., et al., 2021, ApJ, 913, 110
- Chapman et al. (2005) Chapman S. C., Blain A. W., Smail I., Ivison R. J., 2005, ApJ, 622, 772
- Chapman et al. (2009) Chapman S. C., Blain A., Ibata R., Ivison R. J., Smail I., Morrison G., 2009, ApJ, 691, 560
- Chiang et al. (2015) Chiang Y.-K., et al., 2015, ApJ, 808, 37
- Cochrane et al. (2019) Cochrane R. K., et al., 2019, MNRAS, 488, 1779
- Collins et al. (2009) Collins C. A., et al., 2009, Nature, 458, 603
- Cooke et al. (2019) Cooke K. C., Kartaltepe J. S., Tyler K. D., Darvish B., Casey C. M., Le Fèvre O., Salvato M., Scoville N., 2019, ApJ, 881, 150
- Cowie et al. (1996) Cowie L. L., Songaila A., Hu E. M., Cohen J. G., 1996, AJ, 112, 839
- Cybulski et al. (2016) Cybulski R., et al., 2016, MNRAS, 459, 3287
- Dannerbauer et al. (2014) Dannerbauer H., et al., 2014, A&A, 570, A55
- De Lucia & Blaizot (2007) De Lucia G., Blaizot J., 2007, MNRAS, 375, 2
- Dessauges-Zavadsky et al. (2020) Dessauges-Zavadsky M., et al., 2020, A&A, 643, A5
- Dey et al. (2016) Dey A., Lee K.-S., Reddy N., Cooper M., Inami H., Hong S., Gonzalez A. H., Jannuzi B. T., 2016, ApJ, 823, 11
- Draine et al. (2014) Draine B. T., et al., 2014, ApJ, 780, 172
- Dudzevičiūtė et al. (2020) Dudzevičiūtė U., et al., 2020, MNRAS, 494, 3828
- Dunlop et al. (2017) Dunlop J. S., et al., 2017, MNRAS, 466, 861
- Edwards et al. (2020) Edwards L. O. V., et al., 2020, MNRAS, 491, 2617
- Eikenberry et al. (2004) Eikenberry S. S., et al., 2004, in Moorwood A. F. M., Iye M., eds, Society of Photo-Optical Instrumentation Engineers (SPIE) Conference Series Vol. 5492, Ground-based Instrumentation for Astronomy. pp 1196–1207, doi:10.1117/12.549796
- Eikenberry et al. (2006) Eikenberry S., et al., 2006, in McLean I. S., Iye M., eds, Society of Photo-Optical Instrumentation Engineers (SPIE) Conference Series Vol. 6269, Society of Photo-Optical Instrumentation Engineers (SPIE) Conference Series. p. 626917 (arXiv:astro-ph/0604577), doi:10.1117/12.672095
- Elbaz et al. (2011) Elbaz D., et al., 2011, A&A, 533, A119
- Everett et al. (2020) Everett W. B., et al., 2020, ApJ, 900, 55
- Faisst et al. (2020) Faisst A. L., et al., 2020, ApJS, 247, 61
- Fazio et al. (2004) Fazio G. G., et al., 2004, ApJS, 154, 10
- Flores-Cacho et al. (2016) Flores-Cacho I., et al., 2016, A&A, 585, A54
- Förster Schreiber et al. (2018) Förster Schreiber N. M., et al., 2018, ApJS, 238, 21
- Franco et al. (2018) Franco M., et al., 2018, A&A, 620, A152
- Fujimoto et al. (2020) Fujimoto S., et al., 2020, ApJ, 900, 1
- Galametz et al. (2013) Galametz A., et al., 2013, ApJS, 206, 10
- Geach et al. (2009) Geach J. E., Smail I., Coppin K., Moran S. M., Edge A. C., Ellis R. S., 2009, MNRAS, 395, L62
- Geach et al. (2011) Geach J. E., Smail I., Moran S. M., MacArthur L. A., Lagos C. d. P., Edge A. C., 2011, ApJ, 730, L19
- Genzel et al. (2008) Genzel R., et al., 2008, ApJ, 687, 59
- Giodini et al. (2013) Giodini S., Lovisari L., Pointecouteau E., Ettori S., Reiprich T. H., Hoekstra H., 2013, Space Sci. Rev., 177, 247
- Gobat et al. (2011) Gobat R., et al., 2011, A&A, 526, A133
- Goldader et al. (2002) Goldader J. D., Meurer G., Heckman T. M., Seibert M., Sanders D. B., Calzetti D., Steidel C. C., 2002, ApJ, 568, 651
- Greenslade et al. (2018) Greenslade J., et al., 2018, MNRAS, 476, 3336
- Grogin et al. (2011) Grogin N. A., et al., 2011, ApJS, 197, 35
- Gullberg et al. (2019) Gullberg B., et al., 2019, MNRAS, 490, 4956
- Harikane et al. (2019) Harikane Y., et al., 2019, ApJ, 883, 142
- Hayashi et al. (2018) Hayashi M., et al., 2018, ApJ, 856, 118
- Hayward et al. (2012) Hayward C. C., Jonsson P., Kereš D., Magnelli B., Hernquist L., Cox T. J., 2012, MNRAS, 424, 951
- Hayward et al. (2013) Hayward C. C., Narayanan D., Kereš D., Jonsson P., Hopkins P. F., Cox T. J., Hernquist L., 2013, MNRAS, 428, 2529
- Hezaveh et al. (2013) Hezaveh Y. D., et al., 2013, ApJ, 767, 132
- Hill et al. (2020) Hill R., et al., 2020, MNRAS, 495, 3124
- Hilton et al. (2013) Hilton M., et al., 2013, MNRAS, 435, 3469
- Hook et al. (2004) Hook I. M., Jørgensen I., Allington-Smith J. R., Davies R. L., Metcalfe N., Murowinski R. G., Crampton D., 2004, PASP, 116, 425
- Huang et al. (2020) Huang N., et al., 2020, AJ, 159, 110
- Hung et al. (2016) Hung C.-L., et al., 2016, ApJ, 826, 130
- Ivison et al. (2007) Ivison R. J., et al., 2007, MNRAS, 380, 199
- Jablonka et al. (2013) Jablonka P., Combes F., Rines K., Finn R., Welch T., 2013, A&A, 557, A103
- Kennicutt (1998) Kennicutt Jr. R. C., 1998, ARA&A, 36, 189
- Khochfar & Silk (2006) Khochfar S., Silk J., 2006, ApJ, 648, L21
- Khusanova et al. (2021) Khusanova Y., et al., 2021, A&A, 649, A152
- Kneissl et al. (2019) Kneissl R., et al., 2019, A&A, 625, A96
- Koyama et al. (2021) Koyama Y., et al., 2021, MNRAS, 503, L1
- Kreysa et al. (2003) Kreysa E., et al., 2003, in Phillips T. G., Zmuidzinas J., eds, Society of Photo-Optical Instrumentation Engineers (SPIE) Conference Series Vol. 4855, Proc. SPIE. pp 41–48, doi:10.1117/12.459176
- Lacaille et al. (2019) Lacaille K. M., et al., 2019, MNRAS, 488, 1790
- Lang et al. (2019) Lang P., et al., 2019, ApJ, 879, 54
- Law et al. (2009) Law D. R., Steidel C. C., Erb D. K., Larkin J. E., Pettini M., Shapley A. E., Wright S. A., 2009, ApJ, 697, 2057
- Law et al. (2012) Law D. R., Steidel C. C., Shapley A. E., Nagy S. R., Reddy N. A., Erb D. K., 2012, ApJ, 745, 85
- Le Fèvre et al. (2020) Le Fèvre O., et al., 2020, A&A, 643, A1
- Lim et al. (2021) Lim S., Scott D., Babul A., Barnes D. J., Kay S. T., McCarthy I. G., Rennehan D., Vogelsberger M., 2021, MNRAS, 501, 1803
- Lin et al. (2010) Lin L., et al., 2010, ApJ, 718, 1158
- Liu et al. (2009) Liu F. S., Mao S., Deng Z. G., Xia X. Y., Wen Z. L., 2009, MNRAS, 396, 2003
- Liu et al. (2015) Liu F. S., Lei F. J., Meng X. M., Jiang D. F., 2015, MNRAS, 447, 1491
- Łokas & Mamon (2001) Łokas E. L., Mamon G. A., 2001, MNRAS, 321, 155
- Long et al. (2020) Long A. S., et al., 2020, ApJ, 898, 133
- Magliocchetti et al. (2013) Magliocchetti M., et al., 2013, MNRAS, 433, 127
- Mantz et al. (2018) Mantz A. B., et al., 2018, A&A, 620, A2
- Marshall et al. (1983) Marshall H. L., Tananbaum H., Avni Y., Zamorani G., 1983, ApJ, 269, 35
- Martinache et al. (2018) Martinache C., et al., 2018, A&A, 620, A198
- Matharu et al. (2019) Matharu J., et al., 2019, MNRAS, 484, 595
- Merlin et al. (2015) Merlin E., et al., 2015, A&A, 582, A15
- Merlin et al. (2016) Merlin E., et al., 2016, A&A, 595, A97
- Michałowski et al. (2012) Michałowski M. J., Dunlop J. S., Cirasuolo M., Hjorth J., Hayward C. C., Watson D., 2012, A&A, 541, A85
- Miller et al. (2015) Miller T. B., Hayward C. C., Chapman S. C., Behroozi P. S., 2015, MNRAS, 452, 878
- Miller et al. (2018) Miller T. B., et al., 2018, Nature, 556, 469
- Mocanu et al. (2013) Mocanu L. M., et al., 2013, ApJ, 779, 61
- Mowla et al. (2019) Mowla L., van der Wel A., van Dokkum P., Miller T. B., 2019, ApJ, 872, L13
- Naab et al. (2009) Naab T., Johansson P. H., Ostriker J. P., 2009, ApJ, 699, L178
- Negrello et al. (2010) Negrello M., et al., 2010, Science, 330, 800
- Noble et al. (2017) Noble A. G., et al., 2017, ApJ, 842, L21
- Noirot et al. (2018) Noirot G., et al., 2018, ApJ, 859, 38
- Noll et al. (2009) Noll S., Burgarella D., Giovannoli E., Buat V., Marcillac D., Muñoz-Mateos J. C., 2009, A&A, 507, 1793
- Oogi & Habe (2012) Oogi T., Habe A., 2012, in Umemura M., Omukai K., eds, American Institute of Physics Conference Series Vol. 1480, First Stars IV - from Hayashi to the Future -. pp 406–408 (arXiv:1208.5039), doi:10.1063/1.4754402
- Oteo et al. (2018) Oteo I., et al., 2018, ApJ, 856, 72
- Overzier (2016) Overzier R. A., 2016, A&ARv, 24, 14
- Peng et al. (2002) Peng C. Y., Ho L. C., Impey C. D., Rix H.-W., 2002, AJ, 124, 266
- Peng et al. (2010) Peng C. Y., Ho L. C., Impey C. D., Rix H.-W., 2010, AJ, 139, 2097
- Planck Collaboration I (2020) Planck Collaboration I 2020, A&A, 641, A1
- Planck Collaboration XXVII (2015) Planck Collaboration XXVII 2015, A&A, 582, A30
- Planck Collaboration XXVII (2016) Planck Collaboration XXVII 2016, A&A, 594, A27
- Rennehan et al. (2020) Rennehan D., Babul A., Hayward C. C., Bottrell C., Hani M. H., Chapman S. C., 2020, MNRAS, 493, 4607
- Robertson et al. (2006) Robertson B., Cox T. J., Hernquist L., Franx M., Hopkins P. F., Martini P., Springel V., 2006, ApJ, 641, 21
- Rosati et al. (2009) Rosati P., et al., 2009, A&A, 508, 583
- Rotermund et al. (2021) Rotermund K. M., et al., 2021, MNRAS, 502, 1797
- Schreiber et al. (2015) Schreiber C., et al., 2015, A&A, 575, A74
- Scott et al. (2013) Scott T. C., Usero A., Brinks E., Boselli A., Cortese L., Bravo-Alfaro H., 2013, MNRAS, 429, 221
- Scoville et al. (2016) Scoville N., et al., 2016, ApJ, 820, 83
- Shen et al. (2003) Shen S., Mo H. J., White S. D. M., Blanton M. R., Kauffmann G., Voges W., Brinkmann J., Csabai I., 2003, MNRAS, 343, 978
- Shimasaku et al. (2003) Shimasaku K., et al., 2003, ApJ, 586, L111
- Simpson et al. (2014) Simpson J. M., et al., 2014, ApJ, 788, 125
- Simpson et al. (2015) Simpson J. M., et al., 2015, ApJ, 799, 81
- Siringo et al. (2009) Siringo G., et al., 2009, A&A, 497, 945
- Speagle et al. (2014) Speagle J. S., Steinhardt C. L., Capak P. L., Silverman J. D., 2014, ApJS, 214, 15
- Spérone-Longin et al. (2021) Spérone-Longin D., et al., 2021, A&A, 647, A156
- Spilker et al. (2014) Spilker J. S., et al., 2014, ApJ, 785, 149
- Spilker et al. (2016) Spilker J. S., et al., 2016, ApJ, 826, 112
- Springel et al. (2005) Springel V., et al., 2005, Nature, 435, 629
- Steidel et al. (2000) Steidel C. C., Adelberger K. L., Shapley A. E., Pettini M., Dickinson M., Giavalisco M., 2000, ApJ, 532, 170
- Steidel et al. (2005) Steidel C. C., Adelberger K. L., Shapley A. E., Erb D. K., Reddy N. A., Pettini M., 2005, ApJ, 626, 44
- Swinbank et al. (2010) Swinbank A. M., et al., 2010, MNRAS, 405, 234
- Swinbank et al. (2014) Swinbank A. M., et al., 2014, MNRAS, 438, 1267
- Tacconi et al. (2018) Tacconi L. J., et al., 2018, ApJ, 853, 179
- Tadaki et al. (2019) Tadaki K.-i., et al., 2019, PASJ, 71, 40
- Tamura et al. (2009) Tamura Y., et al., 2009, Nature, 459, 61
- Umehata et al. (2015) Umehata H., et al., 2015, ApJ, 815, L8
- Venemans et al. (2007) Venemans B. P., et al., 2007, A&A, 461, 823
- Vieira et al. (2010) Vieira J. D., et al., 2010, ApJ, 719, 763
- Wall et al. (2008) Wall J. V., Pope A., Scott D., 2008, MNRAS, 383, 435
- Wang et al. (2016) Wang T., et al., 2016, ApJ, 828, 56
- Wang et al. (2018) Wang T., et al., 2018, ApJ, 867, L29
- Wang et al. (2021) Wang G. C. P., et al., 2021, MNRAS, 508, 3754
- Whitney et al. (2019) Whitney A., Conselice C. J., Bhatawdekar R., Duncan K., 2019, ApJ, 887, 113
- Wilkinson et al. (2017) Wilkinson A., et al., 2017, MNRAS, 464, 1380
- Wootten & Thompson (2009) Wootten A., Thompson A. R., 2009, IEEE Proceedings, 97, 1463
- Wright et al. (1992) Wright E. L., et al., 1992, ApJ, 396, L13
- Wylezalek et al. (2013) Wylezalek D., et al., 2013, ApJ, 769, 79
- Young et al. (2011) Young L. M., et al., 2011, MNRAS, 414, 940
- Zabel et al. (2019) Zabel N., et al., 2019, MNRAS, 483, 2251
- Zhu et al. (2010) Zhu Y.-N., Wu H., Li H.-N., Cao C., 2010, Research in Astronomy and Astrophysics, 10, 329
- da Cunha et al. (2015) da Cunha E., et al., 2015, ApJ, 806, 110
- van Dokkum et al. (2010) van Dokkum P. G., et al., 2010, ApJ, 709, 1018
- van der Burg et al. (2013) van der Burg R. F. J., et al., 2013, A&A, 557, A15
- van der Burg et al. (2014) van der Burg R. F. J., Muzzin A., Hoekstra H., Wilson G., Lidman C., Yee H. K. C., 2014, A&A, 561, A79
- van der Burg et al. (2018) van der Burg R. F. J., McGee S., Aussel H., Dahle H., Arnaud M., Pratt G. W., Muzzin A., 2018, A&A, 618, A140
- van der Wel et al. (2012) van der Wel A., et al., 2012, ApJS, 203, 24
- van der Wel et al. (2014) van der Wel A., et al., 2014, ApJ, 788, 28
Appendix A Optical counterpart offsets
Positional differences between our rest-frame optical and ALMA positions are defined as the ALMA position minus the optical/infrared position. In Fig. 13 we show the mean offset found in each band surrounded by a circle whose semi-major and semi-minor axes are equal to the standard deviations of the offsets in each direction. We find a slight offset in the negative direction of RA arcsec (consistent across all wavebands, since the astrometry has been tied to a single frame).


Appendix B Optical imaging cutouts
In Fig. 14 we show all 32 12 arcsec source cutouts from our multiwavelength coverage. This includes GEMINI-GMOS in the , , and bands, GEMINI-FLAMINGOS-2 imaging in the band, HST imaging with the F110W and F160W filters, and Spitzer-IRAC imaging at 3.6 m and 4.5 m. In each frame, the ALMA position is shown as the blue point, with ALMA 850-m continuum and [Cii] line emission contours overlaid. Positions of sources found using source-extractor (or t-phot for IRAC) are shown as red crosses, with matched ALMA counterparts circled in green. Panels are blank where we do not have data at a given wavelength for a given source.


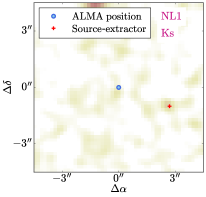
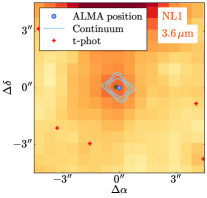
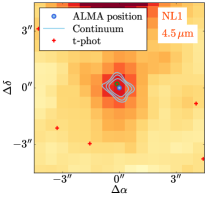
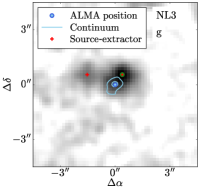
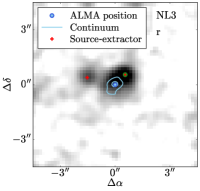
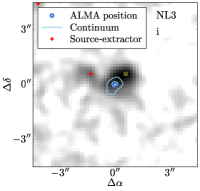
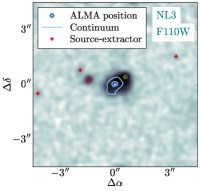
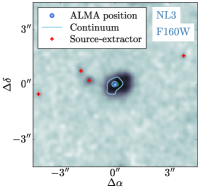
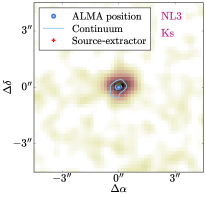
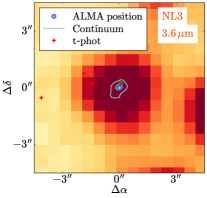
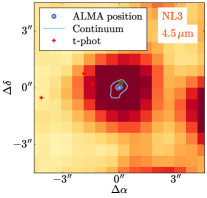
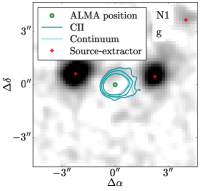
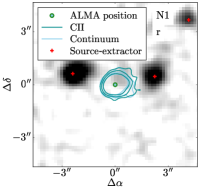
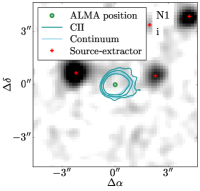
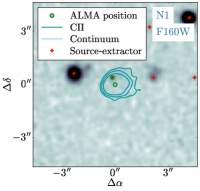

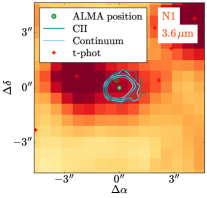
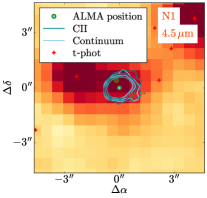
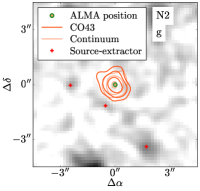
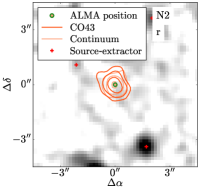
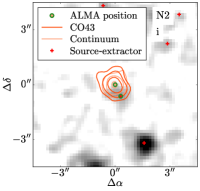
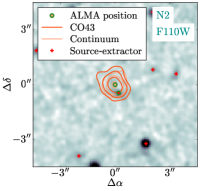
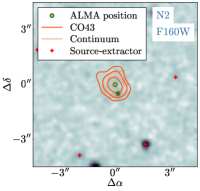

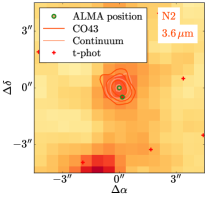
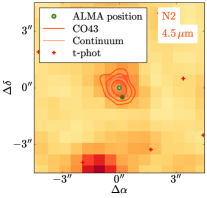
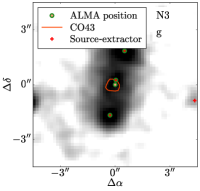
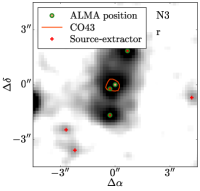
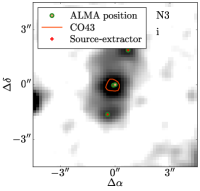
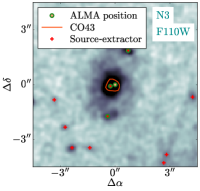
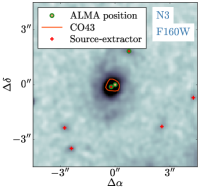
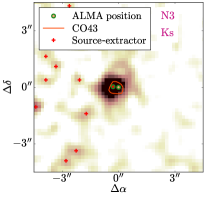
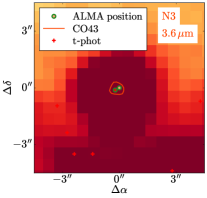
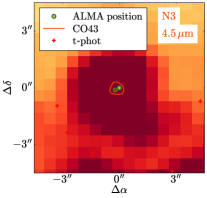
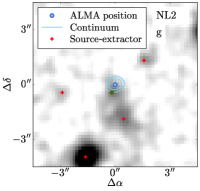
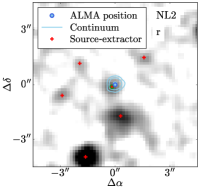
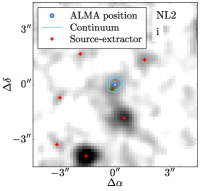
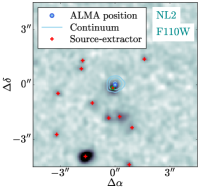
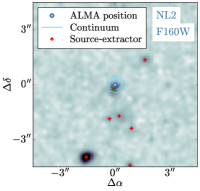

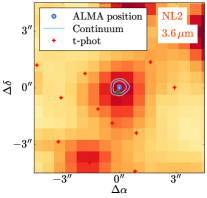
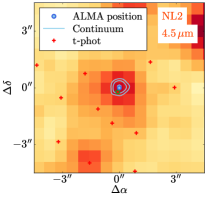


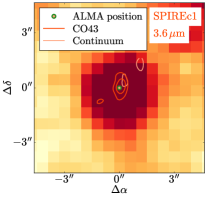
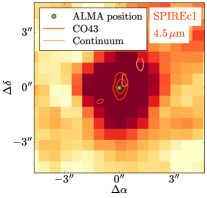




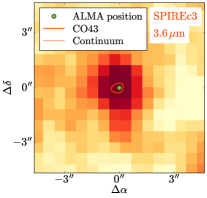
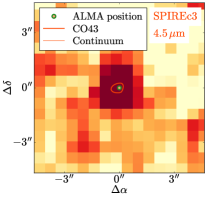
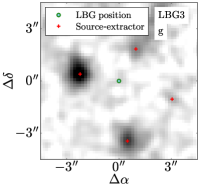
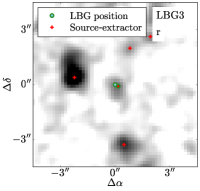
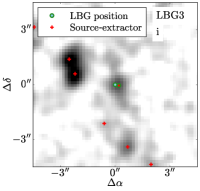
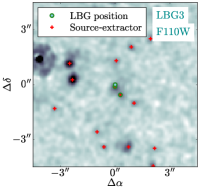
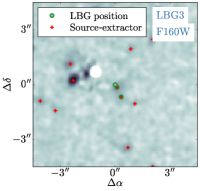
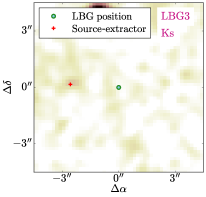
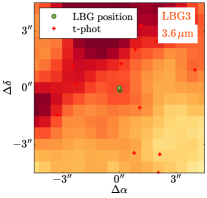
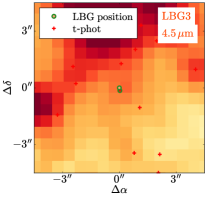
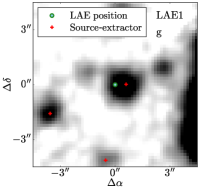
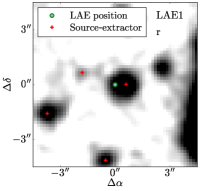
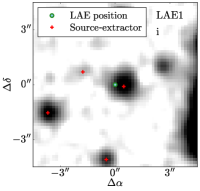
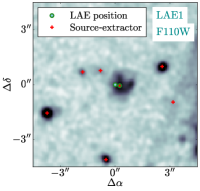
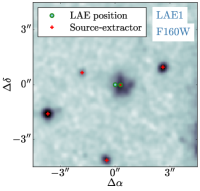
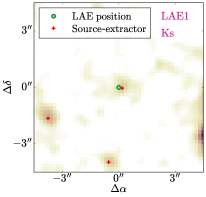
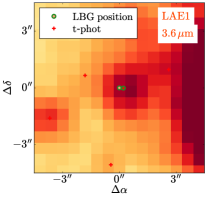
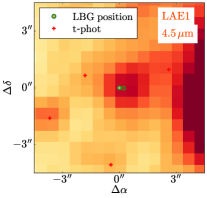
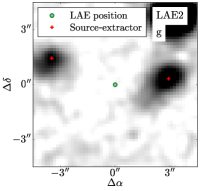
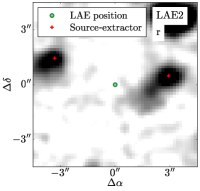
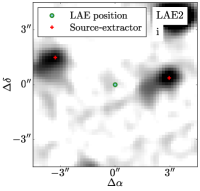
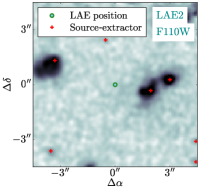
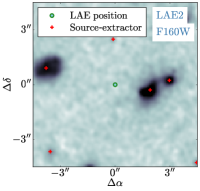
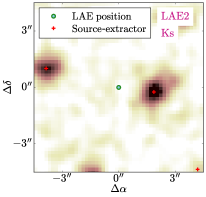
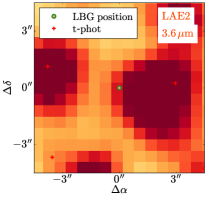
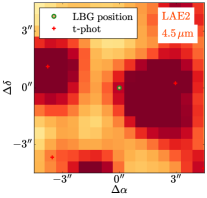
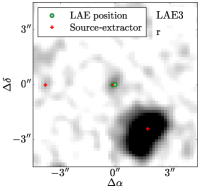
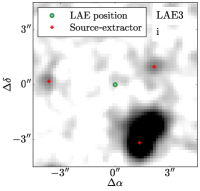
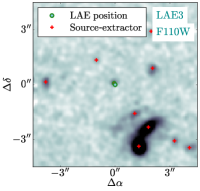
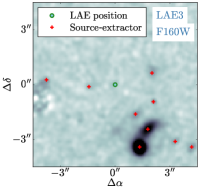
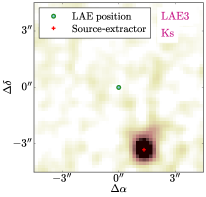
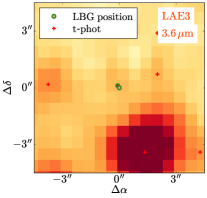
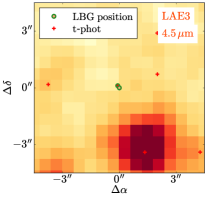
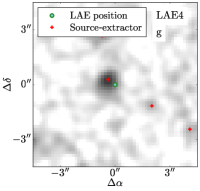
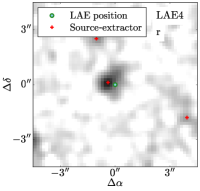
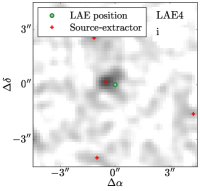
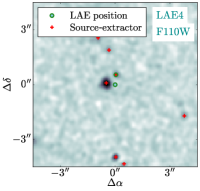
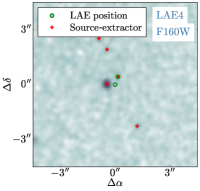
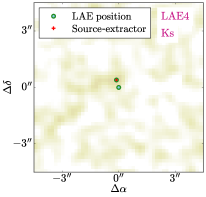
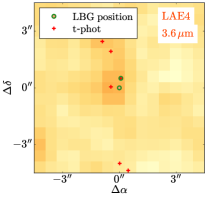
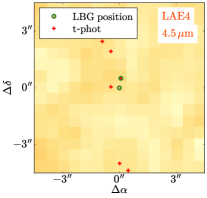
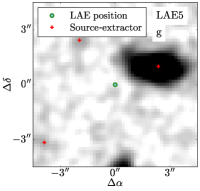
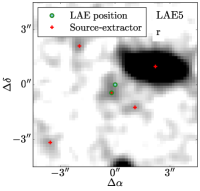
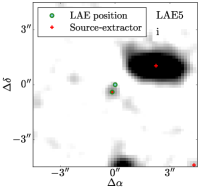
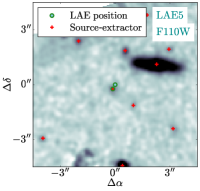
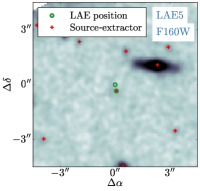

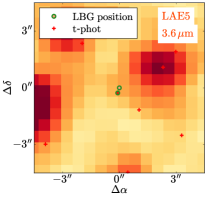
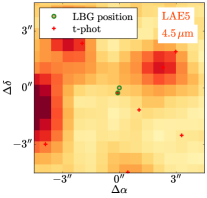
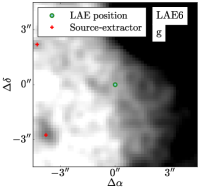
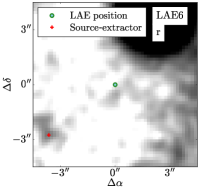
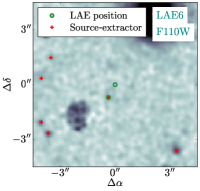
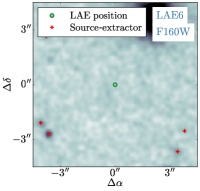

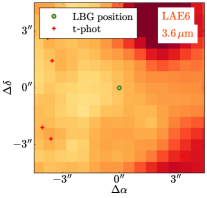
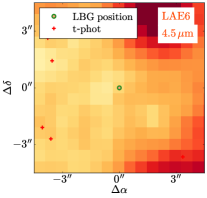
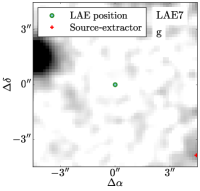
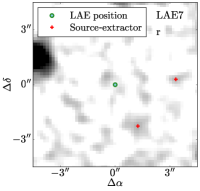
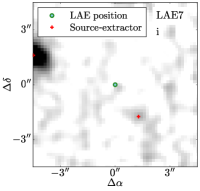
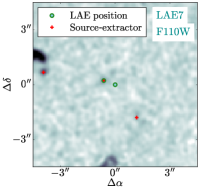
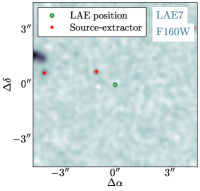

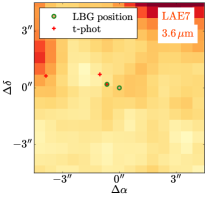
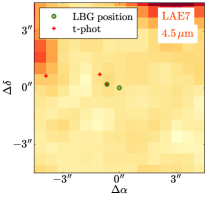
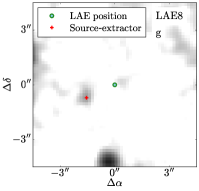
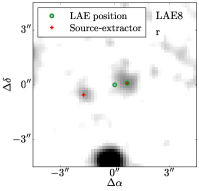
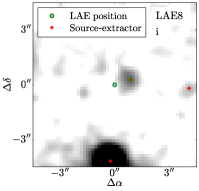
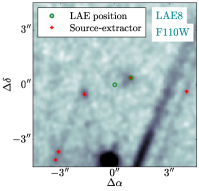
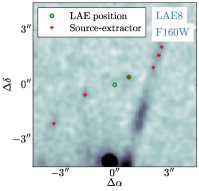
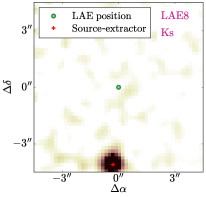
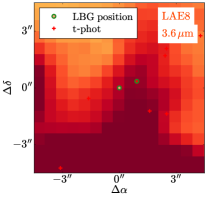
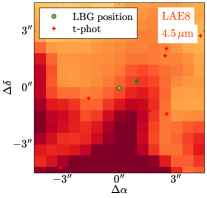
Appendix C Best fit SEDs
In Fig. C15 we show best-fit SEDs for all galaxies in our sample, obtained from CIGALE using the photometry in Table 1 and in Hill et al. (2020). Detected flux densities are shown as circles, and flux density upper limits are shown as downward-pointing arrows. In these fits we allowed the stellar mass, dust extinction, age, and star-formation timescale to vary. The best-fit parameters are provided in Table 2. For galaxies C12, C16, C20, C22, C23, LAE1, and LAE2, only upper limits are available for their photometry across all wavelengths (both submm and optical/infrared), so we do not attempt to fit SEDs or derive stellar masses.
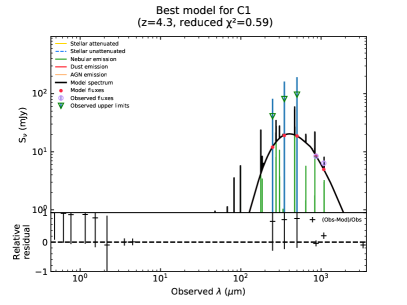
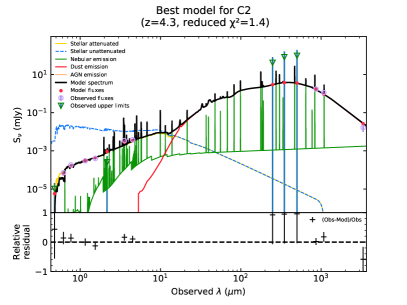
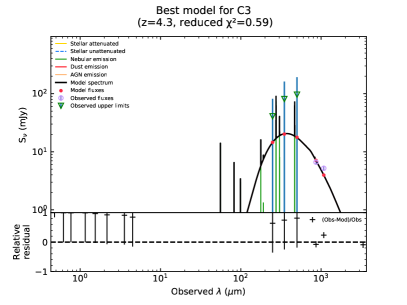
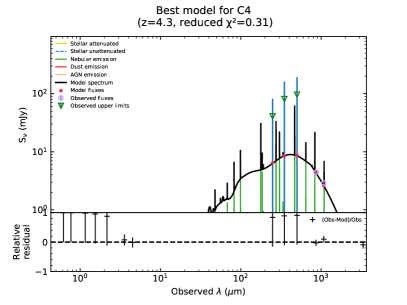
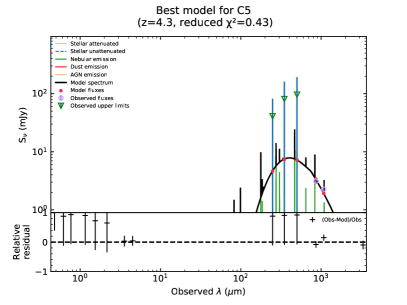
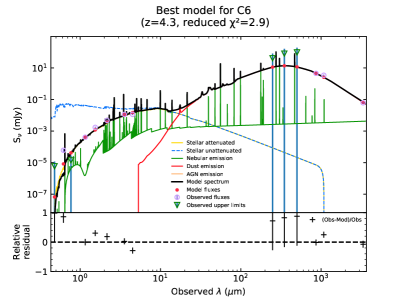
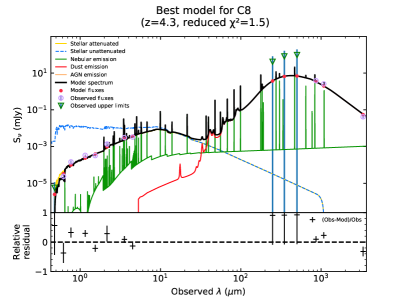
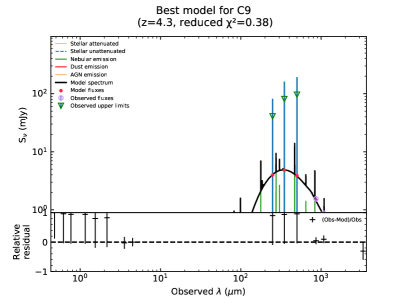
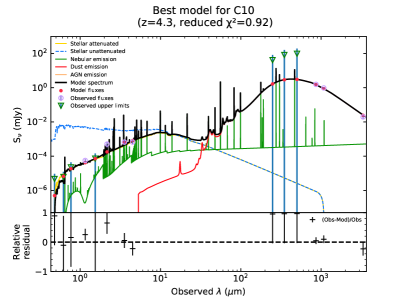
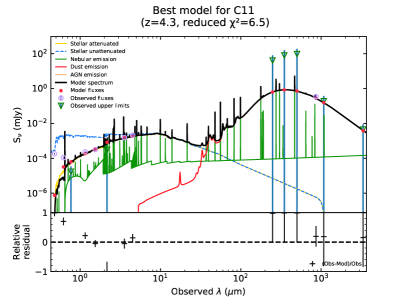
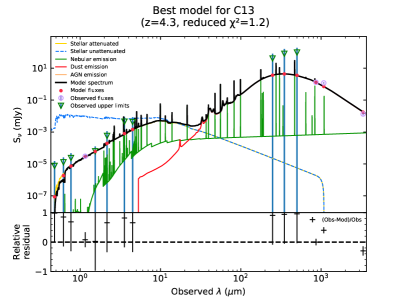
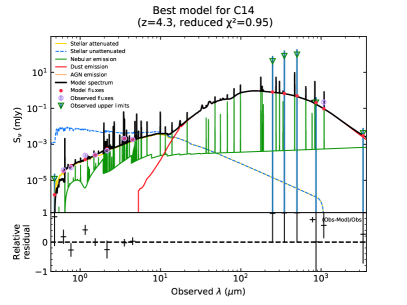
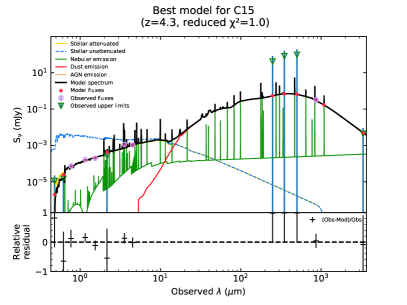
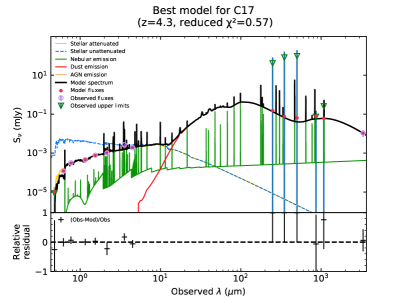
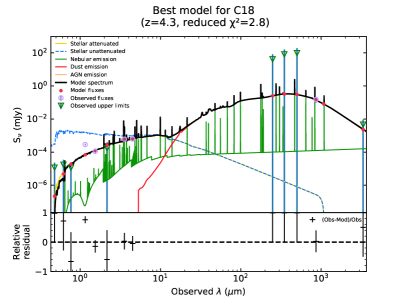
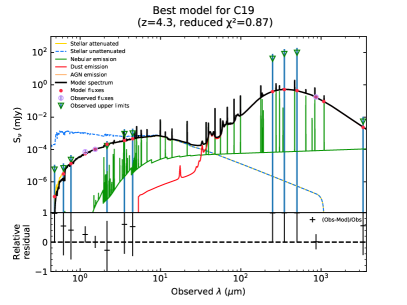
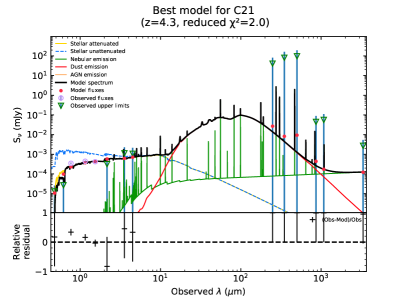
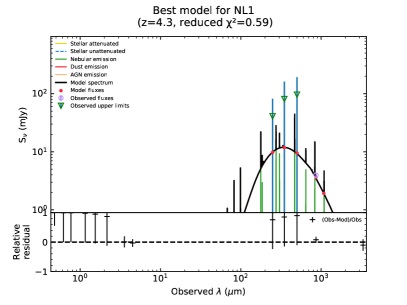
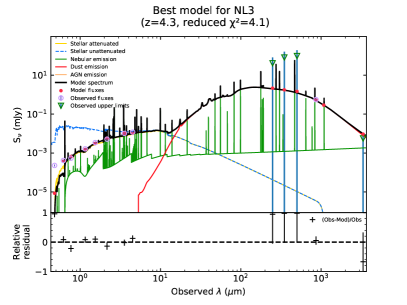
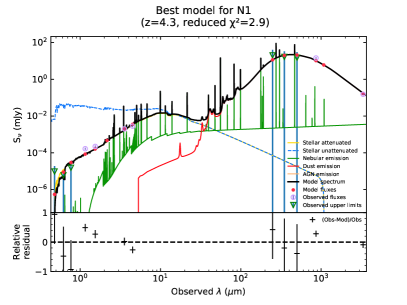
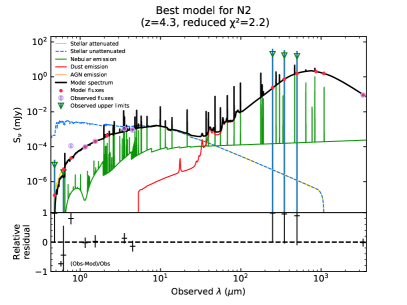
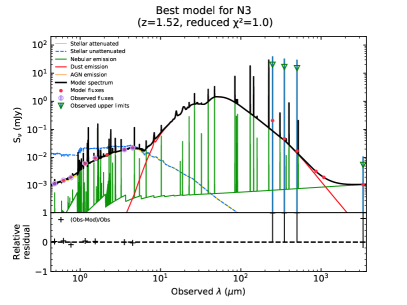
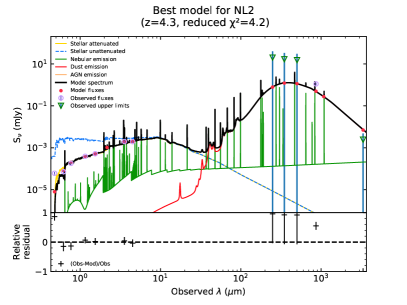
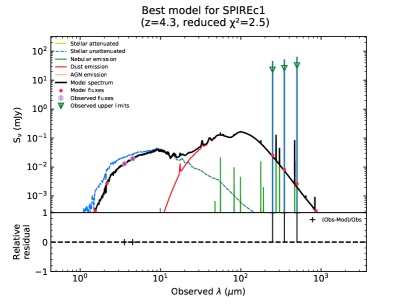
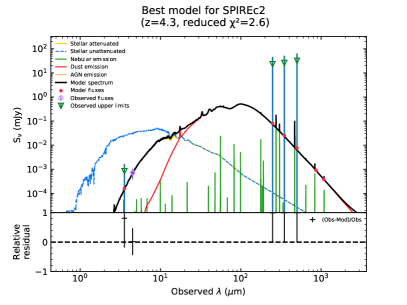
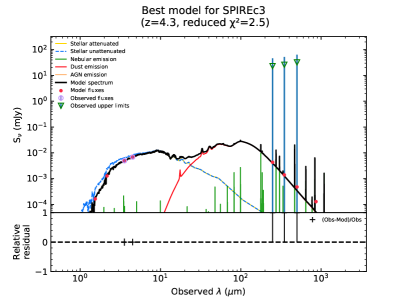
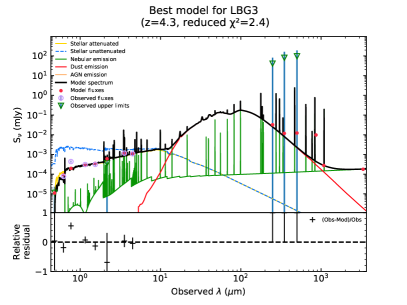
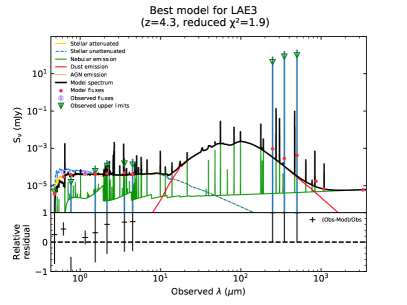
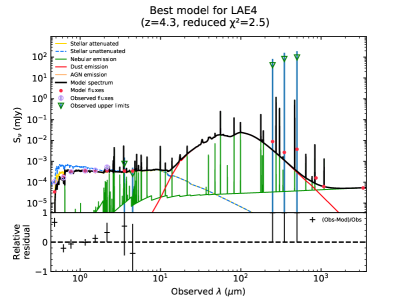
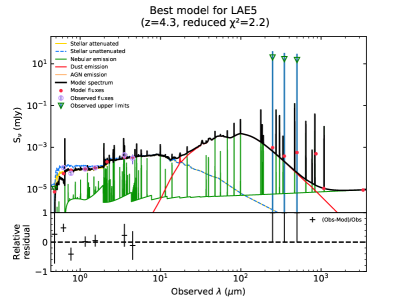
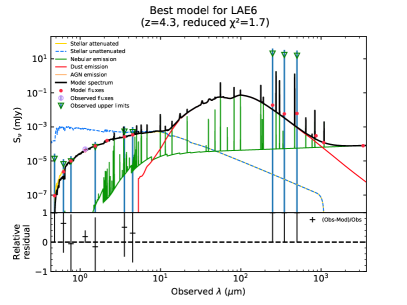
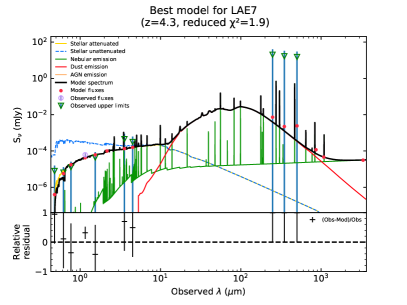
Appendix D Optical profile fits
In Fig. D16 we provide rest-frame optical (observed-frame 1.5 m) cut-outs of our sources obtained from our HST F160W imaging. Sérsic profiles were fit to all sources detected in the images above 3, including convolution with the beam, and half-light radii were estimated from the fits.
The left panels show these stacked images with 2 and 3 contours, then increasing in steps of 3, with positions found in the Cycle 5 data shown as blue points and positions found from the Sérsic profiles shown as red points. The red bars indicate the sizes of the half-light radii resulting from the Sérsic profiles, with best-fitting half-light radii and Sérsic indices shown in the top left. For sources NL2, NL3, and N3 we provide the best-fitting half-light radii in units of arcseconds (as the redshifts have not been confirmed), otherwise the best-fitting half-light radii are in units of kiloparsecs. The middle panels show our Sérsic profile models, and the right panels show the residuals. For sources below 5, where we did not attempt to fit Sérsic profiles, we leave the middle panel blank.


Appendix E [Cii] profile fits
In Fig. E17 we provide [Cii] cut-outs of our sources obtained from the high-resolution ALMA Band 7 imaging. Line-emission channels were determined from our deeper Cycle 5 data by fitting Gaussian profiles to each spectrum (see Hill et al., 2020), and these channels were stacked in the high-resolution data to create moment-0 maps. Sérsic profiles were fit to all sources with pixels detected in the moment-0 maps above 5 times the local rms, taking into account the instrumental PSF by convolving the model with the best-fit synthesized beam, and half-light radii were estimated from the fits.
The left panels show these stacked images with 2 and 3 countours, then increasing in steps of 3, with positions found in the Cycle 5 data shown as blue points and positions found from the Sérsic profiles shown as red points. The red bars indicated the sizes of the half-light radii resulting from the Sérsic profiles, and best-fitting half-light radii in units of kiloparsecs and Sérsic indices are shown in the top left. The middle panels show our Sérsic profile models, and the right panels show the residuals. For sources below 3, where we did not attempt to fit Sérsic profiles, we leave the middle panel blank.
