Boundary dynamics in competing critical black hole formation
Abstract
Expanding upon our previous study of competing critical phenomena in black hole formation, we numerically investigate the behavior of dominant exponents across the boundary separating asymptotically dispersing and collapsing regions in a two-dimensional configuration space of initial data. We find that across the Type II boundary section the dominant exponent remains constant, equal to the reciprocal of Choptuik’s well-known quasi-universal value, whereas across the Type I section the exponent noticeably varies. We postulate that this change reflects the existence of a third critical solution in addition to the two primary competing solutions, possibly another member of the family of metastable soliton stars constituting the Type I attractor.
I Introduction
The study of black hole genesis has yielded a wealth of insights into the behavior of classical gravity in the strongly interacting regime. One of the cornerstones of numerical relativity is the existence of critical phenomena accompanying their formation [17]. Generically, it has been found that when some parameter (e.g. amplitude) characterizing the abundance of matter sources in the initial data is varied there exists a sharp delineation between the sources’ collapse into a black hole and asymptotic dispersal [9, 10, 11]. Time evolutions of initial data near this threshold exhibit various quasi-universal properties [17], such as mass power laws with particular exponents, (discrete) self-similarity in the form of echoing effects, and predictable scaling in the time-to-collapse of the lapse [5, 4]. It is by the analogy of these with the physics of near conventional critical points in statistical mechanics that this behavior is referred to as critical phenomena.
In our previous paper [7] we observed the apparently counterintuitive effects of multicritical collapse, whereby two near-critical fields appeared to frustrate, rather than accentuate, the process of collapse. The starting point for our investigation was the idea that some kind of interesting interaction should be observed between near-critical massive and massless scalar fields. Since the massive scalar field exhibits Type I and Type II criticality in different regions of the parameter space of initial data [19], it might be reasonably hypothesized that such configurations are especially susceptible to Type II perturbations in the Type I phase. We observed that the two fields, when both are tuned near criticality, appear to inhibit each other’s collapsing tendencies, and suggested that this result may be attributed to the existence of a third critical solution, similar to a scenario proposed by Gundlach et al. [6].
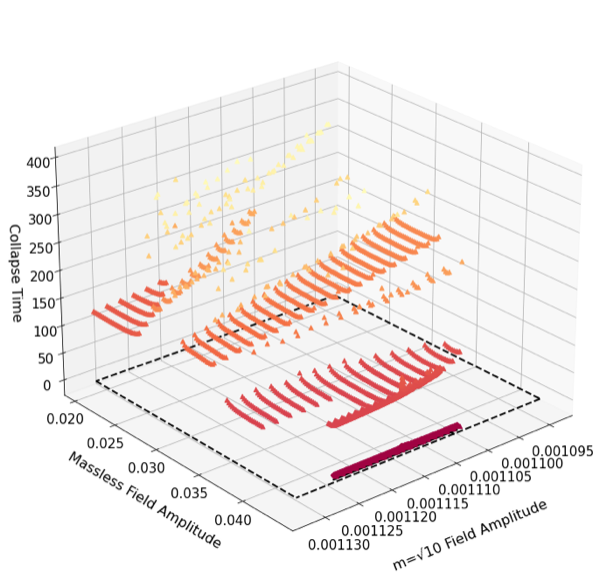
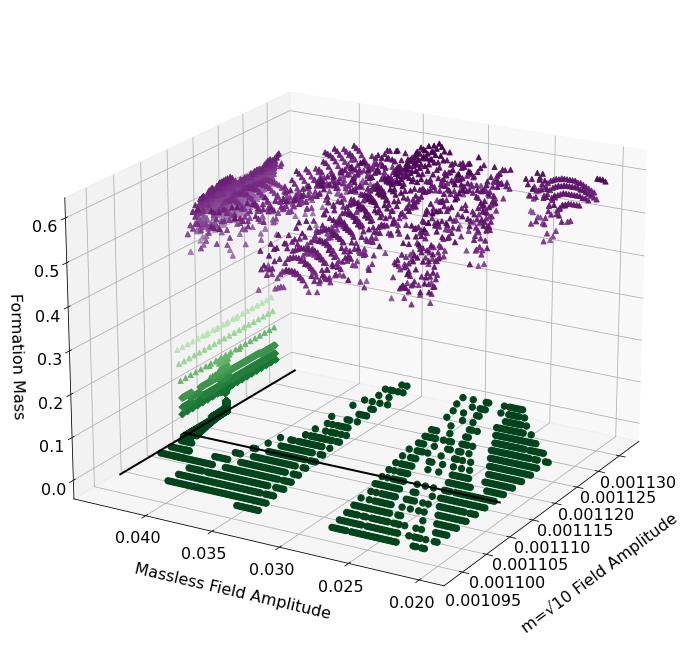
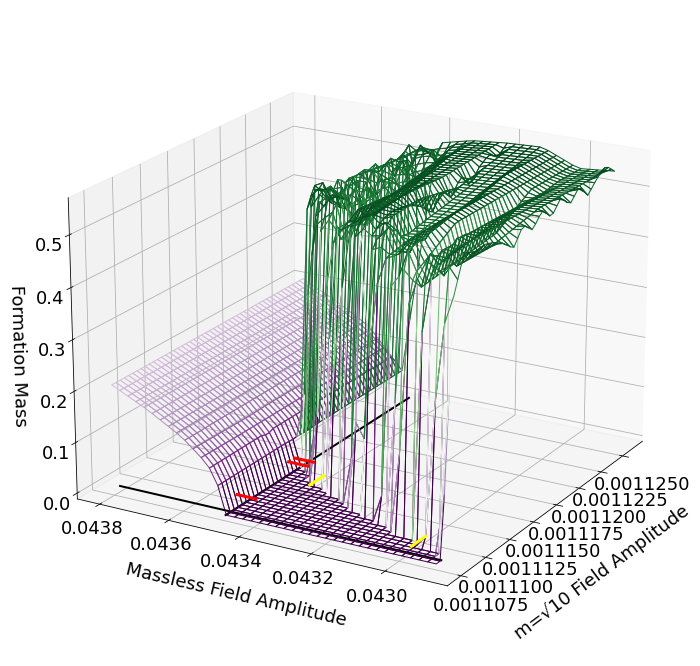
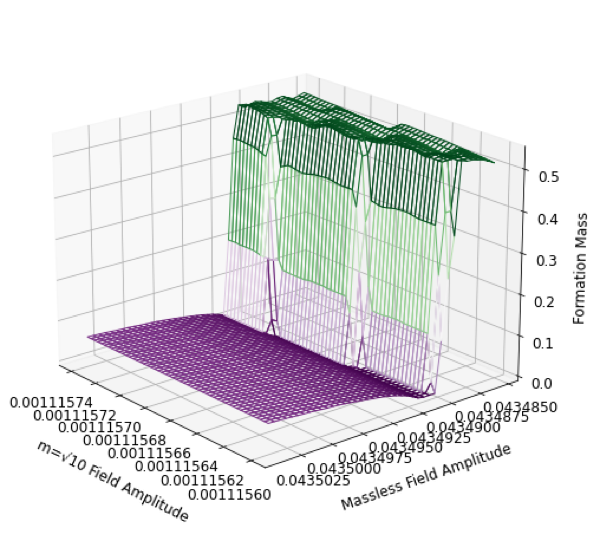
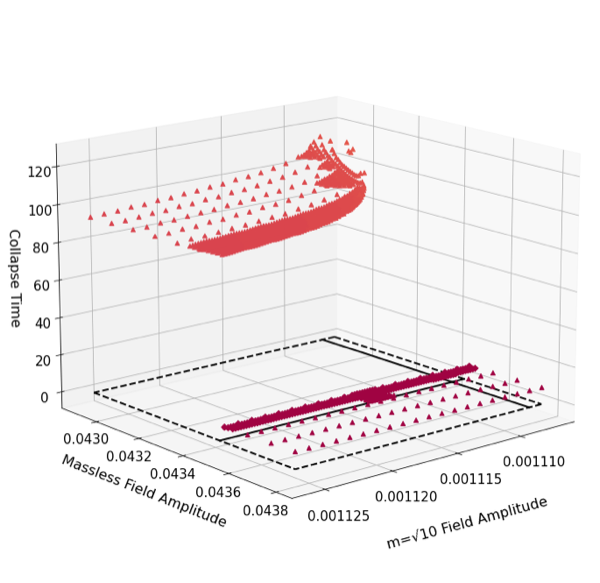
Figure 1 reflects the results of our first paper, here cast into a wire mesh plot. It depicts a phase diagram with respect to initial amplitudes for a massless and a massive scalar field minimally coupled to gravity. The z-axis reflects the black hole formation mass derived from the radius at the asymptotic time of collapse, given the initial coordinate amplitudes. The lowest values at zero mass (dark purple online) indicate asymptotic dispersal. The thick lines in the amplitude plane denote the critical amplitudes greater than which colapse would occur if only a corresponding field was present, approximately for the massless field and for the massive. We additionally show in Fig. 2 the region about the triple point in greater detail, as well as a 3d scatter plot of the time to collapse in Fig. 3. The two plateaus in this last plot correspond to the distinct critical behaviors seen in Fig. 1 through their noticably different times-to-collapse.
While the initial waveforms were chosen to accentuate the effects, the fact that dispersal scenarios exist at larger amplitudes even past the intersection of the critical lines of Fig. 1 – that is, that the coordinate values of the “triple point” are greater than the two critical amplitudes – suggests that the two fields have a mutually inhibitory effect on each other. This is a nonintuitive effect: what is in a naive sense a greater concentration of mass-energy has the result of interfering, rather than augmenting, collapse.
We suggested in our previous work that a rough dynamical systems explanation suffices to explain our results. The intuition is that the earlier critical evolution of the massless field in a sense draws the the spacetime away from the critical surface corresponding to the massive field that would otherwise determine asymptotic behavior. A simple interpretation might reduce this to a triviality in terms of an exchange of energy between the two fields, wherein the massless field implodes through the origin, carrying away some of the energy of the massive field. What is significant is that this physical argument could just as well be turned the other way: that is, the concentration of the massive field about the origin could be suspected to focus and retain the massless field. The dynamical systems sense, however, gives us the argument that the (locally in time) dominant exponent dictates the actual course of evolution, which implicates the frustration we observe. This also explains why the dispersal region impinges so considerably across the Type I critical vertical line – yet barely across the Type II critical horizontal line – in Fig 1.
The purpose of this paper is to more rigorously quantify the dynamical mechanisms at work so as to solidify assertions made in our previous paper, as well as explain other phenomena we have found since. This quantification justifies the loose time-to-collapse classification scheme used previously, showing how very different perturbations predominate across different parts of the collapse/dispersal boundary. We also discuss how an observed change in the value of the exponent associated with the dominant perturbation along the Type I section of the boundary suggests richer dynamical phenomena involving the Type I solution, possibly attributable to a third critical solution. These effects may explain additional numerical complexities we have found along the Type I section of the boundary further from the triple point.
II Methods
The methods employed in our numerical simulations are the same standard techniques [24, 16, 25] as those adumbrated in our previous paper [7]. We summarize our methodology in the following.
We take the standard ADM decomposition assuming spherical symmetry and work in the polar areal gauge, corresponding to the line element [20]. Matter in the form of massless and massive scalar fields is evolved in time via step-doubling fourth-order Runge-Kutta using the coupled equations
| (1) | |||||
Simple Sommerfeld boundary conditions are imposed at large , and appropriate anti-/symmetry constraints are taken across a staggered origin. Meanwhile, the metric equations are solved on each full time step (extrapolated during intermediate steps) following
| (2) |
| (3) |
subject to the boundary conditions of being unity at the origin and taken asymptotically Schwarzschild-like. Finally, in our previous paper we verified convergence against the momentum constraint
| (4) |
which validates our code following typical tests, showing it to be fourth-order accurate as designed. Finally, to resolve near-critical Type II behavior about the origin we use familiar methods employing multiple spatial grids, refining by a factor of two or four on each level up to five subgrids near the origin. Refinement and unrefinement are conditioned on thresholds of momentum constraint violation. Most data comes from simulations employing coarse radial gridpoints, with the radial grid extending out up to in analysis of Type I cases and truncated by an order of magnitude for the most precise Type II cases.
This paper employs standard elementary methods for numerically analyzing dynamical systems [1, 22, 14]. Near criticality, we expect that appropriately dimensionalized functions may be expanded as
| (5) |
where denotes the function when the tuning parameter is at criticality , is the most dominant perturbative exponent, and is a time variable appropriate to the critical system [5, 4]. When analyzing Type I scenarios, we take to be the difference between the asymptotic time corresponding to the space-like slice of the coarsest grid and the time to collapse in the same measure, both obtained from integration of the lapse at the radial edge of the simulation. In the Type II case, we consider the negative logarithm of the negative of this quantity instead. We shall refer to the quantity derived in these two cases as and respectively.
For the purposes of presentation, we consistently take to be the amplitude of an initially ingoing spherically-symmetric Gaussian shell with profile
| (6) |
where or for the massless and massive fields respectively, and for both fields. This configuration was specifically chosen such that the massive field undergoes Type I evolution and that both fields interact substantially early on, thus magnifying the dynamical effects of competition. By virtue of the mass, the two fields will arrive at the origin at different times; numerical considerations involving the growth of the amplitudes of ingoing waves have prevented us from arranging simultaneity while maintaining respectable precision near criticality in certain parts of the parameter space.
We variably take the perturbative to be , , or . For all simulations performed, each choice leads to the same essential results and conclusions.
We perform this analysis by taking the difference of two data sets very close to criticality, taking the norm of this quantity, and then carrying out an appropriate regression to obtain an estimate for . Explicitly, we take the difference of Eq. (5) for two distinct values of ,
| (7) |
then take the norm to remove spatial dependence, resulting in the approximation
| (8) |
This is in a form readily subjected to regression analysis.
This regression is typically valid for a reasonable time interval near collapse. We determine collapse by monitoring when the lapse drops beneath , or when NaN errors arise from the substantial curvature developing at the origin. The adjective “reasonable” cannot be dispensed: data taken too close to collapse is naturally subject to nonlinearities, with the higher order terms becoming relevant, while data coming from too long before features significant contributions from subdominant terms. Since fine-structure undulations appear in these regressions as well, the uncertainties for the derived exponents are greater than those suggested by the regressions alone.
We check the validity of these perturbative regression estimates against other observable quantities dependent upon and the tuning parameter ’s deviation from its critical value . For Type II collapse, we compare with a regression on a local measure of black hole initial formation mass near criticality [3]:
| (9) |
where, for our purposes, we will be ignoring the well-known fine-structure corrections [21], although their undulations are readily observed in the results infra. Meanwhile, for Type I collapse, we cross analyze with the collapse time:
| (10) |
which, like above, we obtain from integration of the lapse at the edge of the simulation.
Numerically solving for and perturbing the exact solution would provide much more precise values of the dominant exponent [2]. However, this would not seem so feasible for our scenario, which admits features that might preclude the simplest implementations of both the single-variable discrete self-similarity of the Type II exact solution [3], as well as the simple single metastable soliton star solution we obtain in the purely massive field Type I case [19, 12, 13]. We obtain regardless sufficient agreement between the perturbative analysis and criticality probes to make this more exacting precision unnecessary for the particular results we report and our analysis thereof.
III Results
III.1 Type II Boundary
We find that the massive field does not significantly affect the fundamental dynamics of Type II criticality. Quantitatively, we find that although the presence of a massive scalar field does have the inhibitory effect of slightly raising the massless critical parameter (from to ), it does not alter the dominant exponent associated with the Choptuon in the limit of the pure massless field.
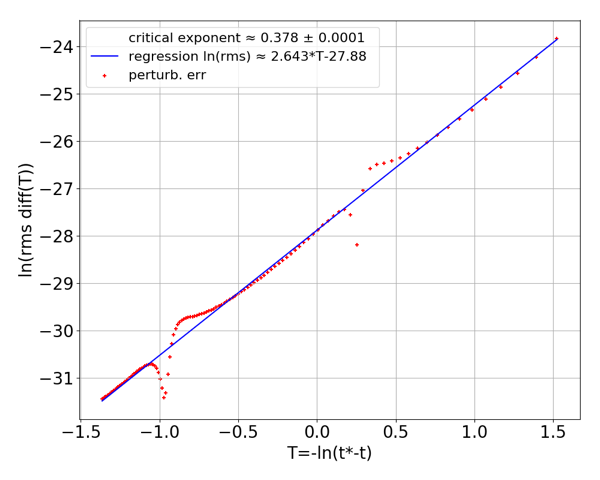
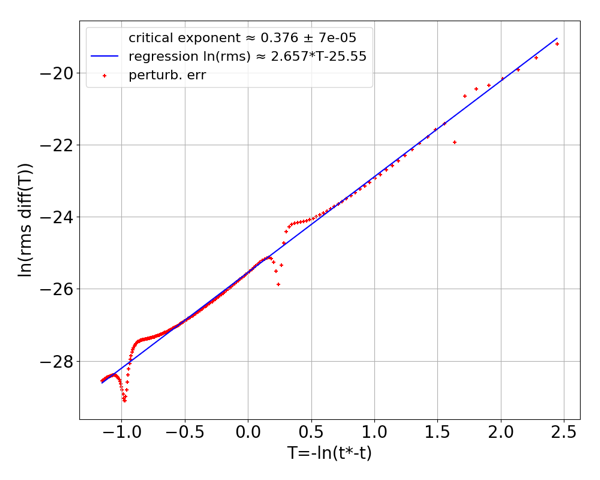
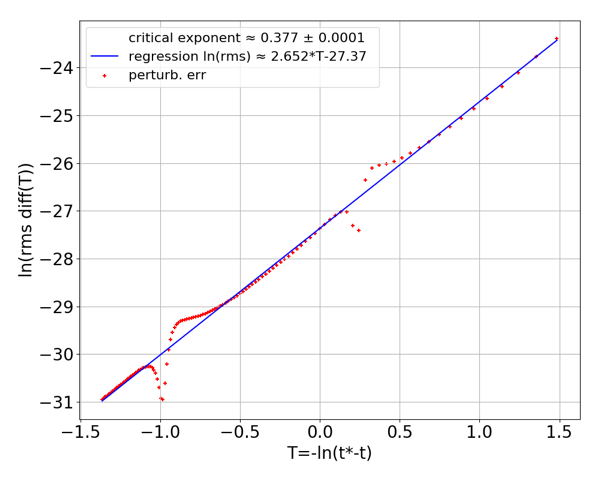
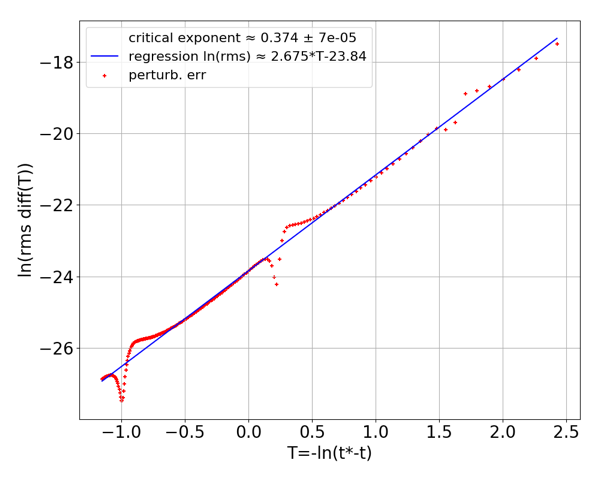
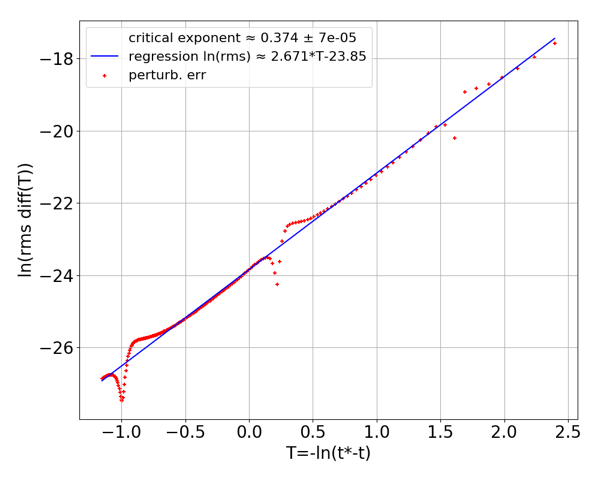
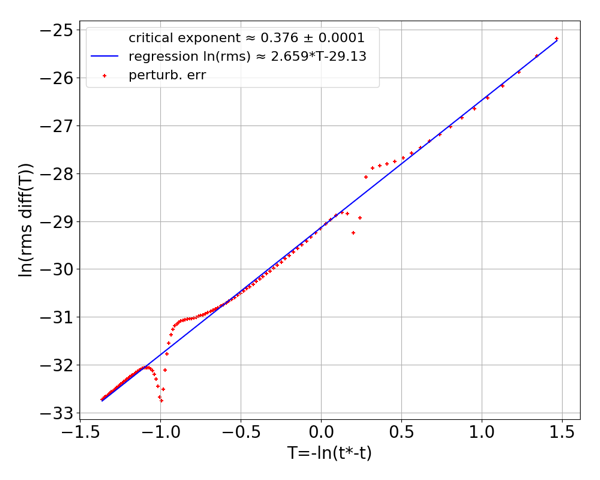
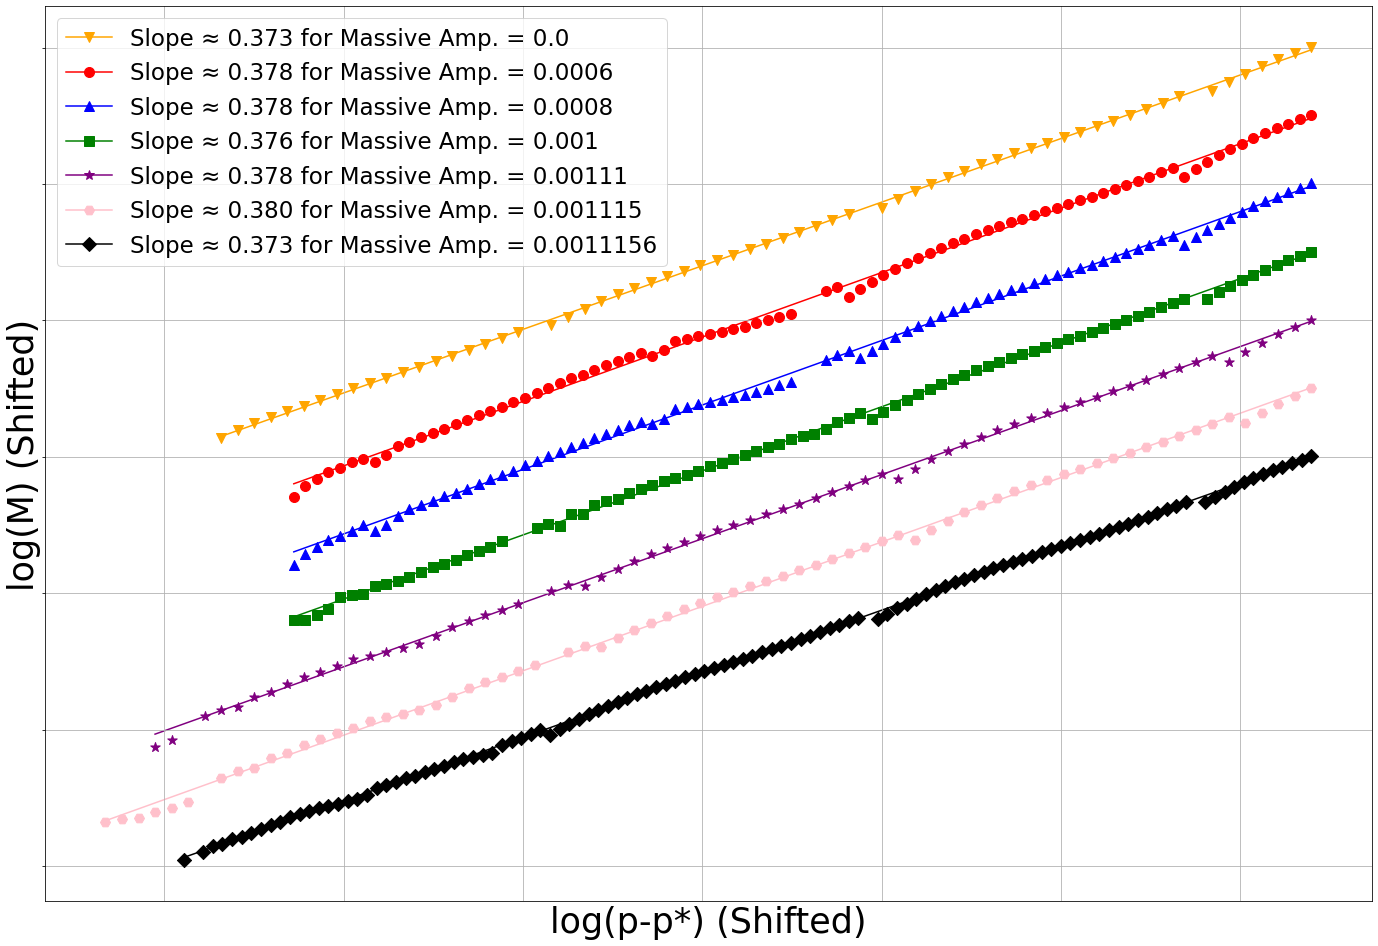
Table 1 and Fig. 4 illustrate this point. Each entry in Table 1 reflects a log-log regression of black hole formation mass versus the massless field amplitude’s deviation from criticality, while each panel in Fig. 4 shows a perturbative regression analysis via a log-log regression of the difference between two simulations near criticality versus logarithmic time-to-collapse. Figure 5 features all the mass regressions together for ready comparison by eye.
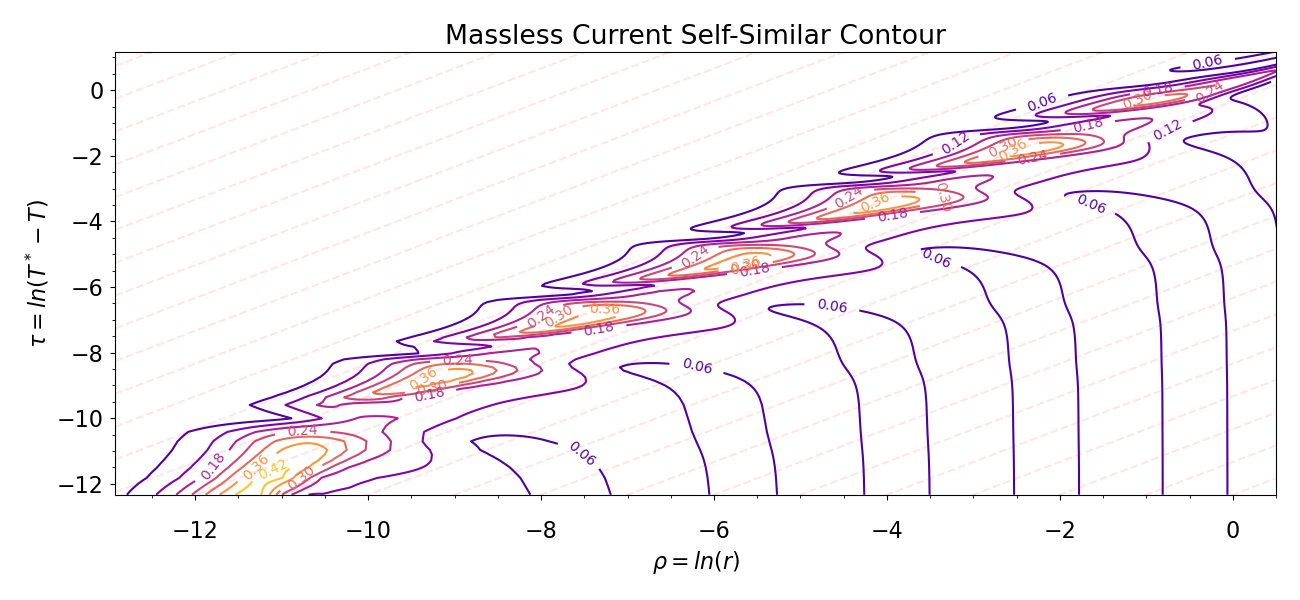
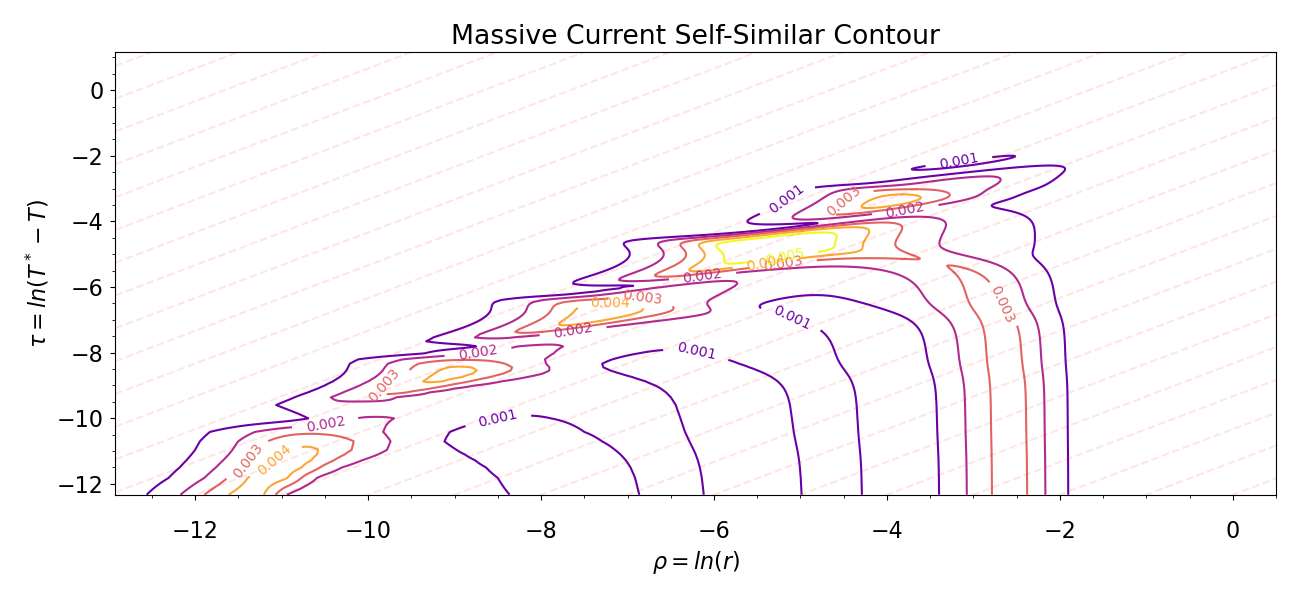
The same value of the dominant exponent, , is observed within reasonable precision across the board. This is the same as the reciprocal of the critical exponent as that associated with the case of the pure massless field from the classic investigation by Choptuik [17]. We find the expected echoing effect not only in the massless field, but the emergence of a similar period in the massive field as well. This is depicted in Fig. 6 in terms of the partial currents associated with the Kodama vector.
Thus, the presence of the massive field has only a quantitative effect on evolutionary dynamics near criticality. It does not qualitatively alter the fundamental mechanisms near collapse as reflected in the dominant exponent , although naturally the secondary field continues to fall in after the lapse collapses and contributes to the developing black hole mass.
| Type II Collapse Mass Regressions | |||
|---|---|---|---|
| Massive Field Amplitude | Slope | Intercept |
Dominant
Exponent () |
| 0.0 | 0.373 | 0.248 | 2.68 |
| 0.0006 | 0.378 | 0.308 | 2.64 |
| 0.0008 | 0.378 | 0.317 | 2.65 |
| 0.001 | 0.376 | 0.322 | 2.66 |
| 0.00111 | 0.378 | 0.315 | 2.67 |
| 0.001115 | 0.380 | 0.315 | 2.67 |
| 0.0011156 | 0.373 | 0.269 | 2.68 |
III.2 Type I Boundary
In contrast to the Type II section of the boundary, the presence of an additional field has a significant effect upon Type I collapse. This manifests quantitatively in the behavior of the dominant exponent associated to the Type I critical solution, which we have found varies depending on the massless field amplitude.
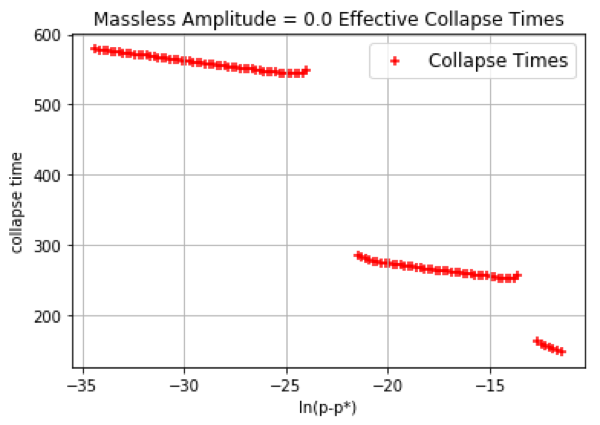
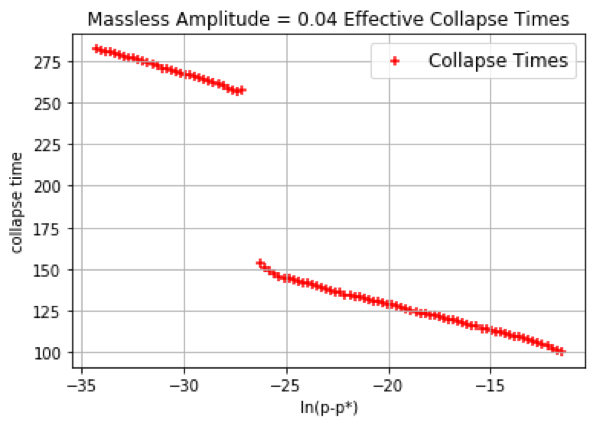
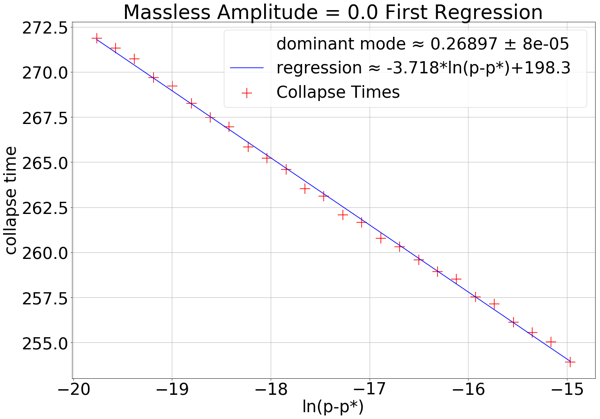
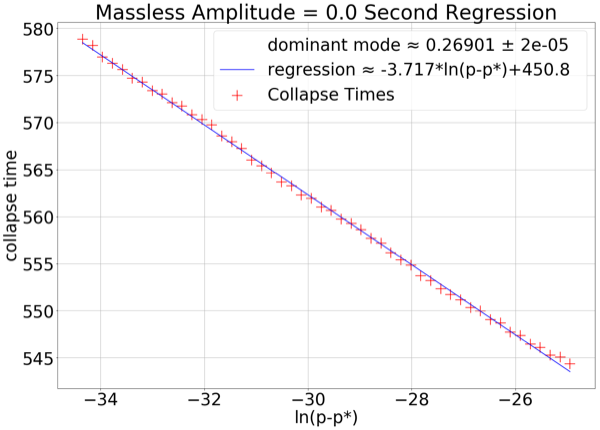
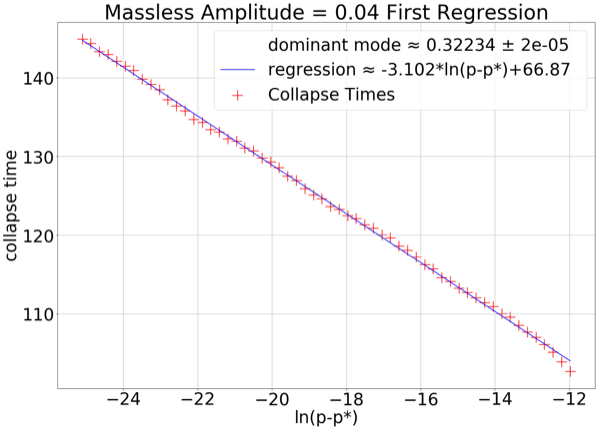
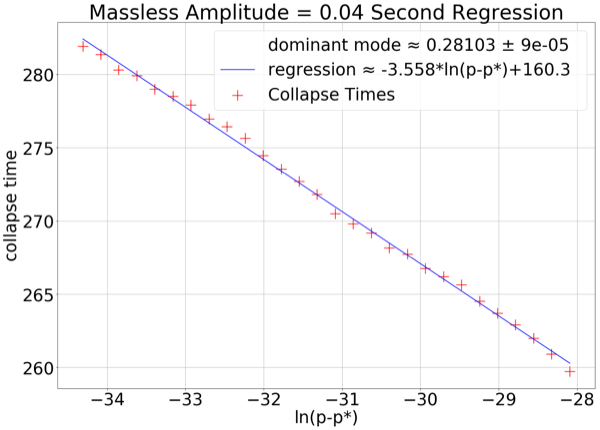
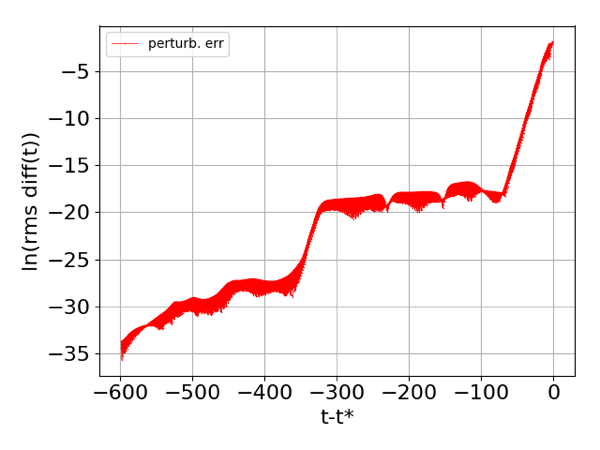
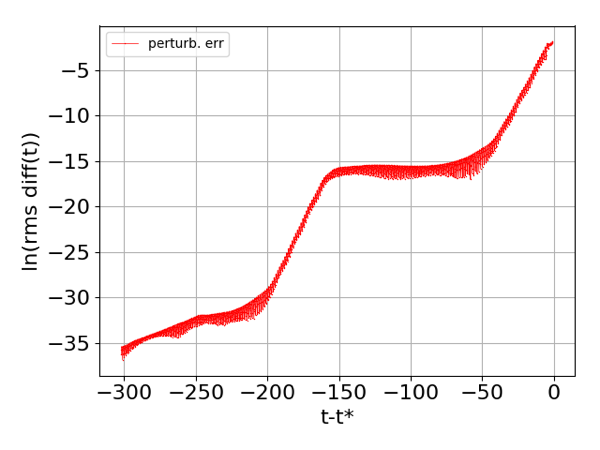
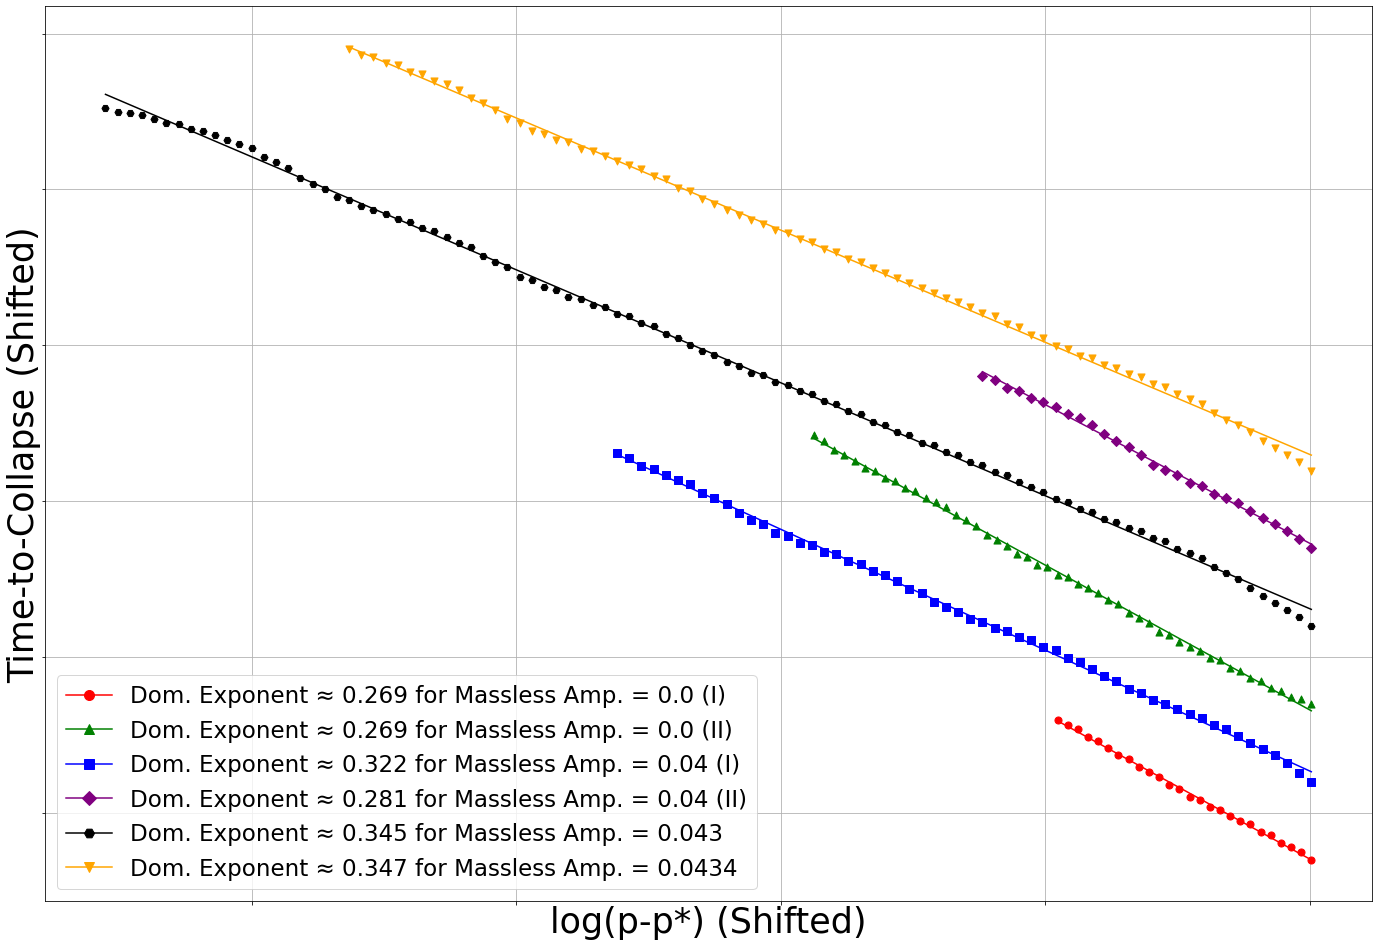
Table 2 and Fig. 7 communicate this point similarly to their foregoing Type II counterparts. The rows of Table 2 give the results of log-log regressions of the asymptotic time-to-collapse versus the massive field amplitude’s deviation from criticality, while the panels collected in Fig. 7 show various perturbative analyses performed via log-log regressions of the difference between two simulations near criticality versus time-to-collapse. Fig. 8 compiles all the time-to-collapse regressions to better facilitate comparison by eye: in contrast to Fig. 5, there appear to be two distinct slope values.
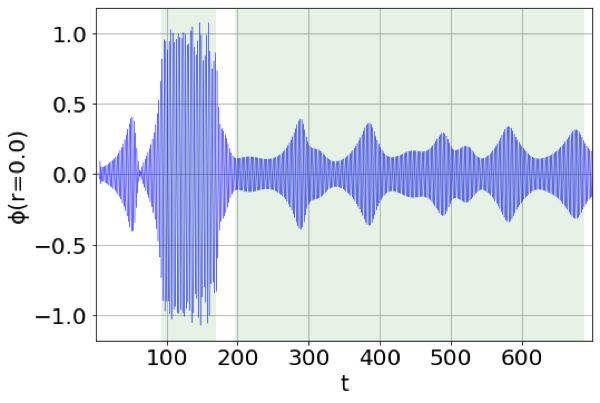
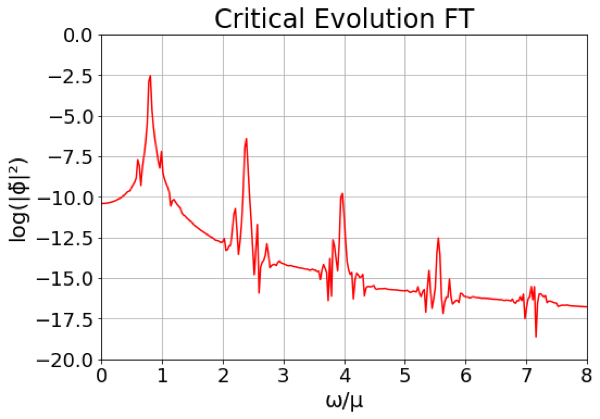
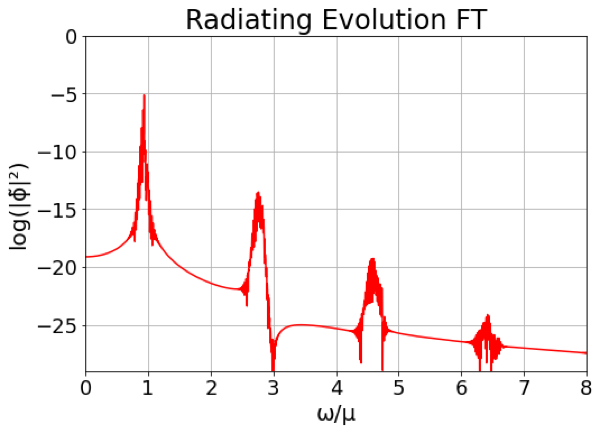
We observe the expected periodicity of the underlying critical solution across the Type I portion of the boundary. Taking a representative case in Fig. 9, we find that, during critical evolution, the field oscillates with frequency , with excited odd harmonics and sidebands corresponding to the slower undulations. Meanwhile, during the “radiating” period, the frequency changes to , with comparatively less excited harmonics, all in fair agreement with previous studies [19, 12, 13].
In contrast to the Type II case, the value of the dominant exponent noticeably changes. Near the triple point, it takes on the value . However, near the regime of a pure massive field, takes on a value closer to . Moreover, we note a significant decrease in the typical time-to-collapse as we near the triple point. This second fact matches the intuition that frustrated multicriticality otherwise runs against: collapse still happens “earlier,” as we might expect due to the presence of extra matter in the form of the secondary field, despite the counterintuitive inhibition of collapse seen in the shift in criticality.
Some entries and sets in in Table 2 and Fig. 7 are labelled by additional suffixes. This is because, as shown in Fig. 10, distinct and numerically consistent ridges appear in some collapse-of-the-lapse regressions. Even moderately away from the triple point, apparent jumps in the time-to-collapse are observed along the Type I section of the boundary. The existence of these jumps, we suspect, may be attributed to a quirk of the Gaussian initial data. Whether these jumps completely disappear or not near the triple point has not been determined.
| Type I Collapse Time Regressions | |||
|---|---|---|---|
| Massless Field Amplitude | Slope | Intercept |
Dominant
Exponent () |
| 0.0 (I) | -3.72 | 198. | 0.269 |
| 0.0 (II) | -3.72 | 451. | 0.269 |
| 0.04 (I) | -3.10 | 66.9 | 0.322 |
| 0.04 (II) | -3.56 | 160. | 0.281 |
| 0.043 | -2.90 | 66.8 | 0.345 |
| 0.0434 | -2.88 | 65.8 | 0.347 |
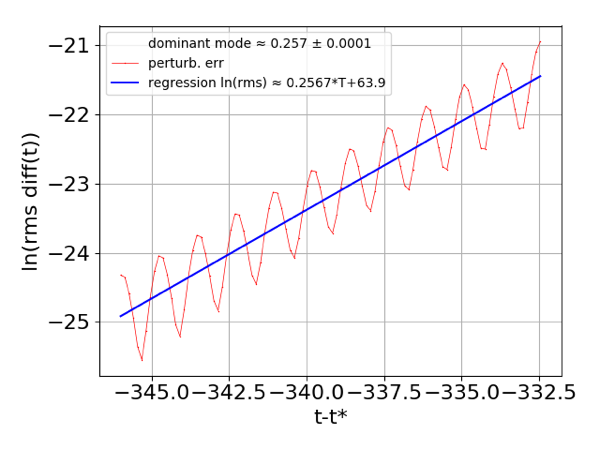
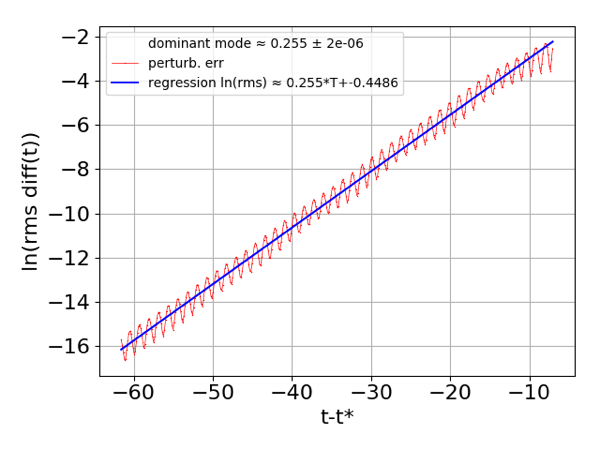
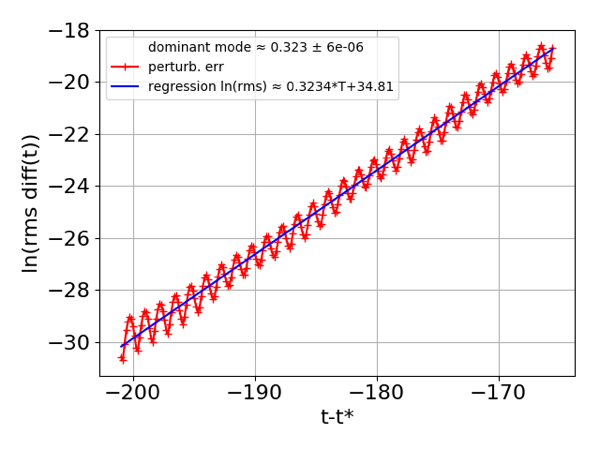
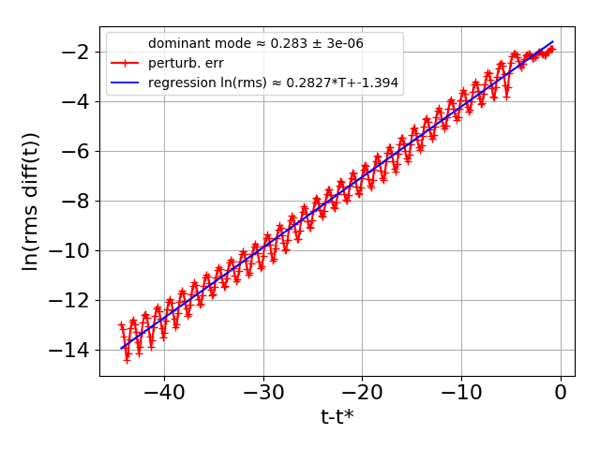
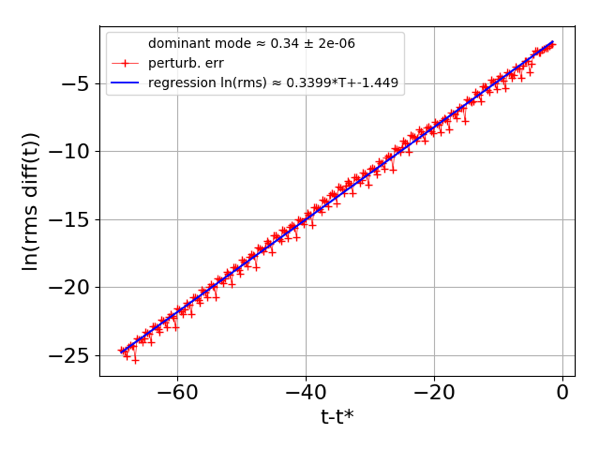
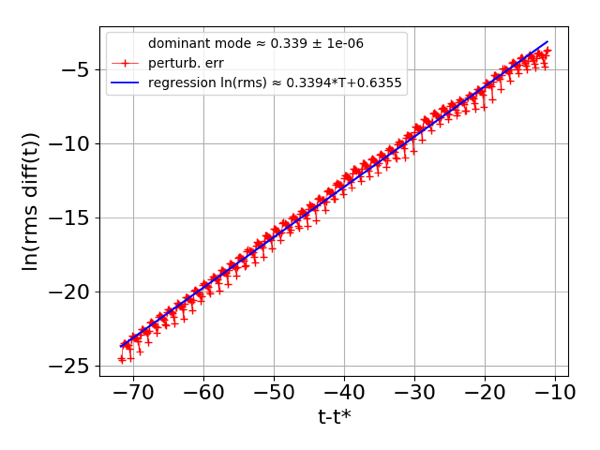
While the two most prominent slopes in the left panel of Fig. 10 appear to be equal, the two slopes in the panel on the right slightly differ. This variance appears to not be numerical error, as it is reflected in the perturbative analysis in Fig. 14. The top plot of Fig. 14 depicts a sort of rotation of the right panel of Fig. 10. The evolution of the perturbation passes through distinct regimes, with different dominant slopes modulated by underlying undulations. The two intervals of greatest growth are depicted in the lower two plots of Fig. 14. The dominant exponents obtained therefrom appreciably match those derived from the individual ridges of the right panel of Fig. 10, which are depicted in detail in Fig. 11, covering ordinate intervals roughly commensurate with the abscissa intervals of their counterparts. The two apparent dominant exponents have approximate values and
IV Transfer of Energy
In the introduction it was mentioned that the phenomenology we observe might be understood intuitively in terms of a transfer of energy. While this approach may not be helpful for its lack of decidability, in that a simple hypothesis can just as easily guess at a catalyzation of collapse instead of the inhibition we observe, it is nevertheless an interesting question to ask what this behavior actually is.
Although most local definitions of energy in general relativity suffer from various deficiencies in the absence of any particular symmetry, in the simple spherical there exists a conserved flux given as the contraction of the stress-energy tensor with a vector field known as the Kodama vector [15]. This is a kind of replacement for the fluxes associated with Killing-vectors. For the general spherically-symmetric line element its nonzero components may be written as , where are indices for the two-dimensional metric . Here it takes the simple form . Contracting with the stress-energy tensor provides the conserved current
which yields, for the current case of interest,
| (11) |
We can now integrate this over a spacelike leaf of the ADM foliation to obtain the conserved charge
| (12) |
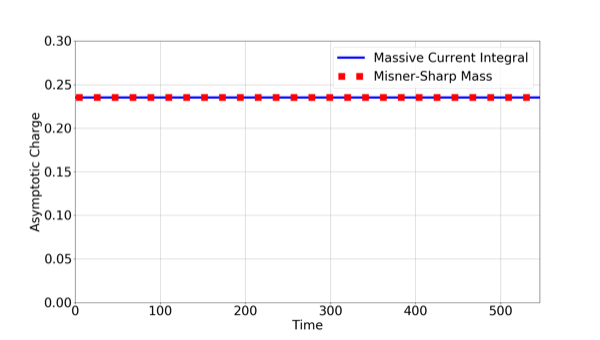
The above expression, after applying the equations of motion, leads to the classic Misner-Sharp mass function [8]. The thing of value obtained here is how this derivation provides a natural splitting of the mass aspect into a sum of the various fields’ contributions to the stress-energy tensor. While these terms individually are not conserved, they nevertheless sum to a conserved charge, and so they can be used to monitor how energy moves between matter sources. Even without this machinery, this idea is well-known, and has been used as a diagnostic before by other authors [23].
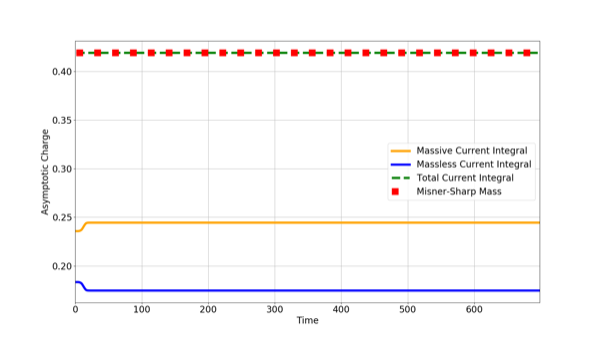
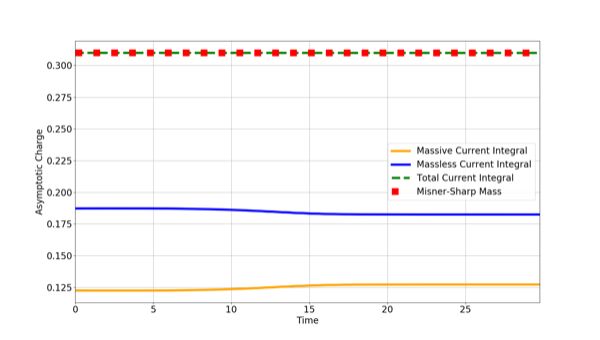
As an illustrative example, we show in Fig. 15 graphs of the various currents for two scenarios across the Type I and Type II portions of the boundary in Fig. 1. We numerically observe, as claimed supra, that the two partial charges corresponding to integrals of the individual summands of Eq. (IV) sum to the conserved total Misner-Sharp mass aspect. We not only obtain a quantitative value that can be put to the transfer of energy mentioned before, but also observe a distinct curiosity in how, for both scenarios, the massive field charge increases in time at the expense of the massless field.
This is similar to phenomenon observed by Hawley and Choptuik [23], but where there the authors considered a small massless field perturbing a complex massive boson star, here both fields are present in significant extent, the massless charge in fact being greater than the massive charge in the right graph of the figure. Despite this, a sizable portion of the energy is still nevertheless transferred around the time of the Type II critical evolution to the massive field.
More interesting is how applying a naive intuition to consideration of these currents falls short. Comparing the subcritical mixed field Type I scenario in the left panel of Fig. 15 with the supercritical case in Fig. 17 shows that scenarios with not only greater total charge, but even greater partial charges may not necessarily have a greater propensity to collapse.
The idea that a less massive configuration may lead to black hole formation while a more massive one doesn’t is hardly inconceivable, since intuitively the relevant notion is density. However, since the initial data for the massive field does not differ significantly between the left panel of Figs. 15 and 17, this kind of difference in aspect is inadequate to explain this. A qualitative change in the time evolution due to gravitational coupling with the massless field appears necessary; this is intriguing, since it might be thought that the effect of gravity should be to concentrate the fields together and hence promote, rather than inhibit, collapse.
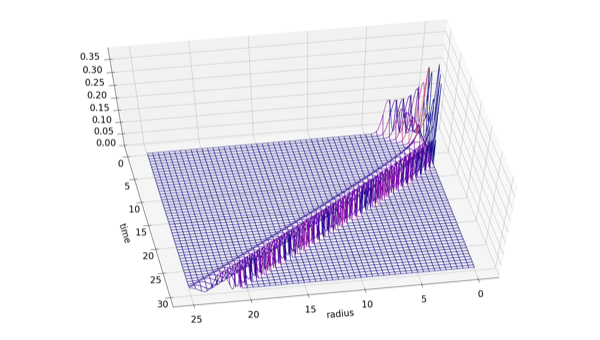
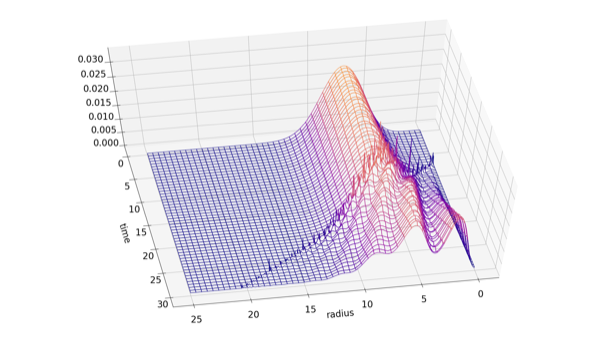
A look at the partial currents as a function of position and time in Fig. 16 shows behavior that might provide such a mechanism. The strong gravitational effects occurring during critical evolution are seen to result in a transfer of high frequency modes from the massless field to the massive field. These modes proceed to spill outwards and generate daughter modes as they scatter off of the original massive current. This is a more dramatic manifestation of the transfer of echoing seen in Fig. 6, and is likely the true source of the decrease in compactification, hence the ultimate cause of inhibited collapse.
V Discussion
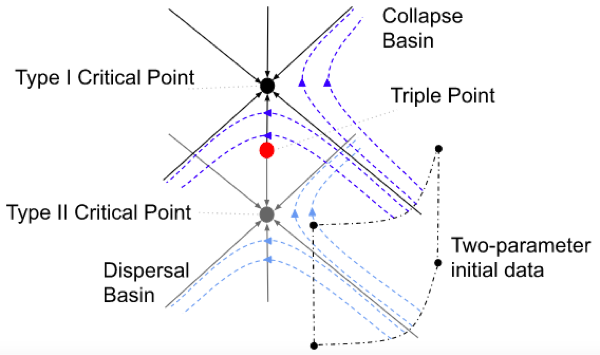
In our previous paper, we postulated that the multicritical phenomena seen in our scenario could reflect an alternative dynamical situation considered by Gundlach et al. [6], which they ultimately dismissed in the case they considered. This possibility is illustrated in Fig. 18 here, which shares a kinship with Fig. 13 of their paper. Between the two primary attractors at play (the Choptuon and the family of metastable soliton stars) there exists a third critical solution influencing the dynamics with its own dominant perturbative exponent. Our results supra, featuring an apparently changing dominant exponent along the Type I section of the boundary, support this conclusion: the “competition” we observe in our setup would appear to feature, as it were, a third belligerent.
Another comparison with Gundlach et al.’s paper is apposite to our point. In Fig. 8 of their paper, they observe “breaks” in the apparent critical exponent for their scenario in the region of their phase space where the Yang-Mills field mostly – but not overwhelmingly – dominates the scalar field. They ascribe these breaks to a straight-forward change between their two critical solutions, moving from the massless critical solution () to the Yang-Mills critical solution (). It might be wondered if the “jumps” we observe are similar in nature.
We do not construe the evidence such that our results can be attributed so. The dominant exponent along the Type II section of the collapse/dispersal boundary is , derived from a logarithmic time scale. Meanwhile, the two differing dominant exponents observed along the Type I section of the boundary appear to range around and , which are derived from a linear time scale operant upon values of asymptotic orders of magnitude greater than those reached in the Type II case. By themselves, these differing values of aren’t directly comparable precisely because they come from analysis based upon different symmetry assumptions; however, considering the Type I section of the boundary in logarithmic units doesn’t yield dominant exponents consistent with the collapse time regressions, or even anything appreciably linear. We accordingly cannot ascribe the variation in to Type II effects. An explanation is to be sought from a different dynamical effect. We thus postulate that a third critical solution, possibly another part of the Type I attractor which is a family of metastable soliton stars, as a more reasonable explanation of our results.
A comparison with a study on Yang-Mills fields is also appropriate [18]. There, the authors consider the critical behavior of a two-parameter Yang-Mills kink, which like ours in different parts of their configuration space (depicted in their Fig. 4) variably exhibits Type I and Type II collapse or asymptotic dispersal. Their three boundaries correspond to the expected Type I and Type II critical solutions, as well as a third class of static colored black holes along the Type I/Type II interface. The authors entertain the thought of how a two-parameter massive field might exhibit similar behavior to their results, with the caveat that no-hair theorems dictate the nonexistence of static solutions that would be analogous to their Type I/Type II boundary.
Our paper does not exactly coincide with their work nor their analysis, since it concerns two fields that, near the triple point, are both simultaneously critical by themselves. For the reason, too, that our code was designed to work at such precision with mesh refinement as to ascertain the correct scaling, echoing, periodicity, and the like to numerical precision to solidify our claim of competing critical effects coupled only by the gravitational interaction between two separate fields, our method is not able to probe the post-collapse behavior. However, we can report the mass and time-to-collapse behavior near our Type I/Type II interface goes as expected, with the former decreasing towards the triple point and the latter increasing.
We close with a final mention of a curious behavior we have encountered. Between the triple point and the pure massive field regime in the phase portrait of scalar amplitudes, we find behavior a great deal more elaborate than that found by tracing out the Type II section of the boundary. This vexing situation is shown in Fig. 20. The Choptuon being such a strong attractor likely explains why this effect was not seen along the Type II section of the boundary. The influence of a hypothetical third critical solution, whose properties would seem necessarily similar to – but not precisely the same as – the metastable star, might be responsible for this interesting behavior. Another explanation could attribute the effect merely to a change in the dynamical behavior of the Type I attractor: in this case, Fig. 20 suggests that this evolution in itself is a rather involved phenomenon.
VI Conclusion
We have put the claims advanced in our previous paper [7] on more quantitative grounds by numerically investigating dominant perturbative exponents across the collapse/dispersal boundary of Fig. 1, employing two separate methods as cross-checks to ensure consistency. We justified our categorization for the reason of the drastically different dominant exponents and time scales at play across the various sections of the dispersal/collapse boundary. Furthermore, our analysis of the varying dominant exponent along the Type I section of the boundary suggests the existence of an emergent third critical solution, as we suggested following an alternative possibility considered by Gundlach et al. [6].
A large portion of the numerical region between the triple point and the regime of the pure massive field has proven to be numerically intractable using our current methods. While a third critical solution with influence near that of the Type I solution could explain this difficult behavior, the lack of quantitive surety leaves much unexplained absent results by a satisfactory alternative approach.
Qualification, too, of the nature of the jumps we observe in the Type I collapse times may warrant further investigation, clarifying whether such jumps are seen close to the triple point at greater precisions, and what determines the height of the jumps and the lengths of their associated ridges. For the reason that the slopes of the ridges reflect a change in the dominant perturbative exponent, we can wonder whether structures in the numerically intractable region exhibit features associated with such changes as well, since according to our hypothesis they share a common origin.
Acknowledgements.
We gratefully acknowledge the technical support and computational resources of the Center for High Performance Computing at the University of Utah.References
- A. Stuart and A.R. Humphries [1998] A. Stuart and A.R. Humphries, (1998), Dynamical Systems and Numerical Analysis (Cambridge University Press).
- C. Gundlach [1995] C. Gundlach, (1995), Phys. Rev. Lett. 75, 3214, gr-qc/9507054.
- C. Gundlach [1997] C. Gundlach, (1997), Phys. Rev. D 55, 695, gr-qc/9604019.
- C. Gundlach [2003] C. Gundlach, (2003), Phys.Rep 376, 376–405, gr-qc/0210101.
- C. Gundlach [2007] C. Gundlach, (2007), Living Rev. Relativity 10 (5), gr-qc/0711.4620.
- C. Gundlach, T.W. Baumgarte, and D. Hilditch [2019] C. Gundlach, T.W. Baumgarte, and D. Hilditch, (2019), Phys. Rev. D. 100 (1), 104010, gr-qc/1908.05971.
- C. Kelson-Packer and J. Belz [2020] C. Kelson-Packer and J. Belz, (2020), Phys. Rev. D 102, 084050, arxiv: 2008.06774.
- C.W. Misner and D.H. Sharp [1964] C.W. Misner and D.H. Sharp, (1964), “Relativistic Equations for Adiabatic, Spherically Symmetric Gravitational Collapse,” Phys. Rev. 136.
- D. Christodoulou [1986a] D. Christodoulou, (1986a), Commun. Math. Phys. 105, 337–361.
- D. Christodoulou [1986b] D. Christodoulou, (1986b), Commun. Math. Phys. 106, 587–621.
- D. Christodoulou [1987] D. Christodoulou, (1987), Commun. Math. Phys. 109, 613–647.
- E. Seidel and W. M. Suen [1990a] E. Seidel and W. M. Suen, (1990a), Phys. Rev. D 42, 384.
- E. Seidel and W. M. Suen [1990b] E. Seidel and W. M. Suen, (1990b), Phys. Rev. Lett 66, 1659.
- G. Teschl [2012] G. Teschl, (2012), Ordinary Differential Equations and Dynamical Systems (American Mathematical Society).
- H. Kodama [1980] H. Kodama, (1980), “Conserved Energy Flux for the Spherically Symmetric System and the Backreaction Problem in the Black Hole Evaporation,” Prog. Theor. Phys. 63 (4), 1217–1228.
- M. Alcubierre [2008] M. Alcubierre, (2008), Introduction to 3+1 Numerical Relativity (Oxford University Press).
- M.W. Choptuik [1993] M.W. Choptuik, (1993), Phys. Rev. Lett. 70, 9–12.
- M.W. Choptuik, E.W. Hirschmann and R.L. Marsa [1999] M.W. Choptuik, E.W. Hirschmann and R.L. Marsa, (1999), “New Critical Behavior in Einstein-Yang-Mills Collapse,” Phys. Rev. D. 60.
- P.R. Brady, C.M. Chambers, and S.M.C.V. Goncalves [1997] P.R. Brady, C.M. Chambers, and S.M.C.V. Goncalves, (1997), Phys. Rev. D 56, R6057, gr-qc/9709014.
- R. Arnowitt, S. Deser., and C.W. Misner [1962] R. Arnowitt, S. Deser., and C.W. Misner, (1962), “The dynamics of General Relativity,” in Gravitation: An introduction to current research, edited by L. Witten (John Wiley) pp. 227–265.
- S. Hod and T. Piran [1996] S. Hod and T. Piran, (1996), gr-qc/9606087.
- S. Strogatz [2015] S. Strogatz, (2015), Nonlinear dynamics and Chaos (CRC Press).
- S.H. Hawley and M.W. Choptuik [2000] S.H. Hawley and M.W. Choptuik, (2000), “Boson stars driven to the brink of black hole formation,” Phys. Rev. D. 62.
- T.W. Baumgarte and S.L. Shapiro [2010] T.W. Baumgarte and S.L. Shapiro, (2010), Numerical Relativity: Solving Einstein’s Equations on the Computer (Cambridge University Press).
- W.H. Press, S.A. Teukolsky, W.T. Vetterling, and B.P. Flannery [2007] W.H. Press, S.A. Teukolsky, W.T. Vetterling, and B.P. Flannery, (2007), Numerical Recipes: The Art of Scientific Computing (Cambridge University Press).
