Multiscale Wavelet Transfer Entropy with Application to Corticomuscular Coupling Analysis
Abstract
Objective: Functional coupling between the motor cortex and muscle activity is commonly detected and quantified by cortico-muscular coherence (CMC) or Granger causality (GC) analysis, which are applicable only to linear couplings and are not sufficiently sensitive: some healthy subjects show no significant CMC and GC, and yet have good motor skills. The objective of this work is to develop measures of functional cortico-muscular coupling that have improved sensitivity and are capable of detecting both linear and non-linear interactions. Methods: A multiscale wavelet transfer entropy (TE) methodology is proposed. The methodology relies on a dyadic stationary wavelet transform to decompose electroencephalogram (EEG) and electromyogram (EMG) signals into functional bands of neural oscillations. Then, it applies TE analysis based on a range of embedding delay vectors to detect and quantify intra- and cross-frequency band cortico-muscular coupling at different time scales. Results: Our experiments with neurophysiological signals substantiate the potential of the developed methodologies for detecting and quantifying information flow between EEG and EMG signals for subjects with and without significant CMC or GC, including non-linear cross-frequency interactions, and interactions across different temporal scales. The obtained results are in agreement with the underlying sensorimotor neurophysiology. Conclusion: These findings suggest that the concept of multiscale wavelet TE provides a comprehensive framework for analyzing cortex-muscle interactions. Significance: The proposed methodologies will enable developing novel insights into movement control and neurophysiological processes more generally.
Index Terms:
corticomuscular coupling, information transfer, wavelets analysis, multiscale, cross-frequency coupling.I Introduction
Functional coupling between the electroencephalogram (EEG) recorded over sensorimotor cortex and the electromyogram (EMG) of active muscles is usually quantified by using the spectral method of coherence estimation [1]. Cortico-muscular coherence (CMC) has been demonstrated in the band, Hz, in both humans and non-human primates [1, 2, 3]. Many authors have found CMC in the band to be task dependent [1], related to motor performance [2], and modulated by different types and intensities of afferent stimuli [3]. These studies, and many others, show that synchronous EEG-EMG recordings contain substantial information on neurophyisological mechanisms of movement control, and that some of the cortex-muscle interaction is linear. However, details of the generation, propagation, and function of CMC are still unclear [4]. Towards exploring its origin and function, some studies have applied Granger causality (GC) or directed coherence (DC) [5, 4, 6]. However, both CMC and GC analysis currently used in motor neurophysiology have limitations that impede their clinical use. In particular, conventional CMC and GC only capture linear associations between processes and are not sufficiently sensitive: for healthy subjects with good motor skills, the values of CMC and GC may even fall below the significance threshold [3, 7]. Recently, the concept of cross-spectral coherence has been developed, capable of assessing synchrony between distinct frequencies that arises as a result of non-linear coupling [8, 9, 10]. However, its discrete frequency nature necessitates some prior knowledge about synchronised frequencies, or about the type of non-linearity and the direction of information propagation. The methodology is therefore most effective in combination with methods that analyse coupling across frequency bands, including the method proposed here.
Information theory provides principled tools to quantify the transmission of information, such as mutual information (MI), directed information (DI), and transfer entropy (TE). Their model-free nature and ability to capture both linear and non-linear relationships has spurred considerable interest in their potential for detecting and quantifying functional neurophysiological coupling [11, 12, 13, 14, 15, 16, 17, 18, 19, 20, 21, 22, 23]. Neurophysiological information transfer takes place within and across distinct functional bands of neural oscillations. With the goal of unravelling principles and protocols of neural communications we propose the concept of TE in the domain of a dyadic wavelet transform that approximately performs signal decomposition into these functional bands. For the analysis of cross-frequency coupling (CFC) of neural oscillations using information theoretic measures two methodologies have recently been developed: Malladi et al. proposed using MI in the domain of the discrete Fourier transform (DFT) computed over adjacent non-overlapping signal segments [14], whereas Shi et al. proposed TE between amplitudes/phases or overall intrinsic mode components obtained via empirical mode decomposition (EMD) [20]. The methodology proposed here is an extension of the MI approach in [14] that allows for the detection of the direction of information propagation, owing to its reliance on TE. Moreover, it performs the analysis in the functional frequency bands of neural oscillations as advocated in [14], which are physiologically more relevant than the interactions across instantaneous frequencies [24] considered in [20].
Estimation of TE requires representing the considered processes by embedding delay vectors that consist of their samples separated in time by embedding delays [12]. Adequate selection of embedding delays and the dimensions of embedding vectors, referred to as the embedding dimensions, requires a careful balance between conflicting requirements: one must ensure that embedding vectors describe the considered processes well, whilst keeping their dimension small enough to allow reliable TE estimation from limited data. To that end, various criteria have been developed [17, 25, 26, 27]. The two most commonly used are the practical and partly heuristic criterion by Cao [25] and the optimal search-based criterion by Ragwitz and Kantz [26], along with its efficient implementation [19]. The selection of embedding vectors, however, depends on various assumptions about the underlying system, and remains not well understood in general [27]. Hence, in the applications of information theoretic measures in neurophysiology the embedding parameters are often set heuristically, based on domain specific knowledge, or governed by other methodological choices [14, 15, 16, 18].
As signals in frequency bands of neural oscillations reflect mixtures of concurrent brain processes, one set of embedding vectors seems insufficient to describe complex brain processes. This is true even within a single function, where we typically observe phase-to-phase, phase-to-amplitude, amplitude to amplitude and more complex interactions [20]. Therefore, we propose TE analysis in the dyadic wavelet transform domain using embedding vectors that represent sub-band signals at different time scales and refer to this approach as multiscale wavelet transfer entropy. In experiments with simulated data, the multiscale wavelet TE reliably and robustly detects information transfer between processes. Our empirical results obtained by applying this methodology to synchronous EEG-EMG signals show that it detects cortico-muscular interactions regardless of whether subjects exhibit significant CMC or GC, with largely consistent intra- and cross-frequency band patterns that are in agreement with the underlying motor neurophysiology.
The paper is organised as follows. Section II reviews relevant aspects of TE analysis. Section III describes the proposed multiscale wavelet transfer entropy methodology. Section IV and Section V report the experimental results using simulated data and physiological recordings. A discussion and conclusions are presented in Section VI and Section VII.
II Background
II-A TE and its Estimation
Given two time series of interest and , TE measures the amount of information that the past samples of the source process provide about the target process’ next state given its past samples [28]. TE is formally defined as
| (1) |
where represents the conditional MI of jointly distributed random variables , and the expectation is taken over their joint probability distribution. The definition of the TE can be modified to account for an arbitrary source-target delay as [11]
| (2) |
where we have defined .
The definition (2) implicitly assumes that processes and are jointly stationary Markov processes with parameters and . When this is not the case, sensible causality measures should account for properly defined variables that capture the memory of observed processes [12]. We thus consider a form of (2) where state variables are defined from non-successive samples of the processes [12]. To this end, we define the delay embedding vectors
| (3a) | |||
| (3b) |
where and are known as embedding delays, and and are known as embedding dimensions for the time series and , respectively. The TE is then redefined as
| (4) |
Estimating the TE (4) from a finite number of samples of the time series of interest is a complex task, which should account for the type of data and its properties [13]. We focus here on continuous-valued data, as is typical in neurophysiology. To simplify the notation in (4), we first let , , and . Using this notation, the TE (4) can be rewritten as sum of four differential entropies as [29]
| (5) |
The TE in (5) can then be estimated by combining estimates of the individual differential entropy terms, which can be obtained using either parametric or non-parametric methods [30]. For neurophysiological data, non-parametric techniques, such as kernel and nearest-neighbor estimators have been shown to be most data-efficient and accurate [11, 13]. In the present study we use the Kraskov, Stögbauer, Grassberger (KSG) technique [31] for TE estimation, which builds on the Kozachenko and Leonenko (KL) estimator [32] of log-probabilities via nearest-neighbour counting [13].
II-B Statistical Testing
The TE between two independent time series is equal to 0. However, when it is estimated using a finite amount of data, this may not be the case. A key question is then whether a given estimate is statistically different from 0, and therefore provides sufficient evidence for interactions between observed processes. Towards establishing statistically significant interactions, all considered methods were applied to a total of 1000 pairs of independent random Gaussian sequences with the variances equal to the variances of investigated EEG and EMG signals, and the obtained results were used to form empirical distributions of CMC, GC and TE that correspond to such independent processes. The 95% confidence levels (CL) above which CMC, GC, and TE are considered to indicate genuine interactions are then set as 95 percentiles of the respective empirical distributions. In the case of CMC, this level admits the closed form expression given in [33].
III Multiscale Wavelet Transfer Entropy
III-A Dyadic Stationary Wavelet Transform
Towards developing an understanding of information transfer within and across functional frequency bands of neural oscillations, Hz, Hz, Hz, Hz, and Hz bands, we propose TE analysis in the domain of a wavelet transform that decomposes signals into components that approximately occupy these bands. In particular we propose using the discrete dyadic stationary wavelet transform (SWT) as detailed in the following.
III-A1 Dyadic stationary wavelet transform
The dyadic SWT proposed here decomposes a signal into its subband components . These are obtained by convolving using filters , respectively, as
| (6a) | |||
| and | |||
| (6b) | |||
where denotes the total number of scales of the wavelet transform indexed by . The filters are derived from two prototype filters and through an iterative procedure that is specified in the -transform domain as
| (7a) | |||
| (7b) |
The SWT, also known as the non-decimated wavelet transform, is a translation-invariant modification of the conventional discrete wavelet transform (DWT), that is obtained by removing the downsampling operators from the channels of the DWT, as illustrated in Figure 1(a) and 1(b). In addition to making the SWT be translation invariant, the absence of the downsampling operators in the SWT has other important benefits in this context: it retains considerably more data for TE estimation compared to the conventional DWT and it allows for a more flexible filter design under requirements of no information loss [34].


III-A2 Time-frequency resolution
Filters and are designed to be half-band low-pass and half-band high-pass, respectively. Hence, components and occupy approximately frequency bands
respectively. If signals are acquired using Hz sampling, then , , , , and approximately represent high , low , , , and oscillations, respectively. Analogous correspondence of the frequency bands holds for other sampling frequencies that are powers of larger or equal than Hz, whilst for other sampling frequencies such a correspondence can be achieved by employing a re-sampling pre-processing step.
The time resolution is governed by the filter length, and, as is inherent to all types of the wavelet transform, it is progressively higher with ascending frequencies. Thus, it is well suited for representing both transient events, which typically reside at high frequencies, as well as large scale processes composed of low-frequency oscillations. Additional flexibility in terms of the analysis at different time scales in the context of the TE analysis is achieved by representing the subband signals using different embedding parameters, as discussed in Section III-B.
III-A3 Choice of filters
The SWT is used in this work as a pre-processing step towards studying information flow in functional bands of brain waves. However, although reconstruction of signals from their SWT will not be considered, it is important to use filters that allow for a stable perfect reconstruction so that no information is lost in the process of the subband decomposition. Moreover, it is beneficial to ensure that all the information is equally represented in the SWT domain, which is achieved when orthogonal two-channel filter banks [35], such as those proposed by Daubechies [36], or those implementing tight frames are used [34], with the latter allowing for more flexible designs.
III-B Multiscale Wavelet Transfer Entropy
Setting appropriate embedding dimension and embedding delay for the computation of the TE is a subtle issue. Towards motivating our concept of multiscale wavelet TE, we assess first the two most commonly used approaches [11, 12] proposed by Ragwitz and Kantz [26] and Cao [25], using EEG and EMG signals collected synchronously during a motor control task (see Section V-A) [3]. For the clarity of the presentation, the SWT used in this assessment was performed to the depth that extracts the , and low bands, but does not split the Hz band into and subbands.
The Ragwitz’s criterion estimates the embedding delays and embedding dimensions by searching in the (-) plane to identify the point that minimizes the mean squared prediction error (MSPE) of the process using its embedding vector [11, 26]. Figure 2 plots the prediction errors landscape of Ragwitz’ criterion for the composite and subband EEG and EMG signals of Subject A. The obtained optimal embedding parameters appear counter-intuitive and inconsistent. For instance, for the composite EEG signal, optimal and are ( ms) and , respectively, suggesting prediction using only ms of context, whereas the optimal prediction of the subband component occupying the Hz band is achieved by and equal to ( ms) and , respectively, which corresponds to a much larger context of approximately ms. The obtained embedding parameters in the and bands are and , which appears too low, both in terms of the dimension and the overall context of ms. The optimal embedding parameters for the composite EMG signal and and equal to ( ms) and , respectively, which corresponds to the context of around ms, whereas all subband components appear to be optimally predicted using a context of at most ms.

According to Cao’s criterion, the embedding delay is set to be the first zero of the autocorrelation function (ACF) of the process, and then the minimum embedding dimension is determined as the dimension beyond which a measure of the relative increase of the distance between nearest neighbours remains practically constant [11, 25]. Figure 3(a) shows the ACFs of the composite and subband EEG and EMG signals from Subject A. For the composite and Hz EEG, the first zero of the ACF is outside of the considered range. Since it was shown in [26] that the ACF criterion typically yields that is too large, and moreover according to Ragwitz’ criterion is within the investigated range for both signals (see Figure 2), we set the embedding delay of the composite EEG and EEG in the Hz range to . Figure 3(b) shows the values of the metric used in Cao’s criterion to determine as the value beyond which does not change substantially. It can be seen from the results that for EEG and EMG signals the optimal embedding delay decreases with increasing frequency, and that an embedding dimension of around is sufficient to capture the dynamics of the underlying processes. Results obtained using Cao’s criterion agree with time-frequency localisation of transient events and large scale trends. However, the embedding parameters obtained using the two criteria are in stark contrast with each other, often resulting in an order of magnitude difference in the temporal context represented by embedding vectors, and with no clear pattern.
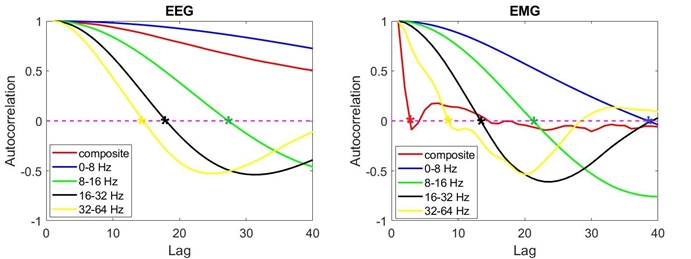
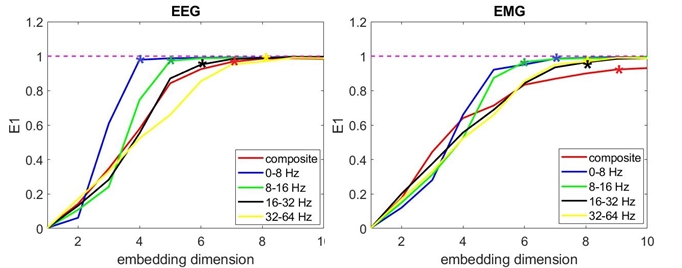
There could be several reasons for these apparent inconsistencies between embedding parameters estimated by the two criteria. Firstly, each criterion, as many others that have been developed for this purpose, makes different specific assumptions about underlying processes, which are difficult to verify in practice, and there is no general consensus on what the most appropriate criterion would be [27]. Secondly, neurophysiological signals are mixtures of processes reflecting different, often unrelated, brain functions, typically degraded by additive noise, which has a major impact on identifying appropriate embedding parameters for a specific process of interest [26]. Finally, the information flow even within a single brain function involves complex interaction within and across frequency bands, including phase-phase, phase-amplitude, amplitude-amplitude, and other forms of coupling [20], that cannot be adequately represented by one embedding vector per frequency band. For instance, control of human movement depends on a complex interplay between the drive or command from cortical areas and feedback from muscles. Primary motor cortex (M1) feeds forward to spinal motoneurons a command synthesized from other cortical areas such as supplementary motor cortex and prefrontal cortex. This command signal is also fed to the cerebellum which acts as a comparator or error detector. Signals are fed back from muscle and contain information on muscle length, rate of change of length and tension in muscle attachments. The shortest delay between drive emanating from M1 to, say, a hand muscle is some ms but other inputs to motoneurons have longer delays. Similarly, information from primary afferents of intrinsic hand muscles signalling muscle length reach sensori-motor cortex at a delay of approximately 20ms, but again slower feedback pathways are also present. Feedback via the cerebellum with varying delays will also be present. Analysis of information flow between cortex, represented by EEG, and muscle, represented by EMG, should therefore ideally take account of bidirectional flow and multiple pathways and delays. Therefore, instead of selecting a single set of embedding parameters, we propose TE in the wavelet transform domain by using more than one set of embedding parameters that represent subband processes across different time scales. We will see in Section V-C that TE at different time scales reveals complementary information flows.
The proposed approach to multiscale embedding is to set embedding delays across the wavelet transform scales as
| (8) |
where is the scale index of the wavelet transform, is the minimal embedding delay at scale , and is a positive integer that controls the time scale of the TE analysis. We further propose that the minimal embedding delays across the scales are related according to
| (9) |
in agreement with the bandwidth of the subband components. In particular, as the bandwidth of the SWT components increases from low to high-frequency bands, the minimal embedding delays decrease following the same ratio. This two-scale relationship between embedding delays in (9) is also in agreement with sampling ratios that would in the case of orthogonal filter banks, or more generally tight frame filters [36, 34], have all the information in neurophysiological signals represented equally by the embedding vectors. An additional degree of freedom towards setting the time scale, i.e. the temporal context, in TE analysis is the embedding dimension . Whilst for each subband component a different embedding dimension can be used, we propose using the same dimension across all subband components. Since probability distributions needed for the computation of transfer entropies are estimated from the same data, the same embedding dimension across all subband components ensures that all probability distributions are estimated with the same accuracy. Another aspect of using the same embedding dimension across subband components is that due to the dyadic relationship between embedding delays in (9) the corresponding embedding captures simultaneously transient events at high frequencies along with larger time scale processes at lower frequencies.
In neurophysiology, interaction delays in (4) can amount to several tens of milliseconds. This is of particular importance for coordinated neural activity and may also affect the results of TE. For the EEG-EMG coupling analysis, the interaction delay is estimated to be between 20 and 35 ms [18]. Thus, in this study the interaction delay was set to correspond to the number of samples in 25 ms for both directions.
Thus, the delay embedding vectors (3b) become
| (10a) | |||
| (10b) |
where denotes the sample at time instant of the subband component of . Finally the TE is redefined as
| (11) |
and calculated for all pairs of subband components of and and with different choices of embedding vectors, giving the proposed multiscale wavelet TE.
The term multiscale TE analysis has been used before, but with a different meaning. In [22, 23], the authors employ a graining pre-processing operator that performs local averaging of considered signals. They propose averaging over windows of different lengths prior to the computation of TE and refer to the methodology as multiscale TE. This graining over different time scales has several merits, but it could also lead to a reduction of available data and spurious detection of causality [22]. Moreover, as the local averaging is inherently a low-pass filtering operation, such multiscale graining leads to a loss of high frequency information. In [20], on the other hand, the authors use the term multiscale correlation to refer just to cross-frequency coupling of electrophysiological processes in general, rather than some specific methodology.
IV Evaluations on Simulated Data
Brain functions involve complex interactions across frequency bands, including amplitude-amplitude, phase-phase, and phase-amplitude coupling [20]. Therefore, in this section, the effectiveness of the proposed multiscale wavelet TE is evaluated using simulated data generated according to amplitude modulation (AM) and phase modulation (PM) models. Additionally, we compare our method against the MI-in-frequency (MIF) measure [14], which is a recent information-theoretic method for CFC analysis.
IV-A Amplitude Modulation Model
Consider amplitude modulation of a carrier signal
| (12) |
by a message signal
| (13) |
where the amplitudes and are generated according to the Rayleigh distribution with the scale parameter , whereas the frequencies and are uniformly distributed in the Hz and Hz frequency ranges, respectively. The amplitude modulated carrier signal is obtained as
| (14) |
where the interaction delay was set to ms (10 samples at 1024 Hz sampling frequency). We evaluated the proposed wavelet transfer entropy in comparison with the MIF measure by applying them to signals
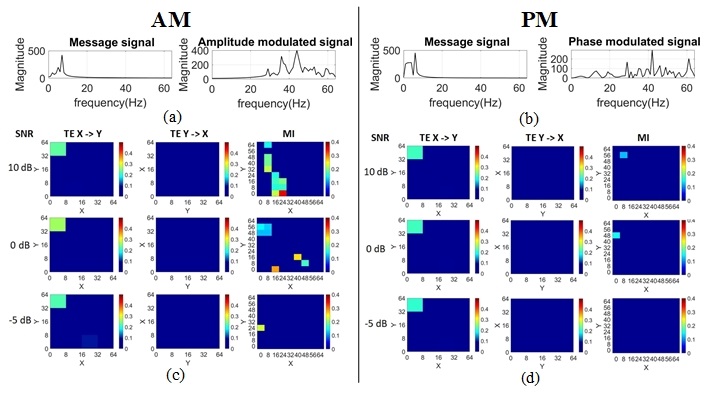
obtained by degrading and by additive white Gaussian noise sequences and at different signal-to-noise ratios (SNRs). At each SNR, 10 sets of data were generated, 1s long, and sampled at Hz. Figure 4(a) shows the DFT magnitude of the noise-free message signal and amplitude modulated signal of a single trial. It can be observed that the spectrum of is confined to the Hz band, whereas the spectrum of is concentrated predominantly in the Hz band. Thus, we expect significant TE from the (0-8) Hz band of to the (32-64) Hz band of .
The results of the wavelet TE and MIF applied to these signals are shown in Figure 4 (c). To allow direct comparison with the MIF technique, the wavelet transfer entropy was calculated for one set of embedding parameters; in particular, the embedding dimension was set to , and the embedding delays to , , , and in , , , and Hz bands respectively. The size of the DFT in the MIF was set as 128 [14], to achieve 8 Hz frequency resolution, which is equal to the finest frequency resolution of the wavelet transform. It can be observed that the wavelet transfer entropy robustly detects present interactions across all considered noise levels. On the other hand, the ability of the MIF measure to reveal underlying interactions is impaired by the noise, and moreover, some spurious interactions are suggested.
IV-B Phase Modulation Model
To investigate the effectiveness of the proposed method in the context of phase modulation a message signal is generated as described in the previous subsection, and it is used to generate phase-modulated signal according to
| (15) |
where the interaction delay was again set to ms. The wavelet transfer entropy and MIF were applied to signals
obtained by degrading and by additive white Gaussian noise sequences and at different signal-to-noise ratios (SNRs). At each SNR, 10 sets of data were generated, 1s long, and sampled at Hz. Figure 4(b) shows the DFT magnitude of noise-free message and phase modulated signals of a single trial. The message signal is situated within the Hz band, while the spectrum of phase modulated signal is concentrated in the Hz band.
The results of the wavelet transfer entropy and MIF applied to these signals are shown in Figure 4(d). The parameters of the wavelet TE and MIF are set to the values used in the AM case. It can be observed from the figure, the proposed TE method robustly detects existing interactions across all noise levels, whereas the MIF measure achieves a partial detection of the interactions and its performance is impaired by the noise.
We considered also MIF with different DFT sizes, i.e. different frequency resolutions, both in the context of amplitude and phase modulation, and did not observe qualitatively different results.
V Evaluations on Neurophysiological Data
V-A Data Acquisition
The above methodologies were applied to data collected from eight healthy subjects during a motor control task. Standard coherence analysis of these data has been reported previously in [3].
The subjects gave informed consent for the study, which received ethical approval and was conducted in accordance with the declaration of Helsinki. All participants were right-hand dominant by self-report. Subjects were seated comfortably at a table and were asked to perform a grasp task with their right hand, holding a 15 cm plastic ruler in a key grip between the thumb and index finger, grasping the end 2 cm of the ruler, and keeping the ruler 2 cm above and parallel to the table surface. Perturbations to the task were generated by an electromechanical tapper, which provided pulses of lateral displacement as described in [3].
The length of a single trial was 5 s, with the stimulus given 1.1 s after the start of the trial. The stimuli were generated at pseudorandom intervals varying between 5.6 and 8.4 s (mean 7 s) so that subjects would not predict the arrival of the next stimulus. The entire experiment consisted of up to 8 blocks of 25 trials each. Thus, up to 200 trials of data were collected from each subject. Surface EMG was recorded over the first dorsal interosseous (FDI) muscle of the dominant hand, using self-adhesive electrodes. Bipolar EEG was recorded from the scalp overlying the hand area of the contralateral motor cortex. EEG and EMG signals were sampled at 1024 Hz, amplified and band-pass filtered (0.5-100 Hz for EEG; 5-500 Hz for EMG). Raw data were reviewed offline by visual inspection and epochs of data containing movement or blink artifacts were rejected [3].
V-B CMC and GC Results
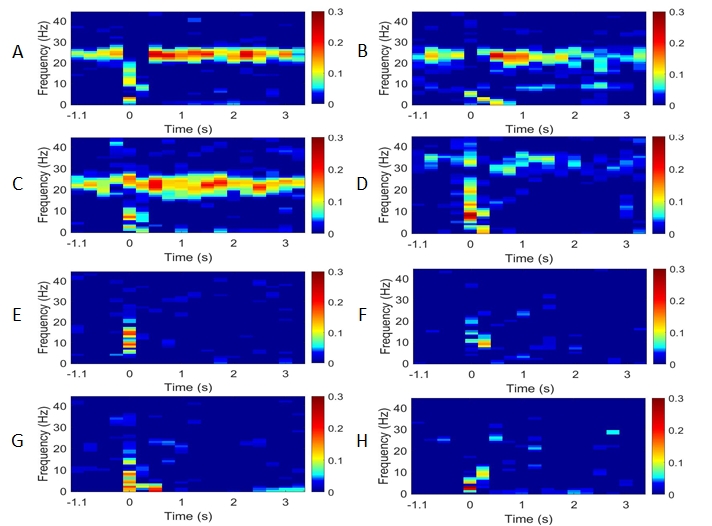
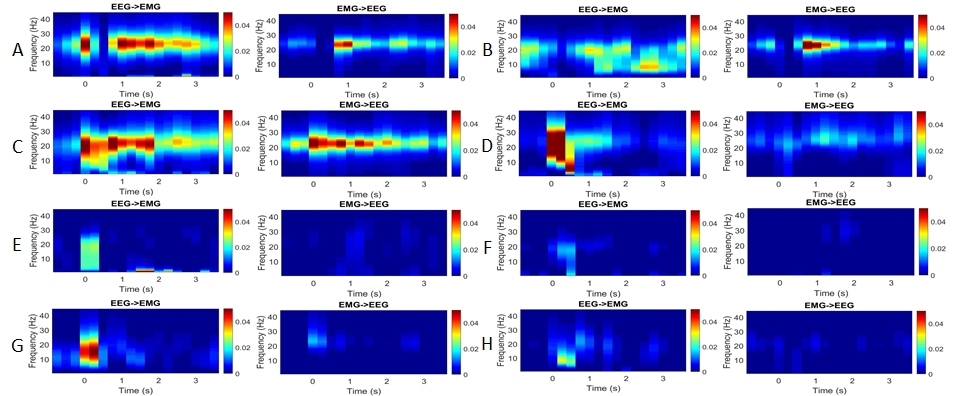
In the original neurophysiology study [3], the coherence observed in some subjects was relatively strong, while in others it was very weak. For the present study, eight subjects that exhibited different levels of coherence were selected. CMC patterns of the selected subjects are shown in Figure 5. The coherence was calculated using non-rectified EMG and EEG signals [37, 38] and power spectra estimation via the discrete short-time Fourier transform over ms (512 samples) long windows with ms (256 samples) overlaps [39, 40]. The pronounced increase in CMC across a broad frequency range at the time of the stimulus (time zero in the figures) may in part reflect stimulus artefact and is not considered in this analysis. Subjects A-D (top four sub-figures) exhibit significant -range EEG/EMG coherence during the baseline pre-stimulus and post-stimulus period. Subjects E-H, on the other hand, show only a few brief bursts of significant coherence in the early post-stimulus period, and the time-frequency region where CMC is detected is very sparse.
The frequency-domain GC results are shown in Figure 6. The coefficients of the underlying linear autoregressive moving average (ARMA) models were determined via least squares model fitting, which is equivalent to maximum likelihood estimation (MLE) assuming Gaussian residuals [41, 42]. Model orders were determined via the Bayesian Information Criterion (BIC) [43] and the Akaike Information Criterion with bias-corrected (AICc) [44, 45] which gave around for all subjects. The frequency-domain GC was then obtained from the ARMA models following [46]. All GC analysis was also performed within 500 ms (512 samples) segments every 250 ms (256 samples). As shown in Figure 6, GC analysis is capable of detecting the direction of information propagation, however, the overall observation is that results are qualitatively very close to those obtained via the coherence analysis: there is a large variability between subjects, making the establishment of some reference interaction patterns very challenging, and more fundamentally, the GC analysis, which like coherence analysis is based on linear models, is still not sufficiently sensitive to detect the information transfer between cortex and muscle in many healthy subjects.
V-C TE Results
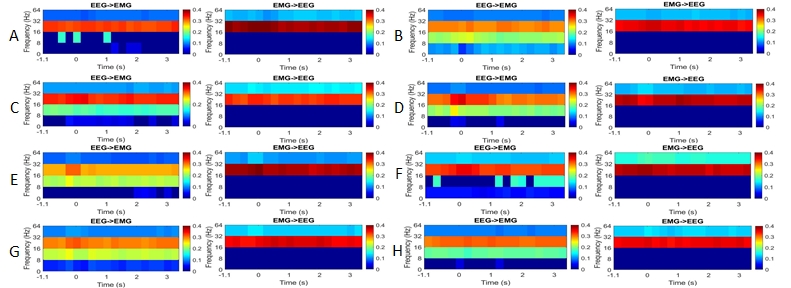
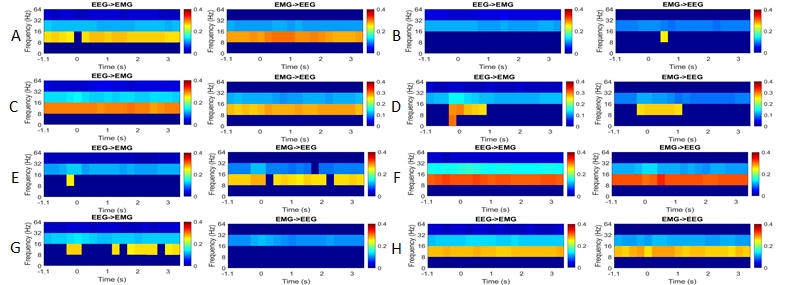
We now investigate the potential of TE for discovering corticomuscular coupling. In order to track temporal evolution of TE, analogous to the CMC and GC analyses, the whole trial (5 seconds) was divided into 18 overlapping segments with time shift of 250 ms (256 samples), each lasting 500 ms (512 samples). Then TE was estimated on each segment separately. The interaction delay was set to ms, in agreement with the underlying neurophysiology and verified via a delay estimation algorithm based on maximizing TE [47].
The multiscale wavelet-domain TE results are shown in Figure 7. The wavelet transform was performed at scales using Daubechies filters. Since the signals were recorded using Hz sampling, the subband components , , and , approximately represent Hz – low , Hz – , and Hz – bands, whereas approximately represents the Hz band, which are combined and bands. The decision not to separate and oscillations is governed by data acquisition process during which most of the Hz EMG content was filtered out, as is common in motor neurophysiology studies, to minimise movement artefact. Two different time scale factors and were selected for further analysis and the minimum embedding delays equal to , , , and samples in the , , , and low bands were used, respectively. The embedding dimension was set to for all subband components of EEG and EMG signals for both time scales and . To remove the Hz mains interference, a notch filter was applied. Since the embedding delay differs between frequency bands, the resulting significance level (95% CL) for individual bands will change accordingly. As shown in the figure, all subjects present similar and significant wavelet-domain multiscale TE throughout the experiment regardless of whether the subject exhibits a significant coherence/causality. At the time scale , the significant TE is mainly concentrated in the range in both directions, but is also present in the -range from EEG to EMG. With , TE can still be seen in the range, but tends to show stronger coupling in the -range. In particular, -range TE is now also seen in the direction from EMG to EEG, which was not detected with scale factor , illustrating that TE at different time scales reveals complementary interactions. Fluctuation in the level of TE in relation to the stimulus is observed, particularly in subjects A, D, E, and G.
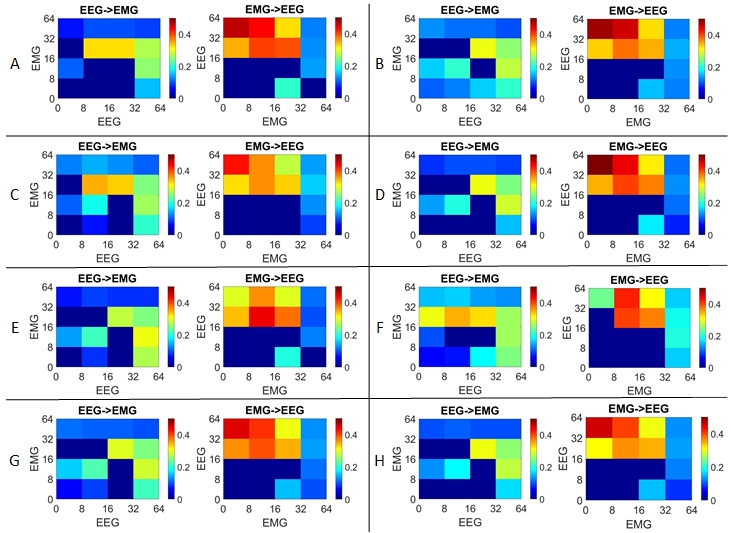
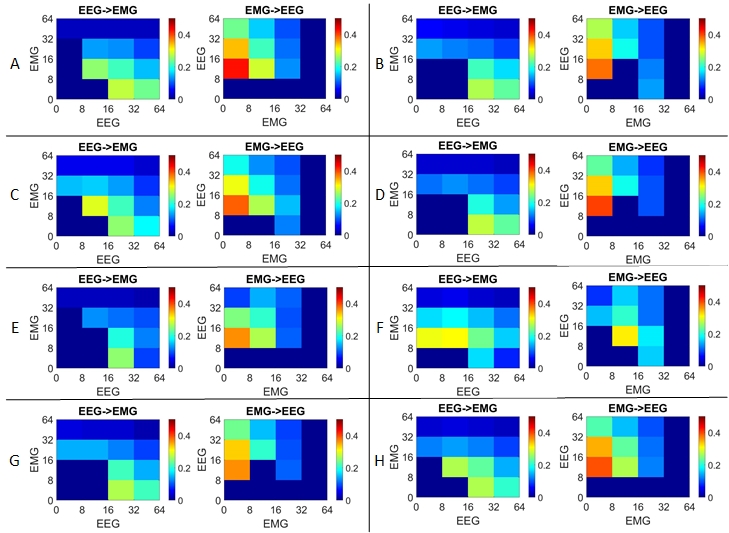
We further investigated CFC using the multiscale wavelet TE, focusing on the same four functional bands, , , , and low , and the first time segment: the baseline period s. The embedding parameters in the CFC analysis were set to the same values as in the intra-band analysis above. Again, two different temporal scale factors and were chosen. The results of this CFC analysis are shown in Figure 8. With the scale , for the direction from EEG to EMG, coupling is mainly seen from EEG- to EMG-, and in some subjects also from EEG- to EMG- or from EEG- to EMG-; and from EEG- to EMG- and . In contrast, for the EMG to EEG direction, coupling is observed from EMG-/ to EEG- and ; EMG- to EEG- and ; EMG- to EEG- and . Thus whilst the coupling from EEG to EMG is largely seen within a given frequency band, the coupling from EMG to EEG is seen predominantly across frequency bands. With , for the direction from EEG to EMG, significant TE is mainly concentrated from EEG- to EMG- and from EEG- and to EMG-/. As for the opposite direction, TE is seen from EMG-/ maximally to EEG-, and also to EEG-, and . Thus there is clear coupling between the lower EMG frequencies and higher EEG frequencies.
.
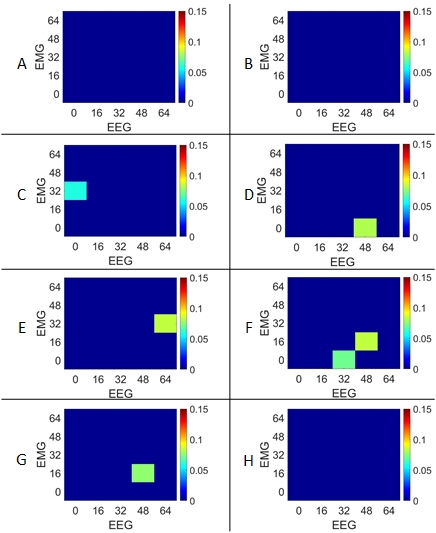
For comparison, in Figure 9 we show CFC results obtained using the MIF measure on the same time interval of [-1.1, -0.6] s. The size of the DFT in the MIF analysis is set to 64, corresponding to the frequency resolution of 16 Hz. It can be observed that the MIF results are inconsistent across subjects, and we cannot observe any significant MI values in subjects A, B, and H.
VI Discussion
CMC has previously been shown to vary markedly between subjects [48] (also see Figure 5). This inter-subject variability led to the suggestion that coherence was probably measuring linear bidirectional information flows with the relative strength of ascending and descending connections changing between different subjects [6]. GC is a statistical notion of causal influence. In theory, it is entirely equivalent to TE for Gaussian processes and linear couplings [49]. However, because of the neural signals used in this study, the existing directed analysis methods like GC, that are based on linear stochastic models of the data, are still not sensitive enough (also see Figure 6). In the present study, the multiscale wavelet TE detects cortex-muscle communication in both directions in all subjects tested, including those in whom CMC and GC did not reveal any significant communication. This increased sensitivity to corticomuscular interaction is likely to relate to the ability of TE to detect non-linear as well as linear interactions. This has potential advantages for researchers in motor neuroscience, as -range CMC and GC have hitherto been limited by the fact that not all healthy volunteers display significant levels of CMC [7, 50]. We have previously reported that -CMC can be detected following a peripheral stimulus relevant to the motor task, even in those subjects who did not show significant -CMC at baseline [3, 40]. However, this was often still a small and low amplitude burst of coherence. In contrast, the current study using TE demonstrates significant levels of bidirectional communication between brain and muscle during the baseline and post-stimulus periods, with a consistent pattern between subjects (see Figure 7). Although this was a relatively small, exploratory study, and the findings will need to be reproduced in further, larger studies, the findings are potentially of great importance in developing a reliable tool for measuring bidirectional cortex-muscle interactions that could not only transform the field of motor neuroscience, but which could also be translated into clinical practice.
Considering that neuronal oscillations within each frequency range associate with multiple temporal scales, we proposed using multiple temporal scales to estimate the TE in the wavelet domain, as described in Section III-B. Looking at TE within a given frequency band with , i.e. the embedding vectors capture , , and ms of temporal context in low , , and bands, respectively, TE from EEG to EMG is observed most prominently in the range. Traditional studies using linear methods such as CMC and GC to investigate cortex-muscle interactions (CMI) during motor tasks usually find CMC (or GC) in the -range [6, 48, 51, 52, 53]. This is thought to reflect oscillatory inputs from the motor cortex. However, motor unit firing rates are often lower than this, being around Hz in a modest contraction such as used here, so the presence of a clear EEG to EMG communication also within the range, as demonstrated here, is not surprising. As for the opposite direction, TE from EMG to EEG appears most prominently in the range, and to a smaller extent in the high-beta/low-gamma range. It is well-established that cortical activity is closely linked with motor control, particularly related to a static task or tonic contraction [24, 54, 55] and previous studies of bidirectional CMI using GC have demonstrated clear evidence for communication from muscle to EEG in the range [6].
Interestingly, when a temporal scale was applied, i.e. the embedding vectors capture , , and ms of temporal context in low , , and bands, respectively, a different pattern of communication between EEG and EMG is detected, with TE in both directions being more strongly represented in the -range for most subjects. The reason for this is uncertain, but it is possible that in the context of this shorter timescale, instantaneous drive and feedback on motor unit firing rates is particularly relevant.
Another important aspect of the current study is the cross-frequency TE results. With , the coupling from EEG to EMG is largely seen within a given frequency band ( to and to ), whereas the coupling from EMG to EEG is largely seen across frequency bands (/ to and ; to and ; to ) (see Figure 8). The observations suggest that CFC is more prominent for communication from EMG to EEG. This could explain in part why CMC and GC (linear methods investigating coupling within the same frequency band) tend to show stronger coupling in the direction from EEG to EMG, rather than in the opposite direction. EMG activity is perhaps more likely to reflect movement or physiological tremor Hz, so could carry important information to feedback to the brain reflecting stability of posture. EMG activity could also reflect this in part, as well as firing of motor units, which tends to range from to Hz but can be as low as Hz and up to Hz at high levels of contraction. Both these frequency bands from EMG appear to feedback to EEG activity in the range which, as detailed above, is known to relate closely to motor control.
CFC has been extensively studied between different cortical or sub-cortical regions [56], but is far less widely explored between brain and muscle. The greater CFC seen in the EMG-EEG direction in this study is also in keeping with the non-linear dynamics of sensory systems. In a study of CFC using a modified CMC method, Yang et al. also found evidence for predominantly linear coupling in the cortex-muscle direction, and of non-linear coupling in the muscle-cortex direction, which they suggested was likely related to sensory feedback pathways [9]. Our findings with TE are thus concordant with this. With , clear coupling is observed between the higher EEG frequencies and lower EMG frequencies, which implies that cortex-to-muscle interactions are also characterized to some extent by non-linear activities. This finding is supported by a recent simulation study which revealed both iso-frequency and CFC between supraspinal inputs and motoneurones [10] and is also concordant with other work demonstrating non-linear activities in the central and peripheral nervous system [57, 58, 59, 60].
The different communication patterns revealed by different temporal scales emphasises the ability of the multiscale TE to detect more complex interaction patterns than is possible using one set of embedding parameters and which is more in keeping with neuronal models of real brain dynamics [61].
VII Conclusion
In the present study, TE was assessed as a measure of corticomuscular interactions. In particular, the concept of multiscale TE in the domain of the dyadic SWT was proposed, that employs multiple sets of embedding parameters to investigate intra- and cross-frequency band coupling at different time-scales. Experiments using simulated and neurophysiological data substantiate the potential of the multiscale wavelet TE methodology for detecting and quantifying interactions between EEG and EMG processes. The proposed methodology robustly detected significant information flows for subjects with and without significant CMC or GC. This can be ascribed to the ability of TE to detect non-linear interactions. Results obtained using synchronous EEG and EMG signals are in agreement with the underlying sensorimotor neurophysiology, including the presence of cross-frequency interactions. These findings suggest that the concept of multiscale wavelet TE provides a comprehensive framework for analysing CMI and potentially other neurophyisological processes.
References
- [1] S. Baker, E. Olivier, and R. Lemon, “Coherent oscillations in monkey motor cortex and hand muscle EMG show task-dependent modulation,” The Journal of physiology, vol. 501, no. 1, pp. 225–241, 1997.
- [2] S. Graziadio et al., “Developmental tuning and decay in senescence of oscillations linking the corticospinal system,” Journal of Neuroscience, vol. 30, no. 10, pp. 3663–3674, 2010.
- [3] V. M. McClelland, Z. Cvetkovic, and K. R. Mills, “Modulation of corticomuscular coherence by peripheral stimuli,” Experimental brain research, vol. 219, no. 2, pp. 275–292, 2012.
- [4] C. L. Witham, M. Wang, and S. Baker, “Corticomuscular coherence between motor cortex, somatosensory areas and forearm muscles in the monkey,” Frontiers in systems neuroscience, vol. 4, p. 38, 2010.
- [5] C. W. Granger, “Investigating causal relations by econometric models and cross-spectral methods,” Econometrica: Journal of the Econometric Society, pp. 424–438, 1969.
- [6] C. L. Witham et al., “Contributions of descending and ascending pathways to corticomuscular coherence in humans,” The Journal of physiology, vol. 589, no. 15, pp. 3789–3800, 2011.
- [7] S. Salenius and R. Hari, “Synchronous cortical oscillatory activity during motor action,” Current opinion in neurobiology, vol. 13, no. 6, pp. 678–684, 2003.
- [8] Y. Yang et al., “A generalized coherence framework for detecting and characterizing nonlinear interactions in the nervous system,” IEEE transactions on biomedical engineering, vol. 63, no. 12, pp. 2629–2637, 2016.
- [9] ——, “Nonlinear coupling between cortical oscillations and muscle activity during isotonic wrist flexion,” Frontiers in computational neuroscience, vol. 10, p. 126, 2016.
- [10] N. Sinha et al., “Cross-frequency coupling in descending motor pathways: Theory and simulation,” Frontiers in Systems Neuroscience, vol. 13, p. 86, 2020.
- [11] M. Lindner et al., “Trentool: A matlab open source toolbox to analyse information flow in time series data with transfer entropy,” BMC neuroscience, vol. 12, no. 1, p. 119, 2011.
- [12] R. Vicente et al., “Transfer entropy—a model-free measure of effective connectivity for the neurosciences,” Journal of computational neuroscience, vol. 30, no. 1, pp. 45–67, 2011.
- [13] J. T. Lizier, “JIDT: An information-theoretic toolkit for studying the dynamics of complex systems,” Frontiers in Robotics and AI, vol. 1, p. 11, 2014.
- [14] R. Malladi et al., “Mutual information in frequency and its application to measure cross-frequency coupling in epilepsy,” IEEE Transactions on signal processing, vol. 66, no. 11, pp. 3008–3023, 2018.
- [15] S.-H. Jin, P. Lin, and M. Hallett, “Linear and nonlinear information flow based on time-delayed mutual information method and its application to corticomuscular interaction,” Clinical Neurophysiology, vol. 121, no. 3, pp. 392–401, 2010.
- [16] R. Malladi et al., “Identifying seizure onset zone from the causal connectivity inferred using directed information,” IEEE Journal of Selected Topics in Signal Processing, vol. 10, no. 7, pp. 1267–1283, 2016.
- [17] C. Yang et al., “A new strategy for model order identification and its application to transfer entropy for EEG signals analysis,” IEEE Transactions on Biomedical Engineering, vol. 60, no. 5, pp. 1318–1327, 2012.
- [18] Y. Gao et al., “Electroencephalogram–electromyography coupling analysis in stroke based on symbolic transfer entropy,” Frontiers in neurology, vol. 8, p. 716, 2018.
- [19] S. Zhou et al., “Optimization of relative parameters in transfer entropy estimation and application to corticomuscular coupling in humans,” Journal of Neuroscience Methods, vol. 308, pp. 276–285, 2018.
- [20] W. Shi, C.-H. Yeh, and Y. Hong, “Cross-frequency transfer entropy characterize coupling of interacting nonlinear oscillators in complex systems,” IEEE Transactions on Biomedical Engineering, vol. 66, no. 2, pp. 521–529, 2018.
- [21] W. K. So et al., “Cross-frequency information transfer from EEG to EMG in grasping,” in 2016 38th Annual International Conference of the IEEE Engineering in Medicine and Biology Society (EMBC). IEEE, 2016, pp. 4531–4534.
- [22] X. Zhao et al., “Multiscale transfer entropy: Measuring information transfer on multiple time scales,” Communications in Nonlinear Science and Numerical Simulation, vol. 62, pp. 202–212, 2018.
- [23] X. Chen et al., “Multiscale information transfer in functional corticomuscular coupling estimation following stroke: A pilot study,” Frontiers in neurology, vol. 9, p. 287, 2018.
- [24] J.-S. Brittain and P. Brown, “Oscillations and the basal ganglia: motor control and beyond,” Neuroimage, vol. 85, pp. 637–647, 2014.
- [25] L. Cao, “Practical method for determining the minimum embedding dimension of a scalar time series,” Physica D: Nonlinear Phenomena, vol. 110, no. 1-2, pp. 43–50, 1997.
- [26] M. Ragwitz and H. Kantz, “Markov models from data by simple nonlinear time series predictors in delay embedding spaces,” Physical Review E, vol. 65, no. 5, p. 056201, 2002.
- [27] S. Pan and K. Duraisamy, “On the structure of time-delay embedding in linear models of non-linear dynamical systems,” Chaos: An Interdisciplinary Journal of Nonlinear Science, vol. 30, no. 7, p. 073135, 2020.
- [28] T. Schreiber, “Measuring information transfer,” Physical review letters, vol. 85, no. 2, p. 461, 2000.
- [29] G. Gómez-Herrero et al., “Assessing coupling dynamics from an ensemble of time series,” Entropy, vol. 17, no. 4, pp. 1958–1970, 2015.
- [30] J. Beirlant et al., “Nonparametric entropy estimation: An overview,” International Journal of Mathematical and Statistical Sciences, vol. 6, no. 1, pp. 17–39, 1997.
- [31] A. Kraskov, H. Stögbauer, and P. Grassberger, “Estimating mutual information,” Physical review E, vol. 69, no. 6, p. 066138, 2004.
- [32] L. F. Kozachenko and N. N. Leonenko, “Sample estimate of the entropy of a random vector,” Probl Peredachi Inf, vol. 23, no. 23, pp. 95–101, 1987.
- [33] J. Rosenberg et al., “The Fourier approach to the identification of functional coupling between neuronal spike trains,” Progress in biophysics and molecular biology, vol. 53, no. 1, pp. 1–31, 1989.
- [34] Z. Cvetkovic and M. Vetterli, “Oversampled filter banks,” IEEE Trans. on Signal Processing, vol. 46, no. 5, pp. 1245–1255, 1998.
- [35] M. Vetterli and J. Kovačević, Wavelets and Subband Coding. Prentice Hall, 1995.
- [36] I. Daubechies, Ten Lectures on Wavelets. SIAM, 1992.
- [37] V. M. Mcclelland, Z. Cvetkovic, and K. R. Mills, “Rectification of the EMG is an unnecessary and inappropriate step in the calculation of corticomuscular coherence,” J Neurosci Methods, vol. 205, no. 1, pp. 190–201, 2012.
- [38] V. M. McClelland, Z. Cvetkovic, and K. R. Mills, “Inconsistent effects of EMG rectification on coherence analysis,” The Journal of Physiology, vol. 592, no. Pt 1, pp. 249–250, 2014.
- [39] Z. Cvetkovic, “On discrete short-time Fourier analysis,” IEEE Transactions on Signal Processing, vol. 48, no. 9, pp. 2628–2640, 2000.
- [40] Y. Xu et al., “Corticomuscular coherence with time lag with application to delay estimation,” IEEE Transactions on Biomedical Engineering, vol. 64, no. 3, pp. 588–600, 2016.
- [41] A. B. Barrett, L. Barnett, and A. K. Seth, “Multivariate Granger causality and generalized variance,” Physical Review E, vol. 81, no. 4, p. 041907, 2010.
- [42] L. Barnett and A. K. Seth, “The MVGC multivariate Granger causality toolbox: a new approach to Granger-causal inference,” Journal of neuroscience methods, vol. 223, pp. 50–68, 2014.
- [43] G. Schwarz et al., “Estimating the dimension of a model,” The annals of statistics, vol. 6, no. 2, pp. 461–464, 1978.
- [44] H. Akaike, “A new look at the statistical model identification,” in Selected Papers of Hirotugu Akaike. Springer, 1974, pp. 215–222.
- [45] C. M. Hurvich and C.-L. Tsai, “Regression and time series model selection in small samples,” Biometrika, vol. 76, no. 2, pp. 297–307, 1989.
- [46] J. Geweke, “Measurement of linear dependence and feedback between multiple time series,” Journal of the American statistical association, vol. 77, no. 378, pp. 304–313, 1982.
- [47] M. Wibral et al., “Measuring information-transfer delays,” PloS one, vol. 8, no. 2, p. e55809, 2013.
- [48] C. N. Riddle and S. N. Baker, “Manipulation of peripheral neural feedback loops alters human corticomuscular coherence,” The Journal of physiology, vol. 566, no. 2, pp. 625–639, 2005.
- [49] L. Barnett, A. B. Barrett, and A. K. Seth, “Granger causality and transfer entropy are equivalent for Gaussian variables,” Physical review letters, vol. 103, no. 23, p. 238701, 2009.
- [50] M. Pohja, S. Salenius, and R. Hari, “Reproducibility of cortex–muscle coherence,” Neuroimage, vol. 26, no. 3, pp. 764–770, 2005.
- [51] B. Conway et al., “Synchronization between motor cortex and spinal motoneuronal pool during the performance of a maintained motor task in man.” The Journal of physiology, vol. 489, no. 3, pp. 917–924, 1995.
- [52] J. M. Kilner et al., “Human cortical muscle coherence is directly related to specific motor parameters,” Journal of Neuroscience, vol. 20, no. 23, pp. 8838–8845, 2000.
- [53] V. M. McClelland et al., “Abnormal patterns of corticomuscular and intermuscular coherence in childhood dystonia,” Clinical Neurophysiology, 2020.
- [54] T. Gilbertson et al., “Existing motor state is favored at the expense of new movement during 13-35 hz oscillatory synchrony in the human corticospinal system,” Journal of Neuroscience, vol. 25, no. 34, pp. 7771–7779, 2005.
- [55] R. A. Joundi et al., “Driving oscillatory activity in the human cortex enhances motor performance,” Current Biology, vol. 22, no. 5, pp. 403–407, 2012.
- [56] R. T. Canolty and R. T. Knight, “The functional role of cross-frequency coupling,” Trends in cognitive sciences, vol. 14, no. 11, pp. 506–515, 2010.
- [57] C. J. Stam et al., “Nonlinear synchronization in EEG and whole-head MEG recordings of healthy subjects,” Human brain mapping, vol. 19, no. 2, pp. 63–78, 2003.
- [58] M. P. Mileusnic et al., “Mathematical models of proprioceptors. i. control and transduction in the muscle spindle,” Journal of neurophysiology, vol. 96, no. 4, pp. 1772–1788, 2006.
- [59] C.-C. Chen et al., “Nonlinear coupling in the human motor system,” Journal of Neuroscience, vol. 30, no. 25, pp. 8393–8399, 2010.
- [60] C. S. Herrmann et al., “Shaping intrinsic neural oscillations with periodic stimulation,” Journal of Neuroscience, vol. 36, no. 19, pp. 5328–5337, 2016.
- [61] K. J. Friston, “Book review: brain function, nonlinear coupling, and neuronal transients,” The Neuroscientist, vol. 7, no. 5, pp. 406–418, 2001.