Dislocation assisted phase separation: a phase field study
Abstract
Defects play a key role in deciding the mechanisms and kinetics of phase transformations. In this paper, we show how dislocations influence phase separation in alloys with miscibility gap. Specifically, depending on the ratio of pipe mobility to bulk mobility, it is seen that even in a system with nominal compositions outside the spinodal limit, spinodal phase separation is possible. Surprisingly, phase separation through both nucleation and growth, and spinodal decomposition, is seen concurrently (for the case of intersecting dislocations). Finally, the prominent role played by dislocations in influencing the morphology of precipitates is explored. We show that these results agree qualitatively with recent experimental results in iron based systems obtained using Atom Probe Tomography (APT).
keywords:
Segregation , Pipe diffusion , Precipitate morphology , Spinodal decomposition , Misfit , Nucleation and growth1 Introduction
It is well known that solutes in alloys segregate to elastically favourable sites near dislocations [1, 2, 3, 4] forming “solute atmospheres” which hinder the dislocation movement. The solute segregation to dislocations might depend on the character of the dislocation and the nature of the misfit (between solute and matrix), if only the elastic interaction is accounted for [5]. Solutes with dilatational misfit segregate to dislocations with edge character while solutes with non-dilatational misfit segregate to both edge and screw dislocations [6]. However, if the broken bonds at the dislocation core are accounted for, solute segregation is expected at dislocations of both character [7].
Segregation can also lead to nucleation and growth along dislocations as has been predicted [8, 9, 10], and, experimentally observed – see, for example, [11, 5, 12]. Recently, atom probe experiments in Fe-Mn system [13] have shown that dislocations can also act as sites of localized spinodal decomposition in systems with nominal alloy compositions outside the spinodal limit. In fact, in this system, namely, Fe-Mn, there have been recent modelling studies which show grain boundary induced spinodal decomposition even when the overall alloy composition is outside the spinodal limits [14, 15]. In this paper, we explore if dislocations can also induce phase separation by the spinodal mechanism in systems with nominal alloy compositions outside the spinodal limit.
In the past, attempts have been made to investigate the effects of dislocations on phase transformation using phase field models [16, 17, 18, 19, 20, 21]. These models have shown that stationary and moving dislocations, in systems with average composition within the spinodal limit, can lead to faster kinetics and ordered microstructures. In this regard, the work of Hu and Chen [17] and Mianroodi et al [15] deserve special mention; both these works show that even in a system with overall composition outside the spinodal limit, segregation to the dislocations can take the composition along the dislocation to within the spinodal regime. However, in both these cases spinodal fluctuations along the dislocation line are not seen. This is in contrast to the spinodal decomposition along the dislocations observed experimentally by Da Silva et al. [13].
The work of Hu and Chen [17] is in 2-D. So, the question of spinodal fluctuations along the dislocation line does not arise. On the other hand, in Mianroodi et al, the simulations are done in 3-D [15]. However, faster diffusivity along the dislocation lines is not incorporated in these simulations. The diffusivity along the core of a dislocation can be two to three orders of magnitude higher than the bulk diffusivity [22], and hence, this can be expected to play a key role in the phase transformation mechanism and kinetics.
In this paper, we show that faster diffusion along the dislocations is indeed essential for a system with alloy composition outside spinodal limits to show segregation-assisted spinodal decomposition along the dislocations. We use a phase field dislocation dynamics (PFDD) model. There exist several versions of PFDD models in the literature: see for example, [23, 24, 25, 26, 27, 28]. Our model is very similar to that of Hunter et al. [28]. We do not incorporate specific crystallographic geometries; however, dislocation-solute interactions and the segregation effects are known to depend primarily on the defect structure and their elastic field [7]. In fact, we show that our model is able to reproduce the experimentally observed: (i) segregation-assisted spinodal morphology, and (ii) non-spherical precipitate shapes at dislocation intersections, in iron based systems, albeit qualitatively.
2 Formulation and simulation details
In this paper, we have combined phase field models of phase separation [17] and dislocation dynamics [27, 28]; we incorporate faster diffusion along the cores of the dislocations using the variable mobility methodology proposed by Zhu et al. [29]. In this section, since all these models are well known, we describe the formulation very briefly – for the sake of completeness.
2.1 Formulation
We consider a binary system with dislocations; we describe the system using two order parameters, namely, composition () and slip (). We assume the eigenstrain due to the solute misfit to be given by:
| (1) |
where is the magnitude of the eigenstrain, is Kronecker delta and is an interpolation function of c given by . In other words, we assume that the solute misfit is dilatational and is measured with respect to the matrix lattice parameter. The eigenstrain due to a dislocation is a pure shear strain [30] and is obtained as a tensor product of the Burgers vector () and the slip plane normal () of the dislocation; it is given as:
| (2) |
where is the interplanar spacing, denotes the slip system and is the total number of slip systems.
The stress and strain fields that go into the elastic strain energy component are calculated by solving the equation of mechanical equilibrium. We use the Green’s function approach [30] to solve the equation of mechanical equilibrium – assuming linear and isotropic elasticity; we also assume that the system is elastically homogeneous.
The total free energy of the system, consists of, in addition to the elastic component, the chemical and the dislocation core energy components:
| (3) |
where is the number of atoms per unit volume, is the volume of the system, is a constant that determines the height of the bulk free energy density barrier between the two phases, is the core energy coefficient for slip system , is the gradient energy coefficient, is the elastic strain (which, in turn, is related to the total strain and the eigenstrains through the relation ), and denotes the modulus tensor. Here, we have assumed that the interfacial energy between the two phases is isotropic. As can be seen from the total strain expression, the and fields are coupled by the elastic strain energy of the system. This interaction leads to the segregation of the solute atoms to the dislocations. We do not consider segregation due to the broken bonds at the core of the dislocations in this model. Note that we ignore the gradient energy term associated with in our formulation. The core width of the dislocations in the system is determined by the balance between the elastic and the core energies of the dislocation.
Given the free energy functional, the Allen-Cahn equation for and the Cahn-Hilliard (CH) equation for can be used to study the microstructural evolution in the system. In this paper, we are interested in the evolution of the composition fields in the presence of the dislocations. We assume that the dislocations are stationary and hence do not evolve the order parameter – except at the beginning of the simulations to equilibrate the dislocation structure. Specifically, we use two different dislocation configurations – edge dislocation dipoles in one and two slip systems.
The CH equation that described the composition evolution is given by:
| (4) |
where is the (scalar) atomic mobility which is and hence, position dependent, and is the variational derivative of the free energy per atom with respect to the composition, and, is given by:
| (5) |
where . In deriving the above expression, we have used the symmetry properties of the elastic moduli tensor .
Let be the bulk mobility of solute atoms and let be the enhanced mobility along the dislocation core over and above the bulk mobility. We define the mobility in the simulation domain using the order parameters as follows:
| (6) |
where and are the two order parameters that describe slip in two different slip planes, labelled 1 and 2, respectively. The mobility of atoms given by Eq. 6 will be highest at points where and/or . For simulations in which the dislocations exist only on a single slip system, in this expression, we substitute and .
We use a Fourier spectral technique to solve the CH equation (which implies periodic boundary conditions). The CH equation with the variable atomic mobility has severe time step constraints. Hence, we use the numerical technique proposed by Zhu et al. [29], using which, the final evolution equation in the Fourier space is given as:
| (7) |
where is the magnitude of the reciprocal space vector, the braces denoted by and indicate the terms in real and Fourier space respectively, and is the time step. As indicated by Zhu et al. [29], the choice of is optimal.
2.2 Non-dimensionalisation
All our simulations are carried out using non-dimensionalised parameters. Specifically, we use a characteristic length of 1Å, a characteristic energy of and, a characteristic times of to . In dimensional terms, these choices correspond to a system of size for 256 grid points, an interfacial energy of , an Young’s modulus of GPa and a Poisson’s ratio of (isotropic material) and a bulk diffusivity of the order of to . Finally, the used dislocation core energy coefficients imply edge dislocations of width to , where is the magnitude of the Burgers vector. The coherent spinodal limits for the parameters chosen by us is 0.216 and 0.783. Our simulations start with a nominal composition well outside the spinodal limit – to .
The non-dimensionalised parameters and their values are listed Table 1.
| Parameter | Value |
| Spatial discretisation, | 1.0 |
| Time step, | 0.1 – 0.5 |
| Elastic moduli: | 175 |
| Elastic moduli: | 75 |
| Elastic moduli: | 50 |
| Bulk free energy coefficient, | 1 |
| Dislocation core energy coefficient, | 0.31 – 2.52 |
| Gradient energy coefficient, | 1 |
| Magnitude of eigenstrain, | 0.01 |
3 Results and Discussion
In this section, we show and discuss segregation induced nucleation, spinodal decomposition, and concurrent nucleation and spinodal decomposition. We rationalise these results in terms of the strength of the solute-dislocation interaction, the nominal alloy composition and the ratio of pipe to bulk mobilities.
3.1 Segregation induced nucleation
In Figure 1(a), we show the isosurface for a system containing an edge dislocation dipole. In this and subsequent simulations, the edge dislocations are set 128 units apart in a system of size ; the nominal alloy composition and the dislocation core energy coefficient are taken as and (unless stated otherwise).
The Burgers vectors of these dislocations are along the positive -direction of the simulation cell and the slip plane normals for both these dislocations are along the positive -direction of the simulation cell. These two dislocations are aligned along the -axis of the simulation cell; the sense vector for the dislocation on the left is the positive -direction of the simulation cell and the line sense for the dislocation on the right is the negative -direction of the simulation cell. Note that the strain fields of the positive edge dislocation (labelled ‘+’) and the negative edge dislocation (labelled ‘-’) are flipped; hence, the accumulation of the solute happens above and below the slip plane for the positive and negative edge dislocation, respectively. Since the results for the two dislocations are different only in terms of the sign of the strain fields; so, we only consider the positive edge dislocation for the rest of this discussion.
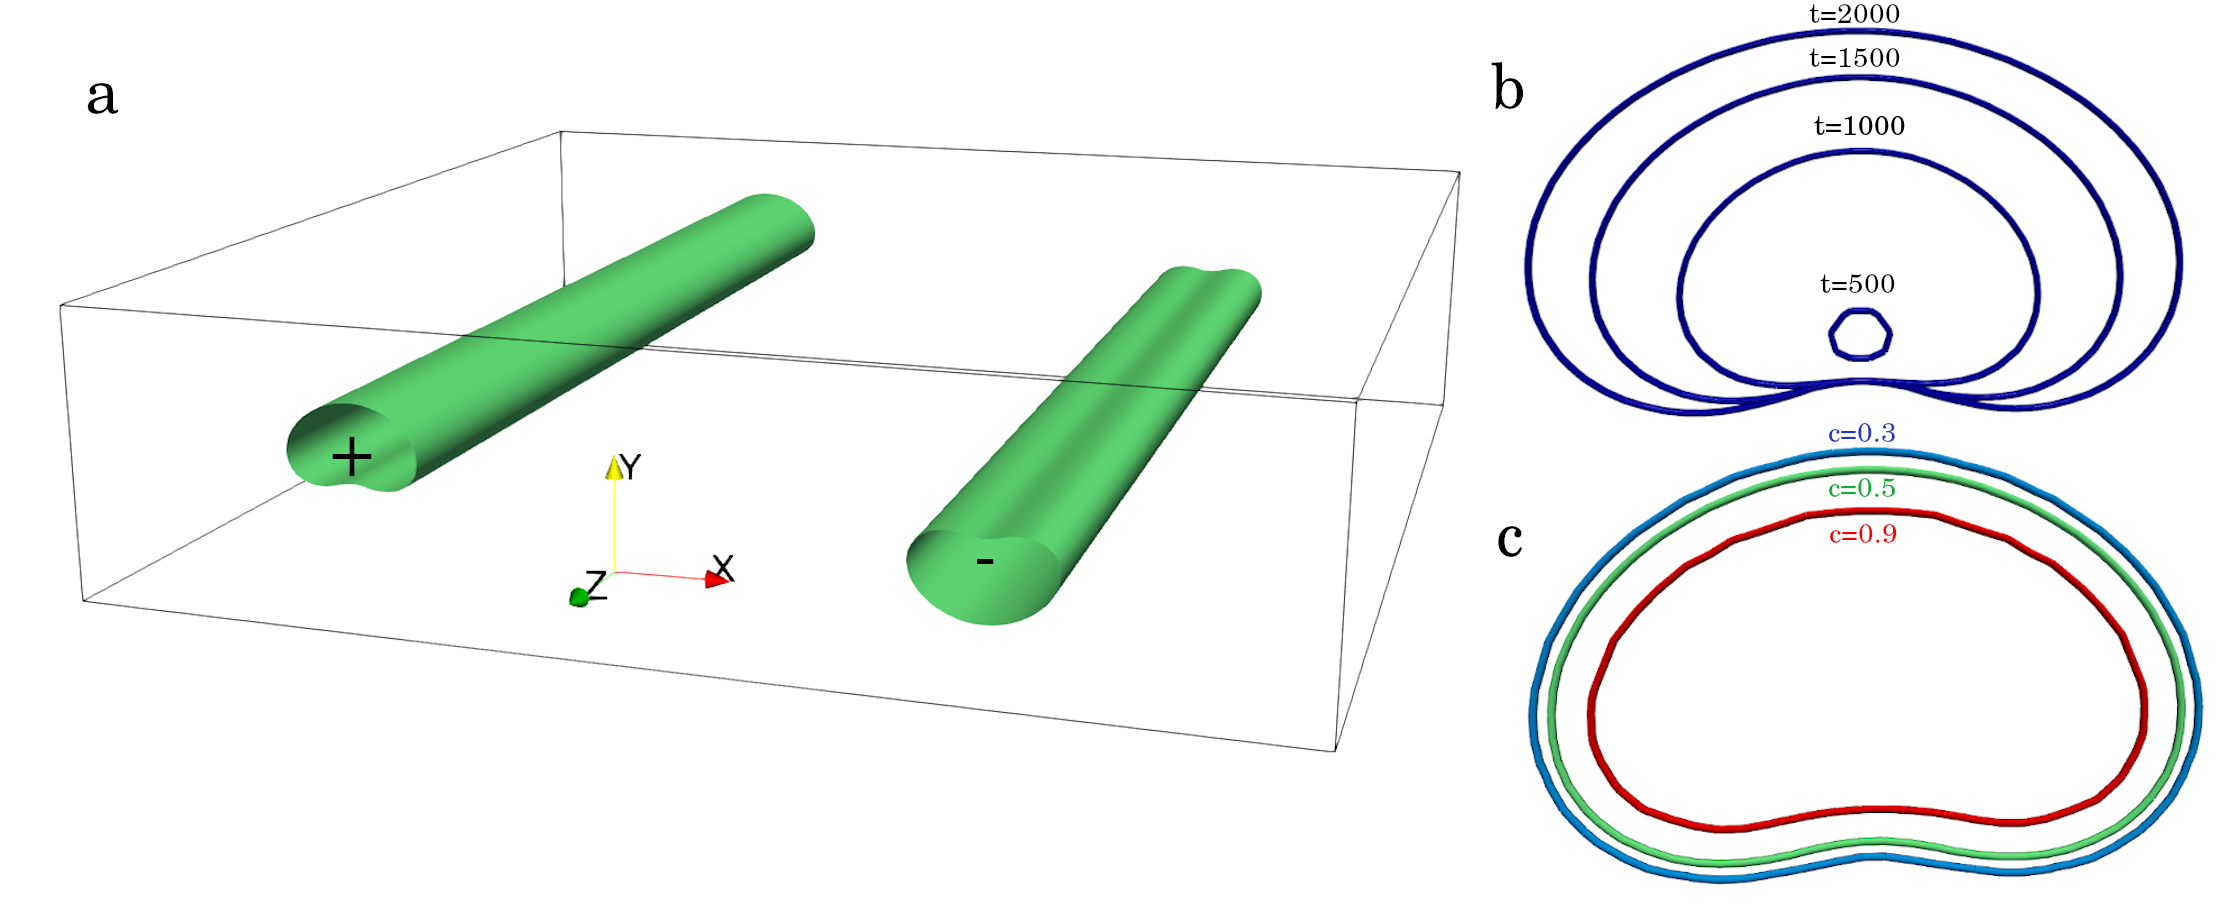
In this simulation, we assume that the bulk and pipe mobilities are the same. In Figure 1(b), we show the composition contour lines as a function of time in the (-)plane perpendicular to the dislocation line. In Figure 1(c), we show three composition contour lines, namely, , and in the plane perpendicular to the dislocation line.
From these figures, it is clear that there is (a) segregation to the dislocation which leads to precipitate nucleation and subsequent growth. Further, note that the shape of the composition profile is consistent with the cardioid profile given by [7]:
| (8) |
where is the radial distance from the dislocation line, is the far-field composition, and is a constant. These shapes are also in agreement with the shape of the precipitate that nucleates along an edge dislocation as shown in [4, 17]. Thus, when we do not assume faster pipe diffusion, we recover the results in the existing literature, which, in turn, serves as a benchmark for our model and implementation.
3.2 Spinodal decomposition induced by enhanced pipe diffusion
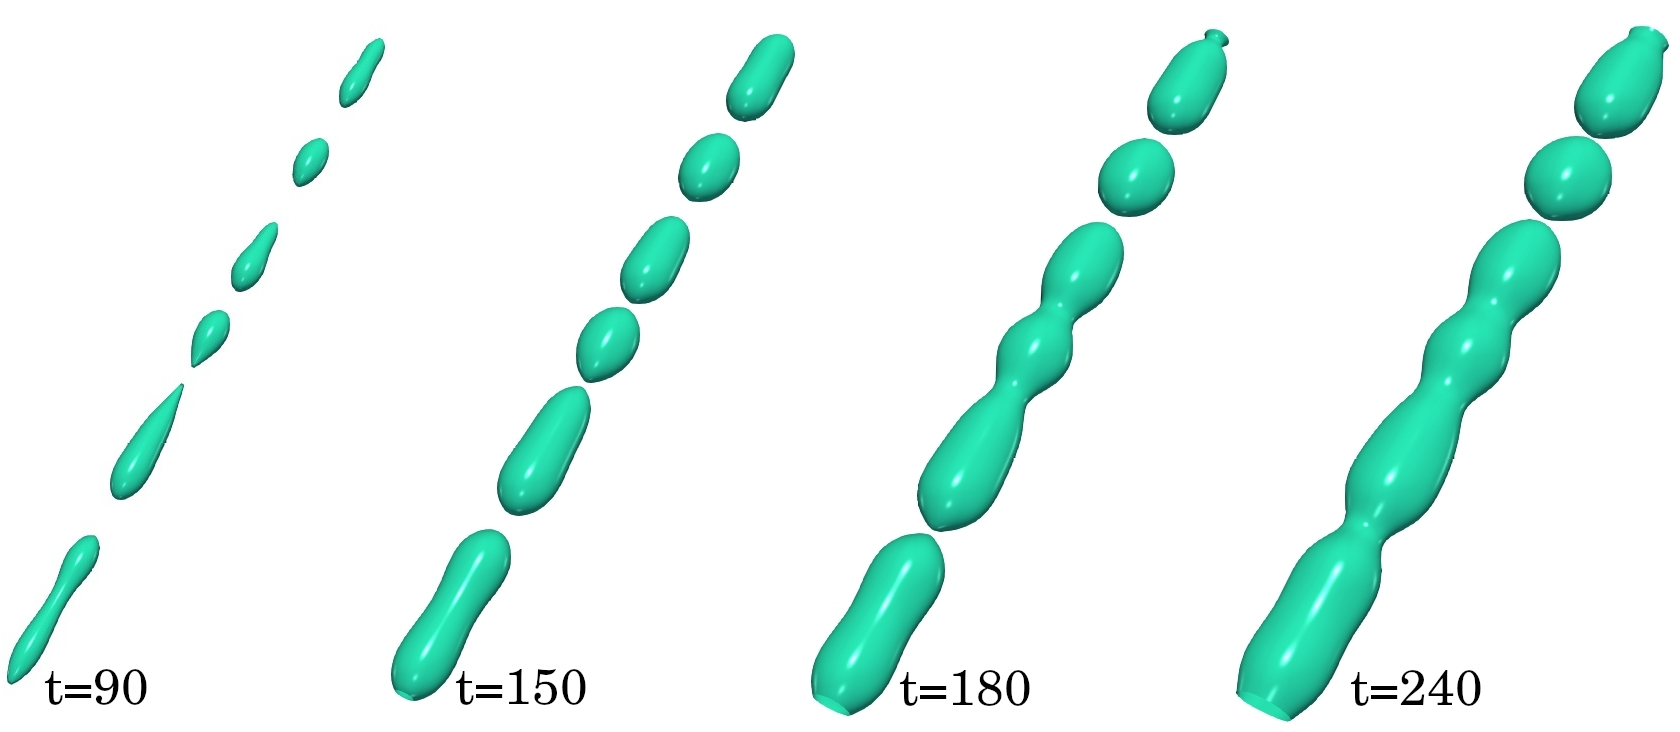
Let us consider the same initial profile as in the previous section; however, let us increase the pipe mobility to be hundred times that of the bulk mobility. In Figure 2, we show the composition contour lines for this system. It is clear that the system undergoes phase separation via the spinodal mechanism along the dislocation line. As time progresses, there is also coarsening and coalescence. Thus, in contrast to Figure 1 where we saw cardioid shape, here, we see a morphologically discontinuous phase separated microstructure along the dislocation line at earlier times which becomes a nearly continuous morphology albeit with a wavy interface.
In order to see the effect of the ratio of the pipe mobility to bulk mobility, we also carried out simulations where the atomic mobility was kept as ten and fifty times that of bulk mobility. These results are summarised in Figure 3 by plotting the area fraction in the left half of the simulation cell which contains the positive edge dislocation. We calculate the area fraction (in percentage – in the -plane) of the solute-rich phase along the dislocation line by counting the number of grid points with as a fraction of the total number of grid points in the left half of the -plane.

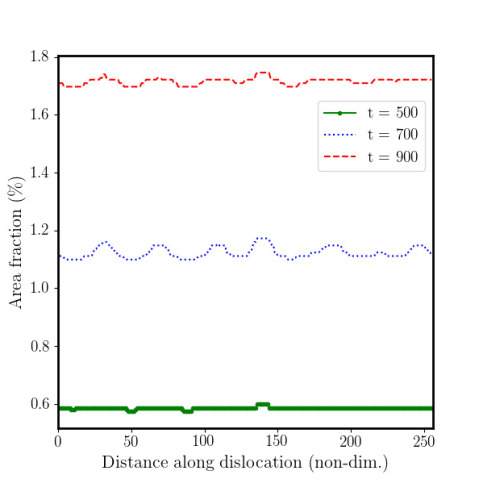
In Figure 3(a), we show the area fraction (which is a proxy for the morphology of the solute rich phase) along the dislocation line for the cases where the atomic mobility along the dislocation core is 100 and 50 times that of the bulk – for two different times, namely and . Both and cases show wavy profiles, indicating the growth of the composition fluctuation by spinodal mechanism. However, the amplitudes are different; smaller the pipe mobility, smaller the amplitude of the profile; in fact, the profiles, but for the amplitude are almost the same. Since the bulk mobility is the same in both cases, the amount of solute reaching the dislocation at any given time is the same. Thus, the enhanced amplitude of fluctuation is solely due to the higher pipe mobility.
From the classical theory of spinodal decomposition, it is known that the coherent spinodal limit can be obtained by solving the following equation [31]:
| (9) |
For our system, the coherent spinodal limit according to Eq. (9) is calculated as . Even for our initial composition of , which is well outside this spinodal limit, we observe that the solute-dislocation interaction is strong enough to segregate enough material along the dislocation and increase the local composition field above the coherent spinodal limit. As the composition along the dislocation enters the spinodal regime, there are also the so-called “up-hill” diffusion fluxes set-up along the dislocation line.
From the classical theory of spinodal decomposition, it is also known that, at the early stages of the decomposition, at least, the rate of growth of the amplitude of a fluctuation of wavelength is given by [31] where is the amplification factor. This amplification factor is a function of mobility , where M is the mobility, and is the bulk free energy density given by the double well potential. This expression assumes that the system under consideration is elastically isotropic. The composition fluctuation decays when is negative and grows when it is positive. Since the amplification factor is a function of the wavelength of the fluctuation, there is a critical wavelength at which will be equal to zero. The critical wavelength and the maximally growing wavelength . That is, the energetic parameters of the system such as the (incipient) interfacial energy, the eigenstrains, and the elastic moduli determine the wavelengths of compositional fluctuations; on the other hand, the growth rate depends on the mobility. Thus, in Figure 3(a), the mobilities do not change the profile and only change their amplitude is consistent with the classical theory of spinodal decomposition.
In Figure 3(b), we show the profile of the area fraction plot at different times for the case where the atomic mobility along the dislocation line is 10 times that of bulk mobility. Here, we see that with time, the morphology becomes more uniform and the waveiness is smoothened out. This can be understood in terms of the stability of the compositional cylinder (of cardioid cross-section) along the dislocation line. As shown by Nichols and Mullins [32], the morphological perturbations along the length of the cylinder (albeit, of circular cross-section) decay to material flow from the bulk. Thus, the spinodal fluctuations along the dislocation line, which tend to perturb the cylinder, will die, unless, the spinodal fluctuations grow faster than the rate at which bulk diffusion is trying to smoothen these morphologies. This is the reason why we see spinodal morphology only with higher mobilities.
Thus, we see that in the case of dislocation assisted phase separation, the mechanism of phase separation can change from nucleation and growth to spinodal decomposition depending on the enhanced pipe mobility. Given that the pipe mobilities are typically two to three orders of magnitude higher, in systems that undergo spinodal decomposition, the dislocations can play a crucial role in the phase separation mechanism; more importantly, dislocations can promote phase separation even when the nominal alloy composition is outside the spinodal region. Thus, the spinodal phase separation in these systems is induced by segregation and is assisted by pipe diffusion.
3.3 Effect of dislocation network: concurrent nucleation and spinodal
Our aim, in this subsection, is to understand the effect of dislocation networks. So, let us consider a system with two intersecting slip systems; in addition to the dipoles in the (010) plane (as in the previous cases), we introduce another dipole in the (001) plane (that is, with the slip plane normals in the positive -direction) with the sense vectors of the dislocations along the positive and negative -direction (for the dislocations at the left and right, respectively). In this case, we use grid points and the Burgers vectors are aligned along the -direction. This configuration is shown in Figure 4(a). In Figure 4(a)-(d) we show the iso-surfaces at different times; in the figures (b)-(d), we show only one intersection for clarity. In this case also, the pipe mobility is 100 times the bulk mobility.
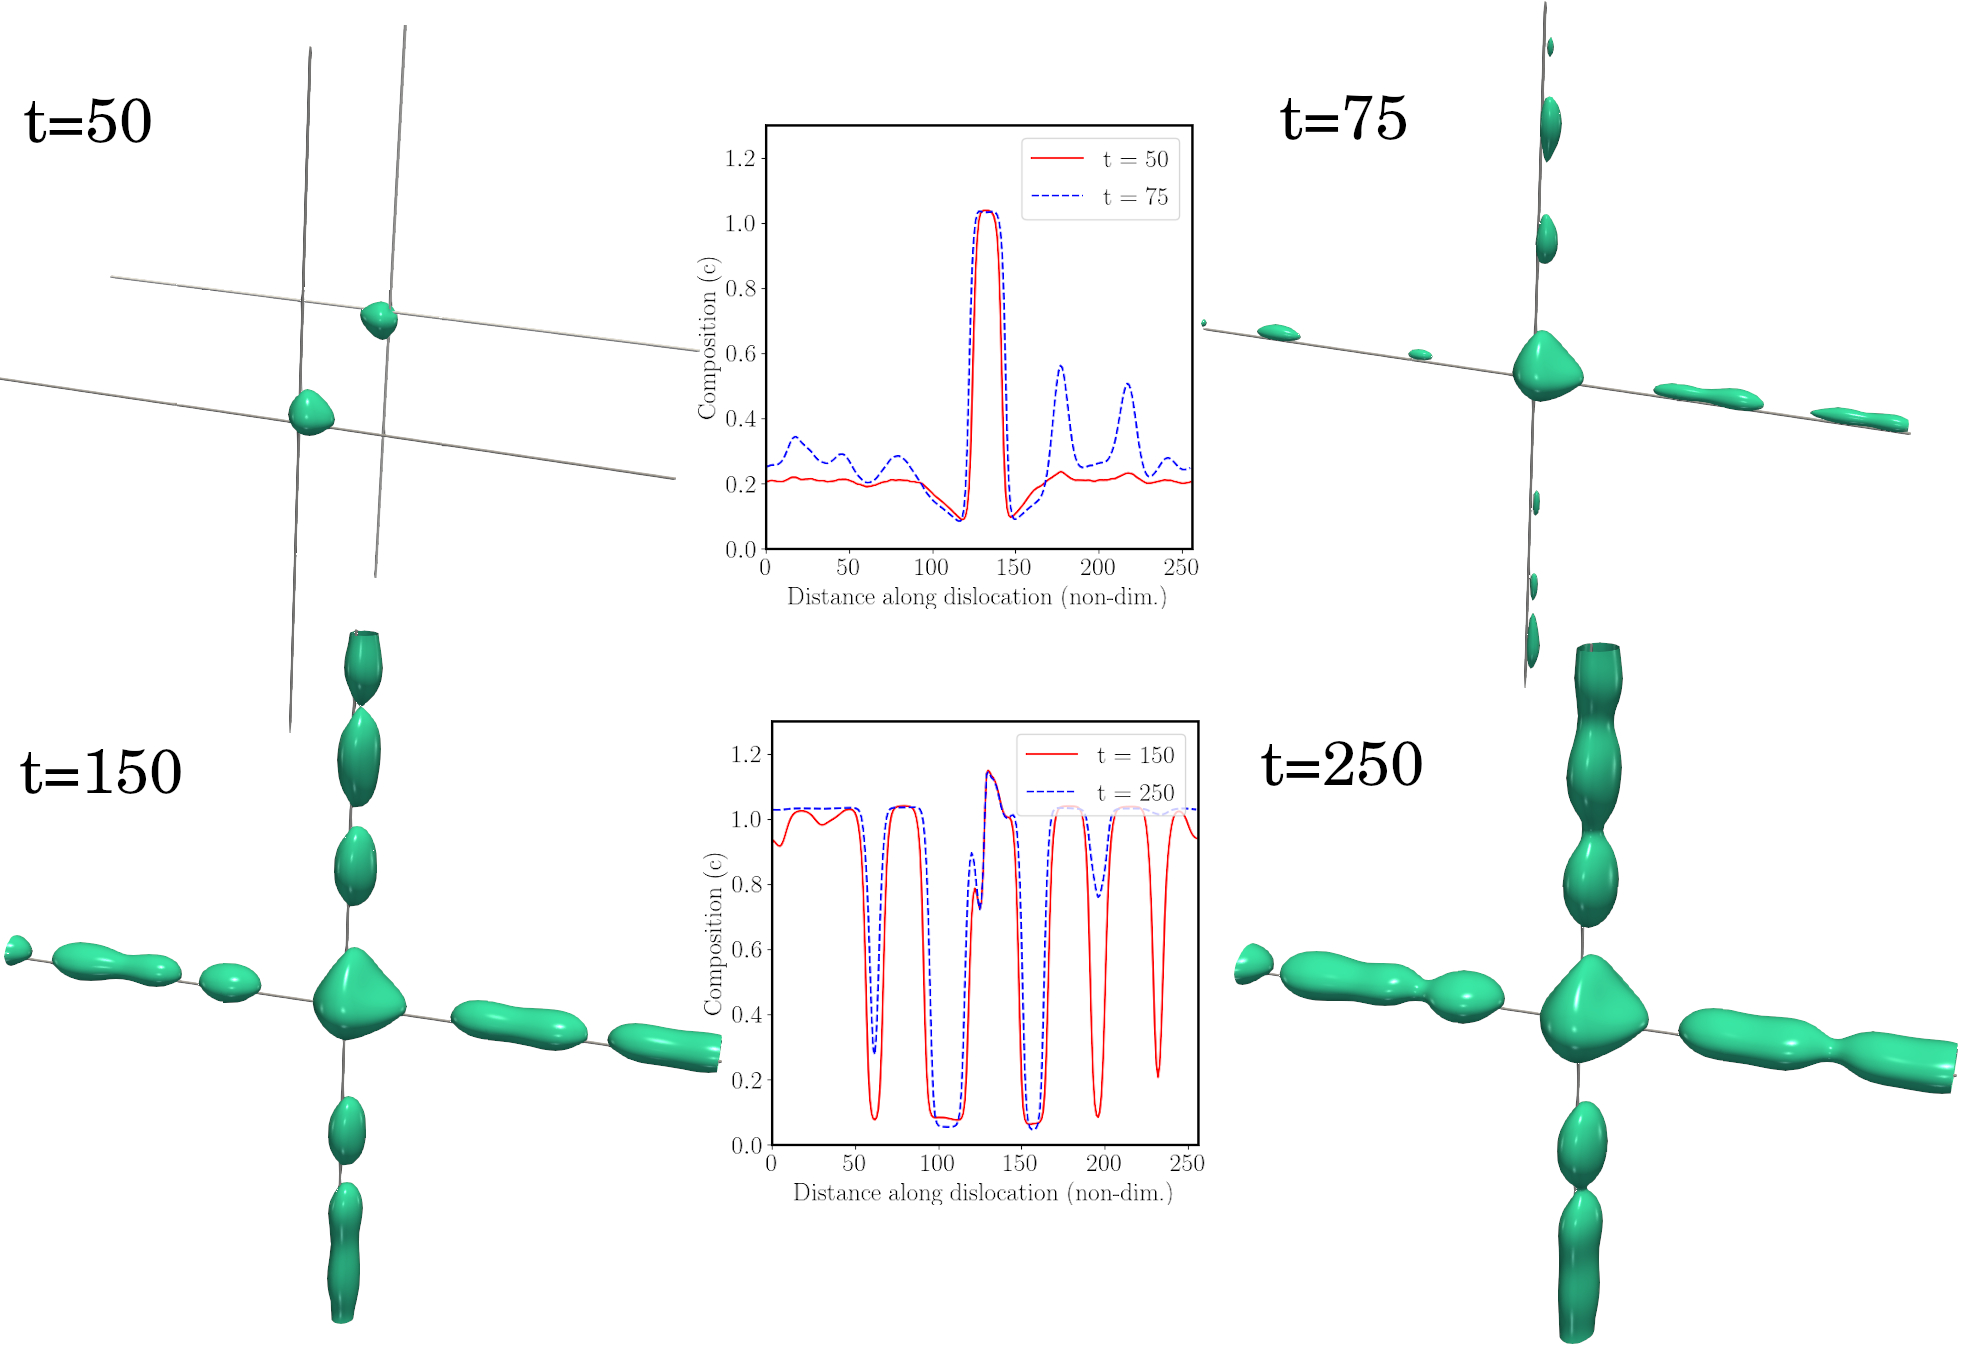
The initial overall composition in the simulation cell is . At , there solute-rich phase nucleates at the intersection of the two dislocations. As time progresses, the composition along the other parts of the two intersecting dislocations cross the spinodal limit of . At , there is phase separation along the dislocation lines via spinodal mechanism, and subsequently, there is growth and coalescence.
In order to clearly show the concurrent nucleation and growth at the junction, and spinodal along the dislocations, we also show the composition profile along one of the dislocations in the inset. The composition profile in the initial stages clearly shows the nucleation of the second phase at the intersection. The composition along the rest of the dislocation reaches the coherent spinodal limit as time progresses, and, at , the composition along the dislocation line is above the spinodal limit; hence, we observe growing composition fluctuations on both sides of the central precipitate. These fluctuations along the dislocation lead to solute rich second phase. When phase separation occurs, material is also added to the central precipitate by virtue of the faster atomic mobility along the dislocation core. In the composition profiles in Figure 4, the values above unity are due to Gibbs-Thomson effect.
3.4 Map of phase separation mechanisms
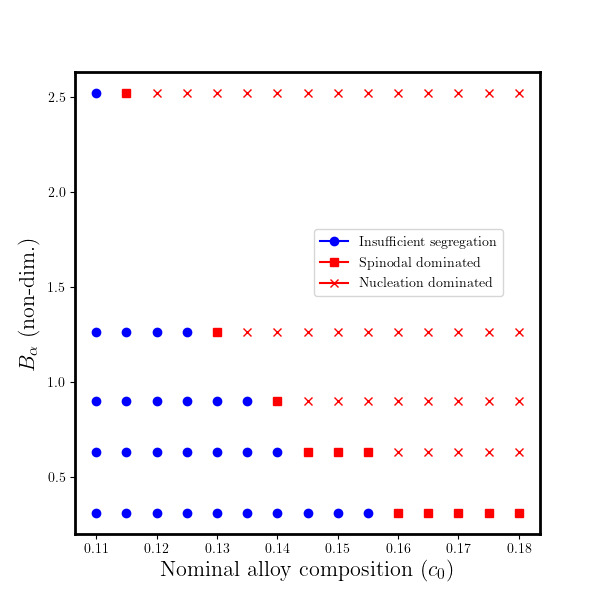
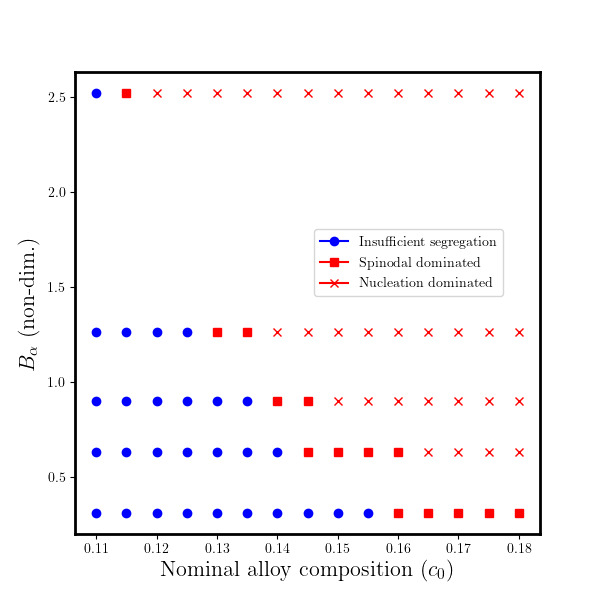
From the results and discussion so far, it is clear that the segregation (which is controlled, in our model, by the core energy coefficient), the available solute (which is determined by the overall alloy composition), and the pipe mobility. Figure 5 shows a map of phase separation mechanisms as a function of the core energy coefficient , overall alloy composition and mobility ratio . We considered two different pipe mobilities of (Figure 5(a)), and, (Figure 5(b)). For increasing , the core width decreases, causing higher segregation of solute to dislocation by elastic interaction. Due to this, segregation assisted phase transformation occurs at smaller for higher . Phase separation occurs only in those cases where the perturbations caused by the pipe mobility grows at a faster rate as compared to material segregating from the bulk [32]. This is clear from Figure 5(b), in which there is a wider range of across which spinodal morphology dominates.
4 Comparison with experimental results
Even though a direct comparison of our simulation results with experiments is not possible, a qualitative comparison is possible. In this section, we make two such comparisons.
4.1 Dislocation induced spinodal
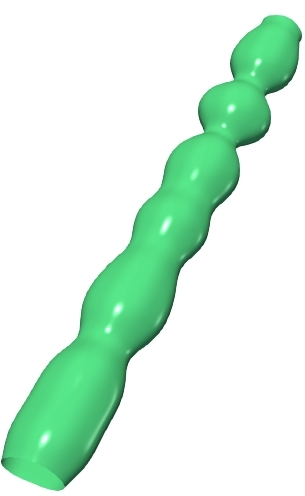
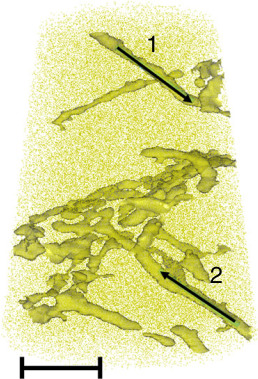
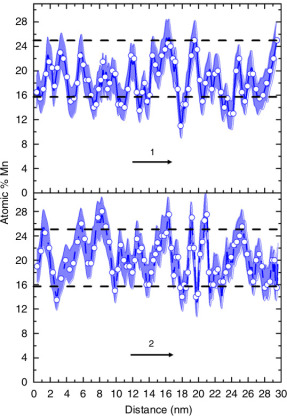
In Figure 6, we show (a) the spinodally decomposed morphology along the dislocation line from our simulations; in (b) and (c), the atom probe results of localised spinodal flcutuations in the Fe-Mn system in which the overall alloy composition (9 at.% Mn) was outside the spinodal limits (15.8–25 at.% Mn) at 450 °C [13]. As can be seen, there are composition fluctuations measured along the dislocations in these experiments. The morphology of phase separated regions seen in our simulations is very similar to that observed in these atom probe results.
Further, our results clearly show the role of faster diffusion along the dislocation cores in producing such morphologies; as shown in the simulations and explained using the linear stability analysis of Nichols and Mullins [32], if the bulk and dislocation pipe mobilities are assumed to be the same, this phenomenon will not be observed; this, we believe could indeed be the case with some of the previous simulation studies [15].
4.2 Effect of dislocation network on precipitate morphology
A precipitate that nucleates homogeneously in an isotropic system will grow with a spherical shape. However, the presence of elastic fields of defects in the system can alter this behaviour and can affect the shape of the precipitate.
A recent APT study in maraging steel [33] has shown that precipitates formed in high dislocation density regions have a markedly different morphology as compared to the defect-free region. The Fe-Mo preipitates assume a near spherical shape in defect free regions and deviate from this shape as the precipitation happens in regions with dislocation networks.
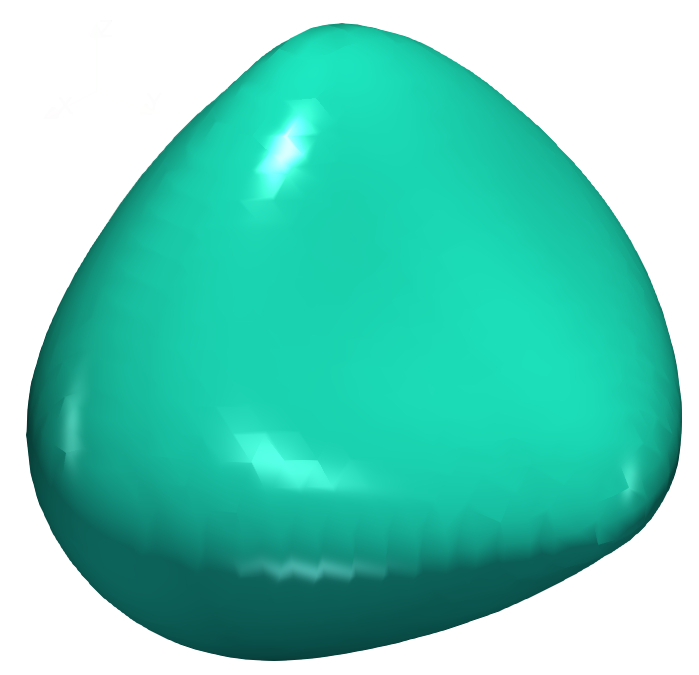
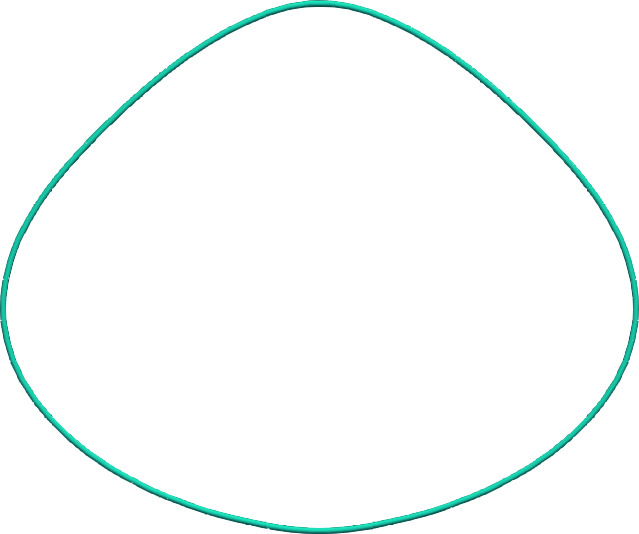

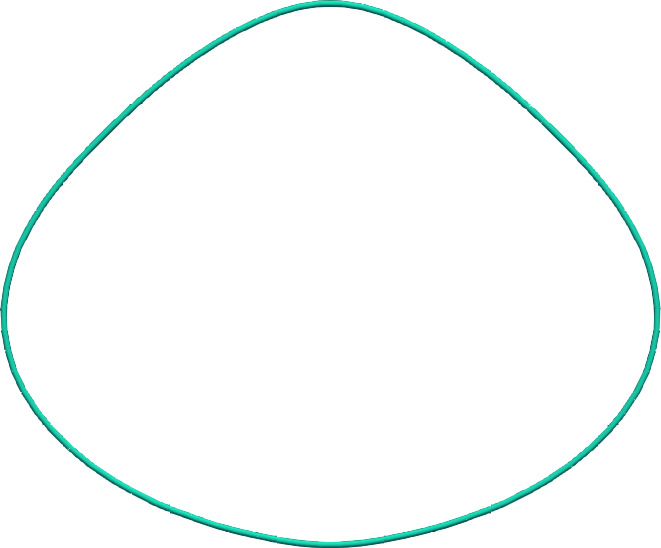
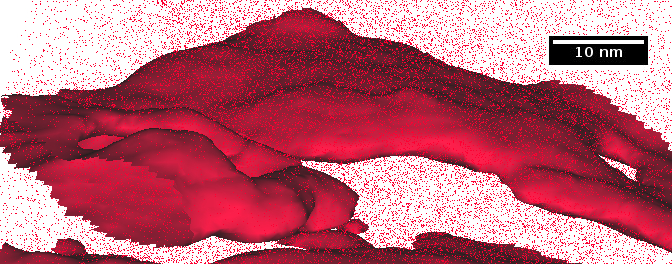
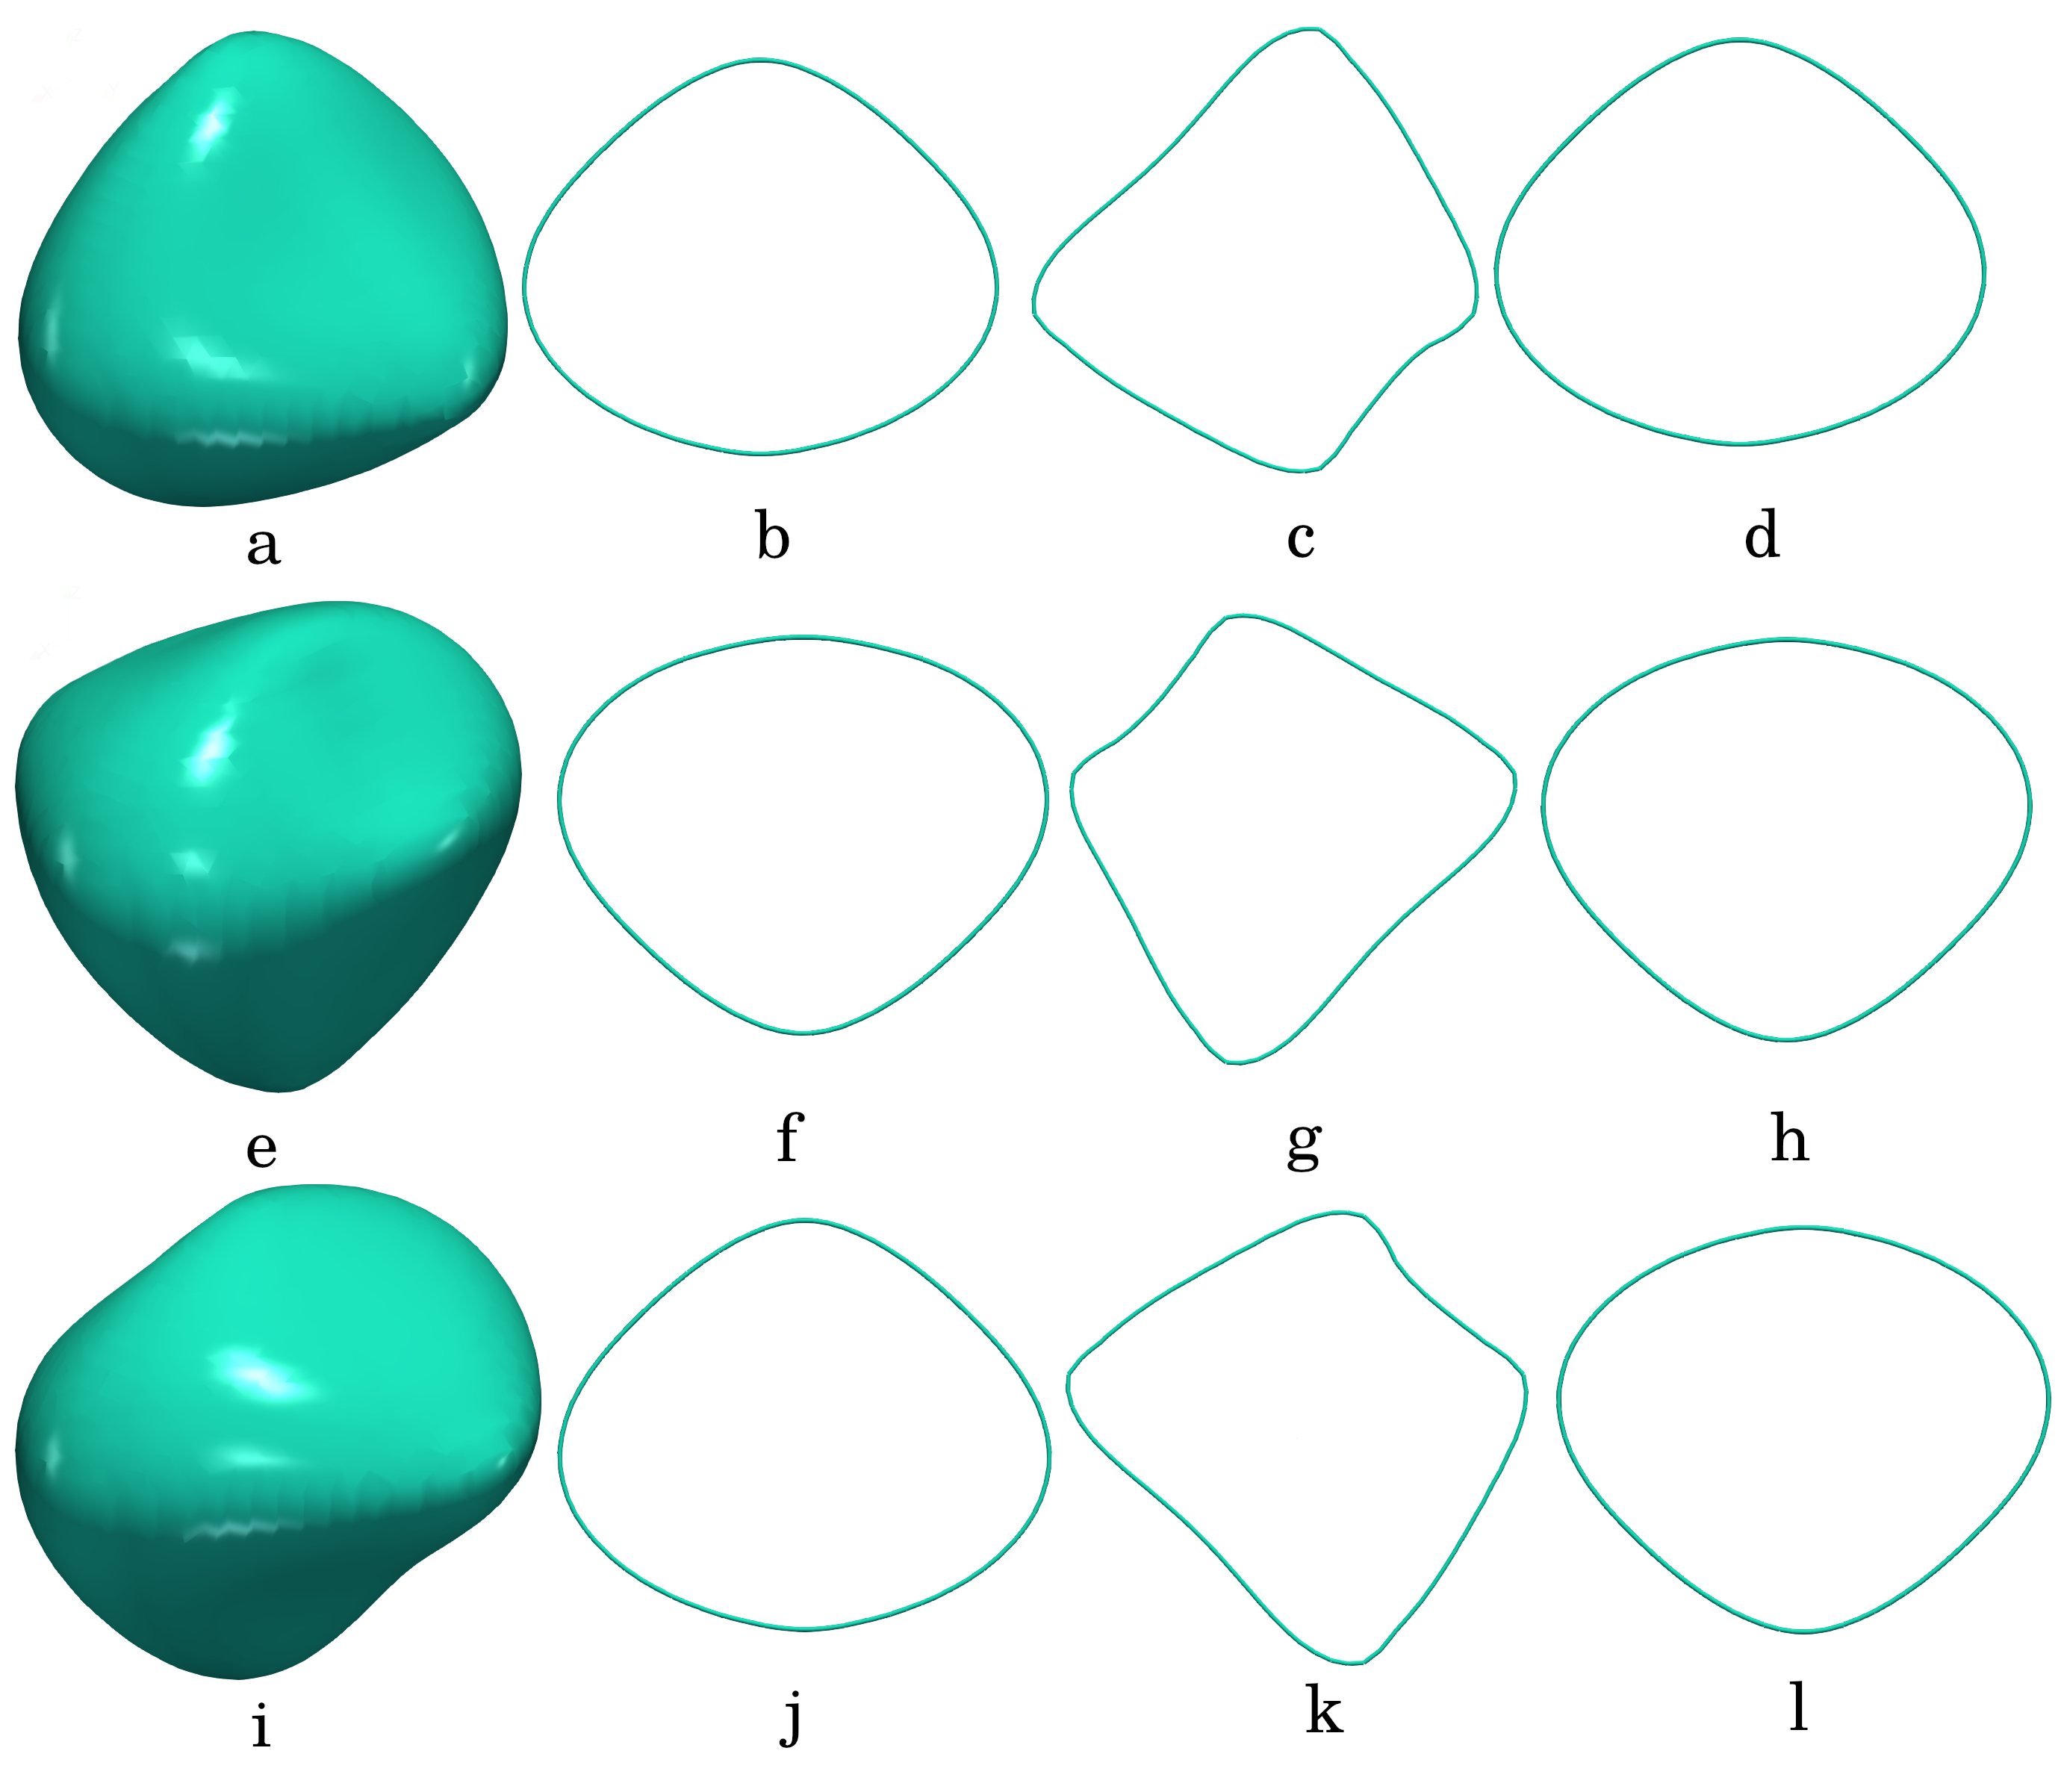
In Figure 7(a), we show the morphology of the precipitate that nucleates at the dislocation intersection; as can be seen in Figure 7(b)-(d), the cross-sections along different planes are very different and the precipitate is highly non-spherical. In fact, we have verified that depending on the nature of the dislocations that intersect (positive-positive, negative-positive, positive-negative, and negative-negative), the cross-sections differ (see supplementary information). Thus, the protuberances in the precipitate shape are a result of the interaction of solutes with dislocation strain fields. Very similar morphologies are seen by Jacob et al. [33] in their APT studies of Fe-Mo precipitates: see Figure 7(e). While the protuberances in the experimental morphologies are very similar, we believe that the plate-like structure of the precipitate is a result of the intersection of a large number of dislocations.
5 Conclusions
The following are the salient conclusions from our phase field simulations of segregation assisted and pipe-diffusion driven spinodal decomposition along dislocations.
-
1.
For a system with alloy composition well outside the spinodal limit, when there is faster mobility at the dislocation core, phase transformation occurs by spinodal decomposition along the dislocation line. The rate of growth of composition fluctuations increases with increasing pipe mobility. There is qualitative agreement between the spinodal morphology along the dislocation line obtained in our simulations with that of APT experiments for Fe-Mn systems [13].
-
2.
We have identified the range of parameters, namely, dislocation-solute interaction strength (determined by ), nominal alloy composition and the enhanced pipe mobility, a combination of which causes phase separation by spinodal decomposition.
-
3.
Concurrent nucleation and spinodal decomposition is possible in the case of systems with dislocation networks, where the intersections of dislocations act as energetically favourable sites for nucleation. The morphology of the precipitate at the dislocation intersection agrees well with the Mo-rich precipitates in maraging steels [33].
Acknolwedgements
We thank (i) Mr Kevin Jacob, and, Professor Nagamani Jaya Balila for sharing their experimental results (Figure 7(e)) and for useful discussions; (ii) Professor Ferdinand Haider, Professor T A Abinandanan, and Mr. Abhinav Roy for discussions on various aspects of the formulation and numerical implementation; and, (iii) (a) Dendrite and Space-Time, IIT Bombay, (b) Spinode – the DST-FIST HPC facility, Dept. of ME & MS, IIT Bombay, and (c) C-DAC, Pune for high performance computing facilities. This project is funded by Science and Engineering Research Board, Dept. of Science and Technology, Govt. of India though the research grant CRG/2019/005060.
References
- [1] A. H. Cottrell, B. A. Bilby, Dislocation theory of yielding and strain ageing of Iron, Proceedings of the Physical Society: Section A 62 (1) (1949) 49–62.
- [2] A. H. Cottrell, M. Jaswon, Distribution of solute atoms round a slow dislocation, Proceedings of the Royal Society of London A: Mathematical and Physical Sciences 199 (1056) (1949) 104–114.
- [3] B. A. Bilby, On the interactions of dislocations and solute atoms, Proceedings of the Physical Society. Section A 63 (3) (1950) 191–200.
- [4] W. G. Wolfer, M. Ashkin, Diffusion of vacancies and interstitials to edge dislocations, Journal of Applied Physics 47 (3) (1976) 791–800.
- [5] P. Beaven, E. Butler, Precipitate nucleation on dislocations in Fe–N, Acta Metallurgica 28 (10) (1980) 1349–1359.
- [6] A. W. Cochardt, G. Schoek, H. Wiedersich, Interaction between dislocations and interstitial atoms in body–centered cubic metals, Acta Metallurgica 3 (6) (1955) 533–537.
- [7] P. M. Anderson, J. P. Hirth, J. Lothe, Theory of dislocations, Cambridge University Press, 2017.
- [8] J. W. Cahn, Nucleation on dislocations, Acta Metallurgica 5 (3) (1957) 169–172.
- [9] F. S. Ham, Stress-assisted precipitation on dislocations, Journal of Applied Physics 30 (6) (1959) 915–926.
- [10] R. Gomez-Ramirez, G. Pound, Nucleation of a second solid phase along dislocations, Metallurgical Transactions 4 (6) (1973) 1563–1570.
- [11] W. C. Dash, Copper precipitation on dislocations in Silicon, Journal of Applied Physics 27 (10) (1956) 1193–1195.
- [12] Z. Feng, Y. Yang, B. Huang, M. Han, X. Luo, J. Ru, Precipitation process along dislocations in Al–Cu–Mg alloy during artificial aging, Materials Science and Engineering: A 528 (2) (2010) 706–714.
- [13] A. K. Da Silva, D. Ponge, Z. Peng, G. Inden, Y. Lu, A. Breen, B. Gault, D. Raabe, Phase nucleation through confined spinodal fluctuations at crystal defects evidenced in Fe-Mn alloys, Nature Communications 9 (1) (2018) 1–11.
- [14] R. D. Kamachali, A. K. da Silva, E. McEniry, D. Ponge, B. Gault, J. Neugebauer, D. Raabe, Segregation-assisted spinodal and transient spinodal phase separation at grain boundaries, npj Computational Materials 6 (1) (2020) 1–13.
- [15] J. R. Mianroodi, P. Shanthraj, B. Svendsen, D. Raabe, Phase-field modeling of chemoelastic binodal/spinodal relations and solute segregation to defects in binary alloys, Materials 14 (7) (2021) 1787.
- [16] F. Léonard, R. C. Desai, Spinodal decomposition and dislocation lines in thin films and bulk materials, Physical Review B 58 (13) (1998) 8277–8288.
- [17] S. Y. Hu, L.-Q. Chen, Solute segregation and coherent nucleation and growth near a dislocation—a phase-field model integrating defect and phase microstructures, Acta Materialia 49 (3) (2001) 463–472.
- [18] M. Haataja, F. Léonard, Influence of mobile dislocations on phase separation in binary alloys, Physical Review B 69 (8) (2004) 081201–(1–4).
- [19] M. Haataja, J. Mahon, N. Provatas, F. Léonard, Scaling of domain size during spinodal decomposition: dislocation discreteness and mobility effects, Applied Physics Letters 87 (25) (2005) 251901–(1–3).
- [20] N. Ma, C. Shen, S. Dregia, Y. Wang, Segregation and wetting transition at dislocations, Metallurgical and Materials Transactions A 37 (6) (2006) 1773–1783.
- [21] Y.-S. Li, S.-X. Li, T.-Y. Zhang, Effect of dislocations on spinodal decomposition in Fe–Cr alloys, Journal of Nuclear Materials 395 (1-3) (2009) 120–130.
- [22] M. Legros, G. Dehm, E. Arzt, T. J. Balk, Observation of giant diffusivity along dislocation cores, Science 319 (5870) (2008) 1646–1649.
- [23] Y. U. Wang, Y. Jin, A. Cuitino, A. Khachaturyan, Nanoscale phase field microelasticity theory of dislocations: model and 3D simulations, Acta Materialia 49 (10) (2001) 1847–1857.
- [24] D. Rodney, Y. Le Bouar, A. Finel, Phase field methods and dislocations, Acta Materialia 51 (1) (2003) 17–30.
- [25] M. Koslowski, A. M. Cuitino, M. Ortiz, A phase-field theory of dislocation dynamics, strain hardening and hysteresis in ductile single crystals, Journal of the Mechanics and Physics of Solids 50 (12) (2002) 2597–2635.
- [26] C. Shen, Y. Wang, Incorporation of -surface to phase field model of dislocations: simulating dislocation dissociation in FCC crystals, Acta Materialia 52 (3) (2004) 683–691.
- [27] L. Lei, M. Koslowski, Mesoscale modeling of dislocations in molecular crystals, Philosophical Magazine 91 (6) (2011) 865–878.
- [28] A. Hunter, I. J. Beyerlein, T. C. Germann, M. Koslowski, Influence of the stacking fault energy surface on partial dislocations in FCC metals with a three-dimensional phase field dislocations dynamics model, Physical Review B 84 (14) (2011) 144108.
- [29] J. Zhu, L.-Q. Chen, J. Shen, V. Tikare, Coarsening kinetics from a variable–mobility Cahn-Hilliard equation: Application of a semi-implicit Fourier spectral method, Physical Review E 60 (4) (1999) 3564–3572.
- [30] T. Mura, Micromechanics of defects in solids, Kluwer, 1987.
- [31] J. W. Cahn, On spinodal decomposition in cubic crystals, Acta Metallurgica 10 (3) (1962) 179–183.
- [32] F. A. Nichols, W. W. Mullins, Surface-(interface-) and volume-diffusion contributions to morphological changes driven by capillarity, Transactions of the Metallurgical Society of AIME 233 (10) (1965) 1840–1848.
- [33] K. Jacob, A. Roy, M. P. Gururajan, B. Nagamani, Effect of dislocation networks on precipitate morphology in maraging steels, Available at SSRN 3799669.
Supplementary information
