Mechanically Modulated Sideband and Squeezing Effects of Membrane Resonators
Abstract
We investigate the sideband spectra of a driven nonlinear mode with its eigenfrequency being modulated at a low frequency (1 kHz). This additional parametric modulation leads to prominent antiresonance lineshapes in the sideband spectra, which can be controlled through the vibration state of the driven mode. We also establish a direct connection between the antiresonance frequency and the squeezing of thermal fluctuation in the system. Our work not only provides a simple and robust method for squeezing characterization but also opens a new possibility toward sideband applications.
Micro- and nanomechanical resonators have been shown to be ultra sensitive for charge, force and mass measurements in the nonlinear regime [1, 2, 3, 4, 5, 6]. However, the high sensitivity also renders the resonators susceptible to environmental fluctuations such as thermal noise [7, 8, 9] or molecular
motion [10, 11], thereby limiting their applications. One way to circumvent this limit is by taking advantage of squeezing effects, where the fluctuation of one quadrature is reduced at the expense of that in its conjugate [12]. Such a signature was firmly established in both theory and experiment to characterize squeezing effects in various types of resonators [13, 14, 15, 16]. However, the squeezing effect in the quadrature is usually very subtle and requires sensitive measurements and careful analysis to enable its detection, particularly in systems of high quality factors ().
Recently, there has been rising interest in the sideband response of resonantly driven nonlinear modes [17, 18, 19].
In contrast to those arising from the coupling of flexural modes [20, 21, 22], these sidebands are related to fluctuations around stable states of the driven system and appear in pairs at either side of the driven frequency. It has been shown that the sidebands exhibit a strong amplitude asymmetry within the pair and their integrated intensity ratios
give direct access to squeezing in the system [17], which avoids the difficulties in the quadrature method. On the other hand, these sidebands also have important implications in technological applications such as tunable signal-to-noise ratio amplifiers, super-narrow frequency detectors and filters [23]. Therefore, it is of great importance to understand their behavior under external stimulus and achieve the control of these sidebands.
In this Letter, we present a so far undescribed sideband response of a nonlinear vibrating membrane resonator using a two-tone measurement. In addition to the drive tone that resonantly excites the system, we also apply an additional probe tone with a very low frequency (1 kHz). We find that this probe tone modulates the eigenfrequency of the system and leads to a sideband response markedly different from previous studies [17, 18, 19]. Specifically, both their amplitudes and lineshapes show strong asymmetries and, most saliently, the sidebands exhibit a typical antiresonance response. We further show that the antiresonance frequency can be used to determine the squeezing parameters of the system, and they are tunable through the control of vibrational states of the driven mode. Such a tunable sideband response offers a new possibility for future device applications. Our results may also give insight into other sideband related phenomena such as the energy transfer via mode coupling in the nonlinear and the chaotic regime [19, 24, 25, 26, 27].
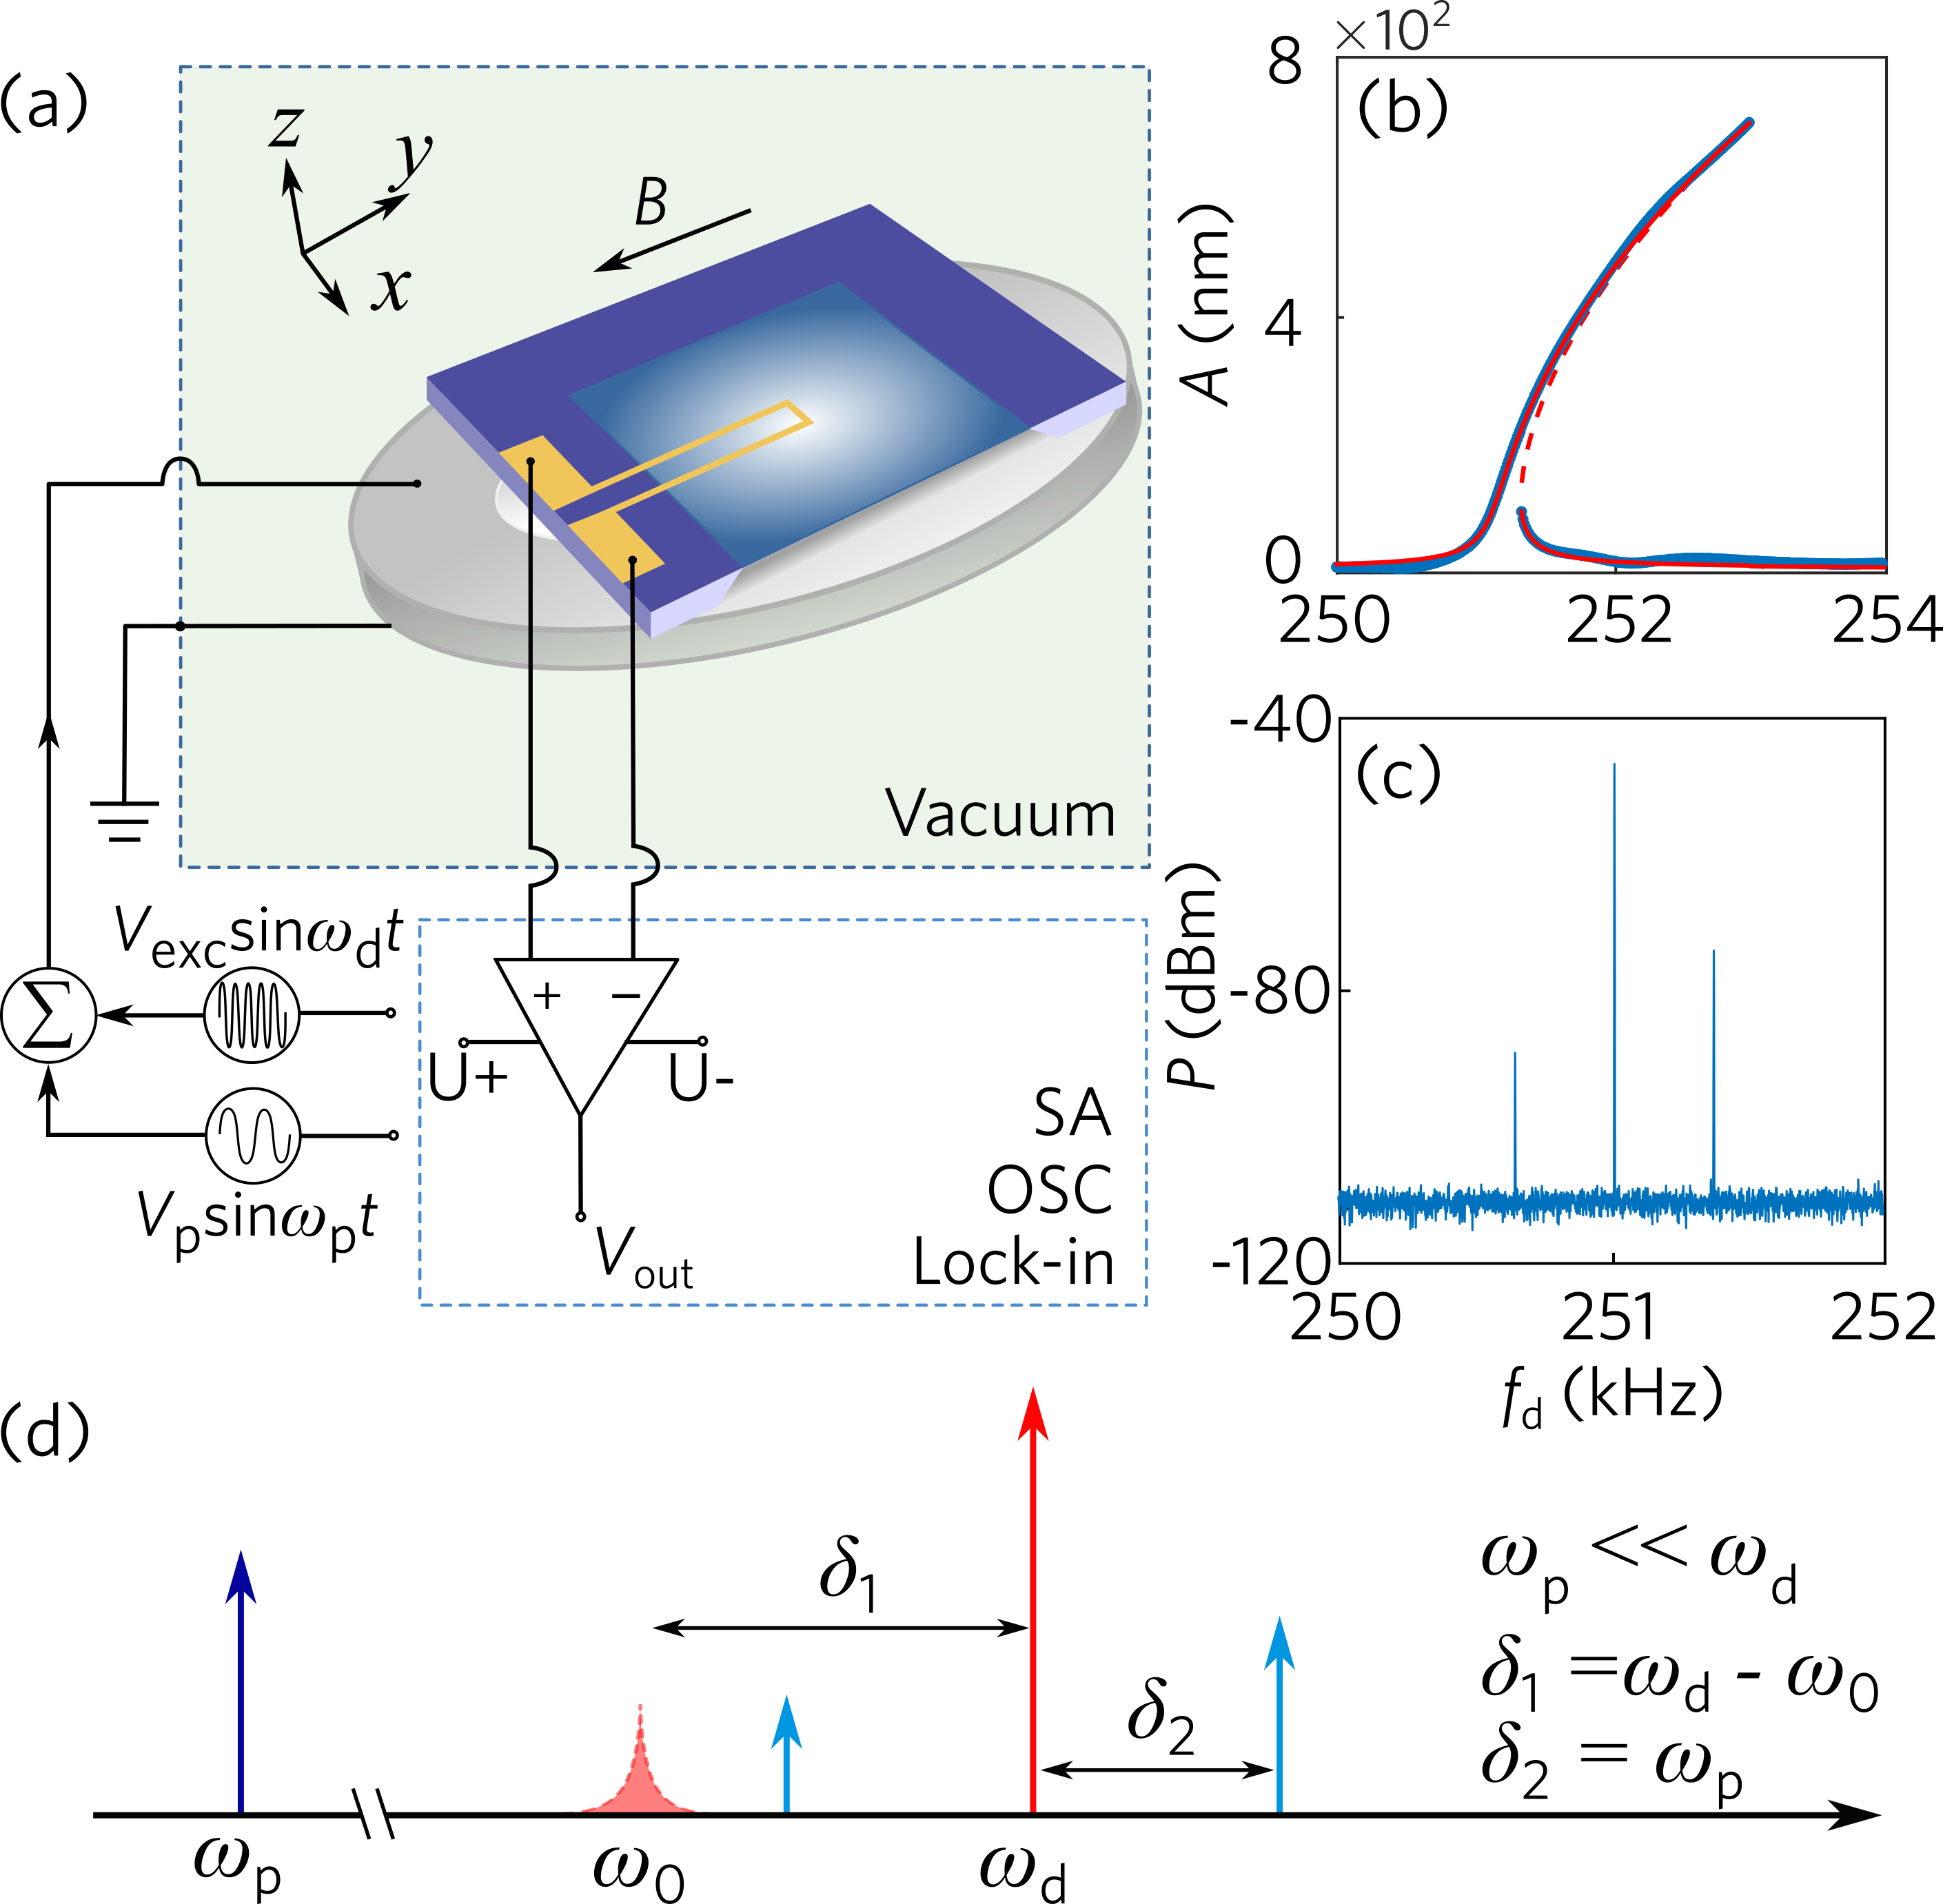
The measured device is composed of a 500 nm thick silicon nitride (Si-N) membrane suspended on a massive silicon frame attached to a piezo ring. The vibration of the freestanding membrane is excited by applying an AC voltage onto the piezo ring at a drive frequency close to the eigenfrequency of the membrane resonator. To detect the vibrations, we fabricate 27 nm thick aluminum structures on the membrane using a standard e-beam lithography technique and measure the inductive voltage across the structures under an external uniform magnetic field, as depicted in Fig. 1a). The driven mode parameters (frequency, amplitude, quality factor) can be quantitatively obtained from the voltage using the Faraday’s law. All the measurements are performed in vacuum at room temperature. More sample fabrication and setup details can be found in the Supplementary Materials (SM) [28] and also our previous works [29, 30, 31].

Figure 1b) shows the response of our system to a typical single excitation driven close to its fundamental mode. The vibration exhibits a typical Duffing response with two stable states of different vibration amplitudes when the drive tone is sweeping along different direction, and we can quantitatively extract the driven mode parameters including its eigenfrequency , damping () and the cubic (Duffing) nonlinearity using the methods described in the SM [28]. In the upper branch (i.e., the large vibration state), a simultaneous application of a drive tone at and a probe tone with a much smaller frequency can result in the excitation of two ultranarrow sidepeaks with their frequency at (blue sidepeak) and (red sidepeak), respectively, as indicated by our experiments in Fig. 1c). These frequency relations are schematically summarized in Fig. 1d). From here, we can safely exclude the possibility of a sidepeak induced by cubic nonlinearity, where the sidepeak should locate at two times the probe frequency away from the drive frequency [32].
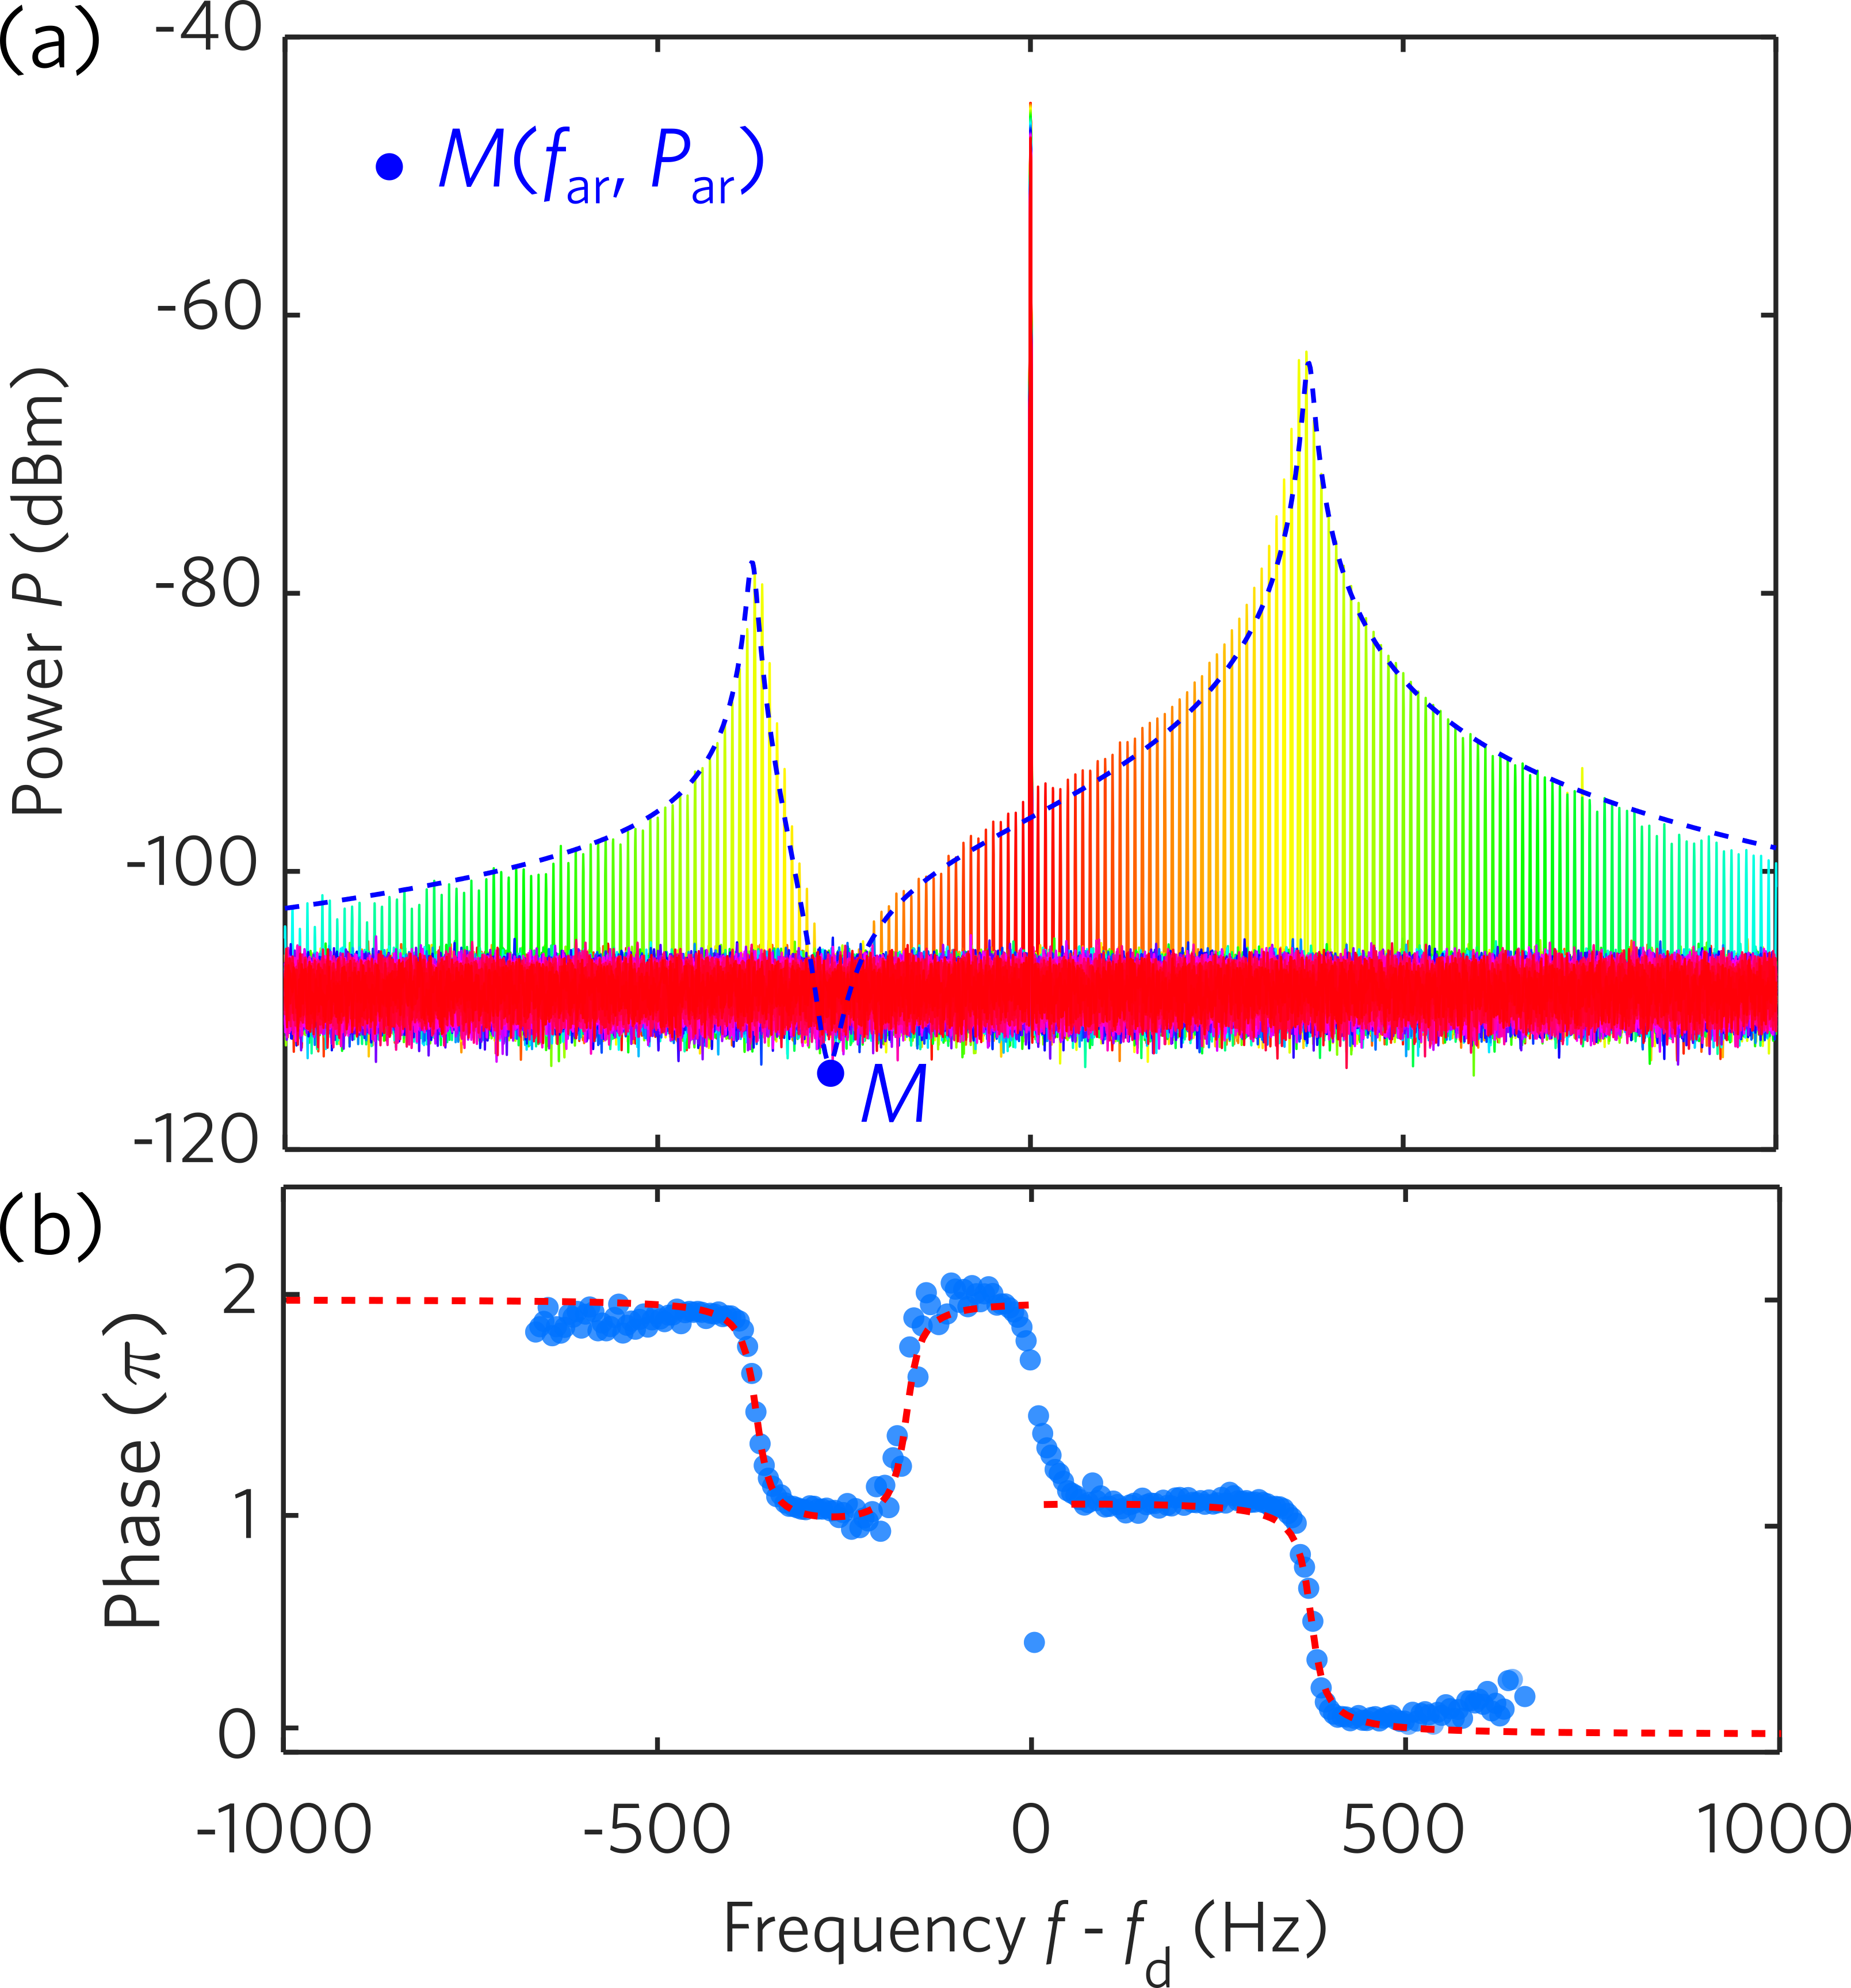
We then sweep the probe tone from 10 to 1000 Hz with a step size of 10 Hz under a fixed drive tone, and the sideband response is plotted in Fig. 2a). Their amplitude reaches a maximum at a peak frequency and starts to decrease if further increases. More importantly, there is a prominent silent region where the sideband signals are strongly suppressed below the noise floor. This region only appears in the red sideband but is absent in the blue sideband, leading to a drastically asymmetric lineshape. We will show below that there exists a minimum point in the silent region with its frequency and amplitude labeled by and , respectively. The sidebands also exhibit interesting phase response as depicted by the blue dots in Fig. 2b). There are phase shifts of when the ultranarrow sidepeaks are tuned through the drive tone , the two sideband peaks at , and the point at . All these features in both the amplitude and phase are reminiscent of a typical antiresonance response [33, 34]. More sideband spectra measured under different drive conditions are shown in the SM [28] and they all exhibit similar antiresonance response.

To model the observed sideband response, we use the following equation of motion:
| (1) |
where , and denote the driving force, the angular frequency of the flexural mode, the drive tone and probe tone, respectively. The probe tone also modulates the eigenfrequency with a strength of which can be characterized via a DC measurement with the method in the SM[28].
Using the standard rotating wave approximation, we can switch from the lab frame into the rotating frame with two new quadratures and . We can approximate the solution by expanding the quadrature into a main response and the perturbed response . The former describes the response at while the latter is responsible for the sidebands. We find that is governed by the well-known Duffing equation, and the equation of motion for is
| (2) |
with . Here, the first two terms on the right hand side of the equation describe the vibrations when the resonator deviates from the stable states and the last term represents a force induced by the parametric modulation. By solving this equation, we obtain the sideband amplitudes as well as their phases at different probe frequencies. Further details of the theoretical calculation can be found in the SM [28].
In Fig. 2 a) and b), we compare the theoretical calculations (dashed lines) with experiment data of the amplitude and phase of the sideband response, respectively and they both showed excellent agreements. We note that the phase shift across the drive frequency is not an intrinsic effect but due to a phase delay between the longitudinal and transverse waves in the piezo [35]. Further discussion can be found in the SM [28].
From here, we can clearly see that the silent region in experiment corresponds to an antiresonance dip in the sideband response. In fact, the emergence of a clear antiresonance dip requires , and in this weak damping limit
111
Note that here the weak damping limit adopt the requirement of squeezing parameter in the following discussion for simplification.
, we find that can be well approximated by
| (3) |
This relation suggests that the position of the point is susceptible to the vibration state of the driven mode, as is determined by both the drive and the detuning of the drive tone (see SM [28]).
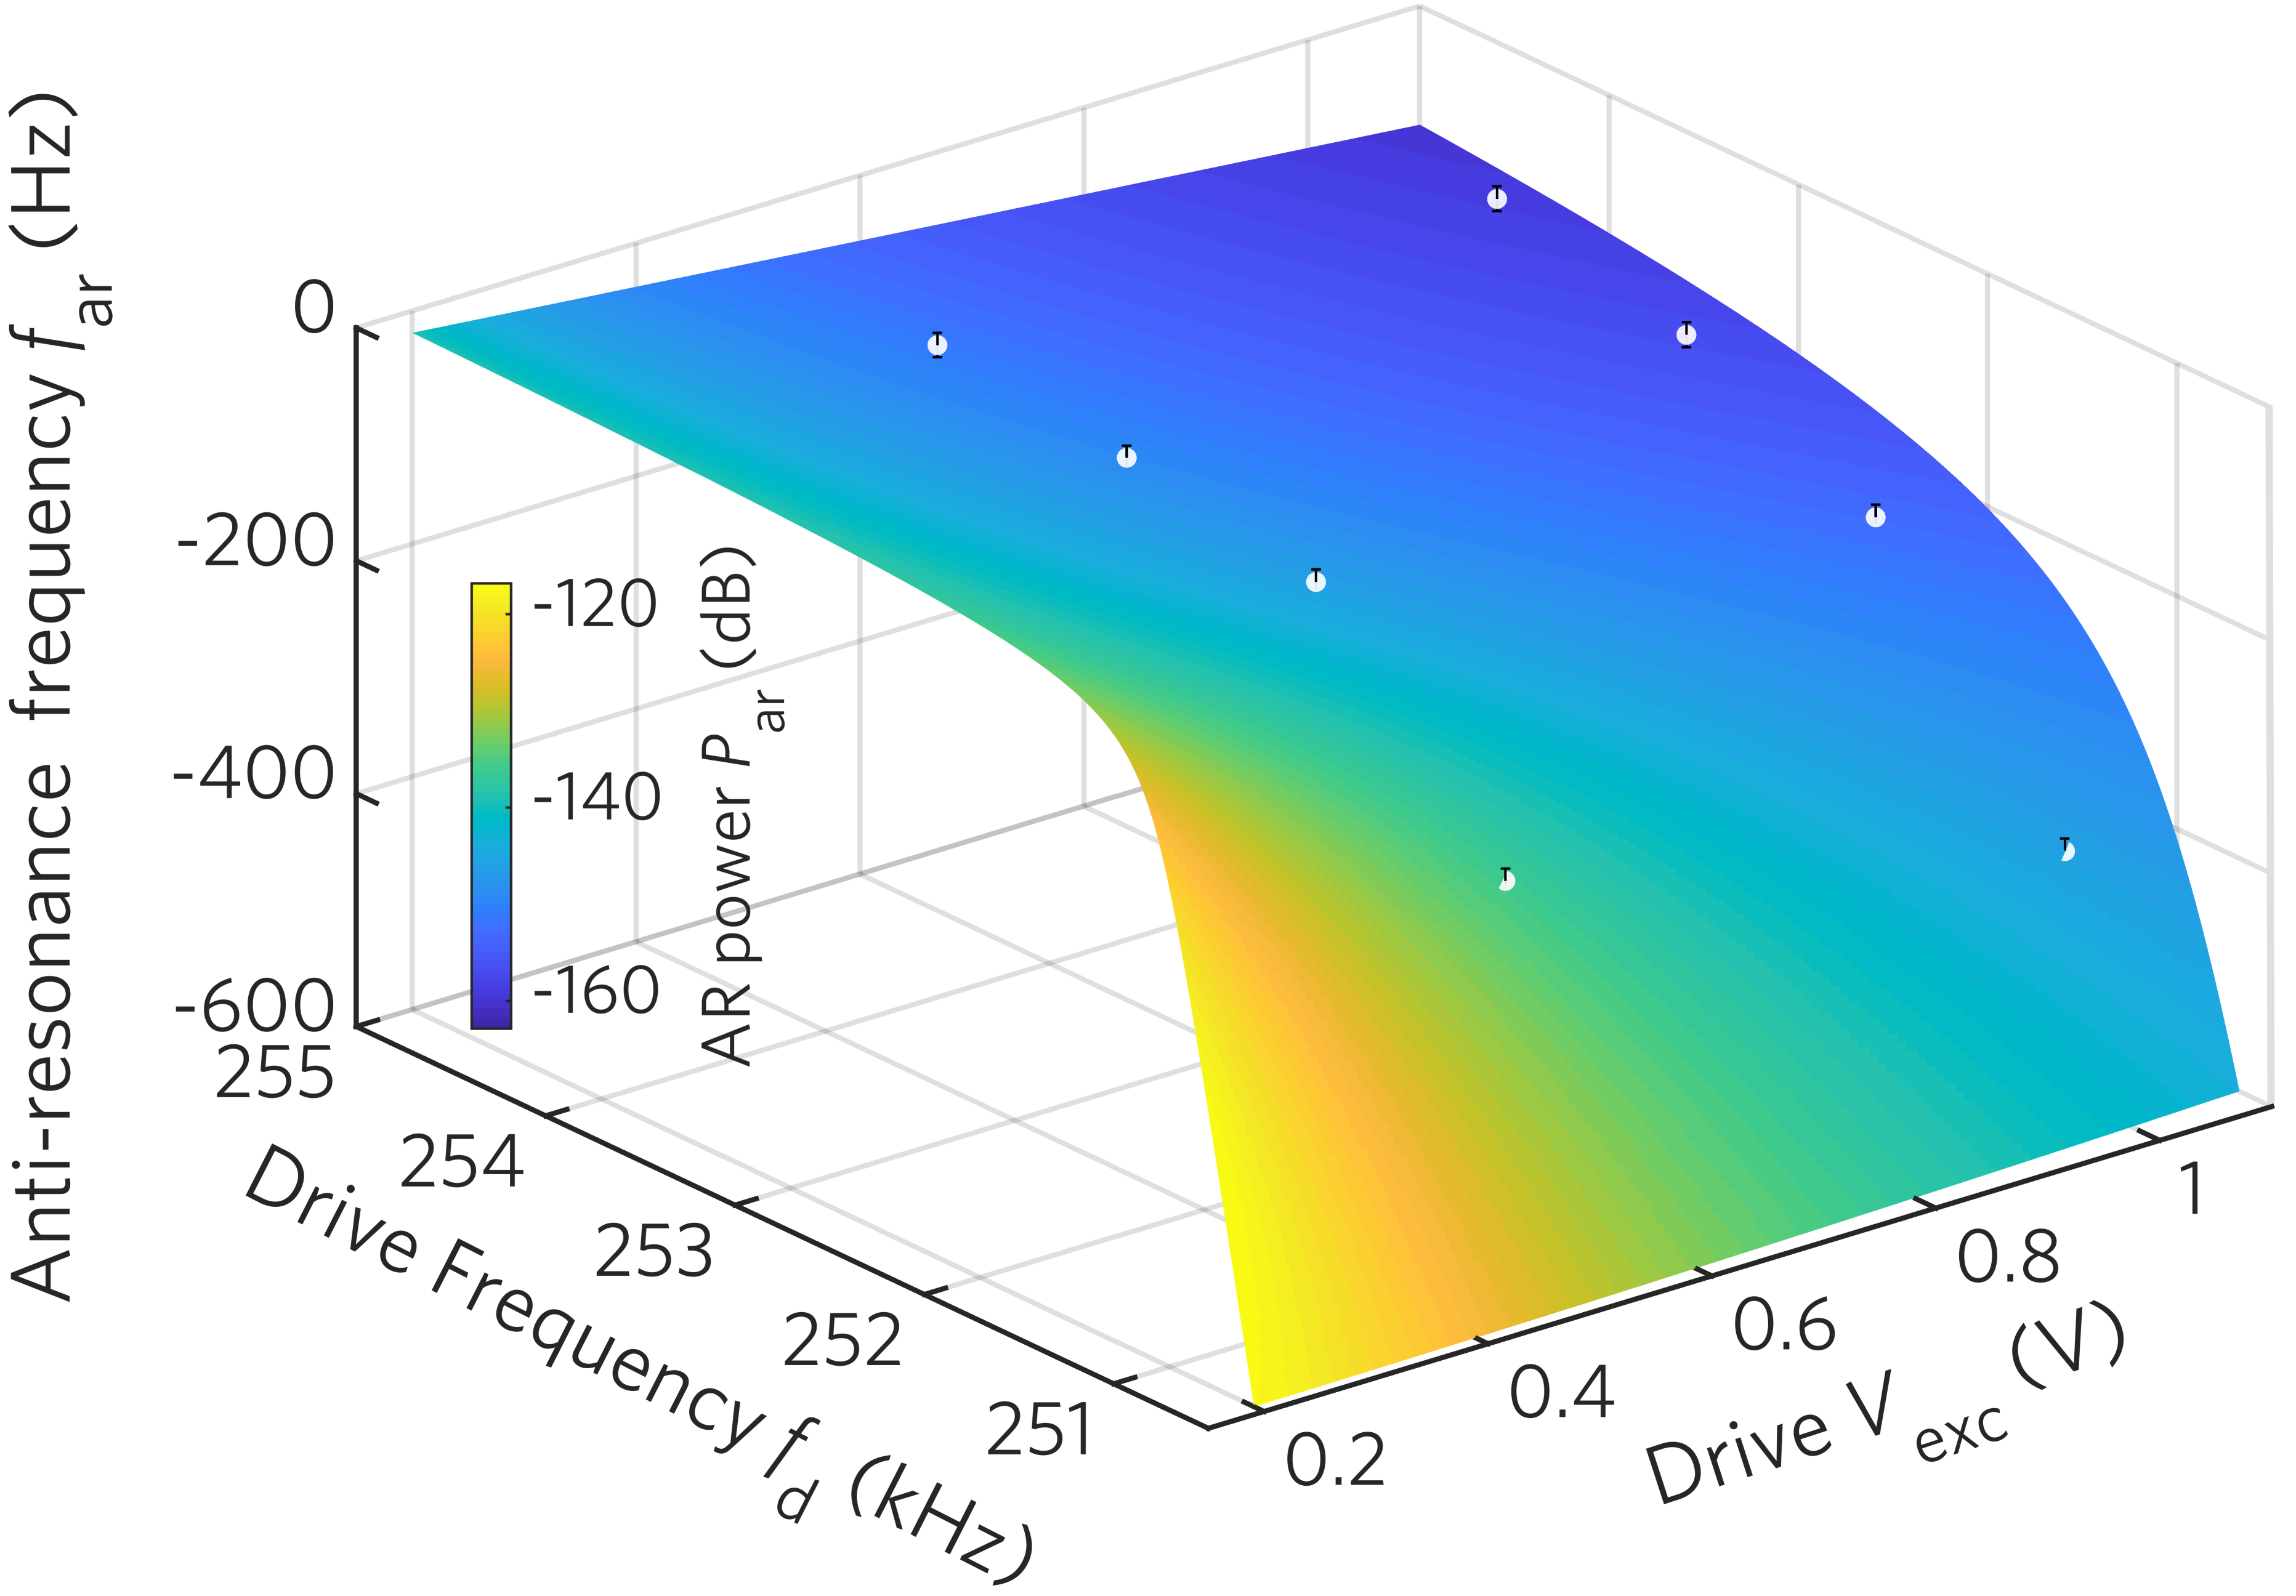
Figure 3 shows the calculated and as a function of power and detuning of the drive tone using the mode parameters given above. To compare with experiments, we can extract using the center frequency of the silent region, and the error bars correspond to the width of the silent region. These experimentally extracted positions (white sphere symbols) agree well with our theoretical calculation, as indicated in Fig. 3 and we can also make the following observations: (1) The highest power in the calculations here is still 10 dBm less than our experimental noise level, indicating an excellent cancellation effect of the sideband motion; (2) It is also evident here that has a lower bound given by the damping , as suggested from Eq. (3); (3) When the power of the drive tone is large or its detuning is small, is significantly away from the drive frequency.

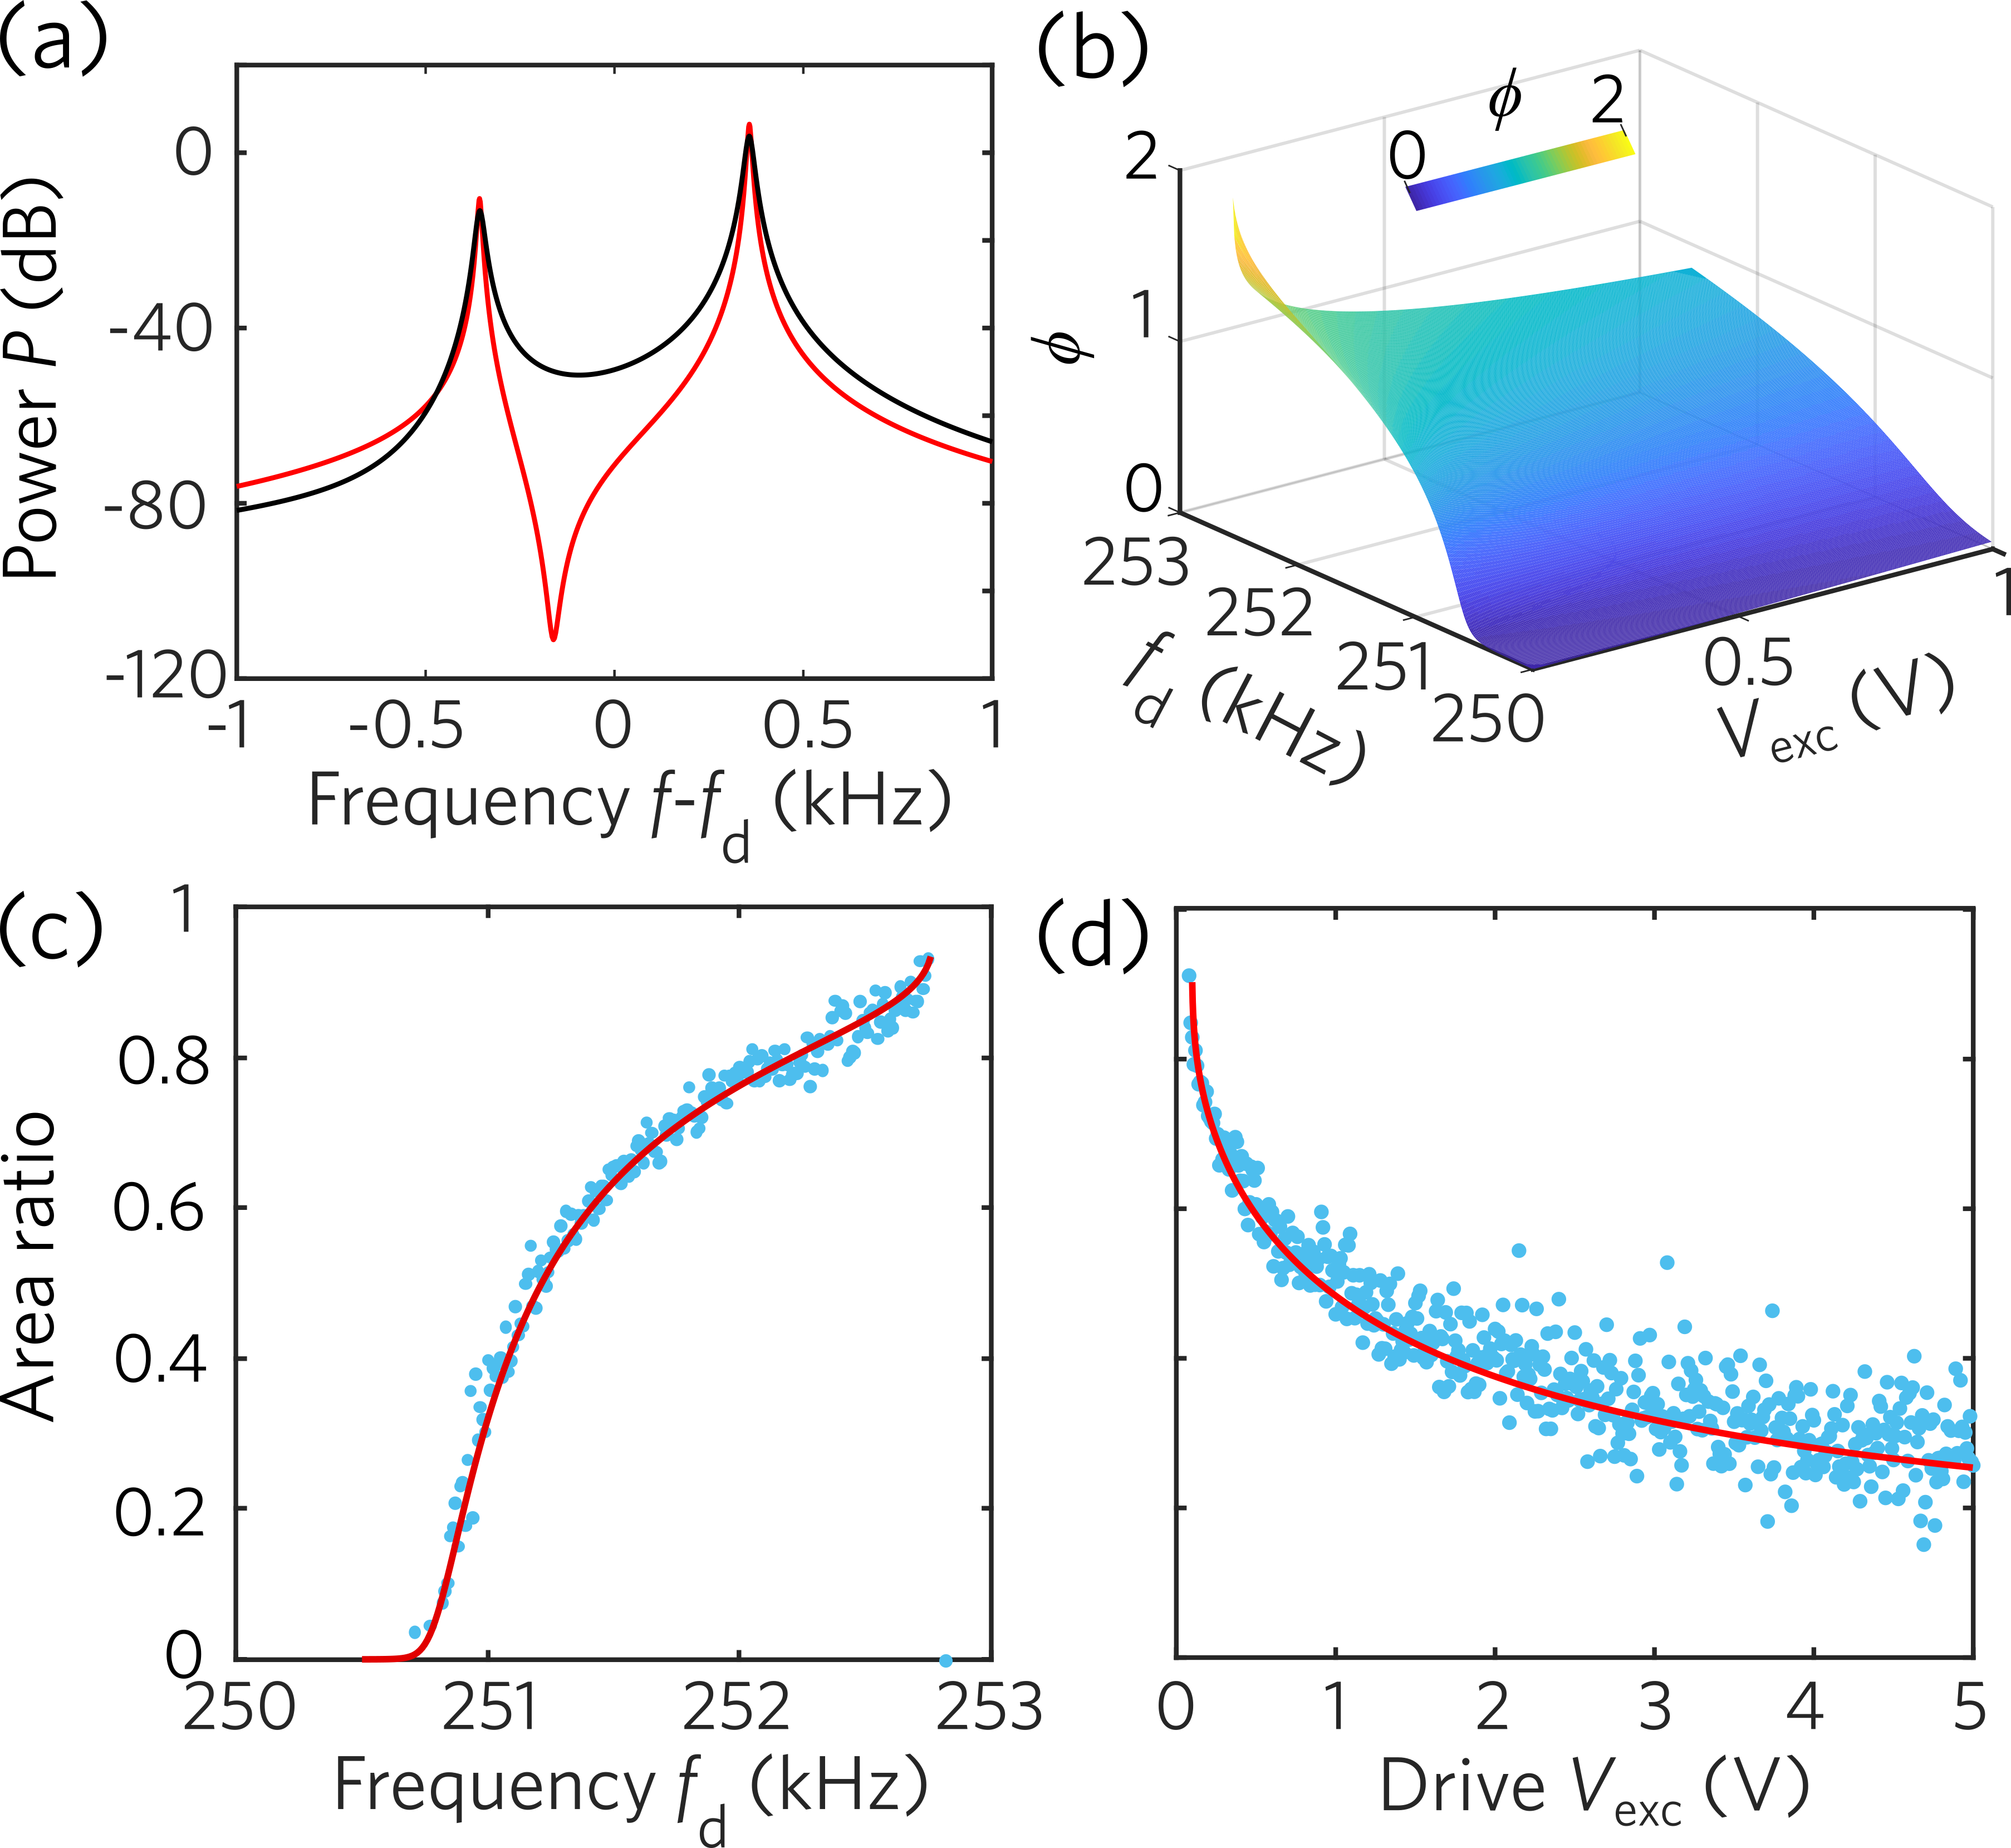
Further insights can be gained by comparing our results with the sidebands induced by thermal fluctuations [17]. In Fig. 4a), we compare a theoretical sideband spectrum of our case (red line) with that by thermal fluctuation (black line), both using the mode parameters from our experiments. Except for the antiresonance feature, the two spectra have very similar lineshapes, particularly regarding the peaks. Therefore, both types of sidebands reflect the vibration modes around the stable states of the driven mode (i.e., sideband). The peak positions of the sidebands correspond to the eigenfrequency of these vibration modes and can be determined by
| (4) |
where indicates the imaginary part of the argument. The emergence of an antiresonance in the sideband spectrum reveals the different character of the drive forces: a deterministic coherent single-frequency force that periodically changes the system parameters (appearing as combined amplitude-frequency modulation here, see SM [28]) destructively interfere with sideband while this effect is absent in the sidebands induced by broadband stochastic noise. Based on this observation, these sidebands can be delineated as “quasi-modes” characterized as eigenstates controlled by the vibration states of the mechanical system in the nonlinear regime.
Even though the sidebands induced by parametric modulation is a deterministic one, we can nevertheless relate it with the squeeezing effect of the fluctuations in the system. In the weak damping limit, there is a simple connection between the squeezing parameter that measures the transfer of fluctuations between a pair of conjugate variables and the antiresonance frequency in the spectrum:
| (5) |
We note that the above relation only applies when the system is in the upper branch. In principle, a similar expression for the lower branch can be derived. However, in experiment, it is difficult to identify an antiresonance structure in sideband spectrum due to its low amplitude. (see SM [28]).

To testify the above relations, we compare the squeezing parameters extracted from antiresonance frequency and those from the noise induced sideband area ratio. For a thermally-induced sideband, it has been shown that the integrated intensity ratio between the two sidebands () is solely determined by the squeezing parameter [17]. Due to a moderate in our device, the environmental thermal fluctuation itself does not induce detectable sidebands. Nevertheless, we can still access this quantity by introducing a broadband white noise of 300 kHz bandwidth and = 0.4 V [28] in addition to a drive tone of = 0.1 V and = 252.5 kHz. The integrated intensity can be obtained by fitting the sidebands around the peak frequency with two independent Lorentzian functions. Fig. 4c) and d) show the detuning and drive power dependence of the integrated intensity ratio in blue dots while the red lines in Fig. 4 c,d) denote the theoretical calculated values using , Eq. (3) and Eq. (5). We emphasize that there is no free parameter used in these calculations and the excellent agreement between the two methods indicates that is indeed a reliable indicator of the squeezing parameter.
Finally, we wish to comment on the robustness and simplicity of our method. In the previously reported method[17], it requires a separate fitting for every sideband spectrum to extract the squeezing parameter. In contrast, our antiresonance frequency method only relies on the knowledge of three parameters: , , and , all of which can either be directly extracted from the experiment or from a one-time fitting with the driven modes, making our method much easier and simpler. The antiresonance frequency also provides a direct way to compare the squeezing parameters under different conditions. Figure 4b) shows the calculated over the same parameter space as that in Fig. 3, and it is positively related to both the detuning and force. By comparing this result to the map in Fig. 3, we can deduce that the distance between and the dirve frequency is inversely related to : the smaller the distance, the larger .
In conclusion, we measured the sideband response of a free-standing Si-N membrane using a two-tone measurement in its nonlinear regime with the drive frequency much larger than that of the probe tone. We observed a typical antiresonance lineshapes in the sideband spectra. The amplitude and the phase of these sidebands can be well described by a Duffing equation with its eigenfrequency being parametrically modulated at the probe-tone frequency. The antiresonance results from a destructive interference between the probe tone and the resulting sideband. We further demonstrate that the antiresonance can be controlled by the vibrational state of the driven mode, thus providing a new possibility for future application of sidebands. For example, these sidebands can act as “quasi-modes” and couple with other vibrational modes for energy reshuffling in a nonlinear system. Finally, we provide a robust and simple method to
characterize the squeezing effect even for resonators with a moderate , evidenced by the excellent agreement between the squeezing parameter extracted with the antiresonance frequency and those with the sideband-area method.
The authors thank J. Boneberg for help with the experimental setups. We are indebted to J. S. Ochs, E. M. Weig, G. Rastelli, and W. Belzig for fruitful discussion and comments about the work. The authors gratefully acknowledge financial support from the China Scholarship Council, the A. v. Humboldt Foundation, the Deutsche Forschungsgemeinschaft (DFG, German Research Foundation) through SFB 1432 (Project-ID 425217212), and the Wisconsin Alumni Research Foundation (WARF) via the Accelerator Program.
F. Yang. and M. Fu contributed equally to this work.
References
- Tadokoro and Tanaka [2021] Y. Tadokoro and H. Tanaka, Highly sensitive implementation of logic gates with a nonlinear nanomechanical resonator, Phys. Rev. Appl. 15, 024058 (2021).
- Papariello et al. [2016] L. Papariello, O. Zilberberg, A. Eichler, and R. Chitra, Ultrasensitive hysteretic force sensing with parametric nonlinear oscillators, Phys. Rev. E 94, 022201 (2016).
- Li et al. [2021] L. Li, H. Liu, M. Shao, and C. Ma, A novel frequency stabilization approach for mass detection in nonlinear mechanically coupled resonant sensors, Micromachines 12, 178 (2021).
- Zhang et al. [2020] Y. Zhang, R. Kondo, B. Qiu, X. Liu, and K. Hirakawa, Giant enhancement in the thermal responsivity of microelectromechanical resonators by internal mode coupling, Phys. Rev. Appl. 14, 014019 (2020).
- Kim et al. [2016] H. Kim, J. Park, Z. Aksamija, M. Arbulu, and R. Blick, Ultrananocrystalline diamond membranes for detection of high-mass proteins, Phys. Rev. Appl. 6, 064031 (2016).
- Park et al. [2013] J. Park, Z. Aksamija, H.-C. Shin, H. Kim, and R. H. Blick, Phonon-assisted field emission in silicon nanomembranes for time-of-flight mass spectrometry of proteins, Nano Lett. 13, 2698 (2013).
- Wen et al. [2020] Y. Wen, N. Ares, F. Schupp, T. Pei, G. Briggs, and E. Laird, A coherent nanomechanical oscillator driven by single-electron tunnelling, Nat. phys. 16, 75 (2020).
- Cleland and Roukes [2002] A. Cleland and M. Roukes, Noise processes in nanomechanical resonators, J. Appl. Phys. 92, 2758 (2002).
- Sansa et al. [2016] M. Sansa, E. Sage, E. C. Bullard, M. Gély, T. Alava, E. Colinet, A. K. Naik, L. G. Villanueva, L. Duraffourg, M. L. Roukes, et al., Frequency fluctuations in silicon nanoresonators, Nat. Nanotechnol. 11, 552 (2016).
- Yang et al. [2011] Y. Yang, C. Callegari, X. Feng, and M. Roukes, Surface adsorbate fluctuations and noise in nanoelectromechanical systems, Nano Lett. 11, 1753 (2011).
- Atalaya et al. [2011] J. Atalaya, A. Isacsson, and M. Dykman, Diffusion-induced dephasing in nanomechanical resonators, Phys. Rev. B 83, 045419 (2011).
- Rugar and Grütter [1991] D. Rugar and P. Grütter, Mechanical parametric amplification and thermomechanical noise 5 squeezing, Phys. Rev. Lett. 67, 699 (1991).
- Wollman et al. [2015] E. E. Wollman, C. Lei, A. Weinstein, J. Suh, A. Kronwald, F. Marquardt, A. A. Clerk, and K. Schwab, Quantum squeezing of motion in a mechanical resonator, Science 349, 952 (2015).
- Lecocq et al. [2015] F. Lecocq, J. B. Clark, R. W. Simmonds, J. Aumentado, and J. D. Teufel, Quantum nondemolition measurement of a nonclassical state of a massive object, Phys. Rev. X 5, 041037 (2015).
- Pirkkalainen et al. [2015] J.-M. Pirkkalainen, E. Damskägg, M. Brandt, F. Massel, and M. A. Sillanpää, Squeezing of quantum noise of motion in a micromechanical resonator, Phys. Rev. Lett. 115, 243601 (2015).
- Dykman [2012] M. Dykman, Fluctuating nonlinear oscillators: from nanomechanics to quantum superconducting circuits (Oxford University Press, 2012).
- Huber et al. [2020] J. S. Huber, G. Rastelli, M. J. Seitner, J. Kölbl, W. Belzig, M. I. Dykman, and E. M. Weig, Spectral evidence of squeezing of a weakly damped driven nanomechanical mode, Phys. Rev. X 10, 021066 (2020).
- Ochs et al. [2021] J. Ochs, M. Seitner, M. Dykman, and E. Weig, Amplification and spectral evidence of squeezing in the response of a strongly driven nanoresonator to a probe field, Phys. Rev. A 103, 013506 (2021).
- Heugel et al. [2021] T. L. Heugel, O. Zilberberg, C. Marty, R. Chitra, and A. Eichler, Ghost in the ising machine, arXiv preprint arXiv:2103.02625 (2021).
- Houri et al. [2019] S. Houri, D. Hatanaka, M. Asano, R. Ohta, and H. Yamaguchi, Limit cycles and bifurcations in a nonlinear mems resonator with a 1: 3 internal resonance, Appl. Phys. Lett. 114, 103103 (2019).
- Ganesan et al. [2017] A. Ganesan, C. Do, and A. Seshia, Phononic frequency comb via intrinsic three-wave mixing, Phys. Rev. Lett. 118, 033903 (2017).
- Czaplewski et al. [2018] D. A. Czaplewski, C. Chen, D. Lopez, O. Shoshani, A. M. Eriksson, S. Strachan, and S. W. Shaw, Bifurcation generated mechanical frequency comb, Phys. Rev. Lett. 121, 244302 (2018).
- Dykman et al. [1994] M. Dykman, D. Luchinsky, R. Mannella, P. V. McClintock, N. Stein, and N. Stocks, Supernarrow spectral peaks and high-frequency stochastic resonance in systems with coexisting periodic attractors, Phys. Rev. E 49, 1198 (1994).
- Yang et al. [2019] F. Yang, F. Rochau, J. S. Huber, A. Brieussel, G. Rastelli, E. M. Weig, and E. Scheer, Spatial modulation of nonlinear flexural vibrations of membrane resonators, Phys. Rev. Lett. 122, 154301 (2019).
- Yang et al. [2021] F. Yang, F. Hellbach, F. Rochau, W. Belzig, E. M. Weig, G. Rastelli, and E. Scheer, Persistent response in an ultrastrongly driven mechanical membrane resonator, Phys. Rev. Lett. 127, 014304 (2021).
- Keşkekler et al. [2021] A. Keşkekler, O. Shoshani, M. Lee, H. S. van der Zant, P. G. Steeneken, and F. Alijani, Tuning nonlinear damping in graphene nanoresonators by parametric–direct internal resonance, Nat. Commun. 12, 1 (2021).
- Houri et al. [2020] S. Houri, M. Asano, H. Yamaguchi, N. Yoshimura, Y. Koike, and L. Minati, Generic rotating-frame-based approach to chaos generation in nonlinear micro-and nanoelectromechanical system resonators, Phys. Rev. Lett. 125, 174301 (2020).
- [28] Supplemental Material for details of the sample preparation and the measurement methods, calibration and characterization measurements of the membrane under study, examples of noise-induced sidebands in different nonlinear vibrational state, direct optically measured amplitude modulation, detailed description of the theoretical model and the theoretically calculated detuning and drive-dependent sidebands.
- Yang et al. [2017] F. Yang, R. Waitz, and E. Scheer, Quantitative determination of the mechanical properties of nanomembrane resonators by vibrometry in continuous light, (2017), arXiv:1704.05328 [cond-mat.mes-hall] .
- Waitz et al. [2012] R. Waitz, S. Nößner, M. Hertkorn, O. Schecker, and E. Scheer, Mode shape and dispersion relation of bending waves in thin silicon membranes, Phys. Rev. B 85, 035324 (2012).
- Waitz et al. [2015] R. Waitz, C. Lutz, S. Nößner, M. Hertkorn, and E. Scheer, Spatially resolved measurement of the stress tensor in thin membranes using bending waves, Phys. Rev. Applied 3, 044002 (2015).
- Reichenbach et al. [2005] R. B. Reichenbach, M. Zalalutdinov, K. L. Aubin, R. Rand, B. H. Houston, J. M. Parpia, and H. G. Craighead, Third-order intermodulation in a micromechanical thermal mixer, J. Microelectromech. Syst. 14, 1244 (2005).
- Sames et al. [2014] C. Sames, H. Chibani, C. Hamsen, P. A. Altin, T. Wilk, and G. Rempe, Antiresonance phase shift in strongly coupled cavity qed, Phys. Rev. Lett. 112, 043601 (2014).
- Wahl et al. [1999] F. Wahl, G. Schmidt, and L. Forrai, On the significance of antiresonance frequencies in experimental structural analysis, Journal of Sound and Vibration 219, 379 (1999).
- Cleland [2013] A. N. Cleland, Foundations of nanomechanics: from solid-state theory to device applications (Springer Science & Business Media, 2013).
- Note [1] Note that here the weak damping limit adopt the requirement of squeezing parameter in the following discussion for simplification.