New magnetic chemically peculiar stars and candidates in the ATLAS First Catalog of Variable Stars
Abstract
The number of known variable stars has increased by several magnitudes over the last decade, and automated classification routines are becoming increasingly important to cope with this development. Here we show that the ’upside-down CBH variables’, which were proposed as a potentially new class of variable stars by Heinze et al. (2018) in the ATLAS First Catalogue of Variable Stars, are, at least to a high percentage, made up of Canum Venaticorum (ACV) variables – that is, photometrically variable magnetic chemically peculiar (CP2/He-peculiar) stars – with distinct double-wave light curves. Using suitable selection criteria, we identified 264 candidate ACV variables in the ATLAS variable star catalogue. 62 of these objects were spectroscopically confirmed with spectra from the Large Sky Area Multi-Object Fiber Spectroscopic Telescope (all new discoveries except for nine stars) and classified on the MK system. The other 202 stars are here presented as ACV star candidates that require spectroscopic confirmation. The vast majority of our sample of stars are main-sequence objects. Derived masses range from 1.4 to 5 , with half our sample stars being situated in the range from 2 to 2.4 , in good agreement with the spectral classifications. Most stars belong to the thin or thick disk; four objects, however, classify as members of the halo population. With a peak magnitude distribution at around 14th magnitude, the here presented stars are situated at the faint end of the known Galactic mCP star population. Our study highlights the need to consider rare variability classes, like ACV variables, in automated classification routines.
keywords:
stars: chemically peculiar – stars: variables: general1 Introduction
Over the last decades, rapid advances in technology and the resulting increasing number of large-scale digital sky surveys have helped to propel astronomy into a new data-rich era (Djorgovski et al., 2013). This development necessitated the invention of novel ways to deal with the amount of incoming data produced by the petabyte-scale sky surveys, and algorithmic advances in the automated handling of massive and complex data sets have become of great importance.
The field of variable star research is no exception and has greatly benefited from the increasing amount of available photometric time-series data, which are often made available in real time. The number of known variable stars has increased by several magnitudes over the last decade alone, with recent variable star catalogues containing hundreds of thousands of entries (e.g. Heinze et al. 2018; Chen et al. 2020) and the International Variable Star Index (VSX; Watson 2006) of the American Association of Variable Star Observers (AAVSO), the most coherent and up-to-date database of variable stars, cataloging more than 2,100,000 objects at the time of this writing (June 2021). Automated classification routines are of essential importance to sort the vast number of newly discovered variable stars into astrophysically meaningful classes. However, with the development of new and improved algorithms and classification networks, new (meta)classes are constantly developed, and it is not easy to keep track with this steadily growing body of nomenclature.
In agreement with the general trend, an increasingly large number of photometrically variable chemically peculiar (CP) stars have been identified during the past decades (e.g. Paunzen & Maitzen, 1998; Wraight et al., 2012; Bernhard et al., 2015a, b; Hümmerich et al., 2016; Bowman et al., 2018; Hümmerich et al., 2018; David-Uraz et al., 2019; Sikora et al., 2019). CP stars are upper main-sequence objects, which are generally found between spectral types early B to early F and characterised by peculiar surface abundances. The observed peculiarities are thought to have their origin in the interplay between radiative levitation and gravitational settling (atomic diffusion) in the calm outer layers of slowly rotating stars (e.g. Michaud 1970; Richer et al. 2000). Several types of CP stars exist, such as the metallic-line or Am/CP1 stars, the magnetic Ap/CP2 stars, the HgMn/CP3 stars, and the He-peculiar stars, which are composed of the CP4/He-weak stars and the He-rich stars (Preston, 1974). Relevant to the present investigation are the CP2 and the He-pec stars, which generally exhibit strong and globally organised magnetic fields and atmospheres selectively enriched in elements such as Si, Cr, Sr, or Eu. These objects are frequently grouped together under the term of magnetic chemically peculiar (mCP) stars, which, for convenience, we will adhere to in the present study.
Magnetic CP stars usually present a non-uniform surface distribution of chemical elements (chemical spots or belts). Flux is redistributed in these structures via line and continuum blanketing (e.g. Lanz et al. 1996; Shulyak et al. 2010), which results in strictly periodic light and spectral variations with the rotation period. After their bright prototype, photometrically variable mCP stars are also referred to as Canum Venaticorum (ACV) variables. Observed amplitudes of the photometric variability are generally of the order of several hundredth of a magnitude in the optical region, occasionally reaching up to about 0.2 mag (). In the ’zoo’ of variable stars, ACV variables constitute a rather obscure class and, in automated classification systems, are often combined with other rotational variables under generic types, such as ’ROT’ (i.e. spotted stars not classified into a particular class), or get largely ignored.
Here we show that the ’upside-down CBH variables’111For convenience, in the text, these objects are hereafter referred to as ud-CBH variables., identified through the analysis of data from the Asteroid Terrestrial-impact Last Alert System (ATLAS) and proposed by Heinze et al. (2018) in the ATLAS variable star Data Release One (ATLAS DR1) catalogue as a potentially new class of variable stars, are, at least to a high percentage, made up of ACV variables with distinct double-wave light curves. Using suitable selection criteria, we identified 264 candidate ACV variables in the ATLAS DR1 catalogue. 62 of these stars could be confirmed as mCP stars (53 new discoveries) using spectra from the Large Sky Area Multi-Object Fiber Spectroscopic Telescope (LAMOST) and were classified on the MK system.
Data sources, motivation and the process of target selection are detailed in Section 2. Spectral classifications are described and presented in Section 3. The magnitude, period and space distributions of our sample stars are investigated in Section 4, while Section 5 explores the ages and masses of our sample stars. We conclude in Section 6.
2 Data sources, motivation and target selection
2.1 The Asteroid Terrestrial-impact Last Alert System (ATLAS)
The Asteroid Terrestrial-impact Last Alert System (ATLAS) is a NASA-funded sky survey developed by the University of Hawaii with the main aim of discovering potentially hazardous near-Earth asteroids (NEAs). It currently consists of two telescopes, which are situated on Haleakala and Mauna Loa and equipped with f/2.0 0.5-m DFM custom Wright Schmidt telescopes and STA-1600 10.5x10.5k CCD detectors. The telescopes command a field of view with a diameter of 74, and observations are procured through two broadband filters: the cyan filter (’’; 420650 nm), which is employed during the two weeks surrounding the new Moon, and the orange filter (’’; 560820 nm), which is used in lunar bright time. Both filters are linked via colour transformations to the Pan-STARRS , , and bands. More information on the ATLAS sky survey is found in Tonry et al. (2018).
2.2 The Large Sky Area Multi-Object Fiber Spectroscopic Telescope (LAMOST)
The LAMOST telescope (Zhao et al., 2012; Cui et al., 2012), also called the Guo Shou Jing222Guo Shou Jing (12311316) was a Chinese astronomer, hydraulic engineer, mathematician, and politician of the Yuan Dynasty. Telescope, is a reflecting Schmidt telescope located at the Xinglong Observatory in Beijing, China. It boasts an effective aperture of 3.64.9 m and a field of view of 5. Thanks to its unique design, LAMOST is able to take 4000 spectra in a single exposure with spectral resolution R 1800, limiting magnitude r 19 mag and wavelength coverage from 3700 Å to 9000 Å. LAMOST is therefore particularly suited to survey large portions of the sky and is dedicated to a spectral survey of the entire available northern sky. LAMOST data products are released to the public in consecutive data releases and can be accessed via the LAMOST spectral archive.333http://www.lamost.org With about 10 million stellar spectra contained in data release (DR) 6, the LAMOST archive constitutes a real treasure trove for researchers. The present study uses spectra from LAMOST DR4 (Luo et al., 2018).
2.3 ATLAS variable star Data Release One (ATLAS DR1) and the ’upside-down CBH variables’
Using data from the first two years of operation of the Haleakala telescope (observations up to the end of June 2017), Heinze et al. (2018) published the ATLAS DR1 catalogue. Analysing observations for approximately 142 million stars between declinations of about 30∘ +60∘ in the magnitude range of about 11 < < 19, they produced a major catalogue containing 430,000 confirmed variable stars (among which are 300,000 new discoveries) and 4.7 million candidate variable stars. The observations consisted of four to six 30-s exposures of each field per night; the provided data sets boast a median time span of about 620 d, the median number of observations is = 208 (Heinze et al., 2018). Subsequent data releases are planned, which are expected to greatly enhance the number of identified variables and available measurements.

Heinze et al. (2018) calculated an extensive set of 169 variability features for each object, 70 of which were employed as input for sorting the stars into broad, astrophysically meaningful variability classes based on light curve morphology, such as CBF = ’Close binary, full period’; CBH = ’Close binary, half period’; MIRA = ’High-amplitude, long-period red variable’; PULSE = ’Pulsating variable’ etc. A complete overview of the variability classes is provided in Table 2 of Heinze et al. (2018).
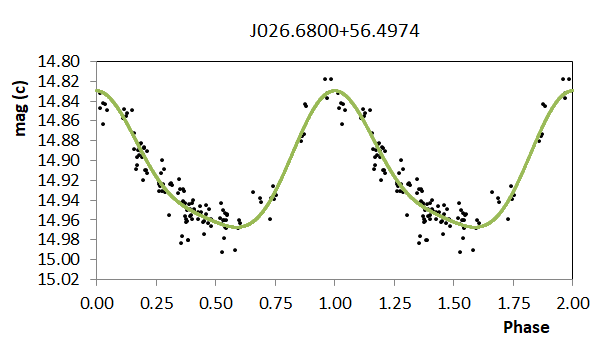
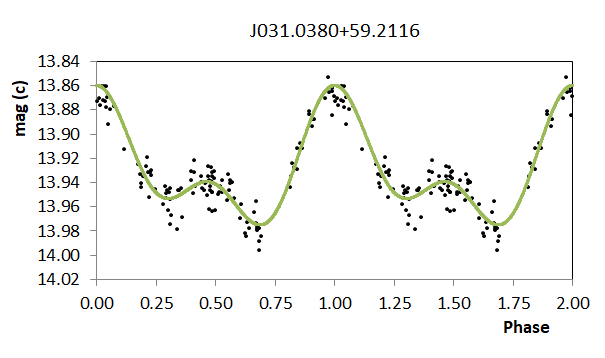
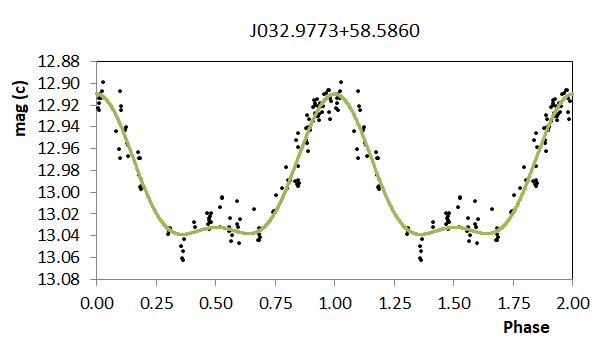
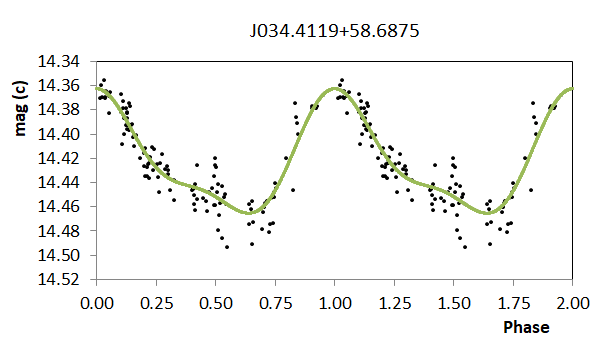
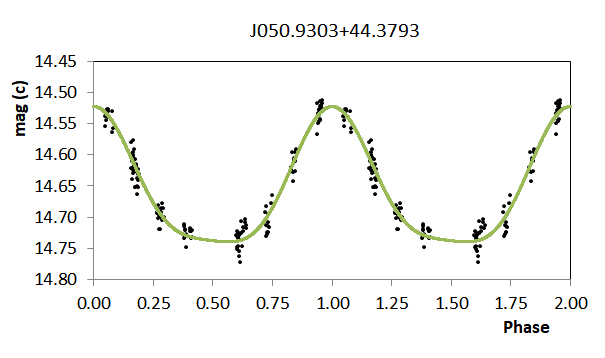
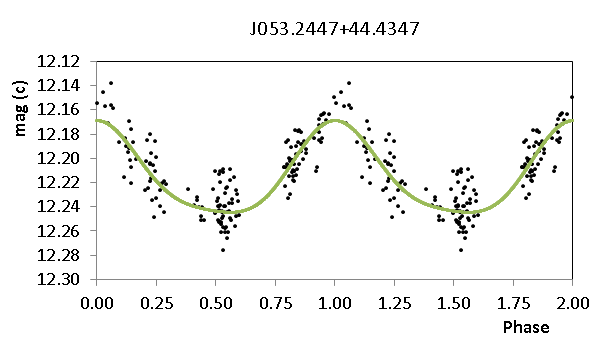
In the context of the present study, the class of CBH = ’Close binary, half period’ is of importance, which consists of close eclipsing binaries for which a period equal to half the true orbital period was selected by the employed period search algorithm. In analogy to this group of objects, and in want of a better expression, Heinze et al. (2018) coined the term ud-CBH variables to refer to a particular set of light curves that look almost exactly like the inverted light curves of CBH stars – that is, instead of the minima (eclipses) in the light curves of CBH binaries, they show narrow symmetrical maxima (cf. Figure 1, upper panels). About 70 such objects were manually identified, most of which were sorted into the PULSE class by the classification algorithm. However, the authors note that many more can probably be found in the final catalogue.
Heinze et al. (2018) briefly consider the astrophysical nature of the ud-CBH variables, which occupy a well-defined region in period-amplitude space (amplitudes of up to 0.2 mag, period distribution peaks around 2 d; cf. Figure 23 of Heinze et al. 2018). In particular, they rule out contact binaries (GCVS-type EW; Samus et al. 2017) and binary stars with strong reflection effects (GCVS-type R) on the grounds of light curve morphology and argue against ’ordinary’ rotating variables with classical starspots and binary systems with an accreting compact object because of the consistency of the observed light curves. In summary, the authors were unable to properly classify these stars and present them as a potentially new type of (pulsating?) variables, whose astrophysical nature is unclear.
2.4 Motivation and target selection
The present study was conceived after we noticed the strong similarity of the light curves of the ud-CBH variables illustrated in Heinze et al. 2018 (their Figure 23) to the light curves of a certain subset of ACV variables. Unlike stars with classical starspots, these spotted rotators show simple and remarkably consistent light curves that remain stable in shape and amplitude over decades and more (e.g. Hümmerich et al., 2018). As has been expanded upon in Section 1, the light variations of ACV variables are due to the presence of chemical spots. They generally show simple light curves that can be well described by a sine wave and its first harmonic (e.g. North 1984; Mathys & Manfroid 1985; Bernhard et al. 2015a). Depending on the inclination of the rotational axis and the number of spots that come into view during the rotation cycle, most ACVs show either single-wave or double-wave light curves (e.g. Maitzen, 1980; Jagelka et al., 2019). In the case of two dominant spots of different sizes or photometric properties on opposing hemispheres of the star, a double-wave light curve with maxima of different heights is to be expected, in agreement with the light curves of the ud-CBH variables. This variability pattern is fairly unique among early-type stars and, according to our experience (Bernhard et al., 2015a, b; Hümmerich et al., 2016), a tell-tale sign of ACV variables. According to the study of Jagelka et al. (2019), roughly one third of ACV variables are expected to show double-wave light curves, with half of these stars exhibiting maxima of different height.

Furthermore, the characteristics of the ud-CBH variables given in Heinze et al. (2018) – low-amplitude (0.2 mag) variability; periods in the range of about 1 < < 5, with a peak around 2 d – are in agreement with the majority of ACV variables, which mostly exhibit rotational periods in the above mentioned period range, with a well-known peak around 2 d (e.g. Renson & Manfroid, 2009; Bernhard et al., 2015b). A comparison of the light curves of two ud-CBH variables from the list of Heinze et al. (2018) to the light curves of two double-waved ACV variables taken from Bernhard et al. (2020) is provided in Figure 1. While the amplitude of the light variations appears reduced in the filterless data from the Multi-site All-Sky CAmeRA (MASCARA; Snellen et al. 2012; Talens et al. 2017), the general variability pattern is the same. As an initial test of our hypothesis, we investigated the LAMOST DR4 spectra of several ud-CBH stars, which confirmed our suspicion that these objects are indeed mCP (mostly CP2) stars.
For the final target selection process, several considerations had to be taken into account. As ’ud-CBH stars’ is not one of the final adopted variability classes, these objects cannot be simply queried via the interface to the ATLAS DR1 catalogue.444More information on how to query the ALTAS DR1 catalogue is available at https://archive.stsci.edu/prepds/atlas-var/. Heinze et al. (2018) comment that most ud-CBH variables were sorted into the category PULSE by the classification algorithm. Apart from that, we consider the CBH and SINE groups the most promising targets for discovering ACV variables among the remaining variability classes. The SINE group (’Pure sine was fit with small residuals’) was chosen because most ACV stars (roughly 50 % of the sample of Jagelka et al. 2019) show symmetric single-wave light curves that can be well fitted by a sine wave. All other variability groups were ruled out as primary targets on grounds of the covered period and amplitude ranges, the occurrence of multiple periods, irregular variability, or, as ACV variables show remarkably stable light curves, the indication of large residuals to the sine fit (class NSINE = ’Noisy sine: pure sine was fit, but residuals are large or nonrandom’).
On grounds of these considerations, and after some initial testing regarding the feasibility of our intended approach, we decided to investigate objects from the PULSE, CBH, and SINE groups with the following requirements: (i) 0.5 < < 10, (ii) peak-to-peak variability amplitude in the band of amp() 0.3 mag, and (iii) phase offset of the first two Fourier terms between 60∘ and 110∘. The imposed cuts form a compromise between an effective identification of mCP stars and the need to keep the sample down to a manageable size. The period (i) and phase offset (iii) requirements were enforced to exclude Scuti (GCVS-type DSCT) stars or other short period pulsators and W UMa variables. Item (iii) was chosen according to the results of Heinze et al. (2018), who find that most ud-CBH stars have phase offsets near 90∘ (cf. in particular their Figure 23). We note that while there exist mCP stars with rotation periods in excess of the chosen limit, their incidence drops significantly towards longer rotational periods (e.g. Renson & Manfroid 2009); more importantly, the number of suitable light curves in the ATLAS DR1 catalogue diminishes rapidly at > 10 d. The peak-to-peak variability cut-off (ii) was set deliberately high in order not to per se exclude any high-amplitude ACV variables. Although most ACV stars show amplitudes smaller than 0.2 mag (), we noticed several stars with amplitudes approaching this limit in the band (cf. Figure 1).
Frequency spectra of all objects selected via these criteria were calculated using Period04 (Lenz & Breger, 2005). Light curves and frequency spectra were then visually inspected. Obviously multiperiodic objects, such as slowly pulsating B (GCVS-type SPB) stars and Doradus (GCVS-type GDOR) variables, were discarded; mono-periodic objects (that is, objects with frequency spectra indicative of a single significant frequency or a single significant frequency plus corresponding harmonics) with stable light curves typical of ACV variables were chosen for further consideration.
Although spot configurations in late-type stars are much more unstable, we expect contamination by late-type rotational variables such as BY Draconis (GCVS-type BY) or RS Canum Venaticorum (GCVS-type RS) stars that, at least in the investigated time-span, did not show significant changes in spot sizes and distribution and therefore exhibited appreciably stable light curves. For this reason, as an initial check, the remaining objects were plotted in a near-/mid-infrared colour-colour diagram (Figure 2) in order to identify red stars. To this end, we employed photometry from the 2MASS (Skrutskie et al., 2006) and WISE (Wright et al., 2010) catalogues. Considering the faintness of the investigated objects and the unknown amount of reddening in the line-of-sight, this will only have a limited predictive value as regards the intrinsic colours of the stars. However, there is an obvious red tail of objects with () 0.6 mag, which likely corresponds to late-type rotational variables. For several of these objects, LAMOST DR4 spectra are available, which indeed confirmed this assumption. Three exemplary spectra are shown in Figure 3. As expected, all objects show signs of increased chromospheric activity, which is typical of late-type rotational variables. We therefore felt justified in excluding objects with () 0.6 mag from further consideration.
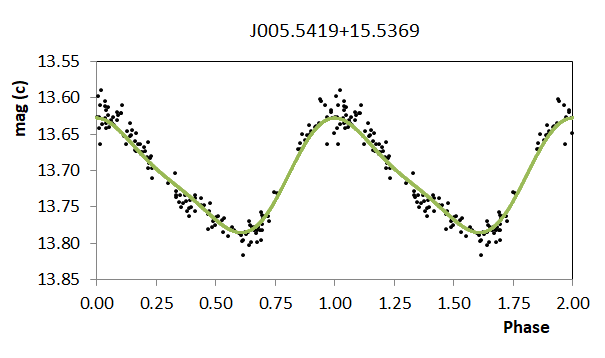
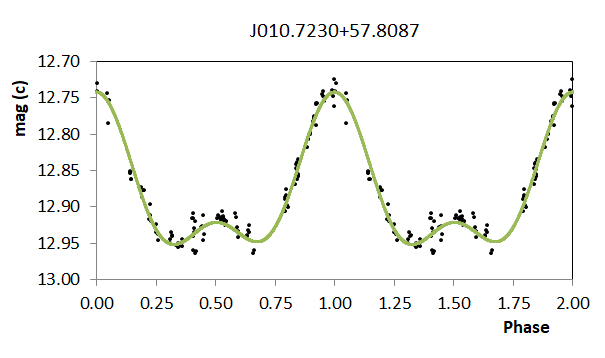
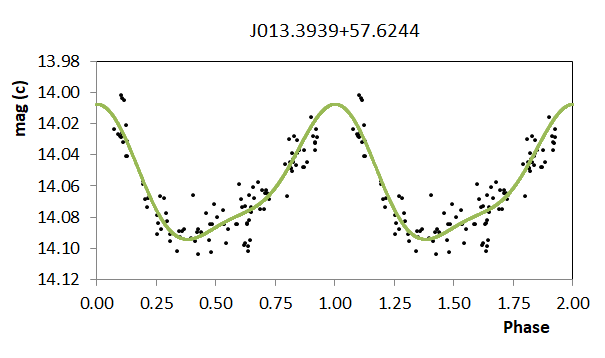
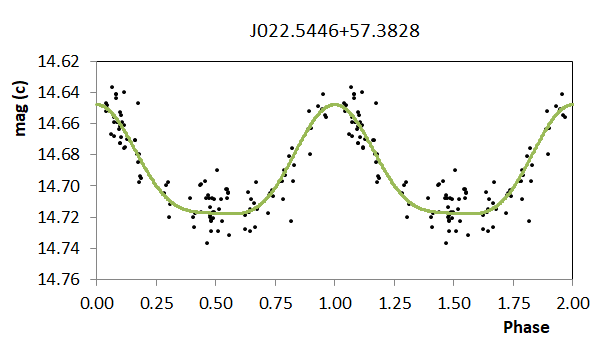
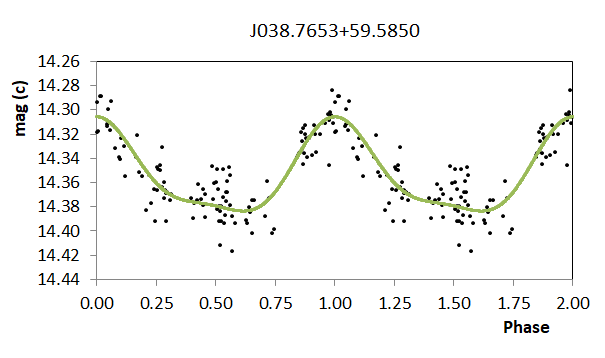
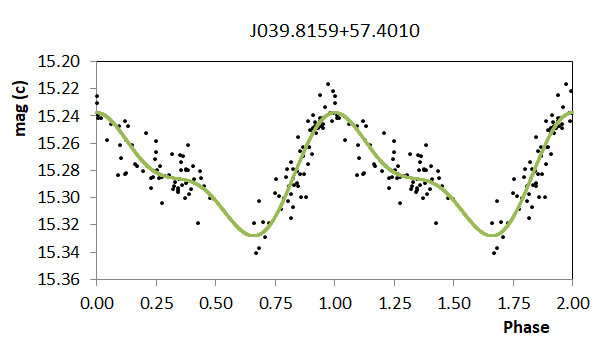
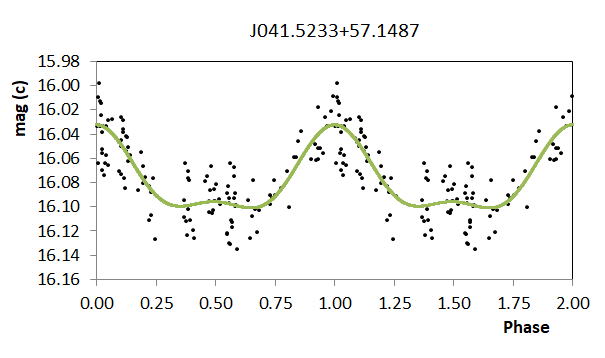
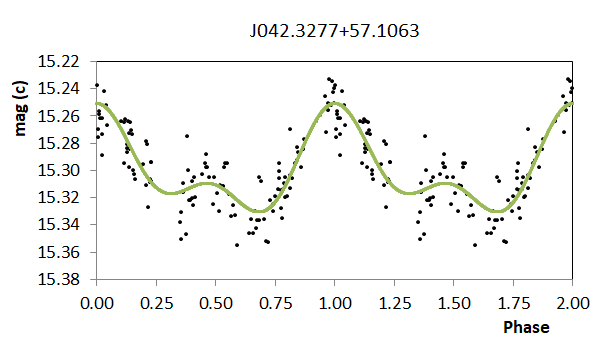
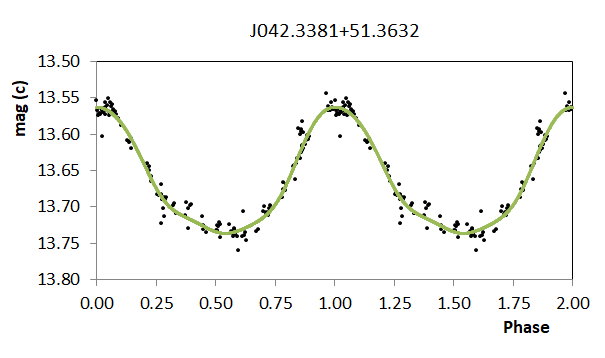
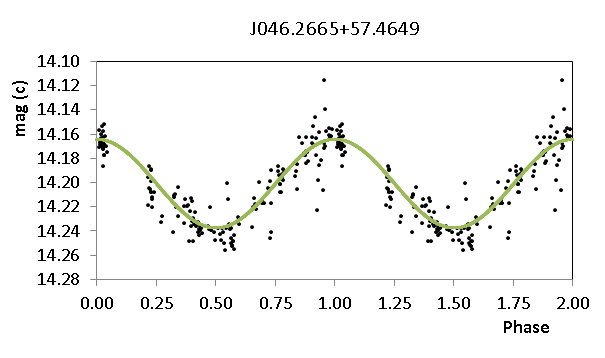
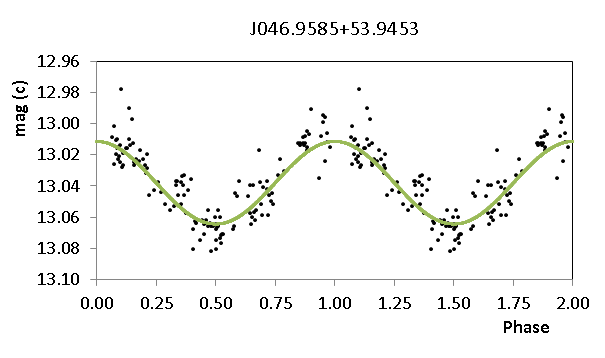
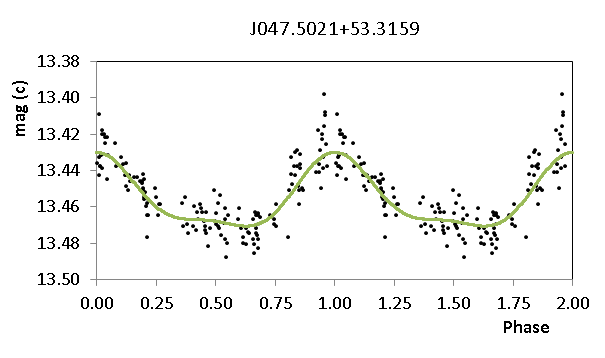
264 stars passed the imposed selection criteria, which, for convenience, are hereafter referred to as the ’final sample’. The full list of parameters for these objects is provided in Table 1 in the Appendix (Section A). A sample page illustrating the light curves of the first 16 stars from our sample is also provided in the Appendix (Figure 9). The full set of light curves is obtainable online.

3 Spectral classification
The final sample was cross-matched with the LAMOST DR4 VizieR online catalogue555http://cdsarc.u-strasbg.fr/viz-bin/cat/V/153 (Luo et al., 2018), requiring S/N 25 in the Sloan band. In this manner, spectra for 62 stars could be procured. If more than one spectrum was available for a single object, only the spectrum with the highest band S/N was considered.
Spectral classification was performed in the framework of the refined MK classification system following the methodology outlined in Gray & Garrison (1987, 1989a, 1989b); Garrison & Gray (1994) and Gray & Corbally (2009). For a precise classification and to identify peculiarities, the blue-violet (38004600 Å) spectral region was compared visually to, and overlaid with, MK standard star spectra and a set of synthetic spectra.
The standard star spectra were taken from the libr18 and libnor36 libraries that are distributed with the MKCLASS code666http://www.appstate.edu/~grayro/mkclass/, a computer program written to classify stellar spectra on the MK system (Gray & Corbally, 2014), and the liblamost library, which is a preliminary set of suitable LAMOST spectra compiled by Hümmerich et al. (2020). The synthetic spectra were calculated using the program SPECTRUM777http://www.appstate.edu/~grayro/spectrum/spectrum.html (Gray & Corbally, 1994) and ATLAS9 model atmospheres (Castelli & Kurucz, 2003), assuming log g = 4.0, [M/H] = 0.0 and a microturbulent velocity of 2 km s-1. The spectra were then subsequently smoothed to a resolution of 3.0 Å to provide a good match to the LAMOST spectra.

mCP stars exhibit several peculiarities related to traditional classification criteria, which need to be taken into account when assigning a spectral type to these objects. They often show weak, unusually broad or otherwise peculiar Ca ii K line profiles, weak Mg ii 4481 Å lines and are markedly He deficient (Gray & Corbally, 2009; Ghazaryan et al., 2018). The latter characteristic resulted in the classification of many of the hotter (late B-type) mCP stars as A-type stars because of the lack of, or the occurrence of only very weak, He i lines in their spectra (Gray & Corbally, 2009). Furthermore, mCP stars generally show enhanced and peculiar metallic lines. In general, therefore, the hydrogen-line profile is the most accurate indicator of the actual temperature of these objects (Gray & Corbally, 2009).
We have determined spectral types based on the Ca ii K line strength (the k-line type) and the hydrogen-line profile (the h-line type) (Osawa, 1965). Spectral types based on the strength of the He i lines were not determined for all stars but only in the case of the He-weak/CP4 stars and where they were unambiguously visible in the spectra. Most late B-type stars in our sample appear noticeably He weak.
The metallic lines of most mCP stars are so peculiar that they cannot be used for luminosity classification. Luminosity types, therefore, were based on the wings of the hydrogen lines. In this respect, it is important to note that a considerable number of mCP stars shows narrow or unusual hydrogen-line profiles (e.g. Faraggiana, 1987; Garrison & Gray, 1994; Ghazaryan et al., 2018) which are best matched by the profiles of high-luminosity objects like giants or even bright giants (luminosity classes III and II, respectively). This also holds true for many stars of our sample, although, apart from the hydrogen-line profile, other high-luminosity indicators are mostly absent from their spectra. It is well known that the vast majority of mCP stars are in fact main-sequence objects (Netopil et al. 2017 and references therein) and our results from the colour-magnitude diagram (CMD) (Section 5) fully support this finding. Non-LTE effects may be at the root of this obvious discrepancy between the luminosities derived from the hydrogen-line profiles and other indicators (Garrison & Gray, 1994). Perhaps the influence of the strong magnetic fields results in unusual atmospheric structures; however, this remains as yet unsolved.
Main chemical peculiarities are given in order of importance. Parantheses and a double pair of parantheses have been employed to indicate that a peculiarity is, respectively, weakly or only marginally present (Gray & Garrison, 1987, 1989a, 1989b; Garrison & Gray, 1994). Likewise, the notation “metallic lines” is used to indicate a faint background of metallic lines due to other atomic species than iron, titanium, or their ions (Gray & Garrison, 1987). This notation may also appear in parantheses or a double pair of parantheses.
For several objects, only spectra of low S/N (S/N < 40) are available. Spectral types based on these spectra should be regarded as estimates only. For instance, the difference between the hydrogen-line profiles of a B8 III star and a B5 V star gets blurred in low S/N spectra (Garrison & Gray, 1994). As mCP stars often show weak He lines, this leads to corresponding uncertainties in the spectral classification.
Example spectra are provided in Figure 4; final spectral types and remarks are presented in Table 1. We also investigated the 48005600 Å spectral region to check for the presence and morphology of the flux depression around 5200 Å, which is a characteristic of mCP stars (Kodaira, 1969; Kupka et al., 2003; Khan & Shulyak, 2007) and readily visible at LAMOST resolution (Hümmerich et al., 2020). Unless indicated otherwise in the remarks, all objects show a clearly visible 5200 Å feature in their spectra, as expected.
Nine of the spectroscopically confirmed mCP stars are contained in the sample of Hümmerich et al. (2020); the remaining 54 stars are here presented as mCP stars for the first time. Our classifications agree well with the automatically derived classifications from the aforementioned study. Hümmerich et al. (2020) did not specify k-line types for all objects; however, the h-line types, the most important temperature-type criterion in mCP stars, agree very well: the differences amount to 0.0 spectral subclasses in the case of six objects, 0.5 spectral subclasses in the case of two stars, and 2.0 spectral subclasses in the case of one star (one spectral subclass being the difference between, for instance, A0 and A1). The main spectral peculiarities have been correctly identified by Hümmerich et al. (2020); using manual classification, we can in some cases add weak peculiarities that have been missed by their code and, in two cases, are able to resolve the generic ’bl4077’ (strong 4077 Å blend) and ’bl4130’ (strong 4130 Å blend) types into their contributing ions. For instance, in the case of J072338.12+003848.5, ’bl4077’ resolves into Si ii 4076 Å and Sr ii 4077 Å, and ’bl4130’ into Si ii 412830 Å and Eu ii 4130 Å. Classifications from Hümmerich et al. (2020), where available, are also provided in Table 1.
(1) (2) (3) (4) (5) ID_ATO ID_LAMOST S/N SpT_final remark J046.2665+57.4649 J030503.98+572753.7 33 kA0 hB7 HeB8 V Si(Sr:) no 5200 Å flux depression visible J046.9585+53.9453 J030750.05+535643.2 98 kA0 hA0: III-IV (Si) 4481 weak J047.5021+53.3159 J031000.50+531857.3 30 kA1 hA3 III SiCrEu J050.9303+44.3793 J032343.27+442245.4 108 kA0 hA0 II EuSi 4481 weak; H20: A0 Ib-II EuSi J053.2447+44.4347 J033258.73+442605.0 69 kB9.5 hB9 III SiEuCr 4172-9 strong J057.4910+58.7724 J034957.85+584620.8 57 kA0 hB9.5 III Si(Cr)Eu 4481 weak J060.7275+46.2448 J040254.59+461441.4 45 kA1 hB9: II: SiEuSr 4481 weak J060.7480+45.3172 J040259.53+451902.0 113 kA1 hA1 III SiEu((Cr)) 4481 weak J063.5805+46.9075 J041419.32+465427.1 42 knA1 hA5 III EuCrSr(Si) 4481 weak J064.2611+46.2848 J041702.66+461705.5 65 kA0 hA0 III-IV Si 4481 weak J065.7038+47.6938 J042248.93+474138.0 308 kA0 hA0 II EuSiCr 4481 weak; H20: A0 II Eu J066.9854+44.3739 J042756.51+442226.2 67 kB9.5 hB8 IV Si 4481 weak J067.4887+38.9535 J042957.29+385712.5 58 knB9 hB5 V Si J072.5642+39.5294 J045015.40+393146.0 78 kA1 hA5 III SiCr J074.4268+43.8711 J045742.44+435216.0 30 kA0 hA5 III-IV SiEuSr 4481 weak J074.9570+40.2063 J045949.68+401222.8 83 kA0 hB9 III-IV SiEu 4481 broad and shallow J074.9889+42.2979 J045957.34+421752.6 31 kA0 hB9 III SiEuCr J076.4023+45.6101 J050536.57+453636.6 59 kA1 hB9 III EuSi Eu very strong; 4481 broad and shallow J077.0867+36.5911 J050820.81+363528.0 41 kB9.5 hB8 V (Si) ((metallic lines)) very weak 5200 Å flux depression J081.9629+42.4325 J052751.11+422557.3 92 kB9.5 hB9.5 III Si 4481 weak J082.5579+33.1925 J053013.91+331133.3 31 kA0 hB9: III: SiCr:Eu: 4481 weak J082.6115+29.6992 J053026.78+294157.2 84 kA0 hB9 III Si 4481 weak J082.6322+21.1693 J053031.74+211009.4 103 kB9 hB7 HeB9 V ((metallic lines)) J084.9321+37.2119 J053943.72+371243.0 59 knA0 hB9 V SiEu((Cr)) 4481 broad and shallow J086.1147+31.8873 J054427.54+315314.3 28 kA1 hB9 IV Si:Cr:Eu: J086.1972+24.3919 J054447.34+242331.1 52 kB9 hB7 HeB8 V ((Si)) (metallic lines) J086.3082+11.2506 J054513.97+111502.4 232 kB8 hB8 V Si 4481 weak J086.4762+23.3391 J054554.30+232021.0 47 kA0 hB9 III SrCrEuSr 4481 slightly weak J086.5553+40.4840 J054613.28+402902.7 98 kA0 hB9 IV Si(SrCr) 4481 weak J087.1757+29.1833 J054842.18+291059.9 35 kA0 hB9: V: SiEuCr 4481 weak J087.2218+29.4548 J054853.23+292717.3 26 kB9 hA0: III: SiCrEu 4481 weak J088.2315+38.6528 J055255.56+383910.1 47 kB9 hB7 HeB9 V Si (metallic lines) 4481 weak J090.0237+21.9017 J060005.70+215406.3 40 kA0 hB9 V CrSiEu J090.7455+31.0548 J060258.92+310317.1 37 kB9 hB9: II: SiCrSr 4481 weak J091.1746+24.8696 J060441.92+245210.8 26 kB9: hB9: III: Si 4481 weak J091.9664+24.5688 J060751.94+243407.9 95 kB9 hB5 HeB9 IV (Si) (metallic lines) J093.7415+41.4780 J061457.97+412840.8 112 kA1 hA5 V Eu 4172-9 strong J093.9930+13.8659 J061558.32+135157.3 148 kB9 hB5 HeB9 V (SiSr)Ti? H20: B5 III-IV bl4130 (He-wk) J094.3323+15.5243 J061719.74+153127.5 86 kB9.5 hB7 HeB9 V Si J094.7507+19.5193 J061900.18+193109.6 76 knA0 hA0: II-III SiEuCr 4481 weak J095.0108+01.8715 J062002.59+015217.4 41 kA0 hB9 IV SiCrSrEu 4481 weak J095.4959+23.6564 J062159.02+233923.1 42 knB9 hB8 HeB9 V SiCr J096.8934+14.9451 J062734.41+145642.6 37 kA1 hA3: III: Cr:Si: 4481 weak J097.1763+16.4813 J062842.31+162852.9 168 kB9.5 hB9.5 III EuSi((Cr)) 4481 weak; H20: B9.5 II-III EuSi J097.4242+24.5808 J062941.80+243450.9 155 kB9 hB7 HeB8 V J097.6873+03.0070 J063044.96+030025.3 61 kB9 hB7 HeB9: V J098.5904+17.0987 J063421.70+170555.6 83 knA0 hB9 III Si 4481 weak J098.6389+19.1051 J063433.34+190618.6 26 kA0 hB8 IV SiCr:Eu: 4481 weak J099.0745+18.8221 J063617.89+184919.6 28 kB9 hB9 IV SiEuCr J099.6853+17.3396 J063844.48+172022.5 162 kA0 hB9 III Si(Sr)((Cr)) 4481 weak; H20: B9 III-IV Si J100.3063+00.9026 J064113.52+005409.4 43 kA0 hB8 IV SiCr 4481 weak J101.1743+21.6307 J064441.84+213750.5 132 kA0 hA0 II EuSi((Cr)) 4481 weak; H20: A0 II EuSi J101.3758+01.7599 J064530.19+014535.8 97 kB9 hB8 V SiEu((Cr)) 4481 weak J103.3079+10.5510 J065313.89+103303.3 119 kA0 hA0 III EuSi 4481 weak; H20: kA0hA2mA5 Eu J103.8576-00.4954 J065525.82-002943.4 71 kA0 hB5 V (metallic lines) J105.0327+06.1169 J070007.86+060701.0 50 kA1 hA1 II: EuCrSi 4481 weak J106.4471-03.7806 J070547.31-034650.2 80 kB9.5 hB9 III: (metallic lines) J106.5580+18.8987 J070613.94+185355.6 63 kA0 hB9 III Si H20: B9.5 II-III Si J110.2675-03.2520 J072104.20-031507.4 142 kA0 hB9 III SiSrEu 4481 weak; H20: B9.5 II-III bl4077 bl4130 J110.9088+00.6468 J072338.12+003848.5 94 knB9 hB9 IV-V SiSrCrEu 4481 weak; very broad Ca II K line blend J306.9801+45.3863 J202755.24+452311.0 99 kA0 hB9 IV Si(EuSr) 4481 weak J350.3833+56.4514 J232132.00+562705.2 57 kA0 hA3 III EuSi 4481 weak
4 Magnitude, period and space distribution
The upper panel of Figure 5 illustrates the histogram of the magnitudes of the spectroscopically confirmed mCP stars ( = 62) and the mCP star candidates ( = 202) of our final sample. The magnitude distribution peaks around 14th magnitude. For comparison, the stars in the catalogues of Renson & Manfroid (2009) and Hümmerich et al. (2020) peak at 9th magnitude and between 11th and 12th magnitude, respectively. With this work, we therefore extend the search for new mCP stars to even fainter magnitudes.
The period histogram is presented in the lower panel of Figure 5. All periods were extracted from Heinze et al. (2018) and are presented, together with other parameters, in Table 1. The period distribution is fully in agreement with the observed rotational periods of mCP stars, which generally cluster at around a period value of 2 days (e.g. Renson & Manfroid, 2009; Bernhard et al., 2015b). We recall the here imposed period cut-off (0.5 < < 10), which was chosen to exclude short-period pulsators and because the number of suitable light curves in the ATLAS DR1 catalogue diminishes rapidly at > 10 d (cf. Section 2.4). Any mCP stars with rotation periods longer than 10 days will therefore have been missed by our approach.


The coordinates in the Galactic [XYZ] plane were obtained via the conversion of spherical Galactic coordinates (latitude and longitude) to Cartesian coordinates using the distance from Bailer-Jones et al. (2021). Only objects with absolute parallax errors less than 25 % ( = 257) were considered. The positive X-axis is towards the Galactic centre, the positive Y-axis is in the direction of the Galactic rotation, and the positive Z-axis is towards the north Galactic pole.
Our results are shown in the Appendix in Figure 8. Most sample stars classify as either members of the thin disk (scale height of 350 pc) or the thick disk (1200 pc). The corresponding scale heights were adopted from Ojha (2001) and Aumer & Binney (2017). Interestingly, four stars (ATO J265.2024+10.6314, ATO J072.9129-07.0638, ATO J005.5419+15.5369, and ATO J310.1614-15.1051) are situated more than 1200 pc above or below the [XY] plane and thus qualify as members of the halo population. This is of considerable interest as only very few halo CP2 stars are known (Hümmerich et al., 2020).
5 Mass and age distribution
For generating a colour-magnitude diagram (CMD), we employed the homogeneous Gaia DR2 photometry of Arenou et al. (2018) and the photogeometric distances of Bailer-Jones et al. (2021), which are based on the Gaia EDR3 (Riello et al., 2021). As most of our sample stars are members of the Galactic disk and situated within a mean distance of 2500 pc from the Sun, interstellar reddening is significant and needs to be taken into account. To estimate the absorption in the line-of-sight, we interpolated the reddening map of Green et al. (2018) using the Gaia EDR3 photogeometric distances. Reddening values were transformed using the relations
| (1) |
which take into account the coefficients listed in Green et al. (2018).
The Gaia DR2 photometry was corrected as suggested by Maíz Apellániz & Weiler (2018). The PARSEC isochrones (Bressan et al., 2012) for solar metallicity [Z] = 0.02 dex and the filter curves from Maíz Apellániz & Weiler (2018) were used for further analysis. For the estimation of the stellar mass and logarithmic ages, the Stellar Isochrone Fitting Tool888https://github.com/Johaney-s/StIFT was used, which searches for the best-fit evolutionary track within a model grid box. The four grid points closest to the input value are determined, from which the output parameters are derived by bilinear interpolation following the methodology described by Malkov et al. (2010).
The CMD (Figure 6) shows that our sample contains no young stars near the zero-age main sequence (ZAMS). This allowed a corresponding restriction of the tracks in the models to increase the accuracy of the estimates. Parameters could not be determined for five stars of our sample (ATO J076.1702+08.2581, ATO J115.0928-10.6198, ATO J117.8237-09.5101, ATO J308.7048+45.8077, and ATO J321.3283+53.8969) because they did not fit into the grid of models.
Figure 7 shows the mass and age distribution of our sample stars, the complete list of parameters is given in Appendix A. Derived masses range from 1.4 (a spectral type of about F3) to 5 (B5). However, half of our sample stars have masses between 2 and 2.4 (A2 to B9), which is in line with the spectral classifications presented in Section 3. There is only a single outlier with a mass of 4.8 . The derived ages are in agreement with the results from the CMD; the vast majority of our sample stars are main-sequence objects situated rather close to the terminal-age main sequence (TAMS).


6 Conclusions
Instigated by the similarity of the light curves, periods and amplitudes of the ’upside-down CBH variables’ shown in Heinze et al. (2018) to the parameters of the class of ACV variables, we carried out a search for ACV variables in the ATLAS DR1 catalogue. Our main results are summarised in the following.
-
•
Using suitable selection criteria (0.5 < < 10; amp() 0.3 mag; phase offset of the first two Fourier terms between 60∘ and 110∘; stable light curves; monoperiodicity; suitable near-/mid-infrared colours), we identified 264 candidate ACV variables.
-
•
62 of these objects could be spectroscopically confirmed as mCP stars with LAMOST spectra and were classified on the MK system. Nine of these objects are included in the sample of Hümmerich et al. (2020); the other 54 stars are new discoveries. The remaining 202 stars are here presented as ACV star candidates that require further observations.
-
•
We present basic stellar parameters for all sample stars. Derived masses range from 1.4 to 5 , with half our sample stars being situated in the range from 2 to 2.4 . These results are in good agreement with our spectral classifications. As expected, the majority of our sample stars are main-sequence objects.
-
•
Most of our sample stars are members of the thin and thick disk. Four objects (ATO J265.2024+10.6314, ATO J072.9129-07.0638, ATO J005.5419+15.5369, and ATO J310.1614-15.1051) classify as members of the halo population.
-
•
With a peak magnitude distribution at around 14th magnitude, the here presented mCP stars and candidates are situated at the faint end of the known Galactic mCP star population.
While ACV variables have been included into automated classification routines with good success in the past (e.g. Sitek & Pojmański 2014), several of the more recent, massive variability catalogues, such as Heinze et al. (2018) and Chen et al. (2020), do not specifically consider this class of variable stars. Nevertheless, ACV variables are characterised by a distinct set of parameters in period, amplitude and colour spaces as well as concerning their light curve morphology (monoperiodicity, light curve stability, characteristic phase offset), and should therefore be well suited for automated classification attempts.
Our study shows that a dedicated search for ACV variables in catalogues that do not consider this class is a good starting point for the identification of further members of this group of variables. In general, we expect that the advent of high-precision, multi-colour and spectroscopic surveys will open up a multitude of possibilities to identify new ACV variables, and hence increase the sample size of know mCP stars, in the future.
Acknowledgements
We thank the referee for his/her comments that helped to improve the paper. EP acknowledges support by the Erasmus+ programme of the European Union under grant number 2020-1-CZ01-KA203-078200. The Guo Shou Jing Telescope (the Large Sky Area Multi-Object Fiber Spectroscopic Telescope, LAMOST) is a National Major Scientific Project built by the Chinese Academy of Sciences. Funding for the project has been provided by the National Development and Reform Commission. LAMOST is operated and managed by National Astronomical Observatories, Chinese Academy of Sciences. This work presents results from the European Space Agency (ESA) space mission Gaia. Gaia data are being processed by the Gaia Data Processing and Analysis Consortium (DPAC). Funding for the DPAC is provided by national institutions, in particular the institutions participating in the Gaia MultiLateral Agreement (MLA). The Gaia mission website is https://www.cosmos.esa.int/gaia. The Gaia archive website is https://archives.esac.esa.int/gaia.
Data Availability
The data underlying this article will be shared on reasonable request to the corresponding author.
References
- Arenou et al. (2018) Arenou F., et al., 2018, A&A, 616, A17
- Aumer & Binney (2017) Aumer M., Binney J., 2017, MNRAS, 470, 2113
- Bailer-Jones et al. (2021) Bailer-Jones C. A. L., Rybizki J., Fouesneau M., Demleitner M., Andrae R., 2021, AJ, 161, 147
- Bernhard et al. (2015a) Bernhard K., Hümmerich S., Paunzen E., 2015a, Astronomische Nachrichten, 336, 981
- Bernhard et al. (2015b) Bernhard K., Hümmerich S., Otero S., Paunzen E., 2015b, A&A, 581, A138
- Bernhard et al. (2020) Bernhard K., Hümmerich S., Paunzen E., 2020, MNRAS, 493, 3293
- Bowman et al. (2018) Bowman D. M., Buysschaert B., Neiner C., Pápics P. I., Oksala M. E., Aerts C., 2018, A&A, 616, A77
- Bressan et al. (2012) Bressan A., Marigo P., Girardi L., Salasnich B., Dal Cero C., Rubele S., Nanni A., 2012, MNRAS, 427, 127
- Castelli & Kurucz (2003) Castelli F., Kurucz R. L., 2003, in Piskunov N., Weiss W. W., Gray D. F., eds, IAU Symposium Vol. 210, Modelling of Stellar Atmospheres. p. A20 (arXiv:astro-ph/0405087)
- Chen et al. (2020) Chen X., Wang S., Deng L., de Grijs R., Yang M., Tian H., 2020, ApJS, 249, 18
- Cui et al. (2012) Cui X.-Q., et al., 2012, Research in Astronomy and Astrophysics, 12, 1197
- David-Uraz et al. (2019) David-Uraz A., et al., 2019, Monthly Notices of the Royal Astronomical Society, 487, 304
- Djorgovski et al. (2013) Djorgovski S. G., Mahabal A., Drake A., Graham M., Donalek C., 2013, Sky Surveys. p. 223, doi:10.1007/978-94-007-5618-2_5
- Faraggiana (1987) Faraggiana R., 1987, Ap&SS, 134, 381
- Garrison & Gray (1994) Garrison R. F., Gray R. O., 1994, AJ, 107, 1556
- Ghazaryan et al. (2018) Ghazaryan S., Alecian G., Hakobyan A. A., 2018, MNRAS, 480, 2953
- Gray & Corbally (1994) Gray R. O., Corbally C. J., 1994, AJ, 107, 742
- Gray & Corbally (2009) Gray R. O., Corbally C. J., 2009, Stellar Spectral Classification
- Gray & Corbally (2014) Gray R. O., Corbally C. J., 2014, The Astronomical Journal, 147, 80
- Gray & Garrison (1987) Gray R. O., Garrison R. F., 1987, ApJS, 65, 581
- Gray & Garrison (1989a) Gray R. O., Garrison R. F., 1989a, ApJS, 69, 301
- Gray & Garrison (1989b) Gray R. O., Garrison R. F., 1989b, ApJS, 70, 623
- Green et al. (2018) Green G. M., et al., 2018, MNRAS, 478, 651
- Heinze et al. (2018) Heinze A. N., et al., 2018, The Astronomical Journal, 156, 241
- Hümmerich et al. (2016) Hümmerich S., Paunzen E., Bernhard K., 2016, AJ, 152, 104
- Hümmerich et al. (2018) Hümmerich S., et al., 2018, A&A, 619, A98
- Hümmerich et al. (2020) Hümmerich S., Paunzen E., Bernhard K., 2020, A&A, 640, A40
- Jagelka et al. (2019) Jagelka M., Mikulášek Z., Hümmerich S., Paunzen E., 2019, A&A, 622, A199
- Khan & Shulyak (2007) Khan S. A., Shulyak D. V., 2007, A&A, 469, 1083
- Kodaira (1969) Kodaira K., 1969, ApJ, 157, L59
- Kupka et al. (2003) Kupka F., Paunzen E., Maitzen H. M., 2003, MNRAS, 341, 849
- Lanz et al. (1996) Lanz T., Artru M. C., Le Dourneuf M., Hubeny I., 1996, A&A, 309, 218
- Lenz & Breger (2005) Lenz P., Breger M., 2005, Communications in Asteroseismology, 146, 53
- Luo et al. (2018) Luo A. L., Zhao Y. H., Zhao G., et al. 2018, VizieR Online Data Catalog, 5153, 0
- Maitzen (1980) Maitzen H. M., 1980, A&A, 89, 230
- Maíz Apellániz & Weiler (2018) Maíz Apellániz J., Weiler M., 2018, A&A, 619, A180
- Malkov et al. (2010) Malkov O. Y., Sichevskij S. G., Kovaleva D. A., 2010, MNRAS, 401, 695
- Mathys & Manfroid (1985) Mathys G., Manfroid J., 1985, A&AS, 60, 17
- Michaud (1970) Michaud G., 1970, ApJ, 160, 641
- Netopil et al. (2017) Netopil M., Paunzen E., Hümmerich S., Bernhard K., 2017, MNRAS, 468, 2745
- North (1984) North P., 1984, A&AS, 55, 259
- Ojha (2001) Ojha D. K., 2001, MNRAS, 322, 426
- Osawa (1965) Osawa K., 1965, Annals of the Tokyo Astronomical Observatory, 9, 121
- Paunzen & Maitzen (1998) Paunzen E., Maitzen H. M., 1998, A&AS, 133, 1
- Preston (1974) Preston G. W., 1974, ARA&A, 12, 257
- Renson & Manfroid (2009) Renson P., Manfroid J., 2009, A&A, 498, 961
- Richer et al. (2000) Richer J., Michaud G., Turcotte S., 2000, ApJ, 529, 338
- Riello et al. (2021) Riello M., et al., 2021, A&A, 649, A3
- Samus et al. (2017) Samus N. N., Kazarovets E. V., Durlevich O. V., Kireeva N. N., Pastukhova E. N., 2017, Astronomy Reports, 61, 80
- Shulyak et al. (2010) Shulyak D., Krtička J., Mikulášek Z., Kochukhov O., Lüftinger T., 2010, A&A, 524, A66
- Sikora et al. (2019) Sikora J., et al., 2019, MNRAS, 487, 4695
- Sitek & Pojmański (2014) Sitek M., Pojmański G., 2014, Acta Astron., 64, 115
- Skrutskie et al. (2006) Skrutskie M. F., et al., 2006, AJ, 131, 1163
- Snellen et al. (2012) Snellen I. A. G., et al., 2012, in Ground-based and Airborne Telescopes IV. p. 84440I (arXiv:1208.4116), doi:10.1117/12.925178
- Talens et al. (2017) Talens G. J. J., Spronck J. F. P., Lesage A. L., Otten G. P. P. L., Stuik R., Pollacco D., Snellen I. A. G., 2017, A&A, 601, A11
- Tonry et al. (2018) Tonry J. L., et al., 2018, PASP, 130, 064505
- Watson (2006) Watson C. L., 2006, Society for Astronomical Sciences Annual Symposium, 25, 47
- Wraight et al. (2012) Wraight K. T., Fossati L., Netopil M., Paunzen E., Rode-Paunzen M., Bewsher D., Norton A. J., White G. J., 2012, MNRAS, 420, 757
- Wright et al. (2010) Wright E. L., et al., 2010, AJ, 140, 1868
- Zhao et al. (2012) Zhao G., Zhao Y.-H., Chu Y.-Q., Jing Y.-P., Deng L.-C., 2012, Research in Astronomy and Astrophysics, 12, 723
Appendix A Essential data of our sample stars
(1) (2) (3) (4) (5) (6) (7) (8) (9) (10) (11) (12) (13) (14) (15) (16) (17) (18) (19) ID_ATO ID_EDR3 RA(J2000) Dec(J2000) X Y Z e_ _rot e_ ()0 e_()0 M e_M Mass (hh mm ss.sss) (dd mm ss.sss) (kpc) (kpc) (kpc) (mag) (mag) (d) (pc) (pc) (mag) (mag) (mag) (mag) (mag) (Msun) (yrs) J005.5419+15.5369 Gaia EDR3 2792368559383811456 00 22 10.059 +15 32 13.056 1.000 +2.401 2.765 13.5507 0.0039 0.751927 3796 198 +0.581 0.015 0.21 +0.45 0.11 2.16 9.00 J010.7230+57.8087 Gaia EDR3 424732034625642368 00 42 53.529 +57 48 31.384 0.924 +1.491 0.155 12.8048 0.0038 4.435267 1761 39 0.003 0.016 0.72 +0.87 0.05 2.35 8.61 J013.3939+57.6244 Gaia EDR3 424250379812359936 00 53 34.559 +57 37 28.060 2.430 +3.711 0.407 13.9679 0.0030 1.812188 4455 292 0.116 0.006 1.02 0.31 0.14 3.19 8.39 J022.5446+57.3828 Gaia EDR3 412876791016632960 01 30 10.719 +57 22 58.282 1.303 +1.659 0.188 14.5231 0.0029 2.359033 2118 85 +0.197 0.007 1.10 +1.78 0.09 1.87 8.78 J026.6800+56.4974 Gaia EDR3 505603588749400192 01 46 43.217 +56 29 50.893 2.698 +3.154 0.404 14.7711 0.0033 2.146355 4170 372 +0.010 0.027 1.31 +0.36 0.20 2.52 8.67 J031.0380+59.2116 Gaia EDR3 507049377823095680 02 04 09.142 +59 12 41.903 1.411 +1.560 0.086 13.7826 0.0030 2.206660 2105 59 +0.180 0.028 1.00 +1.16 0.06 2.07 8.87 J032.9773+58.5860 Gaia EDR3 506819511170582656 02 11 54.559 +58 35 09.744 1.281 +1.361 0.087 12.8886 0.0031 4.381771 1871 47 +0.101 0.011 1.02 +0.51 0.05 2.36 8.78 J034.4119+58.6875 Gaia EDR3 458797241317270912 02 17 38.866 +58 41 15.122 1.786 +1.853 0.105 14.1734 0.0031 2.475819 2575 120 +0.115 0.017 1.53 +0.58 0.10 2.32 8.80 J038.7653+59.5850 Gaia EDR3 465050301379696000 02 35 03.677 +59 35 06.078 1.345 +1.312 0.023 14.0938 0.0030 1.507414 1880 50 +0.054 0.023 1.82 +0.88 0.06 2.26 8.73 J039.8159+57.4010 Gaia EDR3 457901276777494016 02 39 15.825 +57 24 03.870 1.986 +1.847 0.117 15.0181 0.0032 1.129681 2714 162 +0.195 0.013 1.47 +1.37 0.13 1.99 8.88 J041.5233+57.1487 Gaia EDR3 460845975073772416 02 46 05.591 +57 08 55.459 2.244 +2.019 0.123 15.5073 0.0031 1.568993 3021 254 +0.296 0.022 2.52 +0.59 0.18 2.25 8.89 J042.3277+57.1063 Gaia EDR3 460790655894929280 02 49 18.660 +57 06 22.823 1.979 +1.755 0.100 15.0568 0.0030 1.697997 2647 176 +0.062 0.023 1.99 +0.94 0.15 2.23 8.74 J042.3381+51.3632 Gaia EDR3 440615407799027840 02 49 21.164 +51 21 47.553 1.798 +1.457 0.298 13.5526 0.0039 2.762592 2333 97 +0.042 0.012 0.83 +0.88 0.09 2.27 8.71 J046.2665+57.4649 Gaia EDR3 460271445887343104 03 05 03.984 +57 27 53.658 1.765 +1.473 0.035 13.9203 0.0031 2.959672 2299 86 0.076 0.047 2.06 +0.03 0.08 2.87 8.50 J046.9585+53.9453 Gaia EDR3 447101529969139200 03 07 50.055 +53 56 43.237 1.621 +1.255 0.134 12.7750 0.0029 1.610395 2054 103 +0.161 0.032 1.55 0.35 0.11 2.66 8.74 J047.5021+53.3159 Gaia EDR3 446269337107134720 03 10 00.500 +53 18 57.326 13.4847 0.0095 2.289972 J050.9303+44.3793 Gaia EDR3 241472445889902080 03 23 43.271 +44 22 45.440 3.261 +1.917 0.700 14.6146 0.0046 4.494699 3847 362 0.015 0.020 0.46 +1.19 0.20 2.27 8.41 J053.2447+44.4347 Gaia EDR3 241650223177124864 03 32 58.738 +44 26 05.071 1.199 +0.667 0.229 12.1581 0.0031 1.472468 1392 36 +0.102 0.009 0.42 +1.02 0.06 2.16 8.79 J057.4910+58.7724 Gaia EDR3 473203695496163200 03 49 57.859 +58 46 20.852 1.373 +0.985 +0.104 13.4440 0.0029 2.675655 1693 31 +0.084 0.015 1.51 +0.78 0.04 2.27 8.77 J057.6555+58.8757 Gaia EDR3 473205963238846848 03 50 37.322 +58 52 32.644 2.695 +1.934 +0.212 15.7241 0.0035 1.803022 3324 373 +0.225 0.014 1.50 +1.59 0.24 1.90 8.89 J057.9558+54.6451 Gaia EDR3 444608868392387456 03 51 49.391 +54 38 42.453 0.974 +0.629 +0.010 13.2747 0.0031 2.222517 1160 59 +0.345 0.186 1.55 +1.33 0.11 1.94 9.01 J059.0278+55.2600 Gaia EDR3 444653879648018816 03 56 06.680 +55 15 36.286 1.152 +0.742 +0.032 12.6441 0.0028 1.824059 1371 23 +0.123 0.016 1.31 +0.64 0.04 2.29 8.81 J059.8990+50.2781 Gaia EDR3 250585816735404544 03 59 35.769 +50 16 41.264 2.628 +1.467 0.111 15.7401 0.0044 4.764477 3012 272 +0.273 0.035 2.10 +1.23 0.20 2.00 8.95 J060.4363+55.5067 Gaia EDR3 468500667647878400 04 01 44.730 +55 30 24.406 1.492 +0.945 +0.063 13.7076 0.0034 2.474011 1767 47 +0.176 0.020 1.46 +0.99 0.06 2.13 8.87 J060.7275+46.2448 Gaia EDR3 245658458458317056 04 02 54.602 +46 14 41.536 3.839 +1.880 0.358 15.7085 0.0036 1.240184 4289 555 +0.098 0.047 1.27 +1.25 0.28 2.09 8.76 J060.7480+45.3172 Gaia EDR3 233468173039182464 04 02 59.532 +45 19 02.115 1.368 +0.651 0.145 13.0578 0.0029 1.522352 1522 58 +0.137 0.006 0.98 +1.17 0.08 2.09 8.83 J061.6000+59.6651 Gaia EDR3 470578302247842560 04 06 24.001 +59 39 54.612 2.623 +1.813 +0.311 14.0773 0.0042 3.434188 3204 201 0.005 0.019 1.21 +0.33 0.14 2.56 8.65 J062.2757+57.3439 Gaia EDR3 469300326139460224 04 09 06.182 +57 20 38.089 2.820 +1.818 +0.240 14.5011 0.0034 2.119598 3364 195 +0.107 0.011 1.41 +0.45 0.13 2.38 8.78 J062.6054+48.7741 Gaia EDR3 246505838323965952 04 10 25.302 +48 46 26.922 2.601 +1.317 0.105 15.7129 0.0034 3.863680 2917 345 +0.086 0.210 2.23 +1.13 0.26 2.14 8.76 J063.5805+46.9075 Gaia EDR3 234065826327540608 04 14 19.331 +46 54 27.154 2.368 +1.109 0.136 13.1824 0.0037 1.456892 2618 499 0.049 0.197 1.72 0.69 0.40 3.17 8.49 J064.2611+46.2848 Gaia EDR3 233792632048827776 04 17 02.662 +46 17 05.502 2.461 +1.112 0.146 14.7410 0.0032 2.681701 2704 234 +0.119 0.030 1.26 +1.28 0.19 2.06 8.79 J065.5257+51.2992 Gaia EDR3 271532063001936512 04 22 06.167 +51 17 57.385 2.448 +1.261 +0.051 14.8359 0.0046 3.622927 2754 197 +0.005 0.094 1.85 +0.74 0.15 2.38 8.66 J065.7038+47.6938 Gaia EDR3 257945019859374208 04 22 48.930 +47 41 38.038 0.712 +0.326 0.019 11.4438 0.0038 2.774777 783 109 +0.154 0.021 1.02 +0.91 0.30 2.17 8.85 J065.8718+43.5268 Gaia EDR3 229348646566881664 04 23 29.244 +43 31 36.752 2.989 +1.181 0.239 14.3782 0.0035 1.453359 3223 193 +0.058 0.044 1.09 +0.75 0.13 2.30 8.74 J066.8944+56.8176 Gaia EDR3 278208606841140864 04 27 34.661 +56 49 03.467 3.167 +1.876 +0.353 14.2141 0.0031 1.708314 3698 233 0.136 0.032 1.22 +0.13 0.14 3.08 8.27 J066.9854+44.3739 Gaia EDR3 253427023504582016 04 27 56.516 +44 22 26.160 2.820 +1.117 0.164 14.3520 0.0029 1.716098 3038 182 +0.186 0.040 1.14 +0.77 0.13 2.21 8.86 J067.0419+51.6124 Gaia EDR3 271176817665195008 04 28 10.072 +51 36 44.750 3.565 +1.802 +0.136 15.5832 0.0042 6.716061 3997 545 +0.173 0.184 1.74 +0.83 0.29 2.19 8.86 J067.4887+38.9535 Gaia EDR3 179588117545396992 04 29 57.299 +38 57 12.665 2.593 +0.813 0.312 14.3917 0.0034 3.009545 2735 198 +0.038 0.009 1.59 +0.62 0.16 2.37 8.72 J067.6640+38.2381 Gaia EDR3 178430469239195904 04 30 39.368 +38 14 17.516 2.235 +0.674 0.284 13.7970 0.0032 1.387788 2352 100 +0.042 0.019 1.23 +0.71 0.09 2.34 8.72 J072.5642+39.5294 Gaia EDR3 199942929634159360 04 50 15.413 +39 31 46.032 3.716 +1.012 0.216 14.6053 0.0036 2.263109 3857 799 +0.219 0.055 1.04 +0.57 0.45 2.28 8.86 J072.9129-07.0638 Gaia EDR3 3187615948455925120 04 51 39.098 -07 03 49.730 3.411 1.606 2.159 13.9441 0.0048 0.734840 4345 343 +0.580 0.022 0.20 +0.54 0.17 2.12 9.02 J073.7460+43.3008 Gaia EDR3 205240445379721728 04 54 59.044 +43 18 02.990 2.590 +0.821 0.007 13.5702 0.0039 7.746157 2717 125 +0.049 0.013 0.65 +0.76 0.10 2.31 8.73 J073.8114+47.4553 Gaia EDR3 254938577111634560 04 55 14.756 +47 27 19.237 2.679 +1.017 +0.125 13.7983 0.0029 2.811480 2868 127 +0.009 0.024 1.19 +0.31 0.10 2.54 8.67 J074.4268+43.8711 Gaia EDR3 205351083735634688 04 57 42.450 +43 52 16.107 2.179 +0.696 +0.024 13.8735 0.0030 4.774356 2287 101 +0.286 0.016 1.09 +0.98 0.10 2.09 8.94 J074.6123+26.0721 Gaia EDR3 153687849841184768 04 58 26.967 +26 04 19.737 2.324 +0.144 0.421 14.4723 0.0030 2.610292 2366 112 0.003 0.006 1.98 +0.60 0.10 2.44 8.65 J074.6661+44.7655 Gaia EDR3 205467803765798912 04 58 39.883 +44 45 55.797 2.002 +0.663 +0.048 14.1854 0.0036 1.675826 2109 78 +0.203 0.017 1.36 +1.19 0.08 2.05 8.89 J074.9570+40.2063 Gaia EDR3 200775706615199616 04 59 49.685 +40 12 22.783 3.100 +0.808 0.076 14.7759 0.0037 1.557928 3204 234 +0.112 0.067 1.14 +1.10 0.16 2.13 8.80 J074.9889+42.2979 Gaia EDR3 201974204357706496 04 59 57.342 +42 17 52.556 3.775 +1.099 0.003 15.5504 0.0033 3.659410 3932 492 +0.102 0.107 0.91 +1.62 0.27 1.98 8.60 J075.0682+42.3262 Gaia EDR3 201974483527413248 05 00 16.368 +42 19 34.383 2.453 +0.714 +0.001 14.4160 0.0035 1.863155 2554 140 +0.118 0.034 0.72 +1.65 0.12 1.96 8.64 J075.5525+46.9691 Gaia EDR3 207004336905968896 05 02 12.602 +46 58 09.022 2.283 +0.816 +0.133 14.4067 0.0033 2.664824 2428 149 +0.104 0.063 1.96 +0.49 0.13 2.37 8.78 J075.7839+42.1896 Gaia EDR3 201793957461699200 05 03 08.148 +42 11 22.744 3.917 +1.107 +0.025 13.5006 0.0030 1.458149 4070 180 +0.363 0.026 0.64 0.20 0.10 2.49 8.83 J076.1702+08.2581 Gaia EDR3 3290096582558387072 05 04 40.867 +08 15 29.218 2.438 0.538 0.873 16.0511 0.0049 2.318806 2645 341 +0.561 0.026 0.29 +3.60 0.27 J076.3581+43.8370 Gaia EDR3 202507403068125312 05 05 25.948 +43 50 13.197 2.773 +0.839 +0.085 15.1060 0.0031 2.363328 2898 231 +0.375 0.132 2.02 +0.75 0.17 2.16 8.95 J076.4023+45.6101 Gaia EDR3 205975262742313984 05 05 36.568 +45 36 36.600 2.587 +0.852 +0.132 14.5110 0.0039 2.156734 2727 161 +0.078 0.036 1.28 +1.05 0.13 2.17 8.75 J076.5930+30.8311 Gaia EDR3 157208722295230208 05 06 22.337 +30 49 52.004 2.412 +0.268 0.255 14.0221 0.0033 1.514704 2440 124 +0.142 0.011 0.99 +1.08 0.11 2.11 8.84 J077.0867+36.5911 Gaia EDR3 185732154163148160 05 08 20.818 +36 35 28.032 2.863 +0.542 0.113 14.4993 0.0031 1.929063 2916 217 +0.072 0.082 1.17 +0.96 0.16 2.21 8.75 J077.1846+45.6644 Gaia EDR3 205952340498929664 05 08 44.317 +45 39 52.175 2.652 +0.859 +0.158 13.4514 0.0031 4.835060 2792 107 +0.079 0.015 0.70 +0.52 0.08 2.37 8.76 J077.7414+40.6851 Gaia EDR3 201008871800476288 05 10 57.948 +40 41 06.642 3.948 +0.963 +0.044 13.7868 0.0029 1.678861 4064 319 0.071 0.072 0.84 0.12 0.17 2.92 8.51 J079.1356+33.7630 Gaia EDR3 181901623151346304 05 16 32.551 +33 45 46.825 2.699 +0.353 0.121 15.9835 0.0041 2.458936 2725 289 +0.352 0.087 1.28 +2.51 0.23 1.62 8.64 J079.9036+53.6898 Gaia EDR3 266385317788362240 05 19 36.880 +53 41 23.462 3.210 +1.398 +0.574 14.9573 0.0034 2.926359 3548 343 +0.151 0.005 0.87 +1.35 0.21 2.02 8.82 J080.3836+43.4165 Gaia EDR3 207392086553729408 05 21 32.067 +43 24 59.551 4.424 +1.168 +0.304 14.4180 0.0032 2.896787 4586 418 +0.005 0.010 1.08 +0.01 0.20 2.69 8.65 J080.5363+36.3112 Gaia EDR3 183986301496148096 05 22 08.724 +36 18 40.684 2.718 +0.424 0.007 15.5640 0.0045 1.679479 2751 327 +0.184 0.192 1.82 +1.54 0.26 1.94 8.84 J081.6900+35.0200 Gaia EDR3 182878543531780480 05 26 45.607 +35 01 12.138 1.801 +0.230 0.003 13.4568 0.0029 0.804327 1815 66 +0.025 0.081 1.61 +0.52 0.08 2.43 8.70 J081.9629+42.4325 Gaia EDR3 195375450956448768 05 27 51.121 +42 25 57.350 1.687 +0.400 +0.128 12.9573 0.0050 1.761931 1739 58 +0.070 0.021 0.62 +1.13 0.07 2.16 8.73 J082.4146+43.5804 Gaia EDR3 195691564846752128 05 29 39.510 +43 34 49.729 3.558 +0.894 +0.328 15.3747 0.0036 2.454385 3684 401 +0.292 0.144 0.82 +1.71 0.23 1.84 8.96 J082.4358+39.0290 Gaia EDR3 190674974325136384 05 29 44.596 +39 01 44.550 2.514 +0.456 +0.117 14.7324 0.0046 1.947387 2558 153 +0.242 0.074 1.28 +1.39 0.13 1.96 8.93 J082.5579+33.1925 Gaia EDR3 3449031263234277376 05 30 13.910 +33 11 33.315 2.477 +0.232 0.022 13.4316 0.0033 4.734125 2488 91 +0.011 0.076 1.11 +0.33 0.08 2.53 8.68 J082.6115+29.6992 Gaia EDR3 3446133637776241792 05 30 26.782 +29 41 57.238 2.679 +0.113 0.112 14.6350 0.0036 1.963054 2684 178 +0.105 0.071 1.34 +1.12 0.14 2.13 8.79 J082.6322+21.1693 Gaia EDR3 3403667578134303616 05 30 31.744 +21 10 09.472 4.845 0.404 0.599 14.4688 0.0033 2.215640 4899 498 0.100 0.011 0.77 +0.25 0.22 2.85 8.41 J083.0553+11.5461 Gaia EDR3 3340653192355972480 05 32 13.292 +11 32 46.117 1.144 0.270 0.245 14.0975 0.0031 2.221372 1200 35 +0.520 0.024 0.62 +3.07 0.06 1.43 8.88
(1) (2) (3) (4) (5) (6) (7) (8) (9) (10) (11) (12) (13) (14) (15) (16) (17) (18) (19) ID_ATO ID_EDR3 RA(J2000) Dec(J2000) X Y Z e_ _rot e_ ()0 e_()0 M e_M Mass (hh mm ss.sss) (dd mm ss.sss) (kpc) (kpc) (kpc) (mag) (mag) (d) (pc) (pc) (mag) (mag) (mag) (mag) (mag) (Msun) (yrs) J083.1990+35.5978 Gaia EDR3 183188189196465152 05 32 47.768 +35 35 52.246 2.866 +0.356 +0.063 14.4956 0.0038 1.637762 2889 178 +0.020 0.089 1.17 +1.00 0.13 2.27 8.64 J084.6836+33.5786 Gaia EDR3 3449257139854626944 05 38 44.070 +33 34 43.039 2.177 +0.180 +0.046 13.8926 0.0033 1.083538 2185 97 +0.201 0.033 0.85 +1.33 0.10 2.00 8.89 J084.9321+37.2119 Gaia EDR3 189377859842561664 05 39 43.724 +37 12 43.056 2.024 +0.273 +0.118 14.6232 0.0057 1.838578 2046 116 +0.122 0.045 1.70 +1.33 0.12 2.05 8.78 J086.1147+31.8873 Gaia EDR3 3448105680601602048 05 44 27.548 +31 53 14.317 2.807 +0.130 +0.065 15.2939 0.0030 1.932094 2811 283 +0.252 0.013 1.00 +2.03 0.22 1.77 8.78 J086.1972+24.3919 Gaia EDR3 3428577117142074880 05 44 47.349 +24 23 31.095 4.039 0.267 0.179 14.0418 0.0029 1.818867 4052 434 0.009 0.087 1.50 0.48 0.24 2.97 8.57 J086.3082+11.2506 Gaia EDR3 3337017760238097664 05 45 13.974 +11 15 02.442 1.615 0.438 0.271 12.0344 0.0030 2.122828 1695 57 +0.026 0.011 1.00 0.12 0.07 2.72 8.65 J086.4762+23.3391 Gaia EDR3 3427626413242761856 05 45 54.299 +23 20 21.113 1.544 0.130 0.077 13.7338 0.0031 2.203900 1552 56 +0.326 0.105 1.43 +1.33 0.08 1.95 9.00 J086.5553+40.4840 Gaia EDR3 191794242803169920 05 46 13.292 +40 29 02.749 1.886 +0.327 +0.204 13.0681 0.0029 1.633911 1925 80 +0.123 0.007 0.62 +1.00 0.09 2.15 8.82 J086.8565+27.9110 Gaia EDR3 3443080736365795456 05 47 25.565 +27 54 39.651 3.241 0.061 0.011 15.0779 0.0042 3.586864 3242 357 +0.247 0.251 1.62 +0.87 0.24 2.14 8.91 J087.0695+34.3930 Gaia EDR3 3454688662875499520 05 48 16.696 +34 23 35.073 1.727 +0.132 +0.100 14.4142 0.0029 1.941033 1735 82 +0.223 0.037 1.32 +1.88 0.10 1.83 8.79 J087.1757+29.1833 Gaia EDR3 3443457426475467136 05 48 42.185 +29 11 00.093 1.420 0.003 +0.017 14.2574 0.0038 1.676034 1420 190 +0.354 0.416 1.00 +2.24 0.29 1.67 8.94 J087.2218+29.4548 Gaia EDR3 3443533052258430976 05 48 53.234 +29 27 17.365 2.081 +0.003 +0.032 13.7611 0.0030 1.103880 2081 83 +0.228 0.117 0.99 +1.16 0.09 2.04 8.92 J087.2751+25.3155 Gaia EDR3 3428987093240848640 05 49 06.044 +25 18 55.885 1.248 0.076 0.026 11.9445 0.0039 1.495326 1251 50 +0.027 0.047 0.59 +0.85 0.09 2.30 8.69 J088.2315+38.6528 Gaia EDR3 3457964004934635136 05 52 55.568 +38 39 10.186 3.339 +0.445 +0.370 13.6732 0.0030 1.840969 3389 238 0.008 0.013 0.97 +0.06 0.15 2.68 8.63 J089.0960+24.8012 Gaia EDR3 3428042754490731776 05 56 23.041 +24 48 04.511 3.179 0.266 0.003 15.4828 0.0032 1.363957 3190 284 +0.143 0.040 1.67 +1.28 0.19 2.05 8.82 J089.6385+19.6248 Gaia EDR3 3398736298547472768 05 58 33.253 +19 37 29.648 2.518 0.422 0.099 14.4676 0.0030 2.940504 2555 152 +0.177 0.160 1.28 +1.13 0.13 2.08 8.87 J089.7490+22.3852 Gaia EDR3 3424448416618489216 05 58 59.776 +22 23 06.916 2.729 0.343 0.036 14.4788 0.0031 1.828602 2751 169 +0.063 0.089 1.26 +1.00 0.13 2.21 8.73 J089.7821+14.0001 Gaia EDR3 3343881599015125248 05 59 07.711 +14 00 00.667 3.347 0.864 0.295 14.0068 0.0044 2.914186 3469 217 0.118 0.010 0.77 +0.56 0.14 2.82 8.19 J090.0237+21.9017 Gaia EDR3 3423296605171557504 06 00 05.708 +21 54 06.341 2.155 0.292 0.029 14.6374 0.0030 1.852552 2174 112 +0.160 0.046 1.60 +1.33 0.11 2.02 8.84 J090.3141+14.7489 Gaia EDR3 3345435449462667776 06 01 15.396 +14 44 56.346 3.380 0.847 0.248 14.8482 0.0031 2.366286 3493 330 +0.111 0.069 1.48 +0.61 0.20 2.31 8.80 J090.7455+31.0548 Gaia EDR3 3449912762321090176 06 02 58.925 +31 03 17.267 3.970 0.005 +0.299 14.8417 0.0031 1.918545 3981 490 0.127 0.016 1.36 +0.45 0.26 2.91 8.18 J090.7799+32.5180 Gaia EDR3 3450617063939465088 06 03 07.176 +32 31 05.063 3.655 +0.076 +0.323 15.6062 0.0046 3.392613 3670 456 +0.164 0.034 1.08 +1.70 0.27 1.91 8.74 J091.1746+24.8696 Gaia EDR3 3426554634224242816 06 04 41.925 +24 52 10.875 4.213 0.417 +0.120 15.7398 0.0037 2.587859 4235 645 +0.199 0.213 1.05 +1.55 0.33 1.93 8.86 J091.4130+26.0389 Gaia EDR3 3430055715464804864 06 05 39.138 +26 02 20.119 2.633 0.218 +0.110 13.9078 0.0032 1.653195 2644 187 +0.186 0.046 0.56 +1.23 0.15 2.04 8.88 J091.6776+11.6763 Gaia EDR3 3342350627854659200 06 06 42.643 +11 40 34.956 3.318 1.041 0.268 15.4398 0.0062 2.546904 3488 439 +0.182 0.095 0.89 +1.80 0.27 1.87 8.73 J091.7692+19.7434 Gaia EDR3 3374567972112361344 06 07 04.631 +19 44 36.301 1.820 0.334 0.013 14.8044 0.0034 1.901111 1850 102 +0.886 0.224 1.26 +2.18 0.12 1.53 9.44 J091.9664+24.5688 Gaia EDR3 3426334353938979712 06 07 51.942 +24 34 07.954 1.856 0.204 +0.068 12.7566 0.0032 2.593905 1868 80 +0.003 0.019 0.62 +0.78 0.09 2.37 8.65 J091.9955+27.3638 Gaia EDR3 3430281325805346560 06 07 58.919 +27 21 49.799 2.154 0.144 +0.131 13.3315 0.0029 2.264348 2163 59 +0.198 0.018 0.54 +1.11 0.06 2.07 8.89 J092.1616+30.8849 Gaia EDR3 3438220590031263488 06 08 38.791 +30 53 05.858 2.628 0.037 +0.244 14.1741 0.0043 2.167543 2640 124 0.018 0.013 1.76 +0.33 0.10 2.58 8.63 J093.1745+23.0573 Gaia EDR3 3425199073822806656 06 12 41.897 +23 03 26.375 1.585 0.226 +0.065 12.7228 0.0035 2.545983 1602 57 +0.035 0.010 0.62 +1.05 0.08 2.23 8.66 J093.7415+41.4780 Gaia EDR3 960127092776565504 06 14 57.982 +41 28 40.828 2.694 +0.383 +0.545 14.0878 0.0031 3.384194 2775 188 +0.200 0.012 0.35 +1.50 0.15 1.94 8.87 J093.9930+13.8659 Gaia EDR3 3344570095153338880 06 15 58.324 +13 51 57.366 1.992 0.593 0.050 13.2036 0.0034 4.428715 2079 59 0.030 0.013 1.04 +0.56 0.06 2.51 8.60 J094.2380+10.5337 Gaia EDR3 3329277370179300992 06 16 57.128 +10 32 01.512 2.107 0.751 0.107 13.3359 0.0034 2.086148 2240 90 +0.014 0.011 0.75 +0.83 0.09 2.33 8.66 J094.2801+22.2224 Gaia EDR3 3377000229273262464 06 17 07.246 +22 13 20.828 2.498 0.411 +0.126 15.2448 0.0037 2.216659 2535 238 +0.270 0.040 1.69 +1.49 0.20 1.92 8.95 J094.3323+15.5243 Gaia EDR3 3345042270976679296 06 17 19.752 +15 31 27.517 2.875 0.785 0.015 14.5985 0.0034 2.773137 2980 229 +0.186 0.091 1.56 +0.63 0.17 2.26 8.85 J094.7507+19.5193 Gaia EDR3 3373985986866233344 06 19 00.180 +19 31 09.652 2.794 0.591 +0.097 13.7843 0.0035 3.477698 2858 503 +0.190 0.179 0.98 +0.46 0.38 2.34 8.83 J094.9673+47.4169 Gaia EDR3 968928992593888896 06 19 52.158 +47 25 01.153 1.201 +0.282 +0.323 13.7027 0.0031 0.942541 1276 29 +0.449 0.007 0.27 +2.89 0.05 1.51 8.35 J095.0108+01.8715 Gaia EDR3 3124515178002448640 06 20 02.603 +01 52 17.560 2.081 1.091 0.252 13.7858 0.0035 2.379236 2363 91 +0.114 0.015 1.10 +0.81 0.08 2.23 8.81 J095.1623+09.4416 Gaia EDR3 3328904635738842240 06 20 38.975 +09 26 29.908 3.151 1.211 0.145 13.0599 0.0031 2.680946 3379 203 +0.021 0.038 0.62 0.20 0.13 2.77 8.64 J095.4959+23.6564 Gaia EDR3 3377580290376100864 06 21 59.020 +23 39 23.154 1.878 0.284 +0.150 13.7218 0.0040 2.412959 1905 68 +0.076 0.034 1.41 +0.90 0.08 2.23 8.76 J096.8934+14.9451 Gaia EDR3 3356762034138431488 06 27 34.421 +14 56 42.663 4.422 1.347 +0.131 14.9600 0.0035 1.445579 4624 548 0.015 0.171 0.98 +0.64 0.26 2.45 8.62 J097.1763+16.4813 Gaia EDR3 3369363914860764032 06 28 42.318 +16 28 52.975 2.907 0.818 +0.136 13.9936 0.0031 3.245951 3023 187 +0.080 0.041 0.64 +0.94 0.13 2.21 8.76 J097.4242+24.5808 Gaia EDR3 3383547992815165568 06 29 41.808 +24 34 50.984 2.180 0.329 +0.251 12.6711 0.0031 3.152217 2219 110 +0.130 0.015 0.53 +0.42 0.11 2.38 8.80 J097.6873+03.0070 Gaia EDR3 3124278752939435136 06 30 44.966 +03 00 25.394 1.967 1.041 0.125 13.3766 0.0036 1.633668 2229 261 +0.087 0.143 1.14 +0.47 0.25 2.39 8.77 J097.8891-02.7981 Gaia EDR3 3117203739213080320 06 31 33.393 -02 47 53.445 1.408 0.920 0.168 13.4002 0.0055 2.500117 1690 53 +0.111 0.028 0.88 +1.34 0.07 2.05 8.76 J097.9021-12.7568 Gaia EDR3 2952057092722928512 06 31 36.519 -12 45 24.652 3.947 3.575 0.950 15.1616 0.0031 4.403193 5410 668 +0.096 0.008 0.62 +0.84 0.26 2.23 8.79 J098.3181-07.1966 Gaia EDR3 3006903756370947200 06 33 16.365 -07 11 48.013 1.032 0.786 0.166 12.5661 0.0033 1.777259 1308 20 +0.017 0.008 1.14 +0.84 0.03 2.32 8.67 J098.5294-00.6734 Gaia EDR3 3119219178384615680 06 34 07.071 -00 40 24.297 1.124 0.691 0.096 12.2876 0.0031 1.756423 1323 23 +0.009 0.033 0.89 +0.71 0.04 2.38 8.67 J098.5904+17.0987 Gaia EDR3 3370947211604288512 06 34 21.697 +17 05 55.655 3.429 0.969 +0.253 14.6223 0.0032 1.494752 3572 271 +0.068 0.080 0.80 +1.05 0.16 2.18 8.74 J098.6389+19.1051 Gaia EDR3 3371482669469578752 06 34 33.350 +19 06 18.596 2.284 0.570 +0.206 12.9173 0.0031 3.274034 2363 90 +0.042 0.010 0.56 +0.48 0.08 2.43 8.72 J098.6603-02.9952 Gaia EDR3 3105147388056955648 06 34 38.494 -02 59 42.730 3.244 2.163 0.348 15.4711 0.0035 3.230228 3914 527 +0.308 0.199 1.21 +1.27 0.30 1.97 8.98 J098.8005+06.4102 Gaia EDR3 3132150087966065280 06 35 12.130 +06 24 36.783 2.084 0.989 0.027 13.6585 0.0041 5.645326 2307 74 +0.220 0.310 0.90 +0.94 0.07 2.13 8.90 J098.8719+18.1926 Gaia EDR3 3371169106793702912 06 35 29.270 +18 11 33.380 3.106 0.828 +0.270 13.6022 0.0035 2.237143 3225 172 0.001 0.070 0.57 +0.50 0.12 2.48 8.66 J099.0745+18.8221 Gaia EDR3 3371413537674000896 06 36 17.897 +18 49 19.635 1.714 0.442 +0.163 13.0924 0.0031 2.237610 1777 45 +0.105 0.011 0.44 +1.40 0.05 2.04 8.73 J099.2222+00.8030 Gaia EDR3 3120576662929339520 06 36 53.343 +00 48 10.826 1.730 1.021 0.101 13.4288 0.0037 8.348570 2011 79 0.080 0.133 1.76 +0.15 0.09 2.82 8.49 J099.6300+18.6987 Gaia EDR3 3371580839539015168 06 38 31.210 +18 41 55.351 3.316 0.876 +0.340 14.9543 0.0035 0.729200 3446 422 +0.069 0.028 0.81 +1.42 0.26 2.07 8.62 J099.6853+17.3396 Gaia EDR3 3359006648466147968 06 38 44.489 +17 20 22.562 2.112 0.607 +0.196 12.9434 0.0030 1.722808 2206 162 +0.041 0.036 0.67 +0.54 0.16 2.40 8.72 J100.1756+00.2310 Gaia EDR3 3119551127818713984 06 40 42.143 +00 13 51.695 1.811 1.110 0.085 13.7892 0.0034 1.461506 2126 92 +0.082 0.071 1.05 +1.09 0.09 2.16 8.75 J100.3063+00.9026 Gaia EDR3 3125802538617129344 06 41 13.520 +00 54 09.510 2.780 1.668 0.105 14.2538 0.0032 2.400151 3244 223 0.113 0.080 1.90 0.21 0.15 3.12 8.40 J100.6219+02.4457 Gaia EDR3 3126824087999901184 06 42 29.256 +02 26 44.784 2.745 1.568 0.048 15.2004 0.0041 2.672425 3162 320 +0.185 0.159 1.64 +1.05 0.22 2.10 8.88 J100.7339+03.0338 Gaia EDR3 3127282000233416704 06 42 56.155 +03 02 01.854 1.765 0.989 0.018 13.8472 0.0037 1.305920 2023 82 +0.057 0.113 1.29 +1.02 0.09 2.21 8.72 J101.0527+00.4465 Gaia EDR3 3125571400658095872 06 44 12.650 +00 26 47.729 3.649 2.254 0.105 14.9604 0.0034 2.284570 4290 444 0.027 0.261 1.21 +0.54 0.22 2.51 8.61 J101.1640-09.7055 Gaia EDR3 2954359023396877952 06 44 39.365 -09 42 20.120 4.209 3.637 0.575 15.2700 0.0038 4.103059 5592 913 +0.106 0.334 0.61 +0.91 0.35 2.20 8.80 J101.1743+21.6307 Gaia EDR3 3378235530585937280 06 44 41.849 +21 37 50.549 3.952 0.898 +0.589 13.9466 0.0032 2.928838 4095 446 +0.006 0.010 0.28 +0.58 0.23 2.44 8.67 J101.3758+01.7599 Gaia EDR3 3125978082521883520 06 45 30.194 +01 45 35.835 1.676 0.995 0.018 13.1192 0.0033 1.278825 1949 65 +0.001 0.009 0.73 +0.93 0.07 2.32 8.61 J101.4384+09.9330 Gaia EDR3 3350693726383641984 06 45 45.230 +09 55 59.142 2.943 1.276 +0.183 14.4764 0.0033 5.071231 3213 240 +0.251 0.035 0.77 +1.14 0.16 2.04 8.93 J101.5831+07.1368 Gaia EDR3 3133176860025981568 06 46 19.948 +07 08 12.660 2.637 1.286 +0.109 14.3717 0.0029 1.899468 2936 240 +0.098 0.033 0.84 +1.16 0.18 2.12 8.77 J102.5257-00.7905 Gaia EDR3 3113138501131391104 06 50 06.184 -00 47 26.063 3.769 2.493 0.052 15.1167 0.0032 1.532218 4519 657 +0.207 0.168 1.30 +0.51 0.31 2.31 8.85 J102.8631-08.4771 Gaia EDR3 3050995856277736192 06 51 27.165 -08 28 37.532 1.784 1.523 0.158 14.1116 0.0028 3.637115 2351 107 +0.215 0.010 0.82 +1.43 0.10 1.96 8.90 J102.9289-19.4359 Gaia EDR3 2933202014498055936 06 51 42.948 -19 26 09.558 0.803 0.970 0.192 13.9002 0.0029 0.770109 1273 26 +0.474 0.012 0.54 +2.81 0.04 1.49 8.93
(1) (2) (3) (4) (5) (6) (7) (8) (9) (10) (11) (12) (13) (14) (15) (16) (17) (18) (19) ID_ATO ID_EDR3 RA(J2000) Dec(J2000) X Y Z e_ _rot e_ ()0 e_()0 M e_M Mass (hh mm ss.sss) (dd mm ss.sss) (kpc) (kpc) (kpc) (mag) (mag) (d) (pc) (pc) (mag) (mag) (mag) (mag) (mag) (Msun) (yrs) J103.3079+10.5510 Gaia EDR3 3159021155714729472 06 53 13.898 +10 33 03.368 2.613 1.148 +0.259 13.5394 0.0035 1.542512 2865 181 +0.029 0.044 0.20 +1.06 0.14 2.23 8.65 J103.8302-21.8643 Gaia EDR3 2925856280391227392 06 55 19.270 -21 51 51.860 1.340 1.776 0.351 14.7461 0.0030 1.685637 2252 91 +0.427 0.028 0.33 +2.63 0.09 1.55 8.89 J103.8576-00.4954 Gaia EDR3 3112497245331079936 06 55 25.828 -00 29 43.490 3.195 2.141 +0.044 13.7489 0.0031 1.958371 3846 284 +0.030 0.298 0.79 +0.03 0.16 2.64 8.67 J104.5104-01.8353 Gaia EDR3 3112035828406024960 06 58 02.496 -01 50 07.370 2.557 1.812 +0.035 14.9317 0.0033 2.534619 3134 309 +0.111 0.283 0.69 +1.74 0.21 1.94 8.53 J105.0327+06.1169 Gaia EDR3 3129646018951520512 07 00 07.860 +06 07 01.002 3.113 1.688 +0.292 13.9587 0.0034 3.901667 3553 236 +0.124 0.019 0.62 +0.56 0.14 2.32 8.80 J105.3860-21.3214 Gaia EDR3 2928971334276898944 07 01 32.642 -21 19 17.200 0.803 1.071 0.174 13.6448 0.0028 0.800163 1350 27 +0.537 0.009 0.41 +2.58 0.04 1.50 9.24 J105.5347-01.9077 Gaia EDR3 3109062371007803776 07 02 08.333 -01 54 27.955 2.662 1.923 +0.087 13.8002 0.0036 2.944283 3285 149 0.029 0.048 0.64 +0.57 0.10 2.51 8.60 J105.6391-13.1320 Gaia EDR3 3044811343886708608 07 02 33.393 -13 07 55.376 2.646 2.729 0.234 15.1346 0.0029 1.537205 3808 410 +0.118 0.044 0.96 +1.27 0.24 2.07 8.79 J105.9212-15.5797 Gaia EDR3 2936164889096440192 07 03 41.100 -15 34 47.208 0.884 0.988 0.102 12.5845 0.0030 1.616409 1329 77 +0.192 0.011 0.51 +1.44 0.13 1.97 8.87 J105.9294+02.6272 Gaia EDR3 3115630406794434176 07 03 43.056 +02 37 38.235 2.351 1.468 +0.190 14.1671 0.0031 2.226779 2778 204 +0.066 0.027 0.39 +1.54 0.16 2.04 8.52 J106.2127-00.9740 Gaia EDR3 3109566875045011584 07 04 51.051 -00 58 26.651 1.803 1.278 +0.098 13.6232 0.0035 2.027484 2212 73 +0.072 0.025 0.34 +1.52 0.07 2.04 8.56 J106.4471-03.7806 Gaia EDR3 3107804838943634304 07 05 47.322 -03 46 50.281 2.865 2.233 +0.093 14.3678 0.0034 2.670424 3634 319 +0.013 0.047 0.58 +0.97 0.19 2.28 8.63 J106.5580+18.8987 Gaia EDR3 3361893764140100096 07 06 13.942 +18 53 55.622 6.284 1.983 +1.359 14.9067 0.0037 3.271069 6728 979 0.077 0.012 0.07 +0.67 0.31 2.61 8.40 J106.7195-14.1516 Gaia EDR3 3044457576020575744 07 06 52.687 -14 09 05.914 1.738 1.882 0.137 14.8783 0.0032 2.774142 2566 434 +0.280 0.111 1.10 +1.69 0.37 1.85 8.95 J107.2480-12.7673 Gaia EDR3 3044897483752096256 07 08 59.543 -12 46 02.633 1.900 1.986 0.094 14.1566 0.0033 2.951689 2750 142 +0.276 0.029 1.16 +0.80 0.11 2.16 8.92 J108.1121-08.8579 Gaia EDR3 3048321122442630400 07 12 26.921 -08 51 28.542 1.354 1.272 +0.019 13.1451 0.0030 1.944000 1858 46 +0.157 0.006 0.43 +1.37 0.05 2.01 8.83 J108.1707-08.2617 Gaia EDR3 3051756477804650624 07 12 40.978 -08 15 42.222 2.223 2.051 +0.048 14.0242 0.0029 2.079303 3025 188 0.014 0.133 1.11 +0.50 0.13 2.50 8.63 J108.2723-11.0753 Gaia EDR3 3045550765453488768 07 13 05.355 -11 04 31.191 2.121 2.139 0.016 15.4240 0.0037 1.732496 3012 257 +0.056 0.162 2.71 +0.27 0.18 2.50 8.72 J108.3588-12.4968 Gaia EDR3 3045104535537115008 07 13 26.123 -12 29 48.781 1.965 2.074 0.044 14.4735 0.0029 3.078432 2857 122 +0.116 0.014 0.85 +1.34 0.09 2.05 8.77 J108.6795-07.3062 Gaia EDR3 3051966621964045952 07 14 43.083 -07 18 22.381 2.096 1.893 +0.089 14.3276 0.0030 1.828566 2825 142 +0.087 0.074 0.56 +1.49 0.11 2.03 8.64 J108.7050-20.4362 Gaia EDR3 2930001812880632576 07 14 49.204 -20 26 10.416 1.052 1.434 0.133 13.2960 0.0028 2.359520 1784 38 +0.212 0.008 0.53 +1.51 0.05 1.93 8.89 J108.7797-22.5861 Gaia EDR3 2927954590949675904 07 15 07.147 -22 35 10.314 2.126 3.116 0.342 14.2677 0.0032 1.460651 3787 319 +0.084 0.024 0.74 +0.63 0.18 2.33 8.77 J109.4314-15.7080 Gaia EDR3 3031253300366764416 07 17 43.550 -15 42 28.802 2.265 2.687 0.089 14.9541 0.0036 3.587642 3516 344 +0.195 0.250 1.41 +0.82 0.21 2.18 8.87 J109.5054-14.0571 Gaia EDR3 3032637546843653376 07 18 01.315 -14 03 25.575 1.902 2.146 0.031 12.6786 0.0029 1.948277 2868 152 0.036 0.011 0.59 0.20 0.12 2.87 8.57 J109.7734-07.1470 Gaia EDR3 3054942037866252288 07 19 05.632 -07 08 49.261 2.478 2.267 +0.167 13.9320 0.0031 1.858906 3363 264 0.039 0.050 0.44 +0.84 0.17 2.44 8.50 J110.1723-23.4818 Gaia EDR3 5617891650669025792 07 20 41.375 -23 28 54.704 1.227 1.895 0.176 14.9461 0.0029 1.657834 2265 114 +0.318 0.509 1.73 +1.43 0.11 1.92 9.00 J110.2057-08.5343 Gaia EDR3 3048588028890791936 07 20 49.371 -08 32 03.657 2.187 2.103 +0.136 15.0582 0.0044 2.501694 3038 190 +0.270 0.130 0.36 +2.26 0.14 1.71 8.61 J110.2507-12.0207 Gaia EDR3 3034664500832358912 07 21 00.190 -12 01 14.838 2.664 2.855 +0.066 14.9108 0.0036 1.607134 3906 365 +0.024 0.074 0.98 +0.96 0.20 2.27 8.66 J110.2675-03.2520 Gaia EDR3 3059901071523913856 07 21 04.208 -03 15 07.462 1.565 1.278 +0.180 12.5848 0.0057 2.809982 2029 92 +0.114 0.026 0.01 +0.99 0.10 2.16 8.81 J110.3902-17.5039 Gaia EDR3 3027827978047324544 07 21 33.657 -17 30 14.402 1.792 2.285 0.075 14.8237 0.0035 2.618199 2905 208 +0.033 0.361 1.49 +1.00 0.16 2.25 8.67 J110.4158-24.8742 Gaia EDR3 5616860377480409344 07 21 39.816 -24 52 27.459 1.476 2.401 0.242 14.7029 0.0031 1.275878 2829 169 +0.062 0.063 1.06 +1.37 0.13 2.10 8.62 J110.4771-08.9354 Gaia EDR3 3047764735202190464 07 21 54.524 -08 56 07.674 2.339 2.287 +0.150 14.4830 0.0031 2.377864 3275 183 +0.197 0.031 0.51 +1.38 0.12 1.98 8.88 J110.9074-12.0800 Gaia EDR3 3034627426673874304 07 23 37.800 -12 04 48.109 1.741 1.889 +0.068 13.5939 0.0031 1.647087 2569 115 +0.099 0.072 0.71 +0.83 0.10 2.24 8.79 J110.9088+00.6468 Gaia EDR3 3110806948062742656 07 23 38.127 +00 38 48.538 0.768 0.559 +0.124 12.0645 0.0045 6.048553 958 21 +0.202 0.029 0.76 +1.38 0.05 1.98 8.89 J110.9392-21.9535 Gaia EDR3 5619699316501817984 07 23 45.411 -21 57 12.817 1.500 2.228 0.146 14.2400 0.0032 1.609184 2690 121 +0.053 0.034 1.32 +0.75 0.10 2.31 8.74 J111.1535-20.9269 Gaia EDR3 5619923926116738432 07 24 36.844 -20 55 37.074 1.747 2.518 0.132 13.3500 0.0029 1.573938 3067 103 +0.064 0.050 0.53 +0.38 0.07 2.45 8.74 J111.2165-23.1396 Gaia EDR3 5619369669171589632 07 24 51.977 -23 08 22.642 2.174 3.376 0.242 14.6298 0.0031 7.770775 4023 305 +0.051 0.029 1.65 0.05 0.16 2.66 8.68 J112.1996-20.1412 Gaia EDR3 5620435508258520832 07 28 47.925 -20 08 28.481 1.388 1.984 0.052 13.3988 0.0030 5.587132 2422 60 +0.050 0.005 0.65 +0.82 0.05 2.28 8.73 J112.7672-19.4071 Gaia EDR3 5716567630938745088 07 31 04.144 -19 24 25.681 1.429 2.013 0.017 13.3513 0.0031 1.769319 2468 70 +0.072 0.078 0.75 +0.62 0.06 2.34 8.76 J112.8463-20.1548 Gaia EDR3 5620395135564902400 07 31 23.120 -20 09 17.513 1.247 1.802 0.027 13.5636 0.0029 1.345138 2192 119 +0.095 0.008 0.67 +1.16 0.12 2.12 8.77 J113.2387-19.4340 Gaia EDR3 5716581031237970304 07 32 57.300 -19 26 02.616 1.468 2.086 0.001 13.3008 0.0030 2.273453 2551 74 0.002 0.043 1.17 +0.09 0.06 2.66 8.64 J113.5306-15.0738 Gaia EDR3 3029887810007115264 07 34 07.361 -15 04 25.861 2.373 2.950 +0.154 14.5531 0.0031 2.449479 3789 268 +0.166 0.076 0.85 +0.80 0.15 2.20 8.85 J113.7045-18.5902 Gaia EDR3 5716740529142761472 07 34 49.091 -18 35 24.839 1.268 1.767 +0.029 13.6235 0.0029 3.116609 2175 67 +0.433 0.175 0.63 +1.29 0.07 1.94 9.05 J113.8870-24.3497 Gaia EDR3 5615293573412352256 07 35 32.884 -24 20 59.355 1.732 2.936 0.112 14.6048 0.0033 1.424931 3411 251 +0.054 0.043 1.05 +0.88 0.16 2.26 8.73 J114.2059-18.3864 Gaia EDR3 5717113641542052864 07 36 49.431 -18 23 11.234 1.869 2.610 +0.072 15.3662 0.0030 1.379164 3211 290 +0.315 0.179 1.45 +1.37 0.20 1.94 8.99 J114.4350-24.3432 Gaia EDR3 5615128474874397440 07 37 44.412 -24 20 35.581 1.324 2.265 0.066 14.8710 0.0032 2.242821 2625 184 +0.215 0.026 1.64 +1.11 0.15 2.07 8.90 J114.4848-21.4294 Gaia EDR3 5619270747487432448 07 37 56.376 -21 25 46.118 1.625 2.520 +0.001 13.8852 0.0035 2.972624 2998 132 +0.083 0.179 0.75 +0.74 0.10 2.28 8.77 J114.8681-18.8011 Gaia EDR3 5716848899758250624 07 39 28.367 -18 48 04.202 1.770 2.534 +0.088 14.3776 0.0040 2.485193 3092 170 +0.121 0.211 1.56 +0.36 0.12 2.41 8.78 J114.9662-29.1402 Gaia EDR3 5599763590149196032 07 39 51.901 -29 08 24.806 0.905 1.865 0.123 13.0419 0.0029 1.842183 2077 60 +0.114 0.026 0.43 +1.02 0.06 2.15 8.81 J115.0928-10.6198 Gaia EDR3 3040276064580646912 07 40 22.289 -10 37 11.301 2.127 2.364 +0.324 14.3393 0.0033 1.908329 3196 217 +0.021 0.012 0.06 +1.77 0.15 J115.2178-25.5994 Gaia EDR3 5614180592769077248 07 40 52.286 -25 35 58.010 1.490 2.704 0.078 13.4778 0.0030 2.097984 3088 114 +0.013 0.012 0.66 +0.36 0.08 2.52 8.68 J115.2306-17.0845 Gaia EDR3 5717317085555220096 07 40 55.354 -17 05 04.405 2.021 2.755 +0.165 14.2894 0.0030 1.214488 3420 196 +0.034 0.057 0.69 +0.92 0.12 2.27 8.69 J115.2403-24.8545 Gaia EDR3 5614295526096577920 07 40 57.689 -24 51 16.299 1.858 3.284 0.070 15.1178 0.0030 1.893434 3774 275 +0.201 0.029 0.83 +1.38 0.16 1.98 8.89 J116.0922-28.4220 Gaia EDR3 5599913639125075328 07 44 22.133 -28 25 19.543 1.557 3.190 0.135 15.0275 0.0032 2.682821 3553 326 +0.183 0.089 1.10 +1.14 0.20 2.07 8.87 J116.2532-21.3016 Gaia EDR3 5712207758099475840 07 45 00.771 -21 18 05.881 1.211 1.929 +0.060 13.6462 0.0029 3.280127 2278 104 +0.156 0.155 0.45 +1.40 0.10 2.00 8.82 J116.3042-11.2203 Gaia EDR3 3037077310375003648 07 45 13.016 -11 13 13.089 2.376 2.746 +0.418 13.7169 0.0032 2.061657 3655 329 0.063 0.064 0.33 +0.57 0.20 2.60 8.49 J116.3339-28.7092 Gaia EDR3 5599847015590653184 07 45 20.140 -28 42 33.382 1.899 3.951 0.163 15.5904 0.0033 1.514279 4387 509 +0.167 0.044 1.32 +1.04 0.25 2.11 8.86 J116.4925-16.0440 Gaia EDR3 5718996005449601536 07 45 58.219 -16 02 38.495 2.117 2.854 +0.269 14.5629 0.0031 1.807299 3564 302 +0.161 0.045 0.07 +1.72 0.18 1.91 8.72 J116.5342-19.8451 Gaia EDR3 5715755744681588608 07 46 08.216 -19 50 42.441 13.9075 0.0059 1.860305 0 J116.5376-20.4285 Gaia EDR3 5715650638239585920 07 46 09.041 -20 25 42.645 1.408 2.190 +0.099 13.9076 0.0029 1.682906 2606 105 +0.057 0.124 0.66 +1.16 0.09 2.16 8.69 J116.6244-18.2192 Gaia EDR3 5716944213671349760 07 46 29.880 -18 13 09.334 1.949 2.824 +0.201 14.4120 0.0032 1.615868 3438 239 +0.189 0.037 0.53 +1.19 0.15 2.05 8.88 J116.6529-30.1024 Gaia EDR3 5598677203938894080 07 46 36.699 -30 06 08.772 1.605 3.553 0.176 14.3816 0.0038 2.273473 3902 201 +0.102 0.034 0.63 +0.77 0.11 2.26 8.79 J116.8586-29.7166 Gaia EDR3 5598969845827526528 07 47 26.081 -29 42 59.926 1.246 2.727 0.117 14.2228 0.0033 2.245591 3000 136 +0.268 0.018 1.24 +0.57 0.10 2.26 8.88 J117.1588-19.3073 Gaia EDR3 5715872224194437632 07 48 38.137 -19 18 26.576 1.791 2.715 +0.185 14.1542 0.0034 2.776477 3258 209 +0.209 0.011 0.38 +1.22 0.14 2.03 8.90 J117.4249-26.8279 Gaia EDR3 5601626472083501696 07 49 41.982 -26 49 40.491 1.701 3.368 0.023 14.5315 0.0040 2.784376 3773 270 +0.192 0.116 0.57 +1.07 0.15 2.09 8.88 J117.6125-26.0800 Gaia EDR3 5602249379782658944 07 50 27.013 -26 04 48.074 1.323 2.557 +0.009 14.1958 0.0030 4.750825 2880 165 +0.169 0.016 0.48 +1.40 0.12 1.99 8.84 J117.7143-28.9873 Gaia EDR3 5600519225204862336 07 50 51.455 -28 59 14.317 1.909 4.128 0.097 14.3923 0.0029 1.505937 4549 337 +0.099 0.015 1.06 +0.03 0.16 2.58 8.73 J117.8237-09.5101 Gaia EDR3 3040695974941812736 07 51 17.702 -09 30 36.468 1.246 1.402 +0.287 12.9492 0.0033 1.789376 1898 125 0.069 0.012 0.15 +1.42 0.14 J118.1364-26.0263 Gaia EDR3 5602054422627227520 07 52 32.749 -26 01 35.059 2.099 4.091 +0.049 14.1629 0.0030 3.159168 4598 275 +0.051 0.065 0.86 0.02 0.13 2.64 8.69 J118.1717-28.2232 Gaia EDR3 5600675394523048448 07 52 41.220 -28 13 23.699 1.425 3.020 0.029 14.6811 0.0030 1.836496 3339 172 +0.049 0.011 1.13 +0.92 0.11 2.25 8.72
(1) (2) (3) (4) (5) (6) (7) (8) (9) (10) (11) (12) (13) (14) (15) (16) (17) (18) (19) ID_ATO ID_EDR3 RA(J2000) Dec(J2000) X Y Z e_ _rot e_ ()0 e_()0 M e_M Mass (hh mm ss.sss) (dd mm ss.sss) (kpc) (kpc) (kpc) (mag) (mag) (d) (pc) (pc) (mag) (mag) (mag) (mag) (mag) (Msun) (yrs) J118.3027-29.5272 Gaia EDR3 5600243389532206464 07 53 12.664 -29 31 38.226 1.475 3.300 0.067 15.2374 0.0031 3.258970 3616 307 +0.160 0.090 0.82 +1.60 0.18 1.94 8.78 J118.6780-30.9643 Gaia EDR3 5595430895857226240 07 54 42.730 -30 57 51.688 0.944 2.258 0.065 13.7257 0.0034 1.914314 2448 103 +0.076 0.011 0.79 +0.97 0.09 2.20 8.76 J118.9841-27.5769 Gaia EDR3 5601086233914919424 07 55 56.190 -27 34 37.034 1.197 2.515 +0.022 13.7855 0.0031 1.201602 2785 111 +0.147 0.008 0.57 +0.98 0.09 2.15 8.84 J119.0168-28.8107 Gaia EDR3 5600407835242829568 07 56 04.039 -28 48 38.798 1.922 4.242 0.013 14.9111 0.0034 1.298072 4657 461 0.017 0.075 0.86 +0.69 0.21 2.44 8.61 J120.3173-30.6071 Gaia EDR3 5596989900267016704 08 01 16.155 -30 36 25.783 1.231 3.009 0.008 14.3856 0.0031 1.635983 3251 155 +0.277 0.017 0.56 +1.25 0.10 1.99 8.96 J120.9589-17.2768 Gaia EDR3 5715047315593195008 08 03 50.154 -17 16 36.772 1.100 1.675 +0.260 14.2869 0.0030 0.769542 2021 225 +0.577 0.005 0.01 +2.73 0.24 1.45 9.30 J121.7666-30.2091 Gaia EDR3 5596596103307222144 08 07 03.994 -30 12 32.899 1.224 3.040 +0.065 15.3611 0.0039 1.623933 3278 233 +0.189 0.077 1.07 +1.69 0.15 1.90 8.80 J121.7955-28.6294 Gaia EDR3 5597610093546202752 08 07 10.930 -28 37 46.052 1.185 2.760 +0.105 13.5481 0.0031 1.831770 3005 120 0.028 0.014 0.43 +0.73 0.09 2.45 8.57 J121.8181-25.3414 Gaia EDR3 5697706196160845568 08 07 16.348 -25 20 29.220 0.705 1.445 +0.107 12.2134 0.0031 5.049751 1612 41 +0.050 0.008 0.06 +1.11 0.06 2.19 8.68 J127.2306-24.4682 Gaia EDR3 5695756865121458944 08 28 55.360 -24 28 05.742 1.307 2.937 +0.472 13.4228 0.0031 1.760478 3249 186 0.101 0.007 0.17 +0.69 0.12 2.70 8.23 J265.2024+10.6314 Gaia EDR3 4492510575866960000 17 40 48.586 +10 37 53.171 +3.429 +2.371 +1.555 14.2487 0.0051 0.742114 4449 438 +0.552 0.019 0.32 +0.65 0.21 2.08 9.05 J271.8730-19.3670 Gaia EDR3 4095137796471886080 18 07 29.530 -19 22 01.409 +1.788 +0.340 +0.016 13.1280 0.0031 1.379003 1820 60 +0.039 0.020 1.51 +0.30 0.07 2.51 8.71 J275.4103-19.5093 Gaia EDR3 4094521726396476672 18 21 38.481 -19 30 33.576 +2.076 +0.450 0.093 14.5695 0.0034 2.360844 2126 172 +0.021 0.480 2.78 +0.13 0.18 2.61 8.68 J275.6627-12.0194 Gaia EDR3 4153257053415199360 18 22 39.051 -12 01 10.048 +1.308 +0.450 +0.020 12.7122 0.0030 2.767335 1384 39 +0.134 0.207 1.05 +0.89 0.06 2.19 8.83 J276.9001-13.4054 Gaia EDR3 4104464919291577984 18 27 36.034 -13 24 19.463 +2.801 +0.927 0.047 14.4466 0.0036 2.602447 2950 216 +0.344 0.064 1.98 +0.10 0.16 2.46 8.83 J277.0437-19.4213 Gaia EDR3 4093068618757395584 18 28 10.509 -19 25 16.933 +1.621 +0.375 0.111 12.8054 0.0048 1.812403 1667 51 +0.299 0.048 0.68 +1.00 0.07 2.08 8.95 J277.6324-12.9737 Gaia EDR3 4104875238943201536 18 30 31.778 -12 58 25.362 +2.154 +0.743 0.053 14.1326 0.0042 1.801325 2279 170 +0.130 0.184 1.60 +0.72 0.16 2.25 8.82 J279.0944-07.2749 Gaia EDR3 4252839581007062272 18 36 22.664 -07 16 29.628 +1.625 +0.749 +0.000 14.2987 0.0038 3.236192 1789 72 +0.301 0.016 1.97 +1.06 0.09 2.05 8.96 J279.6357-11.8797 Gaia EDR3 4106502967189674368 18 38 32.575 -11 52 47.168 +1.277 +0.488 0.061 13.2288 0.0035 2.179231 1368 32 +0.290 0.011 1.63 +0.90 0.05 2.12 8.94 J280.0484-07.0582 Gaia EDR3 4252761137808845696 18 40 11.638 -07 03 29.796 +2.288 +1.085 0.032 13.8821 0.0044 2.216235 2533 116 +0.193 0.031 1.64 +0.26 0.10 2.43 8.81 J282.9649-13.5589 Gaia EDR3 4102192778511285120 18 51 51.578 -13 33 32.154 +1.951 +0.744 0.228 11.6414 0.0075 1.271750 2101 124 +0.317 0.035 0.71 0.66 0.13 2.75 8.71 J289.9475+15.3004 Gaia EDR3 4320708929142333568 19 19 47.421 +15 18 01.509 +1.770 +2.090 +0.039 14.2774 0.0036 2.598937 2739 220 +0.057 0.096 1.93 +0.14 0.17 2.56 8.71 J299.4473+32.3039 Gaia EDR3 2034049889560166016 19 57 47.367 +32 18 14.238 +1.279 +3.298 +0.102 14.9055 0.0035 1.723220 3539 264 +0.032 0.250 2.19 0.06 0.16 2.69 8.67 J300.8633+39.6355 Gaia EDR3 2074018477252787584 20 03 27.199 +39 38 08.233 +0.698 +2.726 +0.223 13.2111 0.0031 2.347255 2823 155 0.073 0.044 0.74 +0.20 0.12 2.78 8.51 J301.0209+31.3865 Gaia EDR3 2030794854079584768 20 04 05.030 +31 23 11.788 +1.163 +2.986 +0.002 14.4842 0.0030 1.641778 3205 204 +0.039 0.149 1.92 +0.00 0.14 2.65 8.68 J302.2996+32.2037 Gaia EDR3 2054874502319741824 20 09 11.914 +32 12 13.608 +0.558 +1.534 0.012 13.5948 0.0038 1.178096 1632 30 0.124 0.305 1.77 +0.76 0.04 2.78 7.87 J305.4541+39.4820 Gaia EDR3 2061438002621031168 20 21 49.005 +39 28 55.534 +0.358 +1.609 +0.043 13.1189 0.0033 1.565190 1649 27 0.086 0.011 2.63 0.61 0.04 3.23 8.44 J306.8515+38.9758 Gaia EDR3 2064160840081582592 20 27 24.383 +38 58 33.194 +0.365 +1.670 +0.009 14.6958 0.0039 1.381301 1710 59 +0.074 0.259 2.70 +0.82 0.08 2.26 8.76 J306.9801+45.3863 Gaia EDR3 2070928849556576256 20 27 55.240 +45 23 11.037 +0.200 +1.617 +0.113 13.1856 0.0031 1.558536 1633 27 +0.007 0.008 1.52 +0.58 0.04 2.43 8.67 J308.7048+45.8077 Gaia EDR3 2071178644852414080 20 34 49.169 +45 48 28.035 +0.241 +2.295 +0.131 13.5256 0.0034 0.970713 2311 65 0.730 0.444 2.64 0.96 0.06 J310.1614-15.1051 Gaia EDR3 6887222608825741440 20 40 38.745 -15 06 18.310 +4.719 +2.828 3.288 14.5233 0.0041 0.795110 6409 507 +0.599 0.015 0.18 +0.29 0.17 2.24 8.95 J311.5037+47.0071 Gaia EDR3 2166724143728120832 20 46 00.901 +47 00 25.601 +0.137 +2.023 +0.086 12.6766 0.0035 2.701917 2030 40 0.166 0.341 1.19 0.07 0.04 3.36 8.14 J315.2267+51.3206 Gaia EDR3 2169422654485439616 21 00 54.433 +51 19 14.273 0.034 +1.921 +0.112 13.6476 0.0030 0.964536 1924 42 0.231 0.041 3.74 1.52 0.05 4.80 7.97 J315.9822+55.3700 Gaia EDR3 2188897204438678400 21 03 55.728 +55 22 12.064 0.108 +1.410 +0.140 14.1281 0.0036 2.644264 1421 175 +0.408 0.010 1.58 +1.73 0.27 1.79 9.08 J317.2429+45.6406 Gaia EDR3 2162570394956913920 21 08 58.303 +45 38 26.272 +0.084 +2.080 0.053 15.3574 0.0029 1.896461 2082 118 +0.597 0.011 0.95 +2.78 0.12 1.44 9.33 J317.2517+45.2742 Gaia EDR3 2162544144116244352 21 09 00.431 +45 16 27.271 +0.082 +1.821 0.054 13.0174 0.0032 1.385039 1824 43 +0.170 0.012 1.36 +0.33 0.05 2.40 8.81 J317.6917+45.2552 Gaia EDR3 2162500232369128576 21 10 46.026 +45 15 18.868 +0.137 +3.295 0.112 14.1725 0.0031 2.351053 3300 143 0.084 0.032 0.87 +0.70 0.09 2.62 8.34 J318.9587+44.0280 Gaia EDR3 1971527187299417728 21 15 50.111 +44 01 40.927 +0.065 +1.402 0.085 12.1206 0.0029 1.266083 1406 21 0.028 0.007 1.01 +0.36 0.03 2.59 8.61 J319.0262+51.3139 Gaia EDR3 2172227852252643840 21 16 06.302 +51 18 50.250 0.084 +1.851 +0.051 13.7517 0.0035 2.200647 1853 49 0.055 0.051 2.26 +0.14 0.06 2.75 8.55 J320.8569+54.0590 Gaia EDR3 2175923379549109760 21 23 25.672 +54 03 32.752 0.089 +0.954 +0.046 12.3628 0.0032 1.274577 959 15 +0.345 0.055 2.13 +0.32 0.03 2.25 8.95 J321.3283+53.8969 Gaia EDR3 2175962377854306944 21 25 18.802 +53 53 48.999 0.158 +1.659 +0.070 14.0211 0.0033 1.124518 1668 39 0.384 0.034 3.43 0.54 0.05 J321.3875+49.7047 Gaia EDR3 2171065737185099392 21 25 33.024 +49 42 17.159 0.074 +1.662 0.018 14.5533 0.0039 2.509597 1664 51 +0.207 0.015 1.77 +1.65 0.07 1.90 8.85 J321.4270+50.1748 Gaia EDR3 2171181392057223552 21 25 42.506 +50 10 29.340 0.100 +1.977 0.010 15.4800 0.0033 2.424447 1979 100 +0.551 0.064 2.50 +1.49 0.11 1.85 9.14 J322.5803+48.1366 Gaia EDR3 1978543239722001280 21 30 19.285 +48 08 12.140 0.081 +2.305 0.092 13.3729 0.0034 3.722594 2308 80 +0.044 0.008 0.65 +0.92 0.07 2.26 8.71 J323.9253+55.1526 Gaia EDR3 2174626711751528832 21 35 42.077 +55 09 09.536 0.222 +1.712 +0.069 13.6816 0.0031 2.049757 1728 36 0.027 0.098 1.50 +0.98 0.05 2.36 8.49 J326.5224+55.9721 Gaia EDR3 2175008998199747328 21 46 05.397 +55 58 19.737 0.466 +2.933 +0.101 15.2394 0.0046 1.824793 2971 233 +0.318 0.092 2.19 +0.68 0.17 2.20 8.92 J330.5591+53.1647 Gaia EDR3 1981280890545613312 22 02 14.211 +53 09 52.980 0.310 +1.930 0.058 14.5700 0.0039 1.767390 1956 65 +0.434 0.037 1.29 +1.81 0.07 1.76 9.10 J331.2729+57.0606 Gaia EDR3 2198299575056422400 22 05 05.515 +57 03 38.338 0.591 +2.836 +0.060 14.0264 0.0034 4.639860 2898 138 +0.024 0.116 2.00 0.31 0.10 2.83 8.62 J336.4884+56.9915 Gaia EDR3 2007771905224191744 22 25 57.231 +56 59 29.517 0.967 +3.853 0.032 14.8466 0.0034 2.408172 3973 269 0.040 0.123 1.72 +0.12 0.15 2.72 8.58 J336.7031+54.9666 Gaia EDR3 2005131187536539648 22 26 48.770 +54 58 00.005 0.618 +2.654 0.107 13.7046 0.0035 3.014172 2727 100 +0.070 0.019 0.89 +0.62 0.08 2.34 8.76 J337.4678+55.8598 Gaia EDR3 2006717164338438784 22 29 52.283 +55 51 35.552 0.997 +4.010 0.123 15.4165 0.0040 1.727613 4134 472 +0.010 0.077 1.70 +0.63 0.25 2.41 8.67 J340.1084+58.6023 Gaia EDR3 2008171921301411456 22 40 26.026 +58 36 08.349 0.552 +1.856 0.001 13.9309 0.0029 2.775725 1936 51 +0.190 0.033 1.33 +1.14 0.06 2.07 8.88 J344.9302+56.6191 Gaia EDR3 2009813285998755072 22 59 43.260 +56 37 08.991 0.931 +2.869 0.157 14.3272 0.0033 0.955319 3020 143 +0.050 0.114 1.11 +0.80 0.10 2.29 8.73 J350.3833+56.4514 Gaia EDR3 1997279574991800576 23 21 32.008 +56 27 05.270 0.791 +2.092 0.167 13.3329 0.0033 2.346321 2243 61 +0.024 0.015 1.08 +0.49 0.06 2.45 8.70
Appendix B Distribution of our sample stars in the Galactic [XYZ] plane

Appendix C Light curves
This section provides a sample page with the light curves of the first 16 stars of our sample, folded with the periods listed in Table 1. The full set of light curves is available online.
