H2 molecular gas absorption-selected systems trace CO molecular gas-rich galaxy overdensities
Abstract
Absorption-selected galaxies offer an effective way to study low-mass galaxies at high redshift. However, the physical properties of the underlying galaxy population remains uncertain. In particular, the multiphase circum-galactic medium is thought to hold key information on gas flows into and out of galaxies that are vital for galaxy evolution models. Here we present ALMA observations of CO molecular gas in host galaxies of H2-bearing absorbers. In our sample of six absorbers we detect molecular gas-rich galaxies in five absorber fields although we did not target high-metallicity ( per cent solar) systems for which previous studies reported the highest detection rate. Surprisingly, we find that the majority of the absorbers are associated with multiple galaxies rather than single haloes. Together with the large impact parameters these results suggest that the H2-bearing gas seen in absorption is not part of an extended disk, but resides in dense gas pockets in the circum-galactic and intra-group medium.
keywords:
quasars: absorption lines – galaxies: ISM – galaxies: groups – ISM: molecules1 Introduction
Conventional surveys identify galaxies based on the continuum or line emission and are therefore preferentially select the most luminous part of the galaxy populations. These are high stellar mass and star-formation rate galaxies. An alternative galaxy selection technique is based on the absorption signature that the gas content imprints in the spectra of otherwise unrelated background quasars (damped Ly absorbers with a column density of HI > cm-2 Wolfe et al., 2005). The absorption traces the neutral HI gas in galaxies. Damped Ly absorbers trace the majority of HI in the Universe, as well as the majority of metals at high redshift (Péroux & Howk, 2020). These absorption-selected galaxies include the selection of lower-mass galaxies that lie at or below the main sequence for star-forming galaxies at their respective redshifts (e.g. Kanekar et al., 2018; Rhodin et al., 2018).
Therefore, a good understanding of the underlying galaxy population traced by absorption-selection is required to draw firm conclusions on the evolution of the whole galaxy population. It has been suggested that absorption-selected galaxies at intermediate redshift () are extremely molecular gas-rich and have a low star formation efficiency compared to emission-selected galaxies at low () and high () redshift (Kanekar et al., 2018; Kanekar et al., 2020). The authors of these studies selected high metallicity absorbers and report CO detection rates of 40–70 per cent. In another sample of six absorption-selected galaxies observed with MUSE and ALMA, the MUSE-ALMA Halos survey, Szakacs et al. (2021) report a CO detection rate of 1/3. However, in total only small samples of molecular gas mass measurements at low, intermediate and high redshifts are available.
At the same time the advent of large field-of-view integral field spectrographs in the optical such as the Multi Unit Spectroscopic Explorer (MUSE) on the VLT and the Keck Cosmic Web Imager (KCWI) on the Keck II telescope enabled efficient detection of absorber host galaxies with star-formation rate limits of . These surveys have revealed an increasing number of absorbers associated to groups of galaxies rather than individual systems (e.g. Bielby et al., 2017; Péroux et al., 2017; Klitsch et al., 2018; Péroux et al., 2019; Hamanowicz et al., 2020; Schroetter et al., 2021; Lofthouse et al., 2020). Recently, a group of nine galaxies associated with an H2 absorber within 600 proper kpc tracing a galaxy overdensity was presented by Boettcher et al. (2020).
A growing sample of molecular gas observations in absorption-selected systems is now available (e.g. Neeleman et al., 2016; Neeleman et al., 2018; Møller et al., 2018; Klitsch et al., 2018; Klitsch et al., 2019; Kanekar et al., 2018; Kanekar et al., 2020; Fynbo et al., 2018; Szakacs et al., 2021) Only in two absorption-selected systems more than one molecular gas-rich galaxy have been reported in emission (Klitsch et al., 2019; Péroux et al., 2019). However, a systematic study in CO emission observed with ALMA similar to those for ionised gas carried out in the optical with MUSE is still missing.
The goal of this study is to follow-up Ly absorbers with previously identified H2 absorption identified from UV absorption lines. The presence of H2-bearing gas in absorption potentially suggests a large reservoir of molecular gas also observable in CO emission. We search for molecular gas emission from the absorber host galaxy(s) and aim to identify the origin of the absorbing gas.
This paper is organised as follows: In Section 2 we describe the target selection, observations and data reduction, the detected galaxies and the relations between the absorbing gas and the host galaxies are presented in Section 3 and in Section 4 we give a summary of this work and list our conclusions.
Throughout the paper we adopt a CDM cosmological model with , , and .
| Field | Alternative | log(N(HI)/cm-2) | log(N(H2)/cm-2) | log/ | |||
|---|---|---|---|---|---|---|---|
| Name | [kpc] | ||||||
| QSO B0120-28 | 0.434 | 0.18561 | |||||
| J1342-0053 | LBQS 1340–0038 | 0.326 | 0.22711 | e | k | ||
| Q2131–1207 | PKS 2128–123 | 0.500 | 0.4298 | 12, 48f | |||
| Q1241+176 | QSO J1244+1721 | 1.273 | 0.55048 | 21g | |||
| Q0107-0232 | LBQS 0107-0232 | 0.728 | 0.55733 | 10, 11h | |||
| HE 0515-4414 | QSO B0515-4414 | 1.713 | 1.15 | c |
2 Observations and Data Reduction
2.1 Target selection
The absorbers were selected to have an H2 molecular gas absorption detection at UV wavelength. Additionally, we selected absorbers observable with ALMA and at to limit the required observing time. The neutral gas column densities of these absorbers are in the range of log(N(HI)/) = and the molecular fractions cover a range of log to . We find that although it was not a selection parameter, some absorbers in our sample have a high metallicity of above 30 per cent solar, but we also include low metallicity systems with only per cent of solar metallicity. We note that some of these metallicity estimates do not include ionisation corrections and could therefore be somewhat higher. This distribution is expected for a sample of H2 absorbers (Bolmer et al., 2019). The absorber properties including optically identified host galaxies are listed in Table 1.
2.2 ALMA observations
The six target fields are listed in Table 1. We observe the lowest possible CO transition for each absorber where the specific transition is determined by the absorber redshift (). The lowest CO transition is observed to minimize uncertainties from the line luminosity conversion, needed to evaluate the total molecular gas mass. The observations are carried out under program 2018.1.01575.S (PI Klitsch). All observations use four ALMA 1.875 GHz bands, with one band (in spectral-line mode of the correlator) covering the respective expected redshifted CO line frequency, and the other three bands (in continuum mode) placed at neighbouring frequencies to measure the continuum emission. We start the data reduction with the pipeline calibrated uv-data sets, as delivered by ALMA. Additional data reduction steps are carried out with the Common Astronomy Software Applications (CASA) software package version 5.6 (McMullin et al., 2007). The imaging is done using the standard tclean algorithm with a final field of view of 1.5 times the primary beam size. This results in an image diameter of in ALMA Band 3 and in ALMA Band 4. A ‘natural’ weighting scheme is applied, which guarantees optimal sensitivity appropriate for a line detection experiment. The final beam sizes as well as the rms noise are listed in Table 2. We use a channel width of 15 - 20 km s-1.
| Field | CO | ALMA | RMS | beam | beam |
|---|---|---|---|---|---|
| line | Band | [mJy/beam] | [″ ″] | [kpc kpc] | |
| QSO J0120-28 | 1-0 | 3 | 0.62 | 1.0 x 0.8 | 3 x 3 |
| Q1342-0053 | 1-0 | 3 | 0.33 | 0.9 x 0.8 | 3 x 3 |
| PKS 2128-123 | 2-1 | 4 | 0.90 | 0.9 x 0.8 | 5 x 5 |
| PG 1241+176 | 2-1 | 4 | 0.50 | 1.6 x 1.4 | 11 x 9 |
| Q0107-0232 | 2-1 | 4 | 0.42 | 1.6 x 1.3 | 10 x 9 |
| HE 05151-4414 | 3-2 | 4 | 0.34 | 1.5 x 1.2 | 12 x 10 |
2.3 Archival MUSE observations
One of the ALMA targets (HE 0515-4414) was observed with MUSE under the project ID: 1100.A-0528 (PI: Fumagalli). The MUSE FoV covers a area, slightly narrower than that of our ALMA observations. We have downloaded the pipeline-processed and flux calibrated data cube from the ESO Phase 3 archive. We use this data to search for optical counterparts for the CO detected galaxies.
| Name | Flag | RA | Dec | FWHM | M | |||||
|---|---|---|---|---|---|---|---|---|---|---|
| [kpc] | [km s-1] | [km s-1] | [Jy km s-1] | [Jy] | [K km s-1] | [M⊙] | ||||
| QSO J0120–28 | - | - | - | - | - | - | 0.94 | - | 1.6 | 6.8 |
| QSO J1342–0053 G1 | H | 13h42m51.85s | -00d53m54.2s | 35 | -9 | 165 8 | 0.59 0.06 | 4.0 0.7 | 1.5 0.1 | 6.5 0.6 |
| Q2131–1207 G1 2-1 | - | - | - | 52 | - | - | 1.57 | - | 3.8 | 8.2 |
| Q2131–1207 G1 3-2a | H | 52 | 184 50 | 0.355 | 5.29 | |||||
| PG 1241+176 G1 | H | 12h44m09.59s | +17d20m58.1s | 120 | 620 | 500 10 | 1.49 0.19 | 7.0 1.8 | 5.9 0.8 | 12.8 1.6 |
| PG 1241+176 G2 | H | 12h44m10.00s | +17d20m58.1s | 86 | 460 | 300 10 | 0.64 0.09 | 3.0 0.8 | 2.5 0.3 | 5.5 0.7 |
| PG 1241+176 G3 | H | 12h44m10.64s | +17d20m55.6s | 60 | 100 | 360 10 | 0.41 0.06 | 2.2 0.6 | 1.6 0.2 | 3.5 0.5 |
| LBQS 0107–0232 G1 | L | 01h10m14.22s | -02d17m06.6s | 63 | -291 | 60 10 | 0.13 0.02 | 2.4 0.6 | 0.5 0.1 | 1.1 0.2 |
| LBQS 0107–0232 G2 | L | 01h10m15.56s | -02d17m12.4s | 144 | 449 | 240 10 | 0.39 0.07 | 4.7 1.0 | 1.6 0.3 | 3.4 0.6 |
| LBQS 0107–0232 G3 | L | 01h10m14.82s | -02d17m06.6s | 69 | -651 | 140 10 | 0.17 0.03 | 1.7 0.5 | 0.7 0.1 | 1.5 0.2 |
| HE 05151–4414 G1 | H | 05h17m08.51s | -44d10m51.4s | 82 | -188 | 600 10 | 0.80 0.06 | 2.6 0.5 | 6.2 0.5 | 7.2 0.5 |
| HE 05151–4414 G2 | L | 05h17m07.12s | -44d11m01.5s | 67 | -213 | 105 8 | 0.08 0.01 | 0.8 0.3 | 0.6 0.1 | 0.7 0.1 |
3 Results
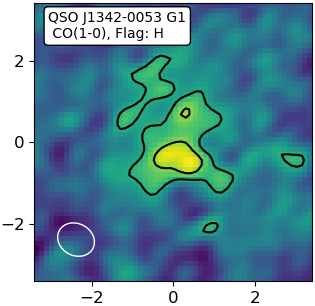
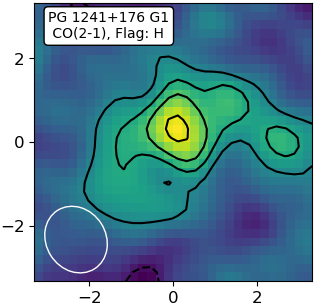
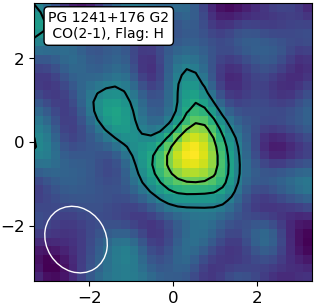
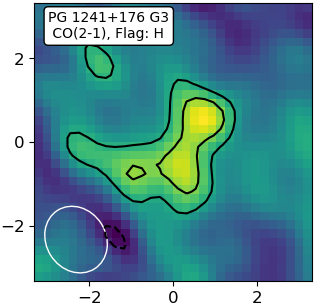
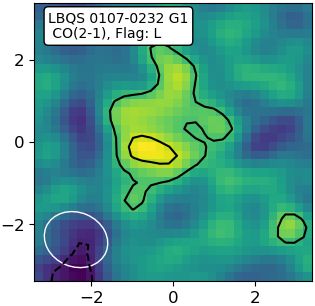
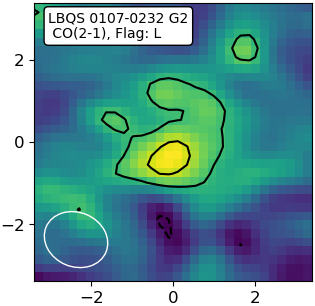
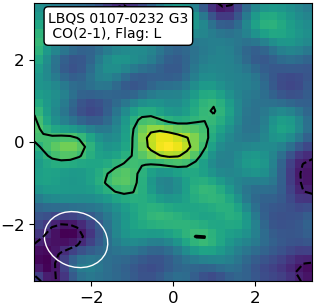
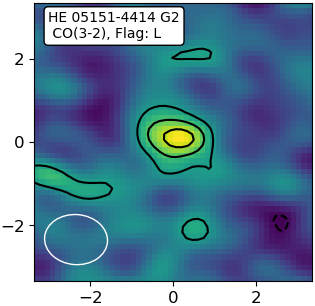
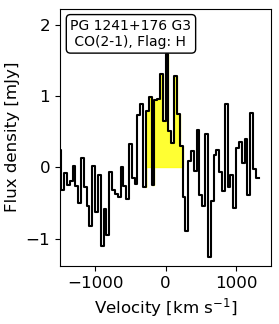
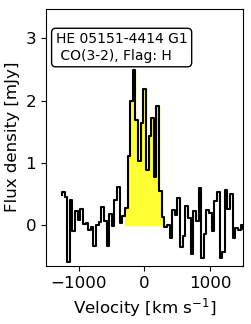
We search for CO line emission in the ALMA image cubes before correcting for the primary beam response to ensure constant noise properties across the field of view. We search for line emission both by-eye and using the line finder software SoFiA and detect CO line emission in four out of six absorber fields. We find in total nine galaxies. Three out of four absorbers have more than one galaxy in close proximity. In addition to the detections from this work we use the results for Q2131-1207 presented by Szakacs et al. (2021). The properties of our detections are listed in table 3.
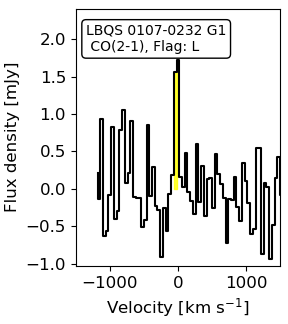
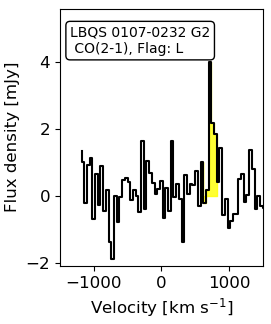
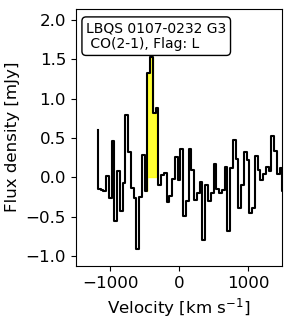
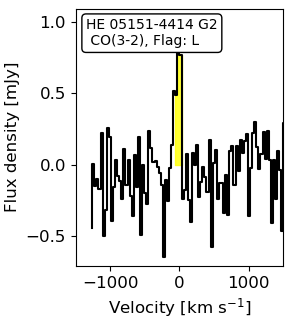
The velocity profiles of the detected galaxies have a FWHM of 60—500 km s-1. Previously reported CO detections of absorption selected galaxies have a FWHM of km s-1 (e.g. Kanekar et al., 2018; Kanekar et al., 2020; Klitsch et al., 2018; Klitsch et al., 2019; Møller et al., 2018; Péroux et al., 2019). While the narrow CO emission lines could trace low mass galaxies we also note that the detection is only significant over few channels in the ALMA data. Therefore, we flag galaxies with a FWHM km s-1 as low significance detections unless the detection is confirmed by independent observations. These are still included in the further analysis to avoid a bias against low mass galaxies. When studying trends and drawing general conclusions we regard both, the high significance sample only and the full sample.
3.1 Notes on the individual quasar fields
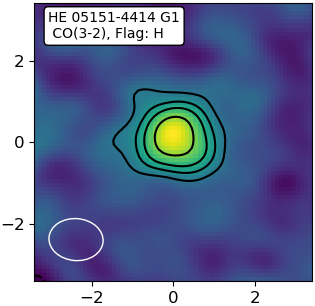
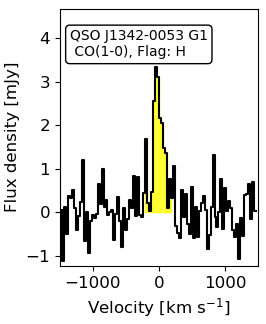
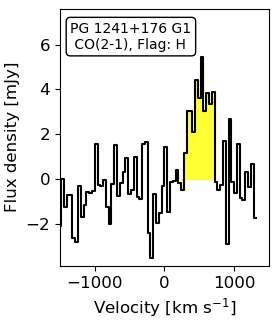
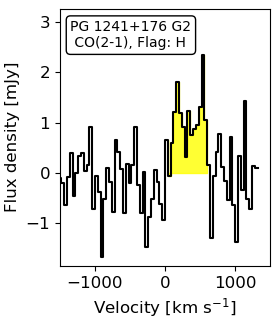
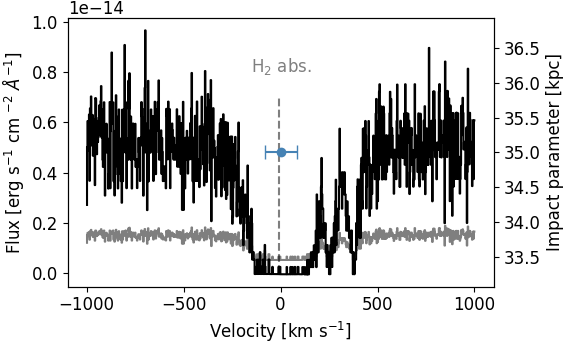
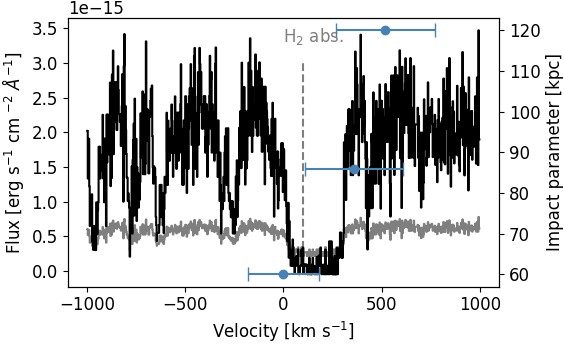
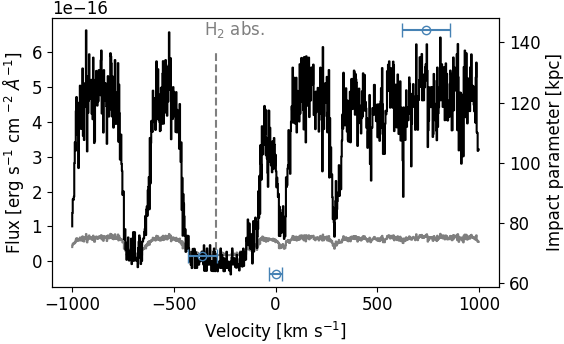
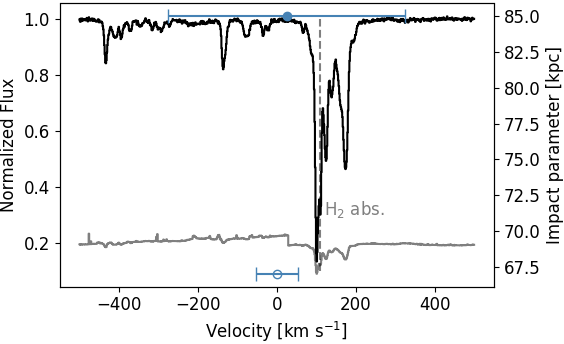
Emission line maps and extracted spectra of the detections are shown in Fig. 1 and 2. The relation between the CO detection and the absorber in velocity space is illustrated in Fig. 3. The CO spectra are obtained from the primary beam corrected image cubes. Since many sources are resolved we integrate the spectra over a region defined by the 3 contour in the integrated flux map. We do not detect significant continuum emission from any galaxy detected in CO. A detailed analysis of the different fields is presented in the following.
B0120-28 ()
We do not detect a host galaxy associated with the absorber in this field. Oliveira et al. (2014) report an absorber host galaxy at an impact parameter of 70 kpc based on imaging and spectroscopic data. However, the full details of this galaxy remain unpublished. We have therefore calculated an upper limit on the molecular gas mass based on the sensitivity limit of our CO(1–0) emission line observations.
J1342-0053 ()
We report a detection of CO(1–0) emission coincident with a previously optically identified absorber host galaxy (Werk et al., 2013). The authors report a SFR of 6.04M☉ yr-1, a stellar mass of M☉, a luminosity of 1.08, and a super solar metallicity of 12 + log(O/H) = 9.05.
Q2131-1207 ()
We do not detect CO(2–1) emission in the field of Q2131-1207 at the sensitivity limit of our observations. This field has been observed with VLT/MUSE presented by Péroux et al. (2017). We carefully examine the positions of the galaxies presented by the authors of this work, however, we also do not detect any low confidence emission from these galaxies. Szakacs et al. (2021) have followed-up this field in CO(3–2) to a higher SNR. They report CO emission from one associated galaxy (SFR, L). We calculate an upper limit of the CO(2-1) emission at the position of this galaxy which is consistent with the detection by Szakacs et al. (2021) (assuming a Milky Way type CO line ratio ; Bolatto et al., 2013). We include this field in the further analysis using the CO(3–2) detection.
Q1241+176 ()
In this field, we detect three galaxies at the absorber redshift. The galaxies lie at impact parameters of 60 – 120 kpc. In addition, Steidel et al. (1994) have identified a host galaxy at an impact parameter of kpc. However, the exact details of this detection are not reported. We carefully search for CO emission at this impact parameter, but do not report a host galaxy.
Q0107-0232 ()
Crighton et al. (2013) have identified two galaxies within of the quasar sight-line in K-band imaging. If these galaxies were at the absorber redshift this would translate to impact parameters of 10 kpc and 11 kpc. We do not find CO emission from the position of these galaxies. However, we note that there is no redshift information available for these galaxies and these could be a chance alignment. We therefore exclude these galaxies as the absorber hosts. Instead, we detect three galaxies at impact parameters of 60 – 140 kpc. Given the narrow FWHM of these CO emission lines we label those as low confidence detections. In the further analysis these galaxies are excluded when drawing general conclusions.
HE 0515–414 ()
We have identified two galaxies at the absorber redshift (one high and one low confidence) with impact parameters of 67 and 85 kpc.
This field was also observed using WFC3/G141 HST GRISM spectroscopy (PI: Bielby, ID: 14594). They have detected 9 galaxies at within a field-of-view of 6’ out of which one is G1 that we detect in CO (Bielby private comm.). Other galaxies identified in these data are outside the field-of-view of our ALMA observations.
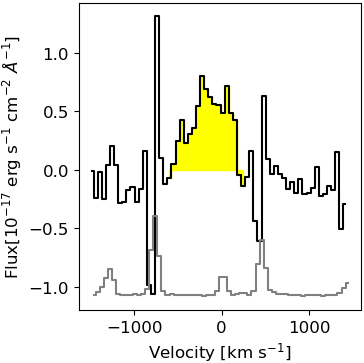
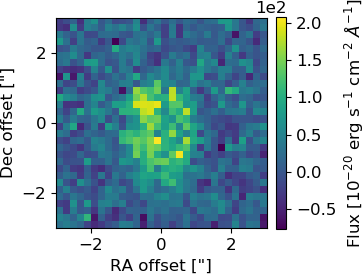
We have obtained additional archival MUSE observations described in Section 2.3. We search for counterparts of the CO detected galaxies. At the absorber redshift the [OII] line is covered by the MUSE spectral range. We detect [OII] emission from G1, but not from G2. The [OII] emission line profile and emission line map are shown in Fig. 6. Following the description by Kennicutt (1998) we measure a non dust-corrected SFR of 9.4 M⊙ yr-1 which represents a lower limit on the true SFR. This translates to an upper limit for the molecular gas depletion time of 0.8 Gyr. This is in contrast to the long gas depletion times for absorption selected galaxies at intermediate redshifts reported by Kanekar et al. (2018); Péroux et al. (2019) and Szakacs et al. (2021).
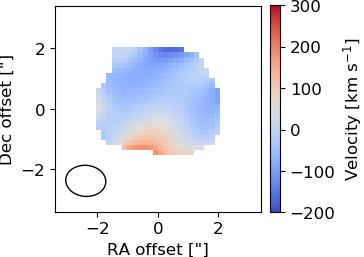
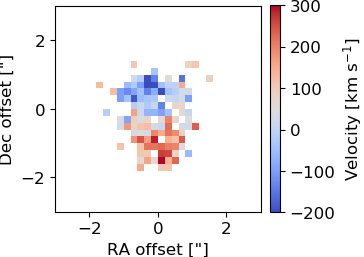
Additionally, we use the [OII] and CO observations of G1 to study the ionised and molecular gas kinematics. The line of sight velocity maps are shown in Fig. 7. The CO line emission is only marginally resolved and the [OII] emission is not significant enough to allow for a detailed analysis using state-of-the-art forward modelling techniques. However, a qualitative analysis shows that the molecular and ionized gas kinematics are coupled. Both show rotation with similar orientation and maximum velocity.
3.2 Molecular gas masses
We convert the CO emission line luminosities in the observed transitions to the CO(1-0) line luminosity using a Milky Way type line ratio as reported by Carilli & Walter (2013). As we have no further information on the CO line excitation this assumption yields an upper limit of the molecular gas mass. We stress that previous studies of the CO spectral line energy distribution of absorption-selected galaxies have in some cases shown more excited ISM conditions than that of the Galaxy (Klitsch et al., 2019). The CO(1–0) line fluxes could therefore be overestimated by a factor of 2 – 4. We have used a CO-to-H2 conversion factor of that is applicable for galaxies of solar metallicity that do not undergo a starburst (including a factor of 1.36 to account for the presence of helium Bolatto et al., 2013). We caution, however, that the true molecular gas mass might be overestimated by up to a factor of six compared to , appropriate for starburst environments. In case of a systematically too high conversion factor chosen for all galaxies the relative trends remain the same. If, however, only some galaxies in this sample have a Milky Way type CO line ratio and while for others a starburst type conversion is more appropriate this could introduce also relative shifts.
4 Discussion
4.1 Detection rate
In this study we have selected the targets based on previously identified H2-bearing gas detected in absorption instead of a metallicity based selection that has sometimes been used in previous such surveys. We find that the absorbers cover a range of 1/10th to solar metallicity. We list the molecular gas column density as well as the metallicity of the absorbers in Table 1. We find molecular gas-rich galaxies in five out of six fields and we detect multiple galaxies in three absorber fields. It is known from archival MUSE observations that in a fourth field (Q2131-1207) an overdensity of four galaxies is detected (Péroux et al., 2017). This success rate of per cent is remarkable for a study of molecular gas in absorption-selected systems. Similar studies at intermediate and high redshift focussing on high metallicity absorbers achieved a detection rate of per cent with a clear relation to the absorber metallicity (Kanekar et al., 2018; Kanekar et al., 2020; Szakacs et al., 2021). We attribute the higher detection rate of CO emission to the presence of the H2-bearing clouds in absorption that indicate the presence of particularly molecular gas-rich systems.
4.2 Absorption associated to galaxy overdensities rather than single galaxies
A remarkable finding of this work is the detection of multiple galaxies associated to one absorber in most fields (three out of four fields presented here and in Q2131-1207 presented by Péroux et al., 2017; Szakacs et al., 2021). For the field of HE0515-4414 we report an even more extended structure of galaxies including 10 galaxies within Mpc. A similar finding was reported by Hamanowicz et al. (2020) who present a sample of absorption-selected galaxies with follow-up VLT/MUSE IFU observations.
We test if the observed multiple galaxies are indeed overdensities by calculating the expected number of galaxies within the co-moving volume traced by our observations. We use the CO luminosity function reported by Fletcher et al. (2021) and integrate with a lower limit of which is equivalent to the faintest detections in our sample. We find that at both, the low and high redshift end of our targets we expect fewer than one galaxy within the volume probed by the ALMA Band 3 and 4 observations. Here we consider a velocity range of km s-1from the absorber redshift. This suggests that the multiple galaxies detected in each field represent overdensities in the galaxy distribution at the absorber redshift.
4.3 Molecular gas mass relation to absorber properties
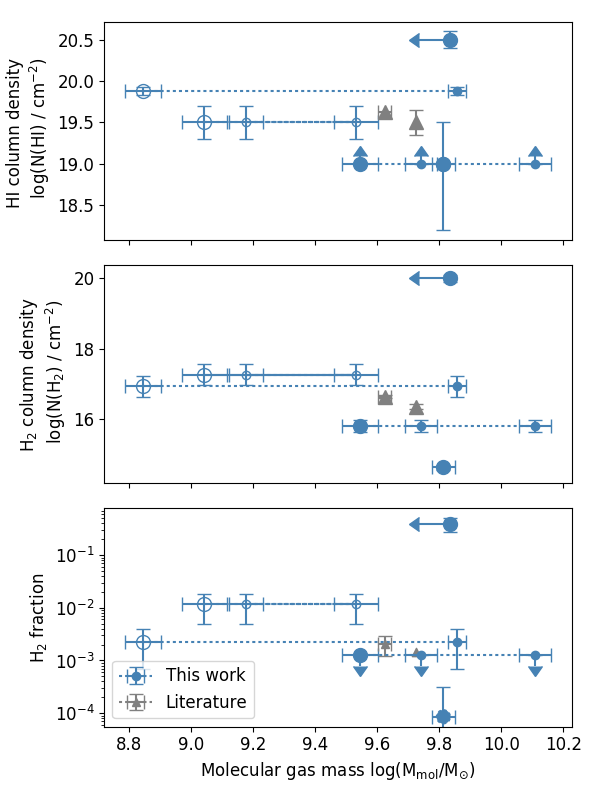
Although the sample size is limited and the connection between absorber and host galaxies might be complex due to identification of multiple host galaxies, we test if we can find a relation between the molecular gas mass of the absorption-selected galaxies and the absorber properties. In Fig. 4 we show the Hi column density, the H2 column density and the molecular gas fraction as a function of the molecular gas mass of the host galaxies. We do not report a significant correlation in any of these parameter spaces for both, the full sample and the high significance detections only. This is probably expected as the connection between the absorber and the host galaxy in such complex systems is not straightforward. A similar non-correlation was identified in optical studies finding galaxy overdensities related to absorbers in a similar redshift range (Hamanowicz et al., 2020).
4.4 Do molecular gas absorbers probe disks of galaxies or pockets of dense gas in the CGM?
To test whether the H2-bearing gas traces disks of galaxies or pockets of dense gas in the circum-galactic medium (CGM) we analyse the distance between the absorber and the host galaxies in both projected distance on sky (impact parameter) and distance in velocity space to probe the full extent of the three dimensional structure. In Fig. 3 we show the absorption profiles in relation with emission line width of the CO detected galaxies in terms of both sky position (right y-axis) and velocity space (x-axis). The lack of comparison spectra of strong metal absorption lines often hampers a direct comparison. For some sight lines the only available lines are embedded in the Ly forest making a comparison between the absorption components and CO emission lines challenging.
We find large impact parameters of 35 – 140 kpc suggesting that the molecular absorption does not probe the extended molecular disk of a single galaxy. In addition, we find a good agreement between the absorption and CO emission in velocity space. This suggests an association between the neutral and H2-bearing gas at the position of the quasar sight line and the molecular gas in the host galaxies.
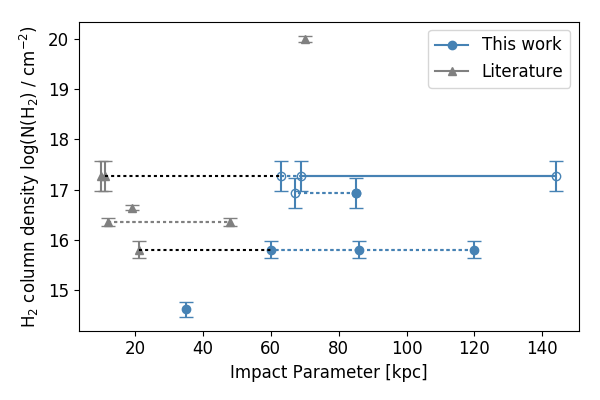
Additionally, we test for a relation between the H2 column density and the impact parameter (see Fig. 5), that would be expected if the absorption is tracing the disk of the host galaxy. We do not identify a clear trend between these two quantities adding further evidence that the absorption is tracing pockets of H2-bearing gas rather then the disk of a molecular gas-rich galaxy. Comparing the detection rates of our work with previous studies focussing on high metallicity we find that first with a success rate of per cent our detection rate is significantly higher and second we find overdensities of galaxies rather then single galaxies. This suggests that there is possibly more diffuse gas around overdensities of galaxies which provides the appropriate conditions for molecular gas to form in-situ or survive the outflow from a galaxy traced in absorption.
Galaxy interactions are numerous in overdense environments. Interactions can produce tidal streams as well as promote starburst or AGN driven outflows. The H2 molecular gas could therefore be part of self-shielded, tidally stripped or ejected disk material. This scenario is supported by the observations of molecular gas in high velocity clouds in the Milky Way (Richter et al., 2001; Putman et al., 2012). Furthermore, the molecular gas could be transported out to large distances by outflows (Richings & Faucher-Giguere, 2018).
We note that we cannot exclude the presence of low molecular gas mass galaxies below our detection limit at small impact parameters. Ideal follow-up observations to settle this question would be optical IFU observations to detect all galaxies in these fields down to low star formation rates.
5 Conclusions
In this paper we present a systematic search for molecular gas traced by CO emission in H2 absorption selected systems. We report the detection of CO emission from galaxies in close proximity to absorbers in five out of six quasar fields (including the deeper observations presented by Szakacs et al., 2021). Our main conclusions can be summarised as follows:
- •
-
•
Interestingly, the only system without a CO detection has the lowest metallicity. However, the CO detected galaxies are related to absorbers with a wide range of absorption metallicities.
-
•
The H2-bearing gas in absorption in all except two sight-lines traces galaxy overdensities. In the case of HE0515-4414 this is also supported by GRISM spectroscopy tracing scales of 3 Mpc. In the case of Q2131-1207 only one galaxy is detected in CO, but additional MUSE observations reveal three additional [OIII] emitting galaxies connected to the absorber. This adds further evidence that absorption selection is efficient at tracing overdense environments.
-
•
In the case of HE0515-4414 G1, we gather first insights in the molecular and ionised gas kinematics traced by ALMA and MUSE observations, respectively. We find that both velocity fields qualitatively agree in orientation and maximum velocity. Deeper high resolution observations are necessary for a complete morpho-kinematic modelling.
-
•
We detect galaxies at impact parameters of 35 – 144 kpc. We conclude that the H2-bearing absorbers do not trace the inner disk of a galaxy, but pockets of diffuse molecular gas in the circum-galactic and intra-group medium. This is also supported by the lack of a clear correlation between the absorber column density or molecular gas fraction with impact parameter or host galaxy molecular gas mass.
Acknowledgements
The authors thank Palle Møller for important discussions related to this work and Roland Szakacs for sharing preliminary results. A.K. thanks Aleksandra Hamanowicz for important discussions related to this work. A.K. gratefully acknowledges support from the Independent Research Fund Denmark via grant number DFF 8021-00130. A.D.C. acknowledges support by the Swiss National Science Foundation under grant 185692. S.L. was funded by FONDECYT grant number 1191232. This paper makes use of the following ALMA data: ADS/JAO.ALMA#2018.1.01575.S. ALMA is a partnership of ESO (representing its member states), NSF (USA) and NINS (Japan), together with NRC (Canada), MOST and ASIAA (Taiwan), and KASI (Republic of Korea), in cooperation with the Republic of Chile. The Joint ALMA Observatory is operated by ESO, AUI/NRAO and NAOJ. In addition, publications from NA authors must include the standard NRAO acknowledgement: The National Radio Astronomy Observatory is a facility of the National Science Foundation operated under cooperative agreement by Associated Universities, Inc. This research made use of Astropy111http://www.astropy.org a community-developed core Python package for Astronomy(Astropy Collaboration et al., 2013; Price-Whelan et al., 2018). This research has made use of NASA’s Astrophysics Data System.
Data Availability
The data underlying this article are available in the respective observatories online archives. Used ALMA data is available through the ALMA Science Archive (https://almascience.eso.org/asax/), VLT/MUSE data is available through the ESO SciencenArchive Facility (http://archive.eso.org/cms.html) and HST data through the Hubble Legacy Archive (https://hla.stsci.edu). Project IDs are given in Section 2 and 3.
References
- Astropy Collaboration et al. (2013) Astropy Collaboration et al., 2013, A&A, 558, A33
- Bielby et al. (2017) Bielby R., Crighton N. H. M., Fumagalli M., Morris S. L., Stott J. P., Tejos N., Cantalupo S., 2017, MNRAS, 468, 1373
- Boettcher et al. (2020) Boettcher E., et al., 2020, arXiv:2010.11958 [astro-ph]
- Bolatto et al. (2013) Bolatto A. D., Wolfire M., Leroy A. K., 2013, ARA&A, 51, 207
- Bolmer et al. (2019) Bolmer J., et al., 2019, A&A, 623, A43
- Carilli & Walter (2013) Carilli C., Walter F., 2013, ARA&A, 51, 105
- Crighton et al. (2013) Crighton N. H. M., et al., 2013, MNRAS, 433, 178
- Fletcher et al. (2021) Fletcher T. J., Saintonge A., Soares P. S., Pontzen A., 2021, MNRAS, 501, 411
- Fynbo et al. (2018) Fynbo J. P. U., et al., 2018, MNRAS, 479, 2126
- Hamanowicz et al. (2020) Hamanowicz A., et al., 2020, MNRAS, 492, 2347
- Kanekar et al. (2018) Kanekar N., et al., 2018, ApJL, 856, L23
- Kanekar et al. (2020) Kanekar N., Prochaska J. X., Neeleman M., Christensen L., Møller P., Zwaan M. A., Fynbo J. P. U., Dessauges-Zavadsky M., 2020, ApJ, 901, L5
- Kennicutt (1998) Kennicutt Jr. R. C., 1998, ApJ, 498, 541
- Klitsch et al. (2018) Klitsch A., Péroux C., Zwaan M. A., Smail I., Oteo I., Biggs A. D., Popping G., Swinbank A. M., 2018, MNRAS, 475, 492
- Klitsch et al. (2019) Klitsch A., et al., 2019, MNRAS, 482, L65
- Lofthouse et al. (2020) Lofthouse E. K., et al., 2020, MNRAS, 491, 2057
- McMullin et al. (2007) McMullin J. P., Waters B., Schiebel D., Young W., Golap K., 2007, Astronomical Data Analysis Software and Systems XVI, 376, 127
- Møller et al. (2018) Møller P., et al., 2018, MNRAS, 474, 4039
- Muzahid et al. (2015) Muzahid S., Srianand R., Charlton J., 2015, MNRAS, 448, 2840
- Muzahid et al. (2016) Muzahid S., Kacprzak G. G., Charlton J. C., Churchill C. W., 2016, ApJ, 823, 66
- Neeleman et al. (2016) Neeleman M., et al., 2016, ApJL, 820, L39
- Neeleman et al. (2018) Neeleman M., Kanekar N., Prochaska J. X., Christensen L., Dessauges-Zavadsky M., Fynbo J. P. U., Møller P., Zwaan M. A., 2018, ApJ, 856, L12
- Oliveira et al. (2014) Oliveira C. M., Sembach K. R., Tumlinson J., O’Meara J., Thom C., 2014, ApJ, 783, 22
- Péroux & Howk (2020) Péroux C., Howk J. C., 2020, ARA&A, 58, 363
- Péroux et al. (2017) Péroux C., et al., 2017, MNRAS, 464, 2053
- Péroux et al. (2019) Péroux C., et al., 2019, MNRAS, 485, 1595
- Price-Whelan et al. (2018) Price-Whelan A. M., et al., 2018, AJ, 156, 123
- Putman et al. (2012) Putman M. E., Peek J. E. G., Joung M. R., 2012, ARA&A, 50, 491
- Quast et al. (2008) Quast R., Reimers D., Baade R., 2008, A&A, 477, 443
- Rao et al. (2006) Rao S. M., Turnshek D. A., Nestor D. B., 2006, ApJ, 636, 610
- Reimers et al. (2003) Reimers D., Baade R., Quast R., Levshakov S. A., 2003, A&A, 410, 785
- Rhodin et al. (2018) Rhodin N. H. P., Christensen L., Møller P., Zafar T., Fynbo J. P. U., 2018, A&A, 618, A129
- Richings & Faucher-Giguere (2018) Richings A. J., Faucher-Giguere C.-A., 2018, MNRAS, 474, 3673
- Richter et al. (2001) Richter P., Sembach K. R., Wakker B. P., Savage B. D., 2001, ApJ, 562, L181
- Schroetter et al. (2021) Schroetter I., et al., 2021, MNRAS,
- Som et al. (2015) Som D., Kulkarni V. P., Meiring J., York D. G., Péroux C., Lauroesch J. T., Aller M. C., Khare P., 2015, ApJ, 806, 25
- Steidel et al. (1994) Steidel C. C., Dickinson M., Persson S. E., 1994, ApJ, 437, L75
- Szakacs et al. (2021) Szakacs R., et al., 2021, arXiv e-prints, p. arXiv:2105.07280
- Werk et al. (2013) Werk J. K., Prochaska J. X., Thom C., Tumlinson J., Tripp T. M., O’Meara J. M., Peeples M. S., 2013, ApJS, 204, 17
- Werk et al. (2014) Werk J. K., et al., 2014, ApJ, 792, 8
- Wolfe et al. (2005) Wolfe A. M., Gawiser E., Prochaska J. X., 2005, ARA&A, 43, 861
Appendix A Line of sight velocity maps of the ionised and molecular gas in HE0515-4414 G1
