Conversion and Smoothing of MHD Shocks in Atmospheres with Open and Closed Magnetic Field and Neutral Points
keywords:
Waves, Magnetohydrodynamic; Waves, Shock; Heating, Chromospheric1 Introduction
S-Introduction
1.1 Linear mode conversion
SS-linIntro It is well-established that linear fast and slow magnetohydrodynamic (MHD) waves may partially mode-convert between each other on Alfvén-acoustic equipartition surfaces , where is the Alfvén speed and is the sound speed (Schunker and Cally, 2006). The result is based on a sophisticated ray theory incorporating WKB connection coefficients (Tracy, Kaufman, and Brizard, 2003; Tracy et al., 2014), and is confirmed by exact solution (Hansen and Cally, 2009) and simulations (e.g., Nutto, Steiner, and Roth, 2010; Rijs et al., 2016; Riedl, Van Doorsselaere, and Calvo Santamaria, 2019). This solves the sunspot p-mode absorption problem (Braun, Duvall, and Labonte, 1988; Cally, Crouch, and Braun, 2003), where is typically sub-photospheric, with implications for wave-coupling of the solar interior and atmosphere (Cally and Moradi, 2013). Away from sunspots, equipartition surfaces normally reside in the chromosphere, possibly taking complex shapes, giving rise to a rich array of wave behaviours (Nutto, Steiner, and Roth, 2012; Khomenko and Calvo Santamaria, 2013).
1.2 Mode conversion of shocks
SS-shockIntro Several recent articles have addressed how fast/slow mode conversion carries over to shock waves. Invoking WKB-based arguments, Núñez (2019) predicted analytically that shocks would mode-convert at in the same way that linear waves do, but that both emerging fast and slow MHD waves would be smoothed, i.e., they are no longer shocks.
Simulations in 1.5D by Pennicott and Cally (2019) however revealed that in fact the emerging fast wave remains a shock, though the slow wave is smoothed (for non-zero attack angle between the shock normal and the magnetic field). A major reason for the discrepancy is that the shock incident on the equipartition layer is seen to drag it along for an extended period (some seconds), invalidating an assumption of Núñez’s. Subsequently, Snow and Hillier (2020) confirmed these findings, and extended them to two-fluid shocks in a partially-ionized plasma, discovering several further behaviours dependent on collision strengths.
Shocks in an initially uniform MHD plasma are normally described in terms of the compression ratio , where the subscript ‘1’ denotes the pre-shocked plasma and ‘2’ the post-shocked. Standard theory was developed by Bazer and Ericson (1959) and has been summarized in any number of text books (e.g., Priest, 1982) since. Just as for hydrodynamic shocks, it turns out that , i.e., for . By conservation of mass, , where is the direction perpendicular to the shock front, so the normal velocity slows down relative to the incident velocity by no more than this limiting factor.
The three shock types – fast, intermediate (Alfvén) and slow – reduce to those three linear MHD wave types in the limit . However, as the shock strength increases, the slow and intermediate shocks annihilate at some above which only the fast wave persists all the way up to , corresponding to infinite Mach number. Pennicott and Cally (2019) use this as a partial explanation for the disappearance of the slow shock but persistence of the fast shock in their 1.5D simulations as the shock crosses . In the following sections, we explore this further in a complex magnetic geometry, with particular attention paid to the open and closed field regions and the neighbourhood of neutral point.
The purpose of this article is to explore the implications of these findings for shock waves in more complex magnetic geometries, as typically are found in the Sun’s inner and outer atmospheres. For simplicity, the models are two-dimensional (2D), which is sufficient for our purposes. The introduction of a third dimension would add fast-Alfvén coupling as well (Cally and Hansen, 2011; Khomenko and Cally, 2012), which would complicate the results and in any case is beyond our scope here. Only the one-fluid ideal MHD case will be considered.
Specifically, we investigate models with a mixture of open and closed magnetic field that exhibit X-type neutral points. The contrasting behaviours in open and closed field and the focusing, defocusing and mode conversion of fast and slow waves near the neutral point will be explored. Particular attention will be paid to the effect of attack angle, the complex dragging of the layer in the heterogeneous model, and the role of a secondary “island” around the neutral points. Local shock and electrical heating is addressed. We will compare and contrast linear and shock wave behaviours, especially their mode conversion properties. The smoothing or otherwise of shocks crossing the equipartition layers will be of special interest.
2 Model
S-model
In a prominent recent review of the solar chromosphere, Carlsson, De Pontieu, and Hansteen (2019) state that “Magnetoacoustic slow-mode shock waves permeate the chromosphere, both in the internetwork quiet Sun and in strong magnetic field regions like network and plage. They play a key role in the momentum and energy balance of the chromosphere…”, and highlight the impact of small-scale magnetic fields as an emerging issue of relevance to the energy balance. The disparity of scales between network and small magnetic dipoles in particular results in a mix of magnetic field lines that are open and closed within the chromosphere. This inspires us to explore the contrasting behaviours of shocks in open and closed field and around associated neutral points, with particular attention paid to mode conversion, shock smoothing, and development of fine structure that may enhance local heating.
2.1 Equilibrium Model
S-eqbm
In terms of horizontal and vertical coordinates , we express a magnetic field in terms of its flux function ,
| (1) |
For potential field, is harmonic, . A suitable separable choice is the well-known -periodic potential magnetic arcade (Priest, 1982) supplemented with a uniform inclined field,
| (2) |
where . The field strength parameters and represent respectively a pure arcade and a superimposed uniform field that is inclined at angle to the vertical. At the base, the vertical field component is , and as . The inclined field gives us some control over attack angle.
An isothermal gravitationally stratified atmosphere with sound speed and pressure is sufficient to illustrate the relevant phenomena. The scale height , where is the adiabatic index and is the gravitational acceleration. For the pure arcade model, , Alfvén speed increases with height provided , i.e., , which we shall generally enforce.


Figure \ireffig:Xexample illustrates two typical scenarios (“island” and “promontory”) on a more-or-less chromospheric length scale, notwithstanding the lack of a transition region, with typical chromospheric sound speed, pressure, and magnetic field strength (as detailed in the figure caption). The distinction between the island and promontory cases in this instance hinges on a small difference in field strength; stronger field lowers the layer and causes the island to decouple from it. This is not an important distinction. Simulations with either scenario produce similar results. For this reason, we shall address the generic class of models illustrated by the upper panel of Fig. \ireffig:Xexample, consisting of a roughly level equipartition layer with an isolated neutral point and equipartition island above.
We shall see that a sufficiently strong incident shock wave significantly modifies the location of the equipartition surfaces, and can turn an island into a promontory.
If the sound speed were increased by a factor of 10 say, the density scale height (and temperature) would increase by a factor of 100, so if were also increased by factor 100, the scaling would be homologous. Moreover, if the base plasma pressure and the magnetic pressure were also scaled in lock-step, the position of the layer would be identical in this rescaled model. Such a high temperature large length-scale scenario would be more coronal in character, but will not be considered explicitly.
2.2 Equations
S-eqns The evolution of the system is described in terms of the density , fluid velocity , plasma pressure , specific internal energy density , gravitational acceleration , magnetic field , electric field , current density and sound speed with adiabatic index . The equation of state is taken to be that of a perfect fully ionized hydrogen gas for simplicity.
These quantities are governed by the standard single-fluid two-dimensional (2D) non-linear ideal magnetohydrodynamic (MHD) equations under gravity in the negative direction. Specifically, these are in effect the familiar continuity, momentum, induction and internal energy equations
| (3a) | |||
| (3b) | |||
| (3c) | |||
| (3d) | |||
which are solved subject to periodic boundary conditions in the horizontal direction . The top and bottom boundary conditions are described below. The initial state is isothermal () stratified equilibrium permeated by the potential magnetic field described above. These MHD equations are linearized only for the ray calculations of Sec. \irefD-X.
2.3 Numerical Scheme
S-numerics
The numerical simulations are performed using the Lare2d code (Arber et al., 2001) to solve the single fluid nonlinear MHD equations. The numerical grid contains 512 cells in the horizontal direction and 1024 cells in the vertical direction, and the code’s default shock viscosities were used. The grid is uniform in the direction and spans from Mm to 2.25 Mm, giving a resolution of km, corresponding to about 45 points across the neutral point island for example. The grid is stretched in the direction and spans from 0.00 Mm to 36.0 Mm, though only the bottom 3.5 Mm will be displayed. The stretching function acts on , such that
| (4) |
where km, , Mm, and Mm. This gives vertical spacings ranging from 5.86 km at through 5.89 km at Mm to 9.9 km at Mm, which is the domain of interest.
The horizontal boundary conditions are periodic, whilst the vertical boundaries are closed. A velocity damping profile is implemented for Mm, which suppresses the outgoing waves and prevents artificial reflections from the top of the computational box. In effect, velocity update above this level was supplemented by a damping term where the damping factor linearly increases with height from zero at 4.5 Mm, with no apparent ill-effects on the lower levels. No artificial cooling or radiative losses are employed throughout the atmosphere.
The model adopted is an isothermal gravitationally stratified 2D atmosphere with an overlying potential magnetic field structure. The magnetic field is described by Equations (\irefB) and (\irefA) with G, G and . The gravitational acceleration is defined by the piecewise function
| (5) |
where m s-2, Mm, and Mm.
The uniform sound speed is km s-1, the scale height km and the acoustic cut-off frequency mHz. The initial contours produced by this atmosphere can be seen in Figure \ireffig:Xexample, which shows 1.5 periods in . The extended top of the box with zero gravity allows waves to escape and to not reflect back into the region of interest.
To drive the waves, a purely vertical velocity pulse is implemented for half a period along the bottom boundary of the form
| (6) |
(as in Pennicott and Cally, 2019), where is vertical velocity, is amplitude, mHz is the frequency, and is time. Due to the relatively short driver period, this corresponds to a broad frequency spectrum centered around zero. However, the acoustic cut-off will only allow waves above mHz to propagate upwards.
3 Waves Near Neutral Points
S-X Magnetohydrodynamic waves near magnetic neutral points have been studied in detail over many years, inspired by space-based observations of the ubiquity of MHD oscillations in the solar corona and the need to understand the creation of small length scales so that they can dissipate their energy and heat the atmosphere.
McLaughlin and Hood (2004) found that the linearized fast wave “wraps itself around the null point due to refraction” in a 2D zero- plasma, producing a spike in current density and probable local heating. Nakariakov and Melnikov (2009) and Van Doorsselaere, Kupriyanova, and Yuan (2016) noted a possible link to Quasi-Periodic Pulsations (QPP) associated with flaring energy release in loop systems, where X-type neutral points are a feature of standard models.
McLaughlin and Hood (2006) included a finite sound speed and discovered that fast/slow mode conversion takes place on the equipartition surface surrounding the null point (erroneously identified as the surface rather than , but the distinction is minor since at ). They also found that some of the generated slow wave was able subsequently to leave the region along separatrices. McLaughlin, Hood, and de Moortel (2011) review the state of knowledge c. 2010. More recently, 3D simulations by Tarr and Linton (2019) confirmed these general behaviours in a coronal context, but suggested that associated shock and ohmic heating is one-to-two orders of magnitude below what is required to supply radiative losses from coronal bright points.
Using conformal mapping techniques, Núñez (2017) analytically investigated the propagation of fast waves around a potential-field neutral point in the low- limit, elucidating the particular mathematical properties of rays, which describe logarithmic spirals, and wavefronts that exhibit more complex behaviour. They form shocks from linear waves in a finite time if the wavefront is convex, due to the appearance of caustics. This adds mathematical detail to the simulations of McLaughlin et al. (2009). Both confirm that nonlinearities bring new features to the model.
However, Núñez’s calculations say nothing about mode conversion, as there is no equipartition surface, and therefore they do not apply inside the contour where a fraction of the wave will be slow and therefore not bound to the neutral point. Because of the X-type structure of the magnetic field in this region, the attack angle of a spiralling ray to the field lines at will take on very different values around the circumference, leading to a complex conversion picture, so numerical simulation is probably the only feasible solution strategy.
Most previous studies concentrate on the coronal context. However, similar processes on a much smaller scale are to be expected in the chromosphere as well, as discussed earlier.
Our main focus is the behaviour of waves and shocks as they pass through and sometimes advect the equipartition surfaces, rather than on the neutral points themselves. We therefore refrain from introducing additional physics more applicable to that topic, such as reconnection, although the code can address such non-ideal phenomena too. For example, in the Hall regime, X-type neutral points subject to impinging fast waves are found using Lare2d to exhibit multiple additional transient nulls and hence enhanced reconnection rates (Threlfall et al., 2012), which is beyond our scope.
Although linear and nonlinear waves near neutral points have been extensively examined previously, we explore them further here in the broader context of open and closed field, mode conversion and shock smoothing at , equipartition layer dragging, and implications for heating mechanisms and locations.
4 Results
S-results
4.1 Linear Case
S-linear-sim For comparison, we first presents results for the linear wave case, so that the consequences of nonlinearity in subsequent simulations are clear.
A slab-like driver is implemented along the bottom boundary as described by Equation (\irefdriver) with amplitude m s-1. This will ensure wave amplitudes remain in the linear regime throughout the simulation in the area of interest. Due to the high level at the base of the computational box, the majority of the driver’s energy is imparted into the fast (acoustic) wave, and negligible energy is directed into the slow (magnetic) wave.
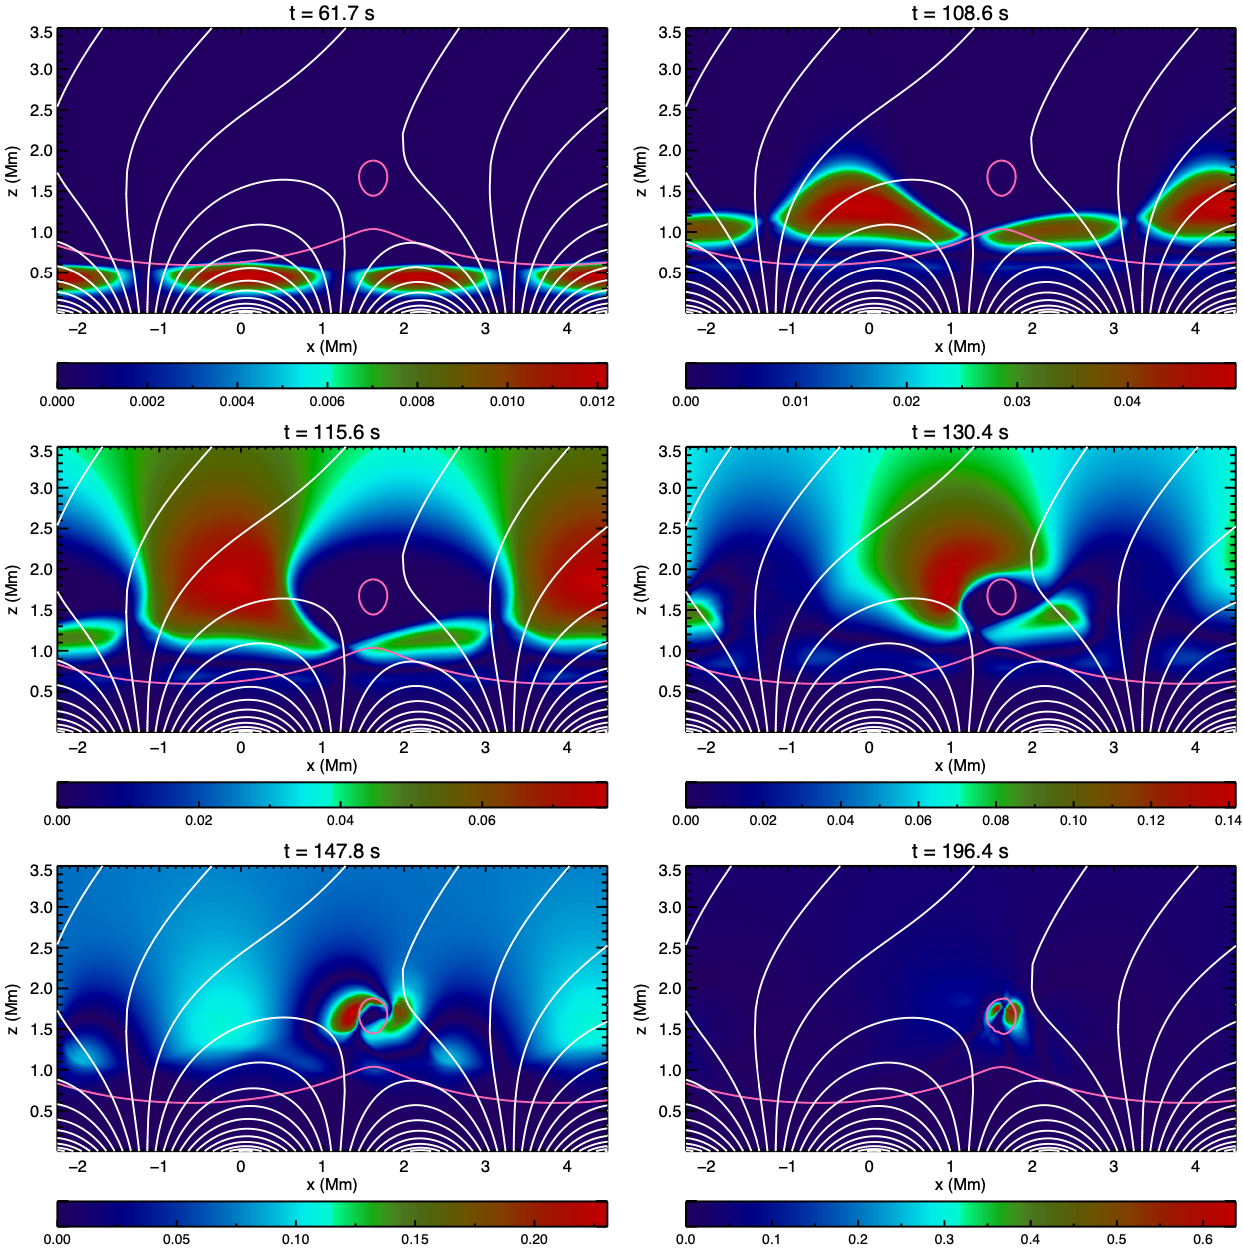
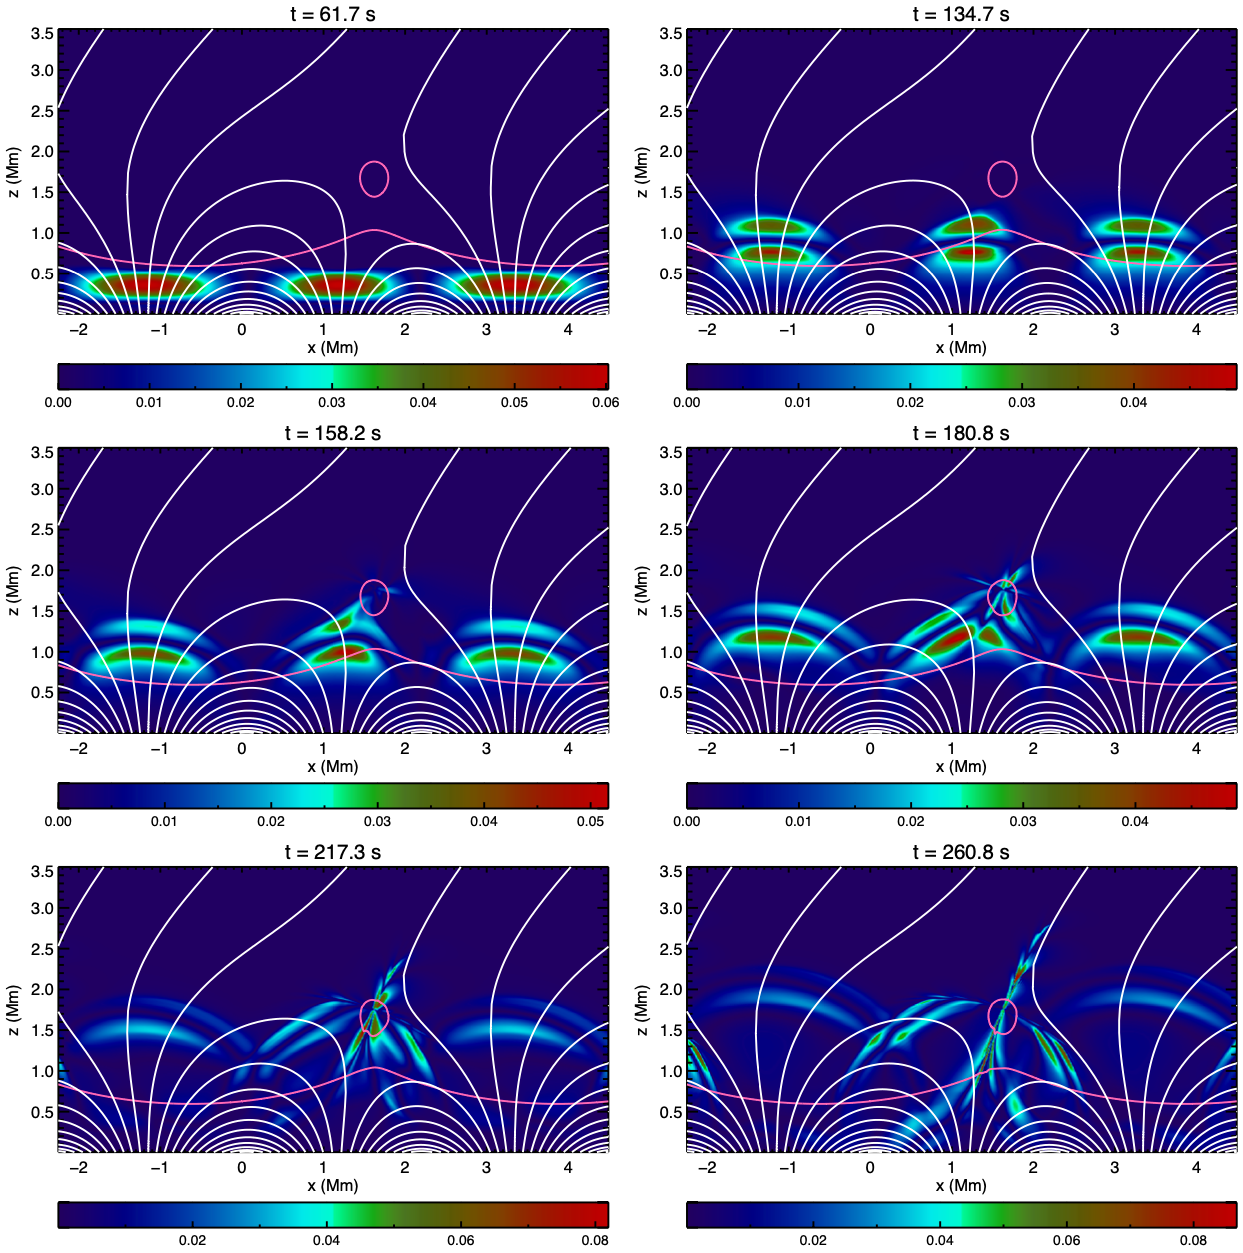
A timeline of events is produced in Figures \ireffig:vperp_linear and \ireffig:vpar_linear, which depict both the perpendicular and parallel (to the magnetic field) plasma velocities and . The parallel velocities are scaled by in order to more easily view the acoustic waves present in all areas of the domain. These plots are the primary signatures used to determine the presence of fast/slow and acoustic/magnetic MHD waves.
In the low- limit, , fast waves are entirely transverse to the magnetic field and slow waves are polarized parallel to it, so the / split is ideal for distinguishing between them. However, this is not so where . Near in particular, it does not even make sense to try to decouple fast and slow modes, as this is where they are physically coupled and exchanging energy. Nevertheless, the / split is useful in such figures as it allows us to unambiguously distinguish the waves high above the equipartition level and identify the fates of the separate modes. Associated animations elucidate this further by allowing us to easily see separate waves moving upwards along open field lines in the upper regions (near-parallel slow waves) and reflecting back downwards (near-transverse fast waves) elsewhere.
Note that the times displayed in Figs. \ireffig:vperp_linear and \ireffig:vpar_linear are deliberately chosen to not correspond, since the slow and fast evolutions that they respectively illustrate naturally move at different rates.
The rightmost boundary of the computational box sits at Mm, however the plots displayed in Figs. \ireffig:vperp_linear and \ireffig:vpar_linear stretch to Mm. This enlarged window allows us to view the range of behaviours across the domain more clearly.
Figure \ireffig:lin_anim is a frame from an animation of the linear case that shows both parallel and perpendicular velocity components as well as density, temperature and current density. The separate slow waves propagating steadily upward in the open field are clearly very distinct from the fast waves turning over and converging on the neutral point.
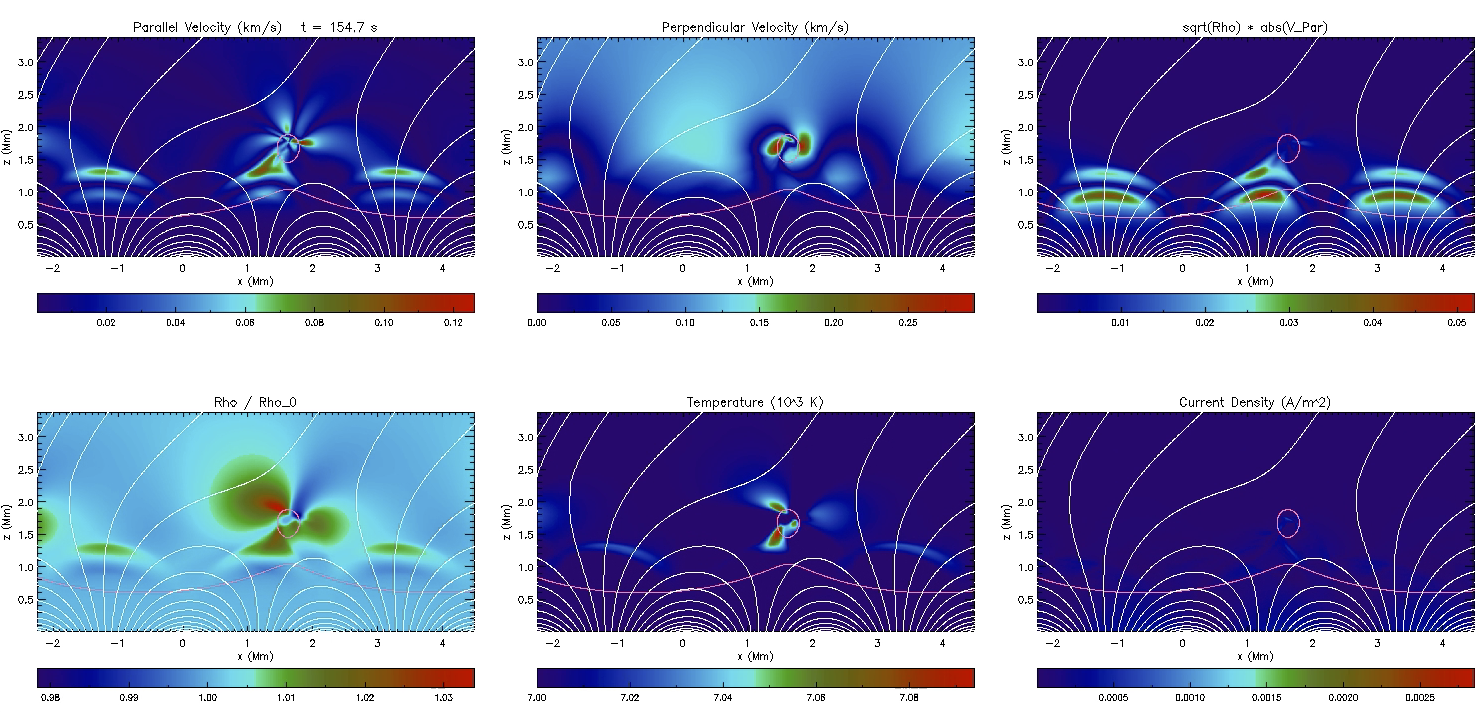
Shortly after the driver activates, the initially flat wavefront it produces begins to experience variation in its horizontal structure. Areas with higher magnetic field strength and consequently higher Alfvén velocities cause the fast wave to propagate faster. Various parts of the wavefront therefore reach the equipartition layer asynchronously. This is further influenced by the initial variation in height of the equipartition layer.
Eventually, all parts of the wavefront reach the equipartition layer and all are engaged in mode conversion/transmission. In areas of closed magnetic field, the generally large attack angle between the wave vector and the magnetic field sees significant conversion observed, where the majority of the energy in the acoustic (fast) wave is transmitted into the magnetic (fast) wave above . In contrast, areas of open magnetic field correspond to smaller attack angles and significant acoustic-to-acoustic (fast-to-slow) transmission is observed.
Following this process, the fast wave around the central axis begins to propagate fastest across the field and a section quickly veers towards the neutral point (seen clearly in the perpendicular velocity at about s in the linear wave animation). This is the normal wave propagation effect of refraction away from regions of higher wave speed. Soon after, the fast wave turns over as it refracts away from the ever increasing Alfvén velocity high in the atmosphere. The refracted waves now find a common focus with fast waves produced in other areas of the domain as they converge on the island surrounding the neutral point. Meanwhile, the slow wave can easily be seen in parallel velocity images as it continues its passage guided by the field lines.
The incoming fast waves spiral in to the upper area of the island, as further transmission/conversion occurs (see around s). In contrast to the initial transmission/conversion observed around the lower layer, it is hard to delineate where small/large attack angles may occur. This is due to the various trajectories of the incoming waves, the circular nature of the island, as well as the likelihood of multiple overlapping crossings of the layer. It is safe to assume a wide range of attack angles are present, causing various amounts of transmission/conversion to occur. These exchanges occur simultaneously with the slow wave arriving from underneath the neutral point. The ray description of the behaviour around the neutral point is discussed in Subsection \irefD-X.
Inside the island, and so the fast wave is again acoustically dominated. Hence converted fast (acoustic) waves propagate through this island at near the sound speed almost unhindered and travel essentially in straight lines. The transmitted slow magnetic waves, however, are highly bound to the fields lines and are seen to follow the separatrices emanating from the magnetic neutral point. Consequently, significant energy is funnelled both back towards the bottom boundary and out towards the top of the computational box. Those waves propagating downwards will again meet the main layer and experience both transmission and conversion there. The last time slice depicted in Fig. \ireffig:vpar_linear ( s) shows that the beams persist below , though they are no longer tied to the field lines. In fact, they refract to become perpendicular to the field, making clear they are fast (acoustic) beams in .
Meanwhile, in the open field away from the neutral point, the slow waves continue to be guided by the field lines. They freely propagate towards the top of the box and continue to grow in amplitude due to the ever decreasing density.
4.1.1 Neutral Point Behaviour: Ray Description
D-X
As discussed in Section \irefS-X, the behaviour of linear fast waves near the neutral point has been examined using a ray description in the low- limit by Núñez (2017), who found that ray paths describe logarithmic spirals and wave fronts (when concave) form caustics in a finite time that manifest as shocks. The introduction of a nonzero sound speed though introduces an equipartition circle about the point, near and inside which Núñez’s analysis fails. In particular, the spiral will not complete.
Caustics are a well-known feature of optics and ray-tracing generally. They correspond to envelopes formed by rays (Whitham, 1974, p. 247), as seen for example along the top of the ‘arcades’ shown in Fig. \ireffig:ray (top panel) over . Since the rays cross here, the energy density becomes infinite within the ray approximation, suggesting shock formation.111However, as pointed out by Whitham (1974), Sec. 8.8, this is an artefact of linearization. With shocks already present, the wave fronts speed up and typically push the rays apart, thereby inhibiting caustic formation. Nevertheless, their appearance in linearized ray-tracing certainly suggests the development of nonlinearity in reality.

In Figure \ireffig:ray we examine an archetypal isolated neutral point at the origin of the magnetic field with uniform sound speed and density . These values prescribe the units of length, time and mass. The dispersion relation is taken simply as
| (7) |
thereby neglecting the acoustic cutoff and Brunt-Väisälä frequencies relative to wave frequency .222Similar ray calculations were carried out by Tarr and Linton (2019) in 3D, including the Alfvén wave which we have neglected. The wave vector has absolute value and component in the field direction . The ray equations (Weinberg, 1962)
| (8) |
are integrated numerically333A stiffness-switching scheme with projection is used to maintain to high order. from and a range of values with starting wave numbers and calculated from corresponding to an upward propagating fast wave. Keeping track of the phase allows us to identify wavefronts.
Integrations are terminated on leaving the island. We do not take account of mode conversion, so the rays shown inside the island are pure fast (acoustic) rays, which are almost straight. In reality, they will be weakened and some energy transferred to near-field-aligned slow waves, though they are also partially focused, as seen in the lower panel.
The rays are coloured according to their phase, which is zero (red) initially in all cases. Since is homogeneous in and , the ray loci are independent of , but the phase varies along them more quickly at higher frequencies. The illustrated case corresponds to in our dimensionless units.
It is striking that the bulk of the wave power is incident on the top of the equipartition island, where caustics have already formed, suggesting shock formation even for erstwhile-linear waves. This is entirely consistent with the linear simulation of Figure \ireffig:vperp_linear. The breadth of the launch region ( here) determines the compactness of the top “hot spot”; a wider region broadens the focus too.
The structure of caustics is very dependent on initial conditions. Rays that are launched from below with some inclination from the vertical or from a greater depth may strike the island on the side rather than the top, though in all examined cases caustics typically form well before reaching it.
For the nonlinear simulation (see Sec. \irefS-shock-sim), where the fast waves are already shocks well before encountering the neutral point environs, the shocks are further amplified by focusing and severely disrupt the island.
The equipartition curve is notably the site of fast-to-slow mode transmission and conversion, so the oscillations inside the circle, where , will be partially the transmitted slow (i.e., magnetically dominated near-transverse near-field-aligned) and partially the converted fast (acoustic) waves. The transmission and conversion coefficients and depend on attack angle (Schunker and Cally, 2006), and so vary around the circumference of the circle.
Inside the island, the slow waves follow the field lines and their wavelengths decrease quadratically with distance from the neutral point, but approach it only asymptotically along the separatrices. On other (hyperbolic) field lines, they slowly pass by the neutral point before leaving the region through to again partially transmit and convert. The resulting slow waves in will depart the region, progressively more bound to field lines close to the separatrices. The resulting fast waves may again curl back towards the neutral point, and go through the process again.
The fast (now acoustically dominated) waves inside the island travel near-isotropically along almost straight lines to depart the circle on the other side, where they too partially transmit (to slow/acoustic) and partially convert (to fast/magnetic) waves, the former depart and the latter may get caught up in the iterative process. A novel mathematical framework was developed by Tracy et al. (2012) for such an iterative scenario (see also Tracy et al., 2014, Sec. 4.1.2), but the above description is sufficient for our purposes here.
Broadly then, the simple ray calculation, supplemented by a general understanding of fast/slow conversion, captures much of the behaviour of oscillations around the neutral point observed in our linear simulations and those of McLaughlin and Hood (2006), and informs our understanding of them. Specifically, (i) the reflecting fast waves converge from upper left and right on the neutral point; (ii) there is a significant increase in their amplitude as they do so (see Fig. \ireffig:vperp_linear), and even the formation of a shock from a previously linear wave; (iii) complex behaviour takes place inside the island; and (iv) structured slow (field-parallel) waves emerge from the island along the separatrices (compare with the final two frames of Fig. \ireffig:vpar_linear).
4.2 Non-linear Shock Cases
S-shock-sim
As in the linear case, a slab-like driver is implemented along the bottom boundary and is described by Equation (\irefdriver). The associated driver amplitude takes one of three values, km s-1, km s-1, or km s-1, which will be termed the weak, moderate and strong driver/shock cases respectively. The weak driver amplitude is chosen such that the ensuing shock develops just before reaching the layer. Accordingly, the moderate and strong drivers produce shocks that develop well before reaching the layer. Strong shocks are associated with greater compression ratios , where and are the pre- and post-shock densities respectively, and also are faster.
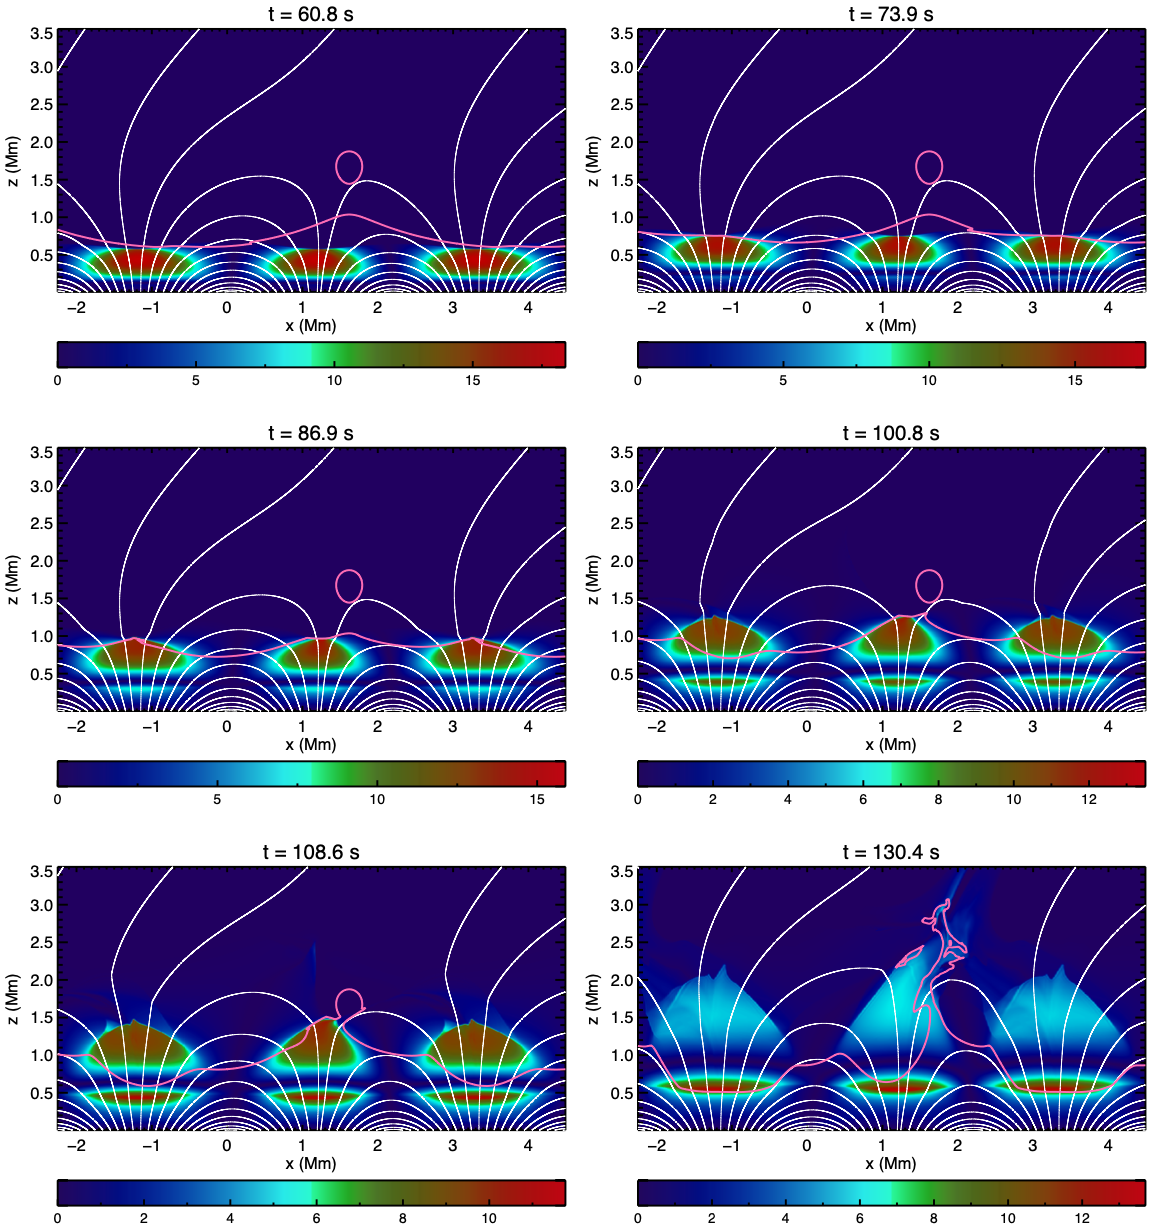
A timeline of events in the weak shock case is displayed in Figures \ireffig:vperp_weak and \ireffig:vpar_weak, again showing both the perpendicular and (scaled) parallel plasma velocities respectively. The general description of fast/slow wave propagation is not dissimilar to that of the linear case described earlier, in particular the partial refraction of the fast wave towards the neutral point and the continued progress of the slow wave up the open field lines, as is evident in Fig. \ireffig:weak_anim and its attached animation. However, the creation of non-linear shock waves produces some notable changes when compared to the linear case and these are described in detail in Section \irefS-Discussion. The increasing driver strength between the shock simulations acts to enhance the phenomena identified and this is also discussed.
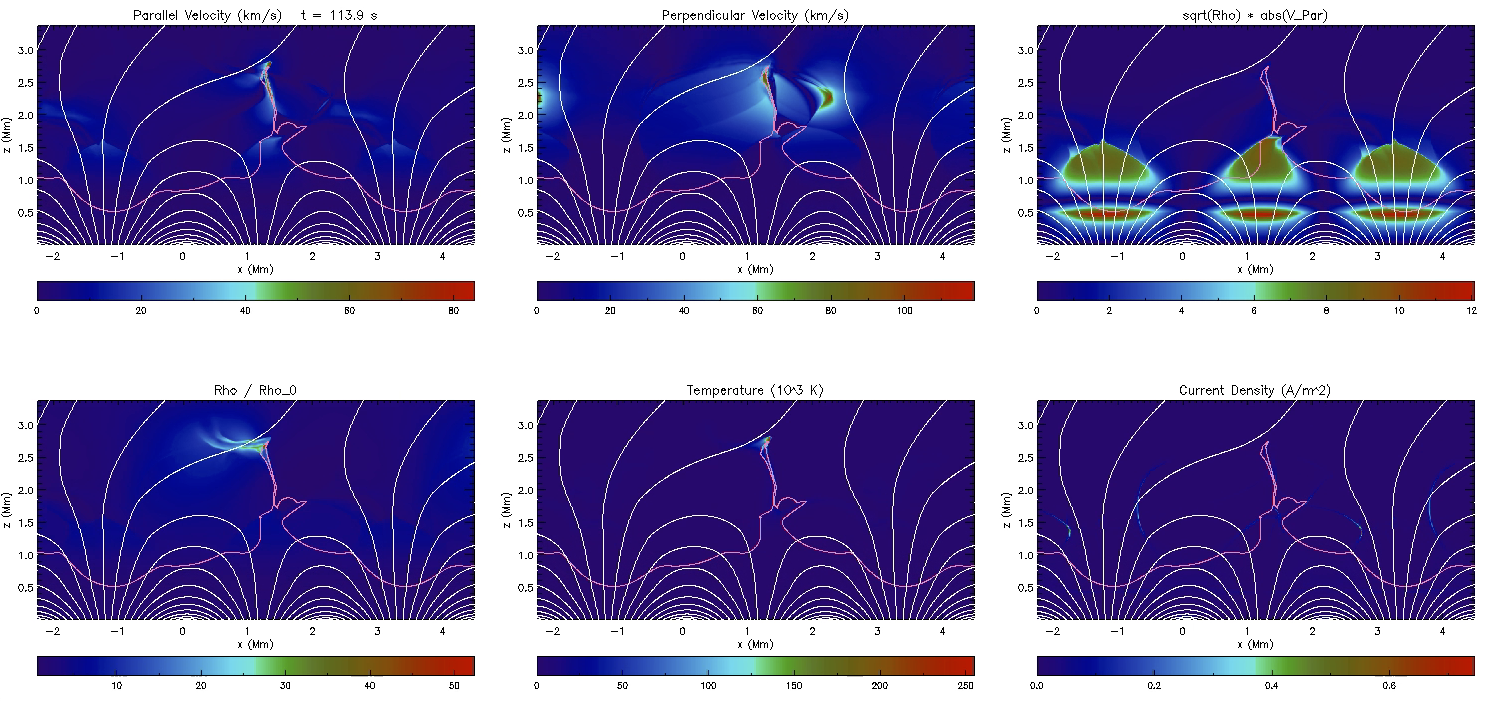
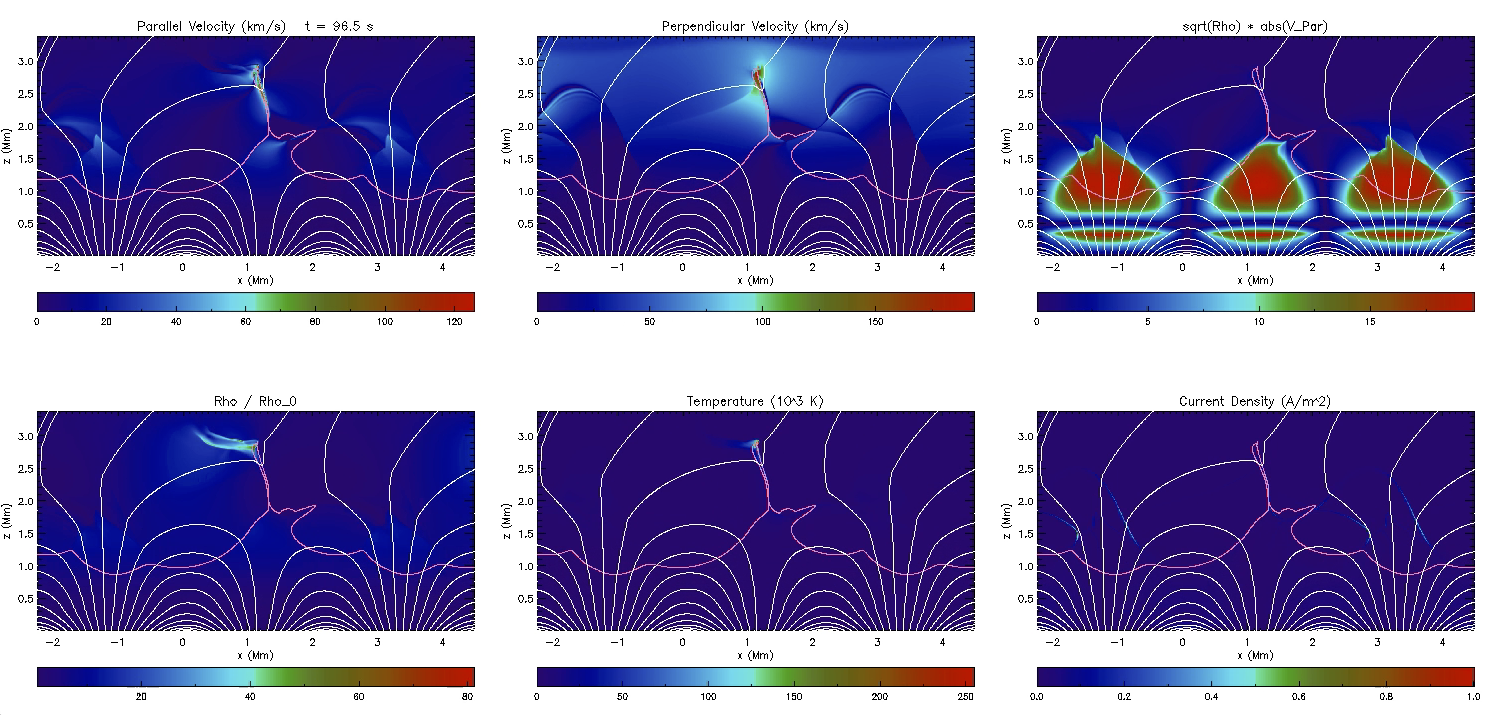
Figures \ireffig:weak_anim and \ireffig:strong_anim are frames from animations of the weak and strong shock cases respectively that show both parallel and perpendicular velocity components as well as density, temperature and current density. Unlike the linear case, the magnetic field lines and equipartition surfaces move substantially.
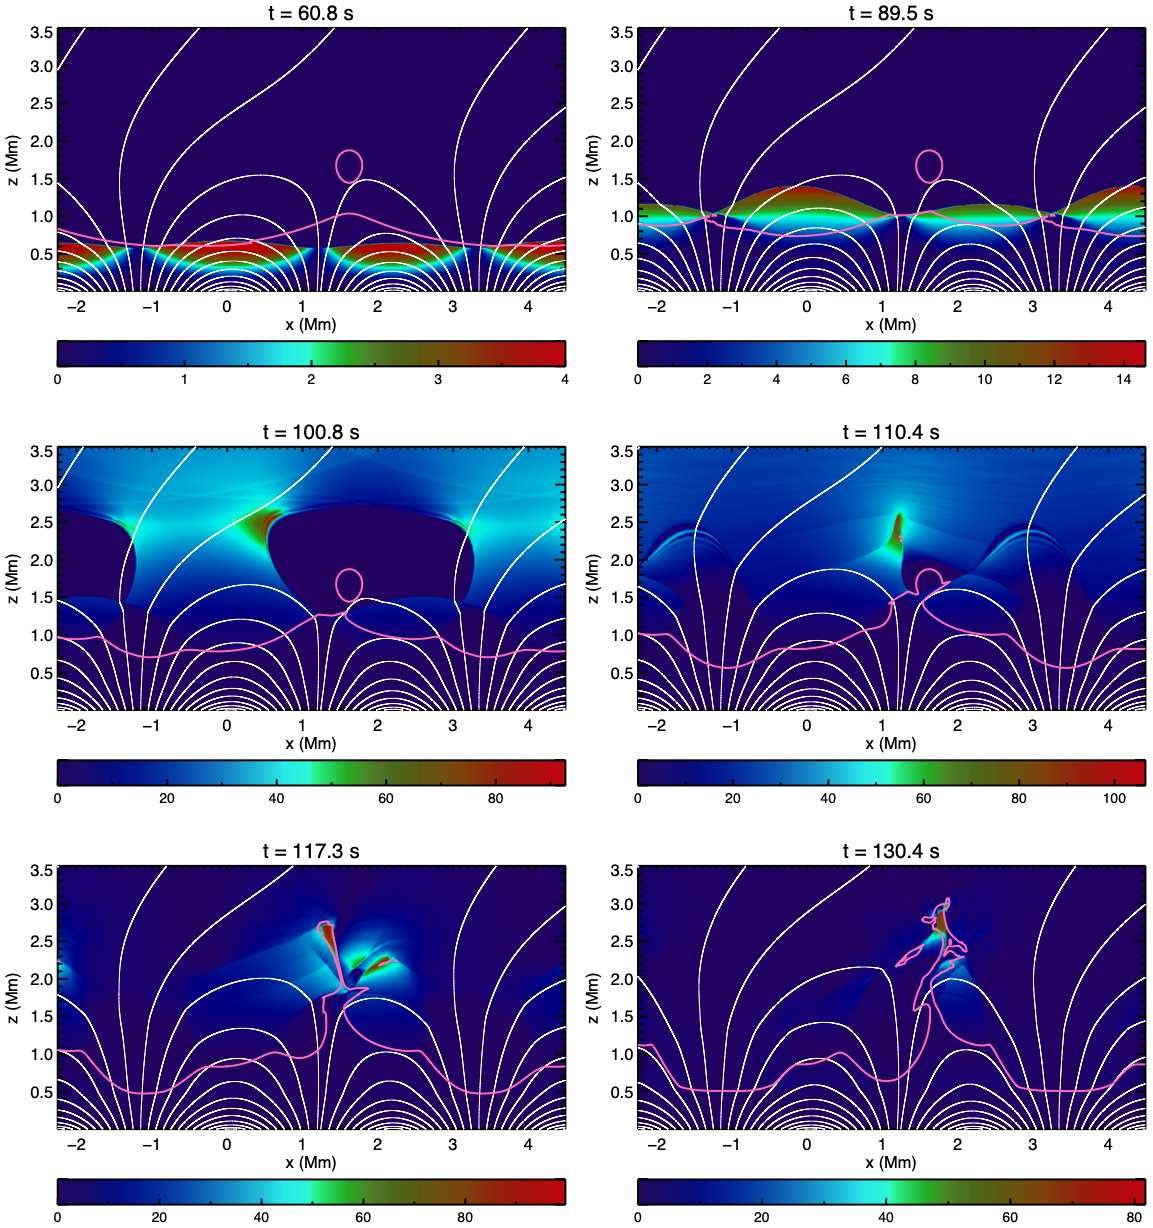
The strong shock (Fig. \ireffig:strong_anim and animation) behaves similarly to the weak shock, though the equipartition level is dragged even further, and the magnetic island is disrupted even more violently. The behaviour of the different strength shocks is discussed in more detail in Section \irefS-Discussion.
5 Analysis and Discussion
S-Discussion
In this article, we have sought to explore shock behaviour in a solar-like magnetic geometry exhibiting open and closed field and neutral points, to see how the basic behaviours of mode conversion, distinct fates of fast and slow waves, and shock smoothing translate and play out.
Animations corresponding to Figures \ireffig:vperp_weak and \ireffig:vpar_weak make it clear that the incident fast shock from below does indeed split into fast and slow components on reaching . Furthermore, it is particularly clear in the s and s panels of Fig. \ireffig:vpar_weak that the equipartition level in the open field region is dragged several hundred kilometres upward by the shock before bouncing back to near its original position.
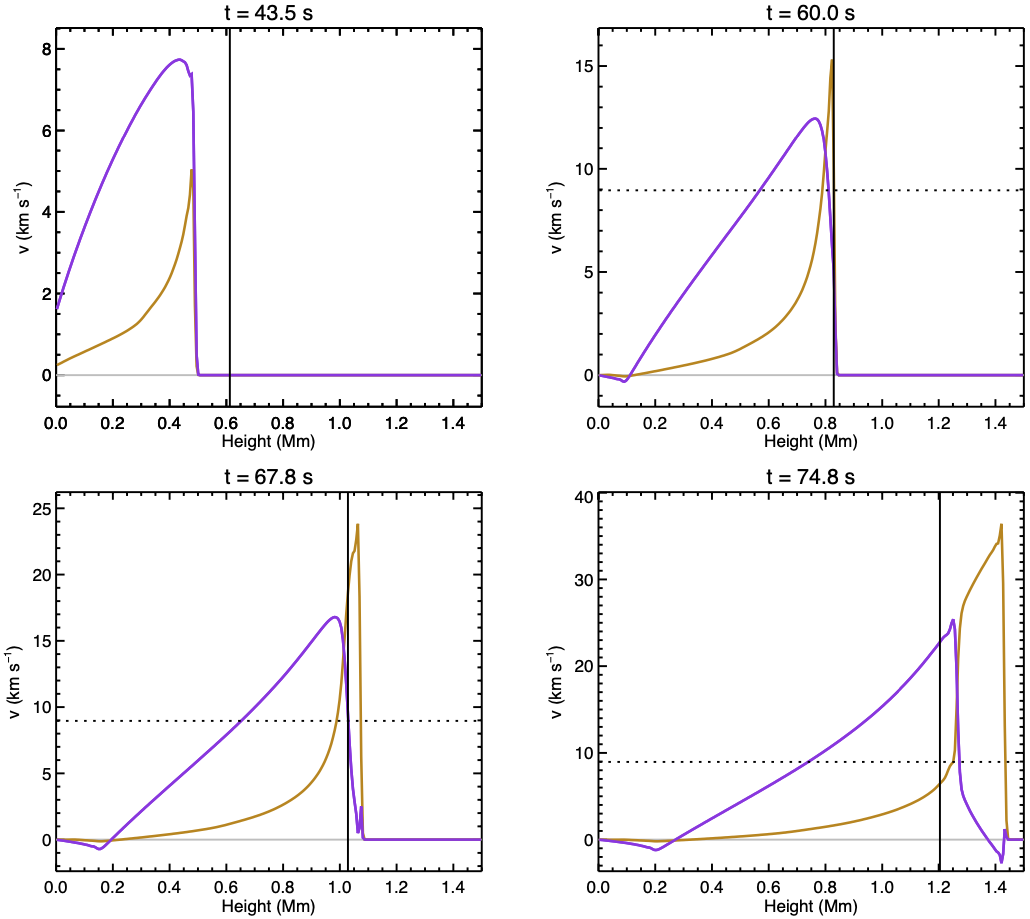
This behaviour is also seen in Fig. \ireffig:smooth, displaying parallel and perpendicular velocities in the strong shock along a vertical slice in the open field at Mm. Here, the initial angle between the incoming shock front and the magnetic field varies from at Mm to at Mm – these heights correspond to the initial and final location of the layer as the shock passes through. In the first panel ( s), a single fast shock with both velocity components discontinuous approaches the level (vertical black line), reaching it in the second panel ( s). By the third panel ( s) it has dragged the layer over 200 km upward, and the perpendicular (gold) and parallel (purple) components have clearly separated into two distinct wave fronts, the former still discontinuous, but the latter now smoothed. By the final panel ( s) the slow front has steepened again and a slow shock is reforming. The layer has been dragged a further 200 km by this stage. As the shock exits, the layer is seen to rebound back towards its initial equilibrium location (seen for the weak shock in Figs. \ireffig:vperp_weak and \ireffig:vpar_weak, but more pronounced for the strong shock). This is consistent with the 1.5D results. In fact, the degree of acoustic smoothing seen in the second panel of Fig. \ireffig:smooth is comparable to or in excess of that displayed in Fig. 2 () of Pennicott and Cally (2019). The small attack angle for the slice Mm of Fig. \ireffig:smooth results in clear but mild smoothing.
To quantify the smoothing we define the velocity scale height
| (9) |
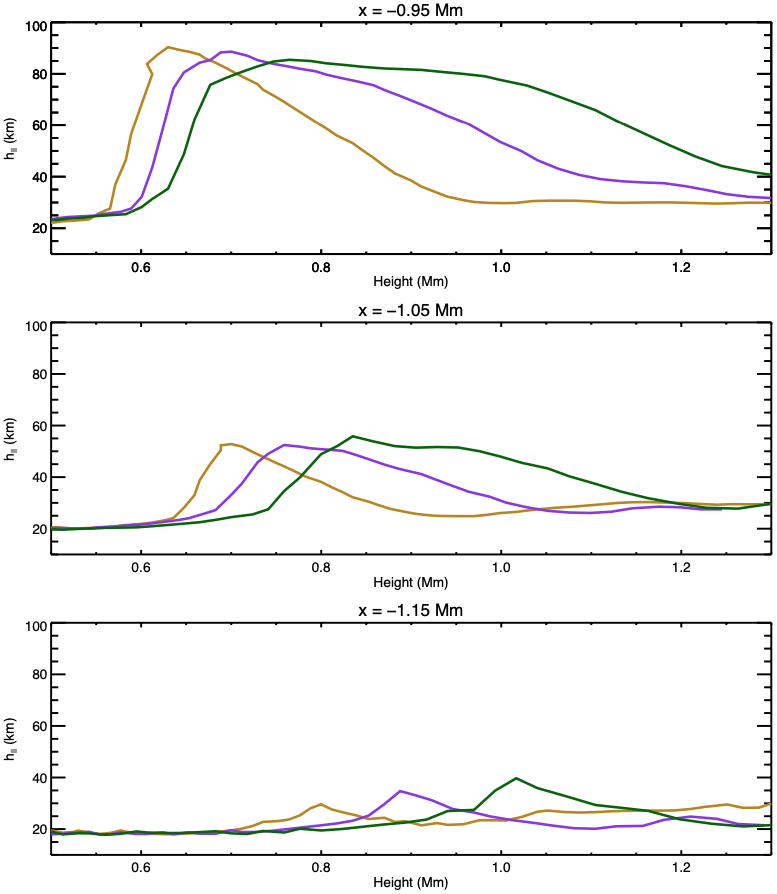
as in Pennicott and Cally (2019), which provides a measure of the steepness of the parallel-velocity front. For a ‘mathematical’ shock it should be zero, but for numerical reasons it does not drop much below about 20 km, even in a clearly fully developed shock. In the absence of viscosity, the shortest scale-length will be the grid-resolution for this Lagrangian-remap scheme. However, shocks would lead to some Gibbs overshoot so shock viscosity is always applied, leading to an increased minimum scale length. Values for are depicted in Fig. \ireffig:drag along three neighbouring vertical slices in the open-field region for weak, moderate and strong shocks. Here, it is plotted against height as the front propagated upwards, so greater corresponds to later times.
Broadly, we see that the stronger shocks drag the layer further, and therefore that the smoothing is apparent at greater heights, both in terms of the initial smoothing event and the persistence. Specifically, at Mm for example, the strong-shock front is still highly smoothed at Mm whereas the weak and moderate shocks have re-steepened considerably by this stage. Reference to Fig. \ireffig:vperp_weak or \ireffig:vpar_weak shows that the magnetic field is highly inclined at Mm, less so at Mm and almost vertical at Mm, thereby explaining the diminishing magnitude and persistence of the smoothing with this shift in .
In the bottom left panel of Fig. \ireffig:vpar_weak, we see that even for the weak shock the dragging of the layer causes a promontory to be created as the primary layer merges with that of the neutral point island. This is further deformed as the simulation progresses and as more waves converge on the area. The stronger the initial shock, the more deformation of the original equilibrium is observed. Because of the deformation of the island, the acoustic waves exiting this area are not as concentrated as they were in the linear case since they now have no common origin to be expelled from.
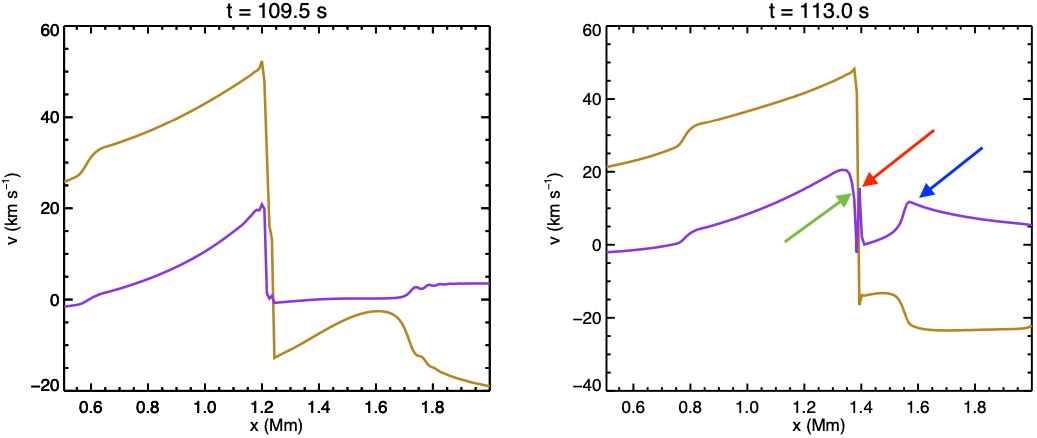
This island/promontory presents the opportunity to explore a further question: does smoothing again occur when the incident fast shock propagates from to ? Figure \ireffig:island depicts the parallel and perpendicular velocities along a horizontal slice through the promontory just as the shock reaches (left) and a few seconds after (right), though it is still dragging the layer. The region at this stage is very dynamic, having already been impacted by a disturbance from the right, which is seen at s at about Mm and at s at around Mm. The splitting of the left-moving shock into fast and slow components is again apparent. At s, there is a clear fast front at about Mm, indicated by the red arrow, showing sharply in both velocity components. The slow shock is now most apparent in the parallel velocity, and is clearly smoothed (green arrow), though the fast shock also has a parallel component (the sharp purple spike). Shortly after the times depicted, the leftward and rightward waves collide, and interpretation becomes more difficult.
Finally, we turn to magnetic heating. The dissipation and attendant heating associated with currents in the solar atmosphere can take several forms. In the partially ionized quiet or active chromosphere, the ambipolar diffusion coefficient is often orders of magnitude larger than the ohmic diffusion term (Khomenko et al., 2014, Figs. 5 to 7). Both effects are enhanced by the production of small scales in turbulence, phase mixing, resonant absorption, etc., that locally amplify the current density . Both shocks and neutral points generate small scales, and so are natural sites for electrical heating.
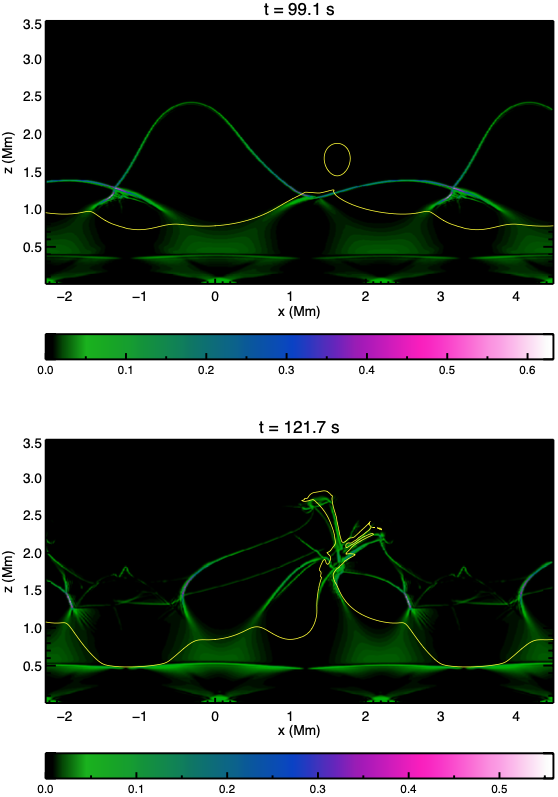
Figure \ireffig:curlb depicts the -component of the current density at two times for the weak shock. The top panel ( s) is from shortly after the initial mode conversion at the primary equipartition level, and clearly shows the locations of both the fast and slow fronts. The neutral point island has not yet been disturbed. The magnitude of the peak current density is inevitably underestimated due to finite numerical resolution, but its sharpness is nevertheless made clear. The lower panel ( s) shows how the disruption of the neutral point greatly enhances the opportunity for diffusive heating by creating much more fine structure, and this should be even more pronounced in 3D. Our simulations do not include 3D or diffusive terms, so these observations are qualitative, not quantitative, simply showing that transient sites favourable for dissipative heating are created by shocks, especially in concert with neutral points. However, in their MBP modelling, Tarr and Linton (2019) find that the attendant heating is still insufficient to supply radiative losses. Shock smoothing would further reduce heating.
6 Conclusions
S-conclusions In summary, we have confirmed the shock smoothing process in a more realistic 2D model, and illustrated the differing paths and fates of the fast and slow shocks/fronts in open and closed field regions. Fast wave reflection away from high Alfvén speed regions is responsible for important solar processes even in the linear regime (e.g., fast/Alfvén conversion and the generation of acoustic halos around active regions Cally and Hansen, 2011; Rijs et al., 2016), but fast shocks have been shown to be well-capable of significantly disrupting neutral point structure and generating fine spatial scales. That fast shocks convert to fast shocks across equipartition surfaces is an important feature illustrated by our simulations.
It is also apparent that stronger shocks drag the equipartition layer further, and consequently the slow-wave smoothing interlude lasts longer in both time and space, which in some ways runs counter to intuition: the stronger the incident shock, the longer it takes the transmitted slow wave to re-shock.
Finally, we have verified for the first time that shocks moving from to split also (Fig. \ireffig:island), and that the resulting slow component is again smoothed whilst the fast component remains sharp. This is consistent with the very small extent in of the slow lobe of the shock adiabatic seen in Fig. 7 of Pennicott and Cally (2019).
References
- Arber et al. (2001) Arber, T.D., Longbottom, A.W., Gerrard, C.L., Milne, A.M.: 2001, A Staggered Grid, Lagrangian-Eulerian Remap Code for 3-D MHD Simulations. Journal of Computational Physics 171, 151. DOI. ADS.
- Bazer and Ericson (1959) Bazer, J., Ericson, W.B.: 1959, Hydromagnetic Shocks. ApJ 129, 758. DOI. ADS.
- Braun, Duvall, and Labonte (1988) Braun, D.C., Duvall, T.L. Jr., Labonte, B.J.: 1988, The absorption of high-degree p-mode oscillations in and around sunspots. ApJ 335, 1015. DOI. ADS.
- Cally and Hansen (2011) Cally, P.S., Hansen, S.C.: 2011, Benchmarking Fast-to-Alfvén Mode Conversion in a Cold Magnetohydrodynamic Plasma. ApJ 738, 119. DOI. ADS.
- Cally and Moradi (2013) Cally, P.S., Moradi, H.: 2013, Seismology of the wounded Sun. MNRAS 435, 2589. DOI. ADS.
- Cally, Crouch, and Braun (2003) Cally, P.S., Crouch, A.D., Braun, D.C.: 2003, Probing sunspot magnetic fields with p-mode absorption and phase shift data. MNRAS 346, 381. DOI. ADS.
- Carlsson, De Pontieu, and Hansteen (2019) Carlsson, M., De Pontieu, B., Hansteen, V.H.: 2019, New View of the Solar Chromosphere. ARA&A 57, 189. DOI. ADS.
- Hansen and Cally (2009) Hansen, S.C., Cally, P.S.: 2009, An Exact Test of Generalised Ray Theory in Local Helioseismology. Sol. Phys. 255, 193. DOI. ADS.
- Khomenko and Cally (2012) Khomenko, E., Cally, P.S.: 2012, Numerical Simulations of Conversion to Alfvén Waves in Sunspots. ApJ 746, 68. DOI. ADS.
- Khomenko and Calvo Santamaria (2013) Khomenko, E., Calvo Santamaria, I.: 2013, Magnetohydrodynamic waves driven by p-modes. J. Phys.: Conf. Ser. 440, 012048.
- Khomenko et al. (2014) Khomenko, E., Collados, M., Díaz, A., Vitas, N.: 2014, Fluid description of multi-component solar partially ionized plasma. Physics of Plasmas 21(9), 092901. DOI. ADS.
- McLaughlin and Hood (2004) McLaughlin, J.A., Hood, A.W.: 2004, MHD wave propagation in the neighbourhood of a two-dimensional null point. A&A 420, 1129. DOI. ADS.
- McLaughlin and Hood (2006) McLaughlin, J.A., Hood, A.W.: 2006, MHD mode coupling in the neighbourhood of a 2D null point. A&A 459, 641. DOI. ADS.
- McLaughlin, Hood, and de Moortel (2011) McLaughlin, J.A., Hood, A.W., de Moortel, I.: 2011, Review Article: MHD Wave Propagation Near Coronal Null Points of Magnetic Fields. Space Sci. Rev. 158(2-4), 205. DOI. ADS.
- McLaughlin et al. (2009) McLaughlin, J.A., De Moortel, I., Hood, A.W., Brady, C.S.: 2009, Nonlinear fast magnetoacoustic wave propagation in the neighbourhood of a 2D magnetic X-point: oscillatory reconnection. A&A 493(1), 227. DOI. ADS.
- Nakariakov and Melnikov (2009) Nakariakov, V.M., Melnikov, V.F.: 2009, Quasi-Periodic Pulsations in Solar Flares. Space Sci. Rev. 149, 119. DOI. ADS.
- Núñez (2017) Núñez, M.: 2017, Geometry and dynamics of fast magnetosonic wavefronts near magnetic null points. Communications in Nonlinear Science and Numerical Simulations 43, 158. DOI. ADS.
- Núñez (2019) Núñez, M.: 2019, Smoothing of shocks in wave conversion of magnetosonic waves. EPL (Europhysics Letters) 125, 44002. DOI. ADS.
- Nutto, Steiner, and Roth (2010) Nutto, C., Steiner, O., Roth, M.: 2010, Magneto-acoustic wave propagation and mode conversion in a magnetic solar atmosphere: Comparing results from the CO5BOLD code with ray theory. Astronomische Nachrichten 331, 915. DOI. ADS.
- Nutto, Steiner, and Roth (2012) Nutto, C., Steiner, O., Roth, M.: 2012, Revealing the nature of magnetic shadows with numerical 3D-MHD simulations. A&A 542, L30. DOI. ADS.
- Pennicott and Cally (2019) Pennicott, J.D., Cally, P.S.: 2019, Smoothing of MHD Shocks in Mode Conversion. ApJ 881(1), L21. DOI. https://doi.org/10.3847%2F2041-8213%2Fab3423.
- Priest (1982) Priest, E.R.: 1982, Solar magnetohydrodynamics, D. Reidel, Dordrecht.
- Riedl, Van Doorsselaere, and Calvo Santamaria (2019) Riedl, J.M., Van Doorsselaere, T., Calvo Santamaria, I.: 2019, Wave modes excited by photospheric p-modes and mode conversion in a multi-loop system. A&A 625, A144. DOI. ADS.
- Rijs et al. (2016) Rijs, C., Rajaguru, S.P., Przybylski, D., Moradi, H., Cally, P.S., Shelyag, S.: 2016, 3D Simulations of Realistic Power Halos in Magnetohydrostatic Sunspot Atmospheres: Linking Theory and Observation. ApJ 817, 45. DOI. ADS.
- Schunker and Cally (2006) Schunker, H., Cally, P.S.: 2006, Magnetic field inclination and atmospheric oscillations above solar active regions. MNRAS 372, 551. DOI. ADS.
- Snow and Hillier (2020) Snow, B., Hillier, A.: 2020, Mode conversion of two-fluid shocks in a partially-ionised, isothermal, stratified atmosphere. A&A 637, A97. DOI. ADS.
- Tarr and Linton (2019) Tarr, L.A., Linton, M.: 2019, The Formation and Dissipation of Current Sheets and Shocks due to Compressive Waves in a Stratified Atmosphere Containing a Magnetic Null. ApJ 879(2), 127. DOI. ADS.
- Threlfall et al. (2012) Threlfall, J., Parnell, C.E., De Moortel, I., McClements, K.G., Arber, T.D.: 2012, Nonlinear wave propagation and reconnection at magnetic X-points in the Hall MHD regime. A&A 544, A24. DOI. ADS.
- Tracy, Kaufman, and Brizard (2003) Tracy, E.R., Kaufman, A.N., Brizard, A.J.: 2003, Ray-based methods in multidimensional linear wave conversion. Physics of Plasmas 10, 2147. DOI. ADS.
- Tracy et al. (2012) Tracy, E.R., Brizard, A.J., Johnston, D., Kaufman, A.N., Richardson, A.S., Zobin, N.: 2012, Rooms with a view: A novel approach to iterated multidimensional wave conversion. Communications in Nonlinear Science and Numerical Simulations 17, 2161. DOI. ADS.
- Tracy et al. (2014) Tracy, E.R., Brizard, A.J., Richardson, A.S., Kaufman, A.N.: 2014, Ray Tracing and Beyond, Cambridge University Press, Cambridge, UK. ISBN 978-0521768061. ADS.
- Van Doorsselaere, Kupriyanova, and Yuan (2016) Van Doorsselaere, T., Kupriyanova, E.G., Yuan, D.: 2016, Quasi-periodic Pulsations in Solar and Stellar Flares: An Overview of Recent Results (Invited Review). Sol. Phys. 291(11), 3143. DOI. ADS.
- Weinberg (1962) Weinberg, S.: 1962, Eikonal Method in Magnetohydrodynamics. Physical Review 126, 1899. DOI. ADS.
- Whitham (1974) Whitham, G.B.: 1974, Linear and nonlinear waves, Wiley, New York.