.tiff
Deep learning enables reference-free isotropic super-resolution for volumetric fluorescence microscopy
Abstract
Volumetric imaging by fluorescence microscopy is often limited by anisotropic spatial resolution from inferior axial resolution compared to the lateral resolution. To address this problem, here we present a deep-learning-enabled unsupervised super-resolution technique that enhances anisotropic images in volumetric fluorescence microscopy. In contrast to the existing deep learning approaches that require matched high-resolution target volume images, our method greatly reduces the effort to put into practice as the training of a network requires as little as a single 3D image stack, without a priori knowledge of the image formation process, registration of training data, or separate acquisition of target data. This is achieved based on the optimal transport driven cycle-consistent generative adversarial network that learns from an unpaired matching between high-resolution 2D images in lateral image plane and low-resolution 2D images in the other planes. Using fluorescence confocal microscopy and light-sheet microscopy, we demonstrate that the trained network not only enhances axial resolution, but also restores suppressed visual details between the imaging planes and removes imaging artifacts.
Department of Bio and Brain Engineering, KAIST, Daejeon, Republic of Korea
Department of Physiology and Biomedical Sciences, Seoul National University College of Medicine, Seoul, Republic of Korea
Neuroscience Research Institute, Seoul National University College of Medicine, Seoul, Republic of Korea
Department of Mechanical Engineering, Pohang University of Science and Technology, Pohang, Republic of Korea
Division of Integrative Biosciences and Biotechnology, Pohang University of Science and Technology, Pohang, Republic of Korea
Three-dimensional (3D) fluorescence imaging reveals important structural information about a biological sample that is typically unobtainable from a two-dimensional (2D) image. The recent advancements in tissue-clearing methods[1, 2, 3, 4, 5], and light-sheet fluorescence microscopy (LSFM)[6, 7, 8, 9] have enabled streamlined 3D visualization of a biological tissue at an unprecedented scale and speed, sometimes even in finer details. Nonetheless, spatial resolution of 3D fluorescence microscopy images is still far from perfection: isotropic resolution remains difficult to achieve.
Anisotropy in fluorescence microscopy typically refers to more blurriness in the axial imaging plane. Such spatial imbalance in resolution can be attributed to many factors including diffraction of light, axial undersampling, and degree of aberration correction. Even for super-resolution microscopy[10], which in essence surpasses the light diffraction limits, such as 3D-structural illumination microscopy (3D-SIM)[11, 12] or stimulated emission depletion (STED) microscopy[13], matching axial resolution to lateral resolution remains a challenge[14]. While LSFM, where a fluorescence-excitation path does not necessarily align with a detection path, provides substantial enhancement to axial resolution[9], a truly isotropic point spread function (PSF) is difficult to achieve for most contemporary light-sheet microscopy techniques, and axial resolution is usually 2 or 3 times worse than lateral resolution[15, 16, 17].
In the recent years of image restoration applied in fluorescence microscopy, deep learning emerged as an alternative, data-driven approach to replace classical deconvolution algorithms. Deep learning has its advantage in capturing statistical complexity of an image mapping and enabling end-to-end image transformation without painstakingly fine-tuning parameters by hand. Some examples include improving resolution across different imaging modalities or numerical aperture sizes[18], or towards isotropy[19, 20] or less noise[19]. While these methods provide some level of flexibility in practical operation of microscopy, these deep-learning-based methods must assume knowledge of a target data domain for the network training: for example, high-resolution reference images as ground-truths[18] or the 3D structure of the physical PSF as a prior[19, 20, 21]. Such assumption requires the success of image restoration to rely on the accuracy of priors, and adds another layer of operation to microscopists. Especially for high-throughput volumetric fluorescence imaging, imaging conditions are often subject to fluctuation, and visual characteristics of samples are considered diverse. Consequently, uniform assumption of prior information throughout a large-scale image volume could result in over-fitting of the trained model and exacerbate the performance and the reliability of image restoration.
In light of this challenge, the recent approach of unsupervised learning using cycle-consistent generative adversarial network (cycleGAN)[22] is a promising direction for narrowing down the solution space for ill-posed inverse problems in optics[23, 24]. Specifically, it is advantageous in practice as it does not require matched pairs of data for training. When formulated as optimal transport problem between two probability distributions[25, 23], unsupervised learning-based deconvolution microscopy can successfully transport the distributions of blurred images to high-resolution microscopy images by estimating the blurring PSF and deconvolving with it[24]. Moreover, if the structure of the PSF is partially or completely known, one of the generator could be replaced by a simple operation, which significantly reduces the complexity of the cycleGAN and makes the training more stable [24]. Nonetheless, one of the remaining technical issues is the difficulty of obtaining additional volumes of high resolution microscopy images under similar experimental conditions, such as noises, illumination conditions, etc, so that they can be used as unmatched target distribution for the optimal transport. In particular, obtaining such a reference training data set with 3D isotropic resolution is yet challenging in practice.
To address this problem, here we present a novel unsupervised deep learning framework that blindly enhances the axial resolution in fluorescence microscopy, given a single 3D input image volume. The network can be trained with as few as one image stack that has anisotropic spatial resolution without requiring high resolution isotropic 3D reference volumes. Thereby, the need to acquire additional training data set under similar experimental condition is completely avoided. Our framework takes advantage of forming abstract representations of imaged objects that are imaged coherently in lateral and axial views: for example, coherent perspectives of neurons, where there are enough 2D snapshots of a neuron to reconstruct a generalized 3D neuron appearance. Then, our unsupervised learning scheme uses the abstract representation to decouple only the resolution-relevant information from the images, as well as undersampled or blurred details in axial images. For the complete theoretical background, refer to the Methods.
The overall architecture of the framework is inspired by the optimal transport driven cycle-consistent generative adversarial networks (OT-cycleGAN) [23]. Figure 1d illustrates the learning scheme of the framework (more details are available in Supplementary Figure S1). We employ two 3D generative networks ( and in Fig. 1d) that respectively learn to generate an isotropic image volume from an anisotropic image volume (the forward or super-resolving path) and vice versa (the backward or blurring path). To curb the generative process of these networks, we employ two groups of 2D discriminative networks ( and in Fig. 1d). Our key innovation comes from an effective orchestration of the networks’ learning based on what we feed the discriminitive networks with during the learning phase. In the forward path, the discriminative networks of compare the 2D axial images from the generated 3D image volume to the 2D lateral images from the real 3D image volume, while preserving the lateral image information. This pairing encourages 3D generative network to enhance only the axial resolution in the 3D volume output. On the other hand, the discriminative networks of in the backward path compare the 2D images from the reconstructed 3D image volume to the 2D images from the real 3D image volume in each corresponding orthogonal plane: thereby, 3D generative network learns to revert the volume restoration process. The cycle-consistency-loss stabilizes the learning process and guides and to being mutually inverse. By achieving the balance of loss convergence in the form of a mini-max game[26] by this ensemble of discriminative networks and generative networks, the network is trained to learn the transformation from the original anisotropic resolution to the desired isotropic resolution.
We demonstrated the success of the framework in confocal flouorescence microscopy (CFM) and open-top light-sheet microscopy (OT-LSM). In the CFM case, we addressed anisotropy that is mainly driven by light diffraction and axial-undersampling. We compared the results to the image volume that is imaged at a perpendicular angle. In the OT-LSM case, we address anisotropy that is driven by optical aberration caused by a refractive index mismatch and also investigated the PSF deconvolution capability of our method. In both cases, our reference-free deep-learning-based super-resolution approach was effective at improving the axial resolution, while preserving the information in the lateral plane and also restoring the suppressed microstructures.
Results
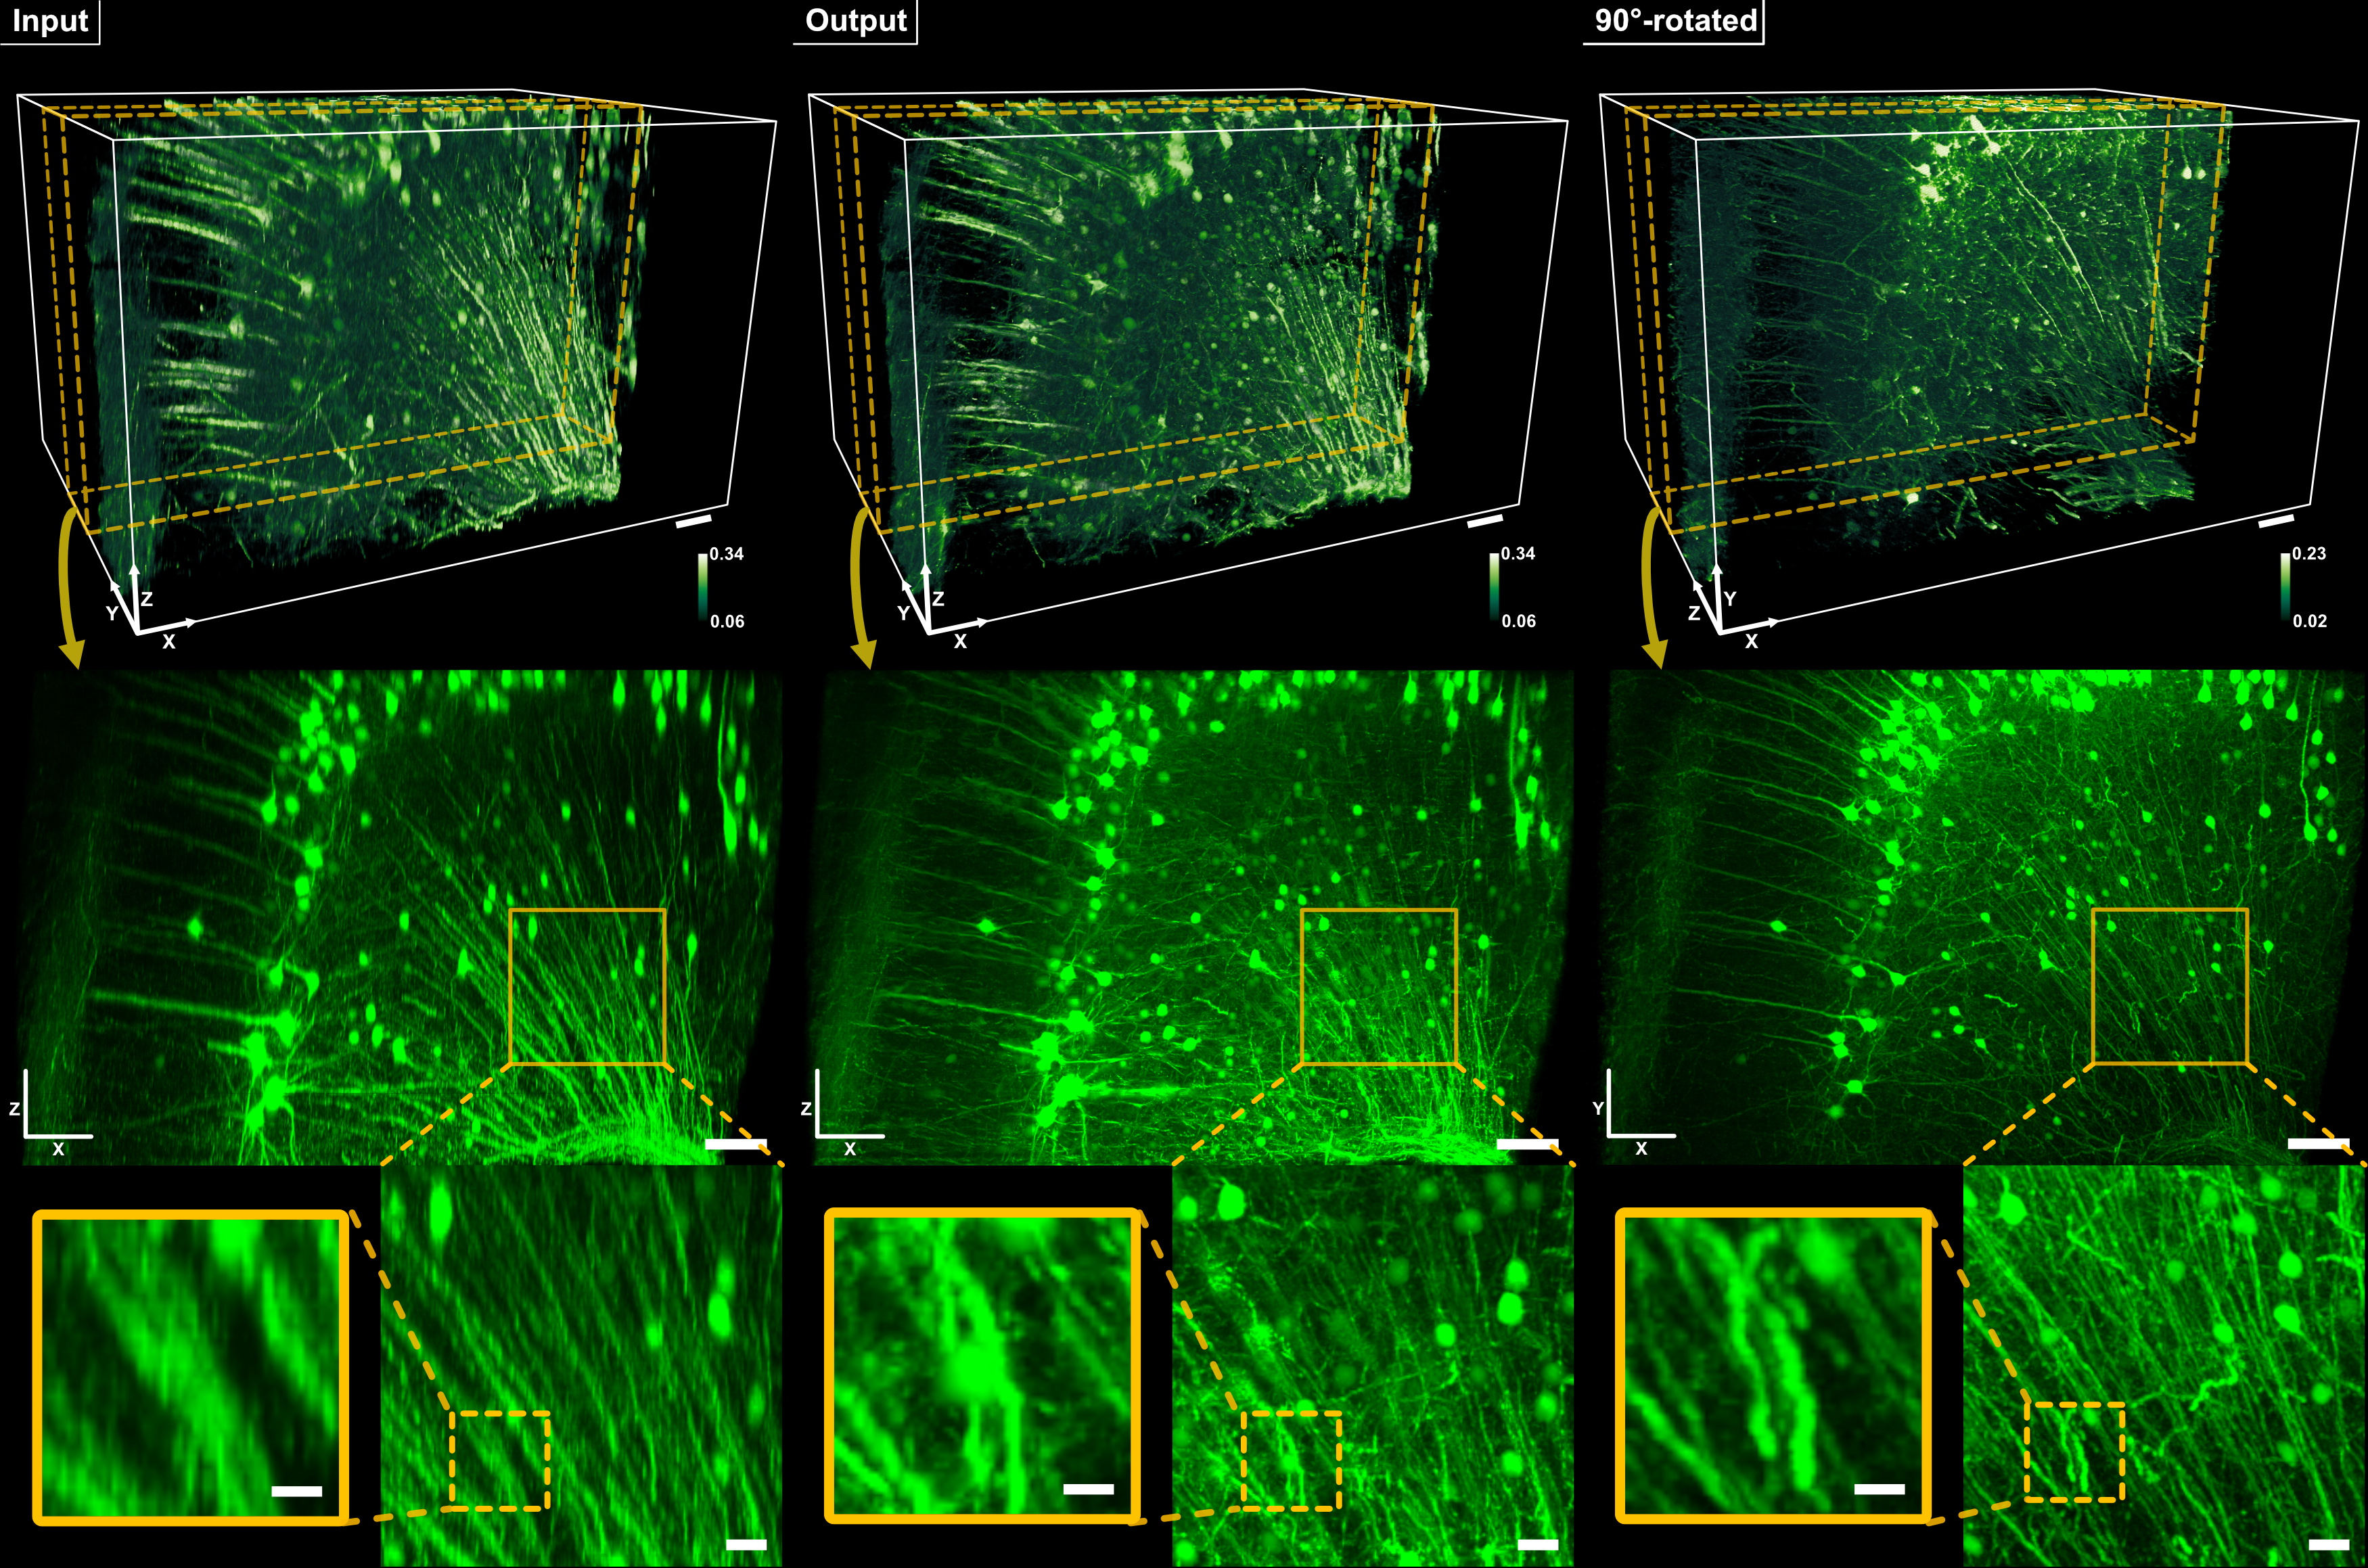
Resolution enhancement in confocal fluorescence microscopy We initially demonstrated the resolution improvement in axial plane by imaging a cortical region of a Thy 1-eYFP mouse brain with CFM. The sample was tissue-cleared and was imaged in 3D using optical sectioning. The optical sectioning by CFM is set up so that the image volume exhibits a stark contrast between lateral resolution and axial resolution, with estimated lateral resolution of 1.24m with a z-depth of 3m interval. The image volume, whose physical size spans approximately 1270930800 m3, was re-sampled for reconstruction isotropically to a voxel size of 1m using bilinear interpolation. The networks were trained using one image sample, and, during training and inference, we used mini-batches with sub-regions of 120-144 pixel. After inference, the sub-regions were stacked back to the original volume space. In order to provide a reference that confirms the resolution improvement is real, we additionally imaged the sample after physically rotating it by 90 degrees, so that its high resolution XY plane would match the axial XZ plane of the original volume, sharing the YZ plane. The reference image volume was then registered on a cell-to-cell level to the input image space using the BigWarp Plugin[27]. While the separately acquired reference is far from a perfect ground-truth image because of its independent imaging condition and potential registration error, it still provides the best available reference as to whether the reconstructed details by the framework match the real physical measurement.
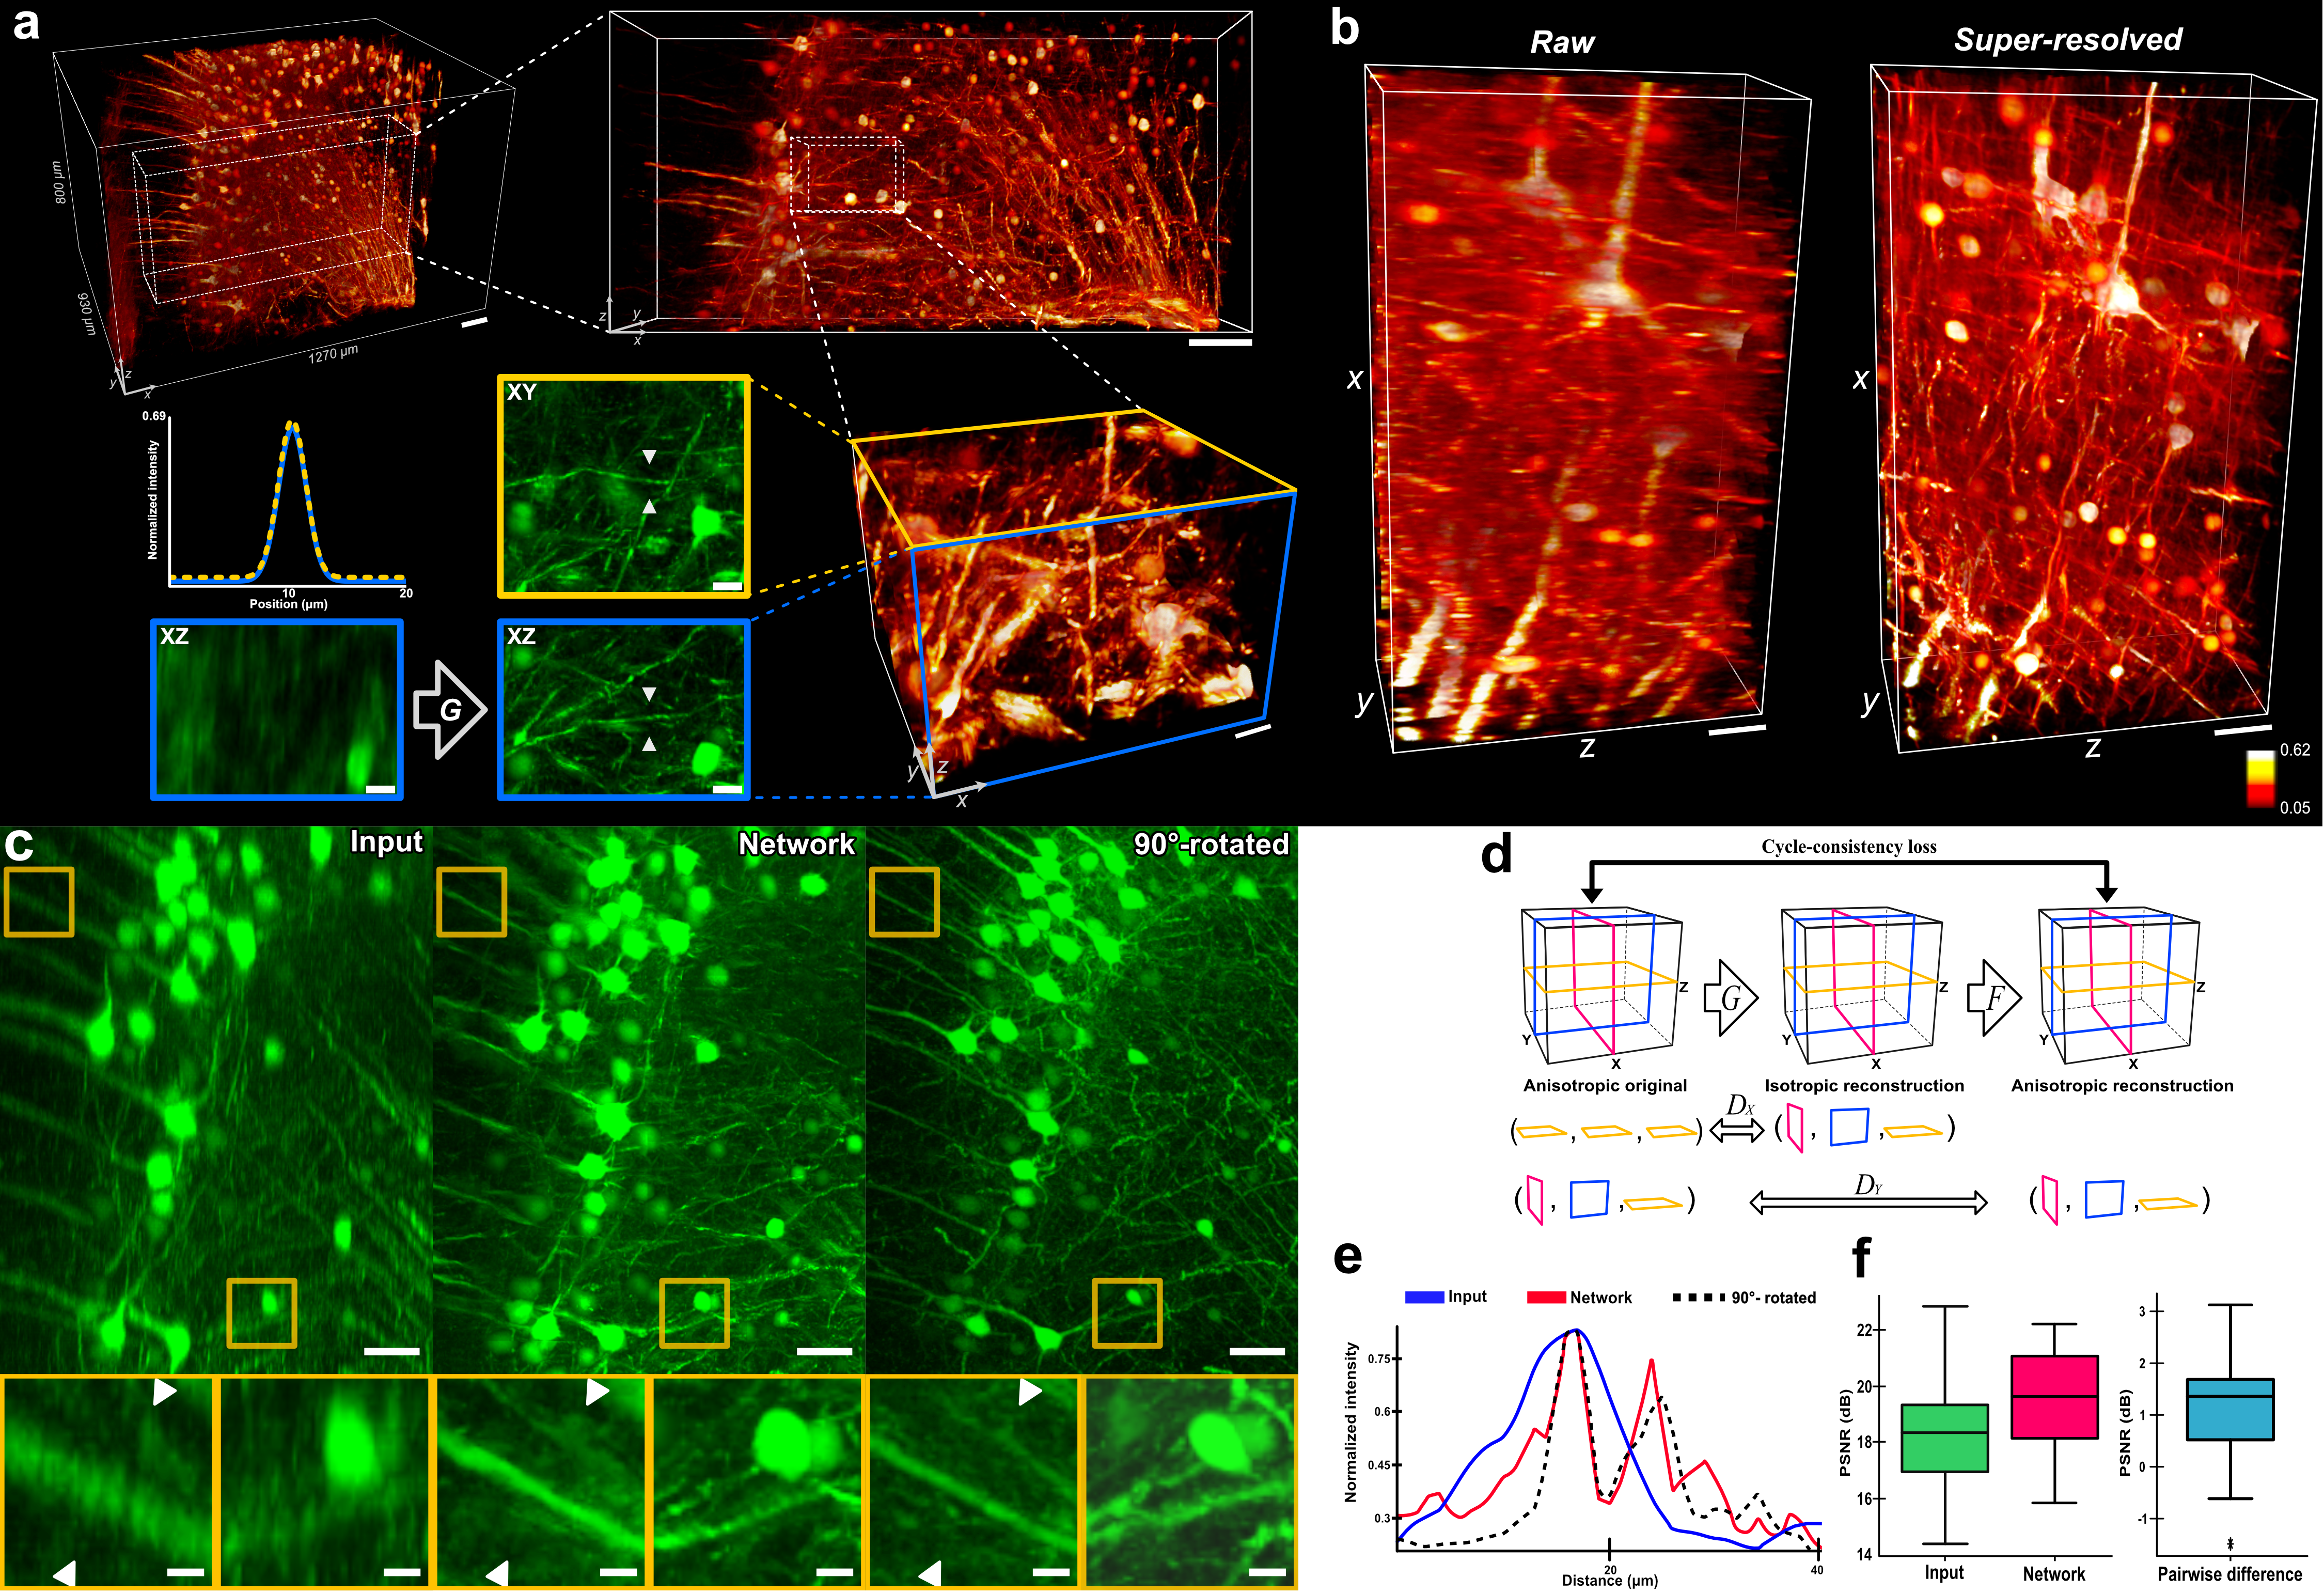
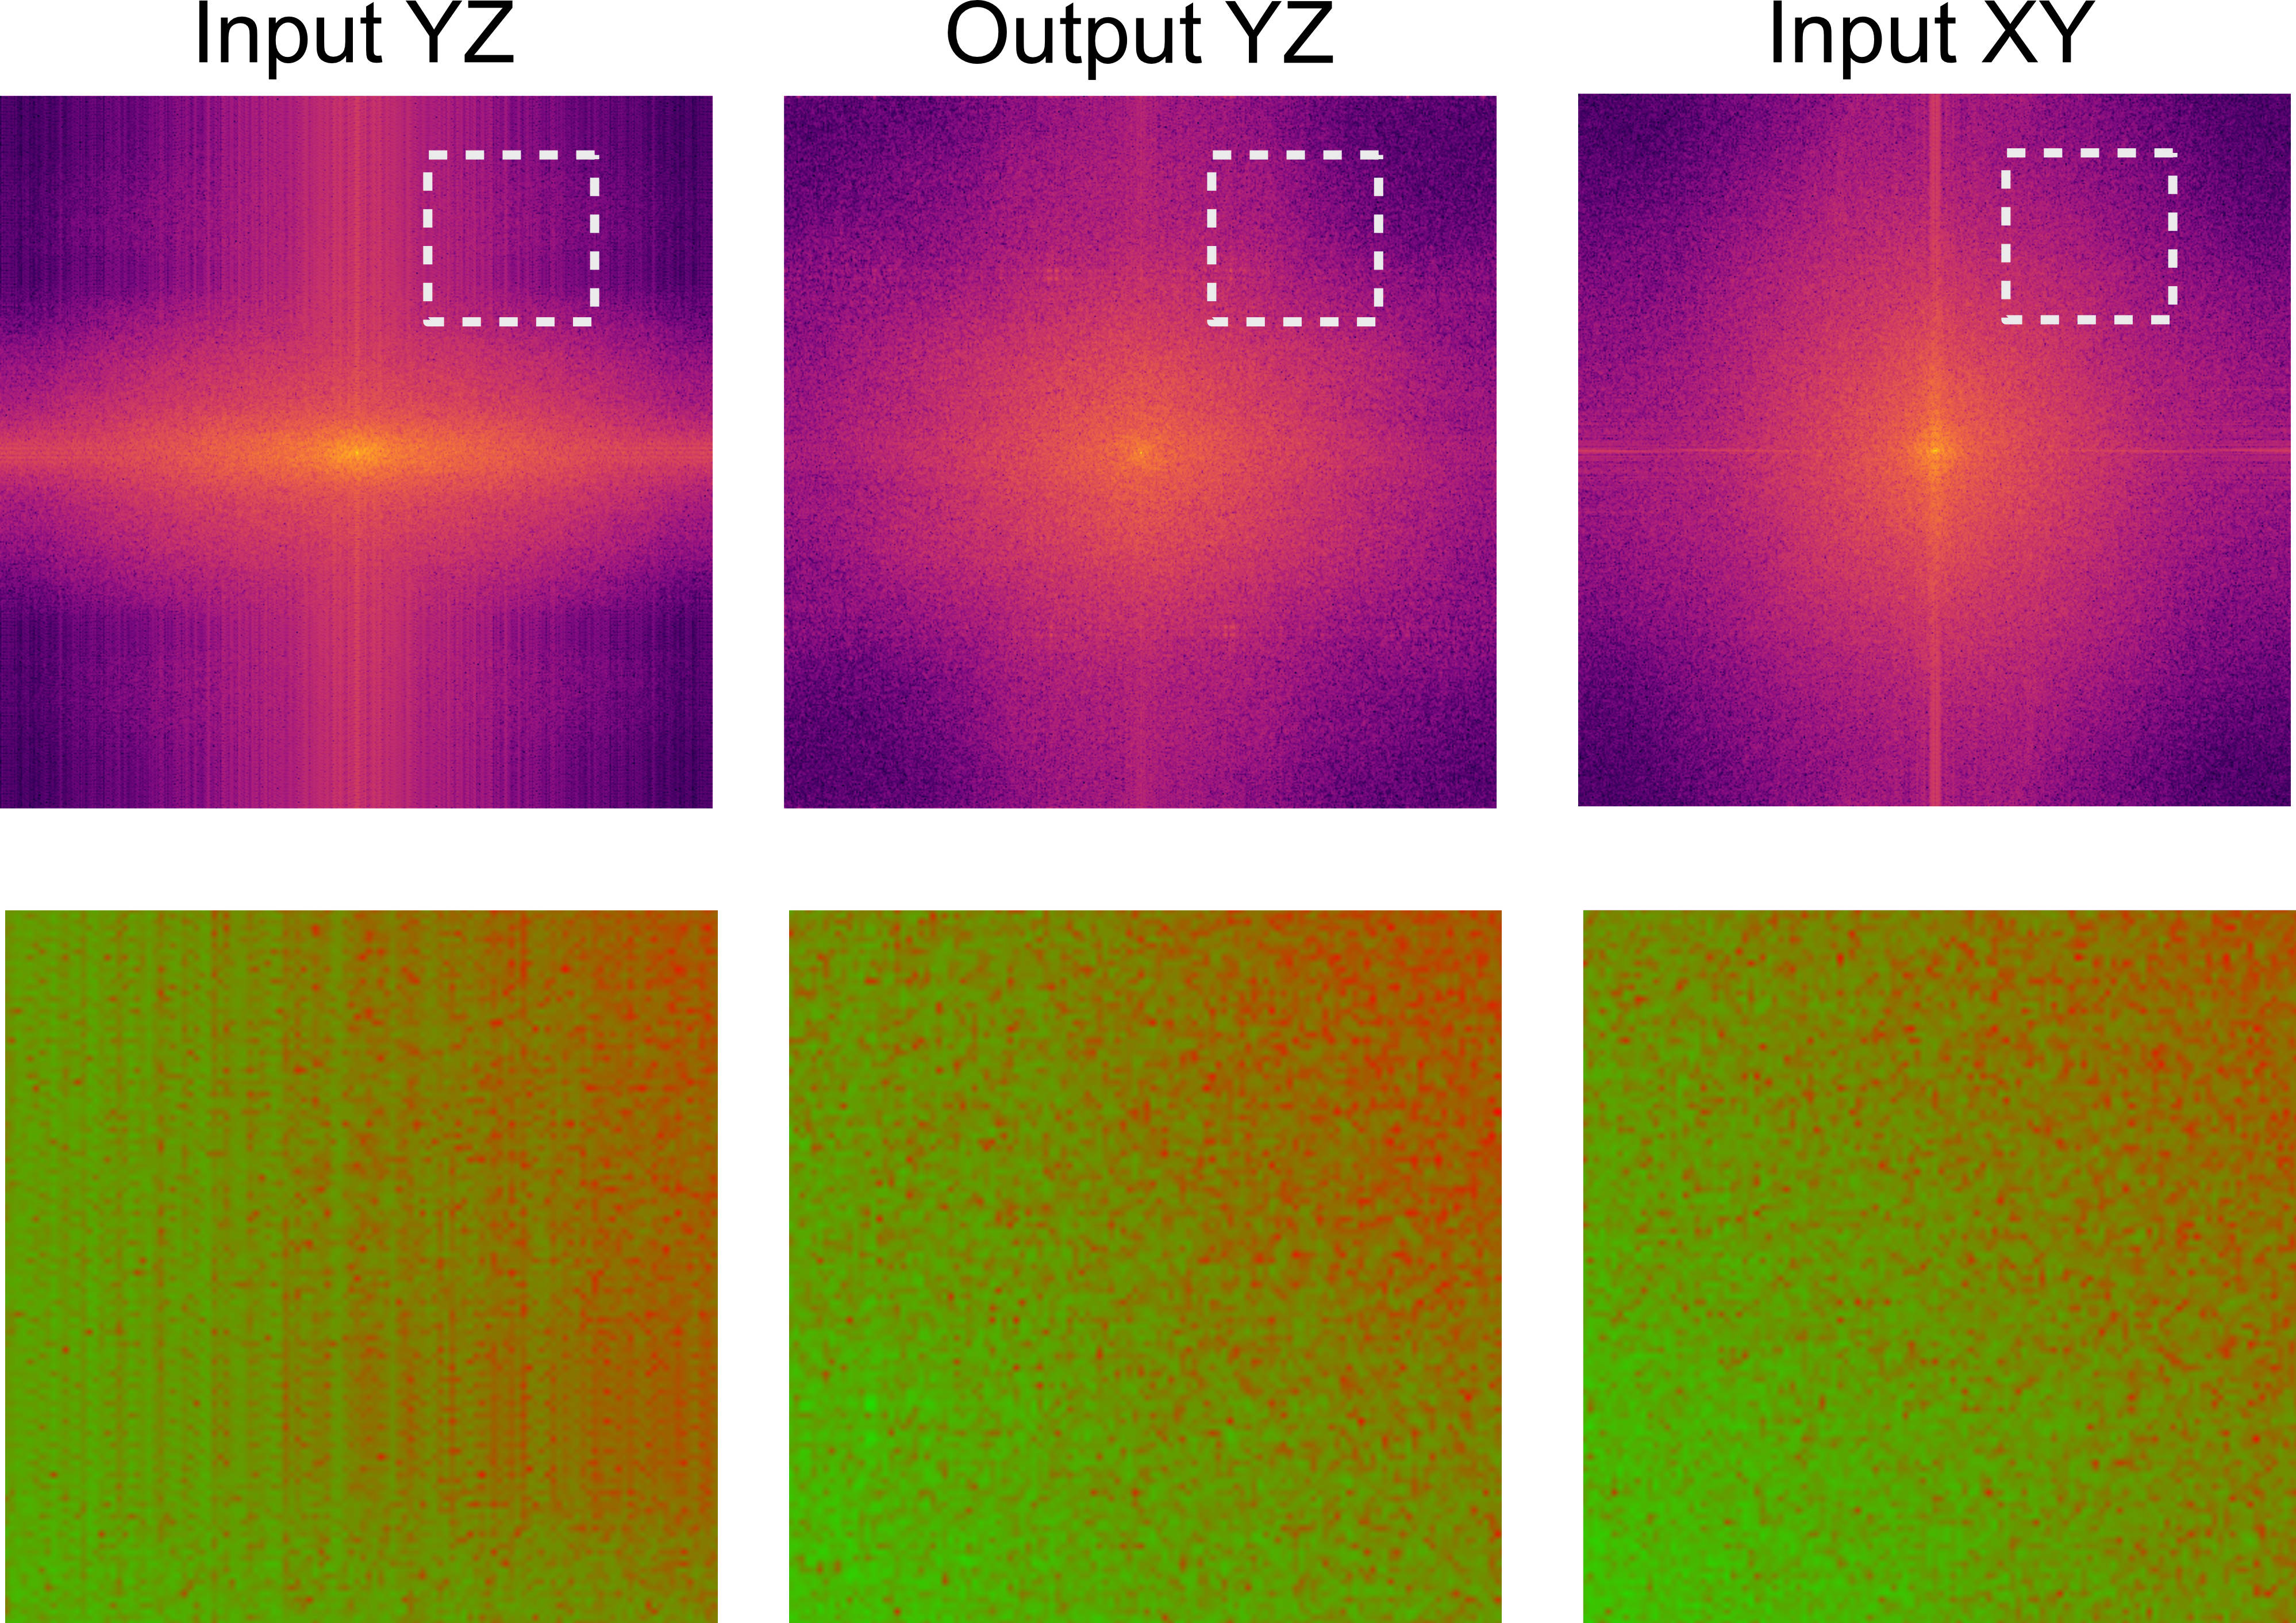
In our test on the CFM image volume, the trained network restored previously highly anisotropic resolution to near-perfect isotropic resolution. In Fig. 1a, we illustrated the resolution improvement by comparing the distance on a resolved axial image and the corresponding distance in the lateral image for an imaged structure that is symmetrical between the lateral and the axial plane: here, a basal dendrite, which is mostly cylindrical. In the example, the difference was nanoscale ( 0.05 m). As the textural differences between the lateral images and the super-resolved axial images were imperceptible to human eyes, we performed Fourier Spectrum analysis before and after restoration and showed that the frequency information of the output is restored to match that of the lateral imaging (refer to Supplementary Figure S5).
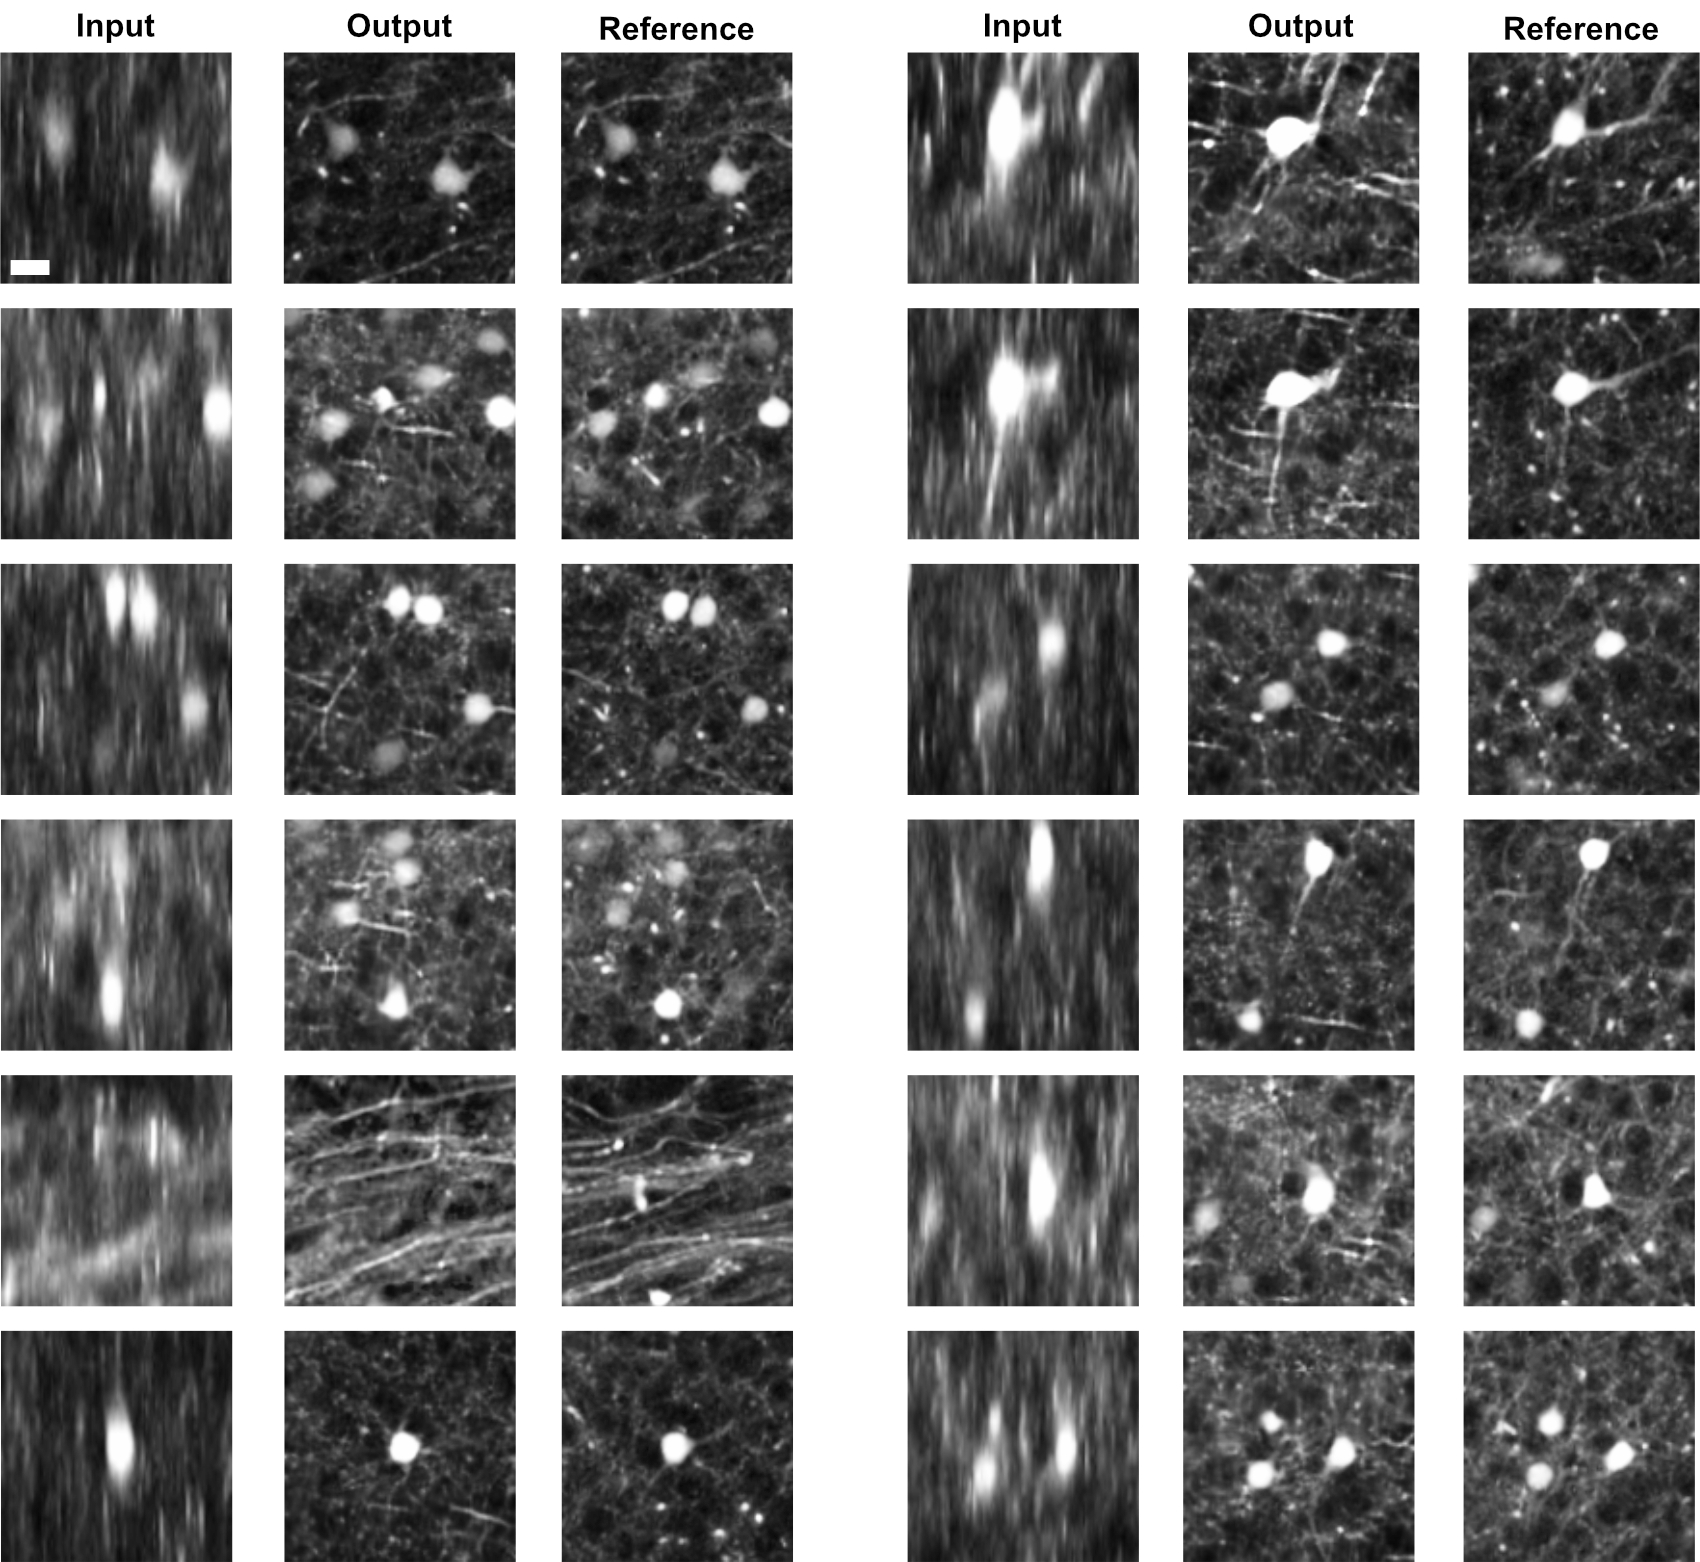
We examined anatomical accuracy of the resolved details by comparing to the reference image, which is labeled as 90°-rotated in Fig. 1c and provides a high resolution match to the original axial image on a submicrometer scale. We noticed that the network was successful not only in translating the axial image texture to the high resolution image domain, but also in recovering previously suppressed details, which were verified by the reference imaging. In comparison to the reference image, the network output accurately enhanced anatomical features of the nervous tissue, consistently throughout the image space (refer to Fig. 1a and Supplementary Fig. S2). As shown in Fig. 1b and c, the network allowed for more advanced cytoarchitectonic investigation of the cortical region, as the network managed adaptive recovery of important anatomical features that vary in morphology, density and connectivity across the cortical region. For example, in the upper cortical layers, the previously blurred apical dendrites of pyramidal neurons were resolved, as visualized in fine details by the left-side ROI example of Network in Fig. 1c. The network output also revealed previously unseen cortical micro-circuitry by pyramidal neurons and interneurons, as shown in the right-side ROI example of Network in Fig. 1c. In the lower cortical layers (refer to Supplementary Fig. S2), the network visualized connectivity of extensive axon collaterals, which were previously indiscernible. Such improvements in fine details congregate to reveal important cytoarchitectonic features of the neural circuitry, as shown in Fig. 1b. The cross-sectional intensity profile (Fig. 1e) illustrates such recovery of suppressed details that were previously blurred in the axial imaging. We noticed that while the network improved the axial resolution, it introduced virtually no discernible distortions or artifacts to the XY (lateral) plane.
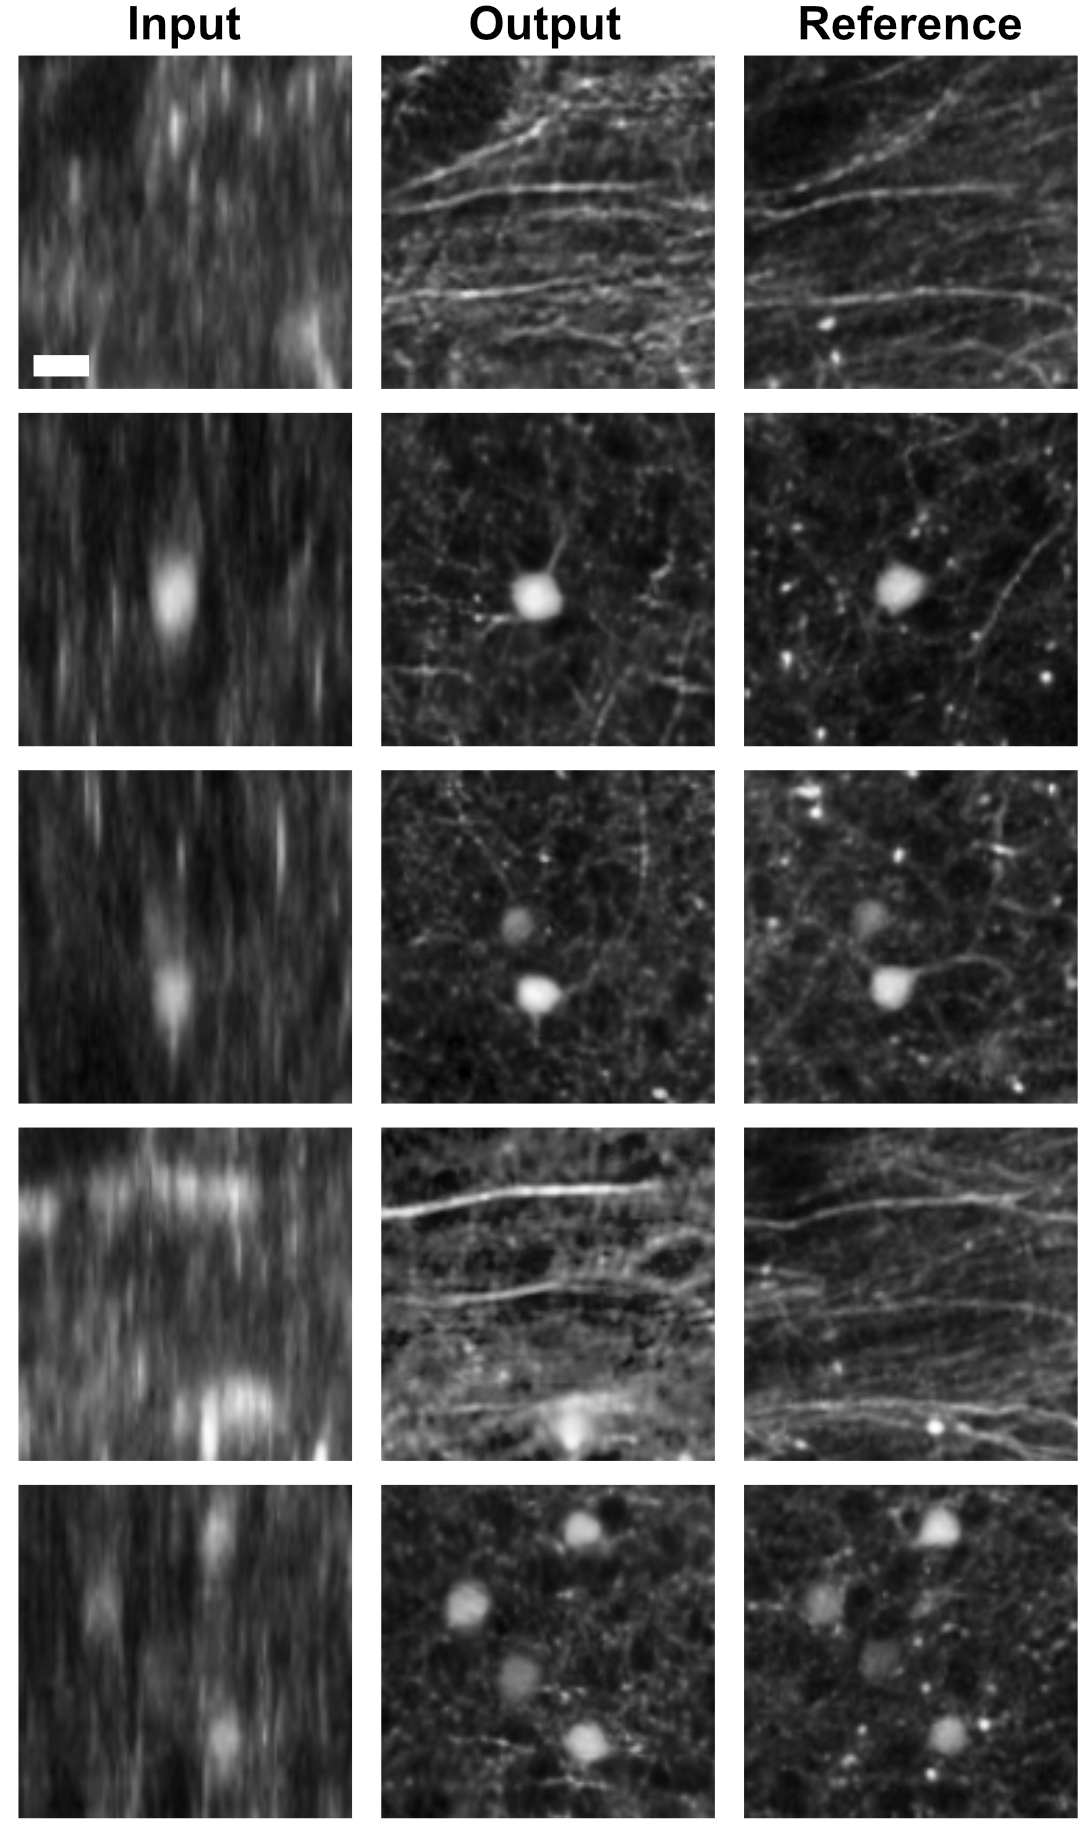
Before we quantify the axial resolution enhancement on a signal level, we needed to minimize the discrepancy in fluorescence emission distribution between the original imaging and the reference imaging. For this reason, we trained and tested the framework separately on another brain sample that is imaged at a higher laser intensity (from 0.3% power to 3%) to ensure similar illumination distributions between the original imaging and the reference imaging. The sample size was approximately 870916500 m3, with lateral resolution of 1.24m with a z-depth of 4m interval. We then identified 32 non-overlapping ROIs of each 120120 m in the input axial images and the reference lateral images, where identical neuronal structures are distinguishable and detected similarly by fluorescence emission (refer to Supplementary Figure S3). Then we measured and compared the peak signal-to-noise ratio (PSNR) distance of the input and the network output ROIs to the corresponding reference ROIs (Fig. 1e). The network introduced a mean PSNR improvement of 1.15 dB per pair of input ROI versus output ROI. This analysis suggests that the textural details recovered by the network include anatomically accurate features that were more discernible in the lateral imaging. We also examined five cases where the metric improvement by the network output was negative (refer to Supplementary Figure S4). We noticed that their metric differences were not indicative of the perceptual accuracy of recovered details and are attributed to differences in fluorescence emission by imaging at a different angle.
Using the trained network from the PSNR measurement, we also tested for generalization of the framework by applying to images acquired in different imaging conditions: z-depth sampling rate, intensity of fluorescence light source, and a different sample. We tested on a different brain sample imaged at a lower fluorescence light intensity (lowered from 3% power to 0.3%) and a z-depth interval of 3m. We also imaged the sample at a perpendicular angle to obtain high-resolution lateral images for reference and registered to the test image on a cellular level. As shown in Supplementary Fig. S6, when blindly applied to a new sample, the network output maintained its super-resolution performance, which was consistent through over 800 test images.
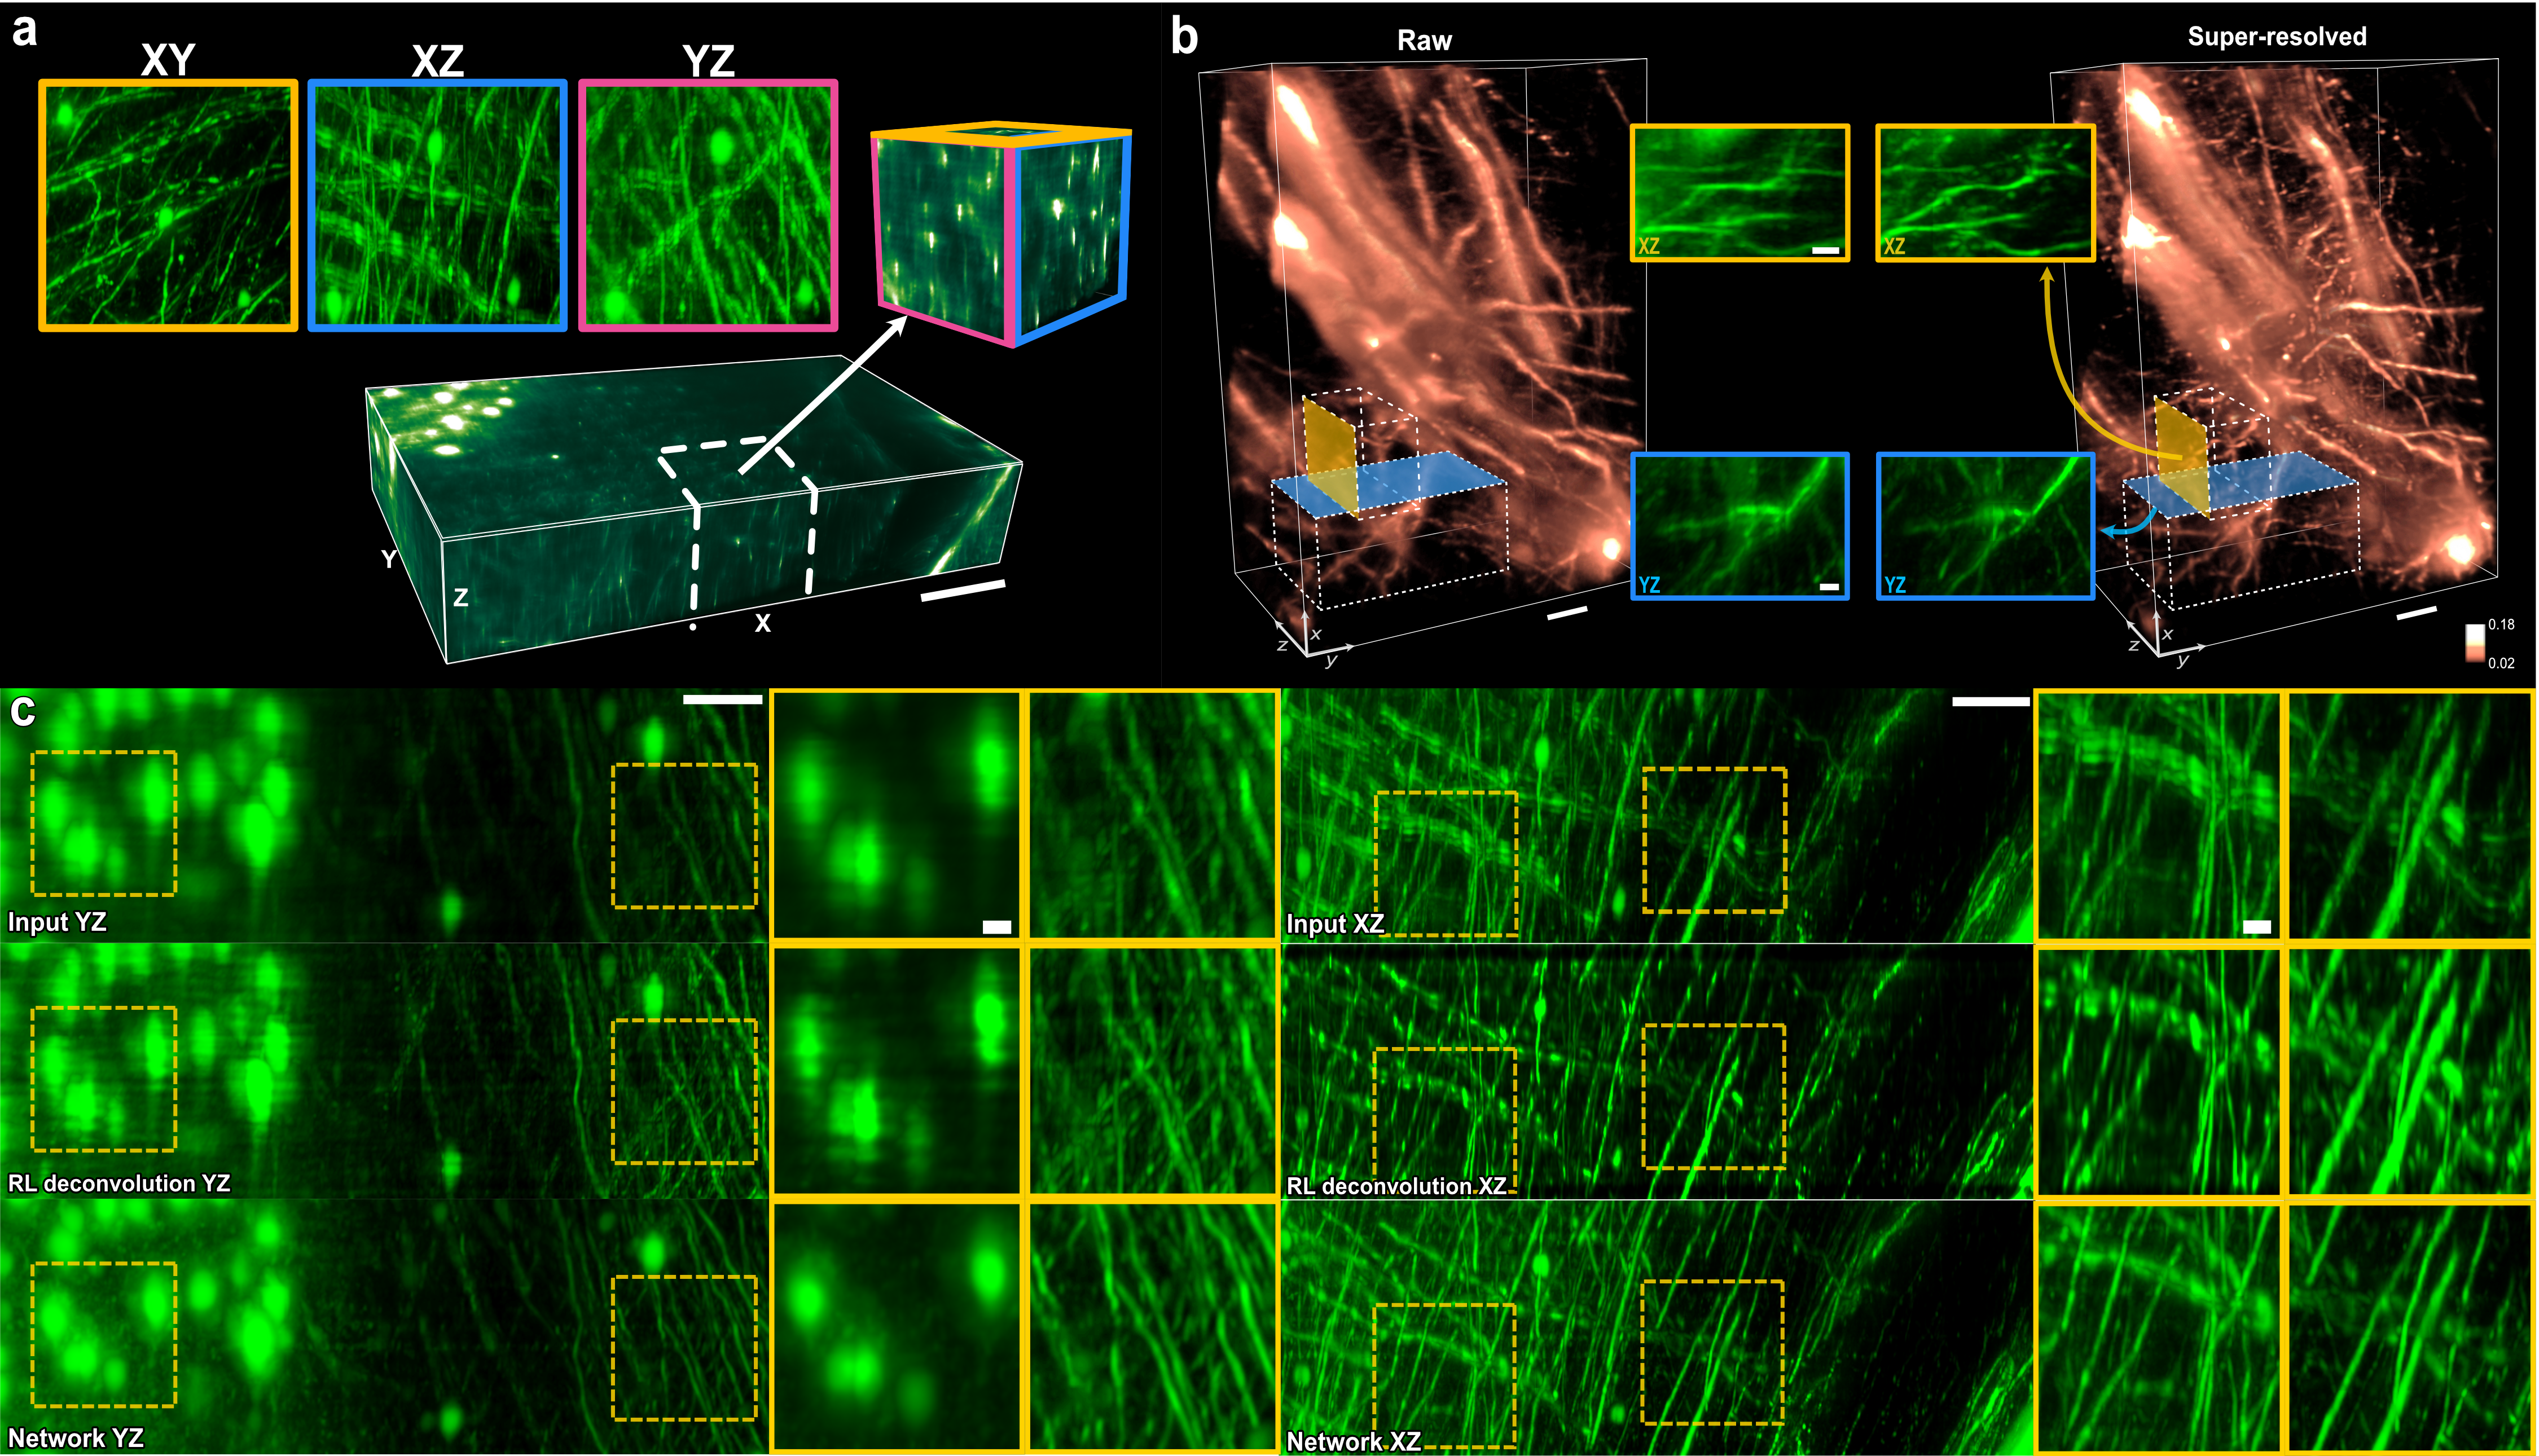
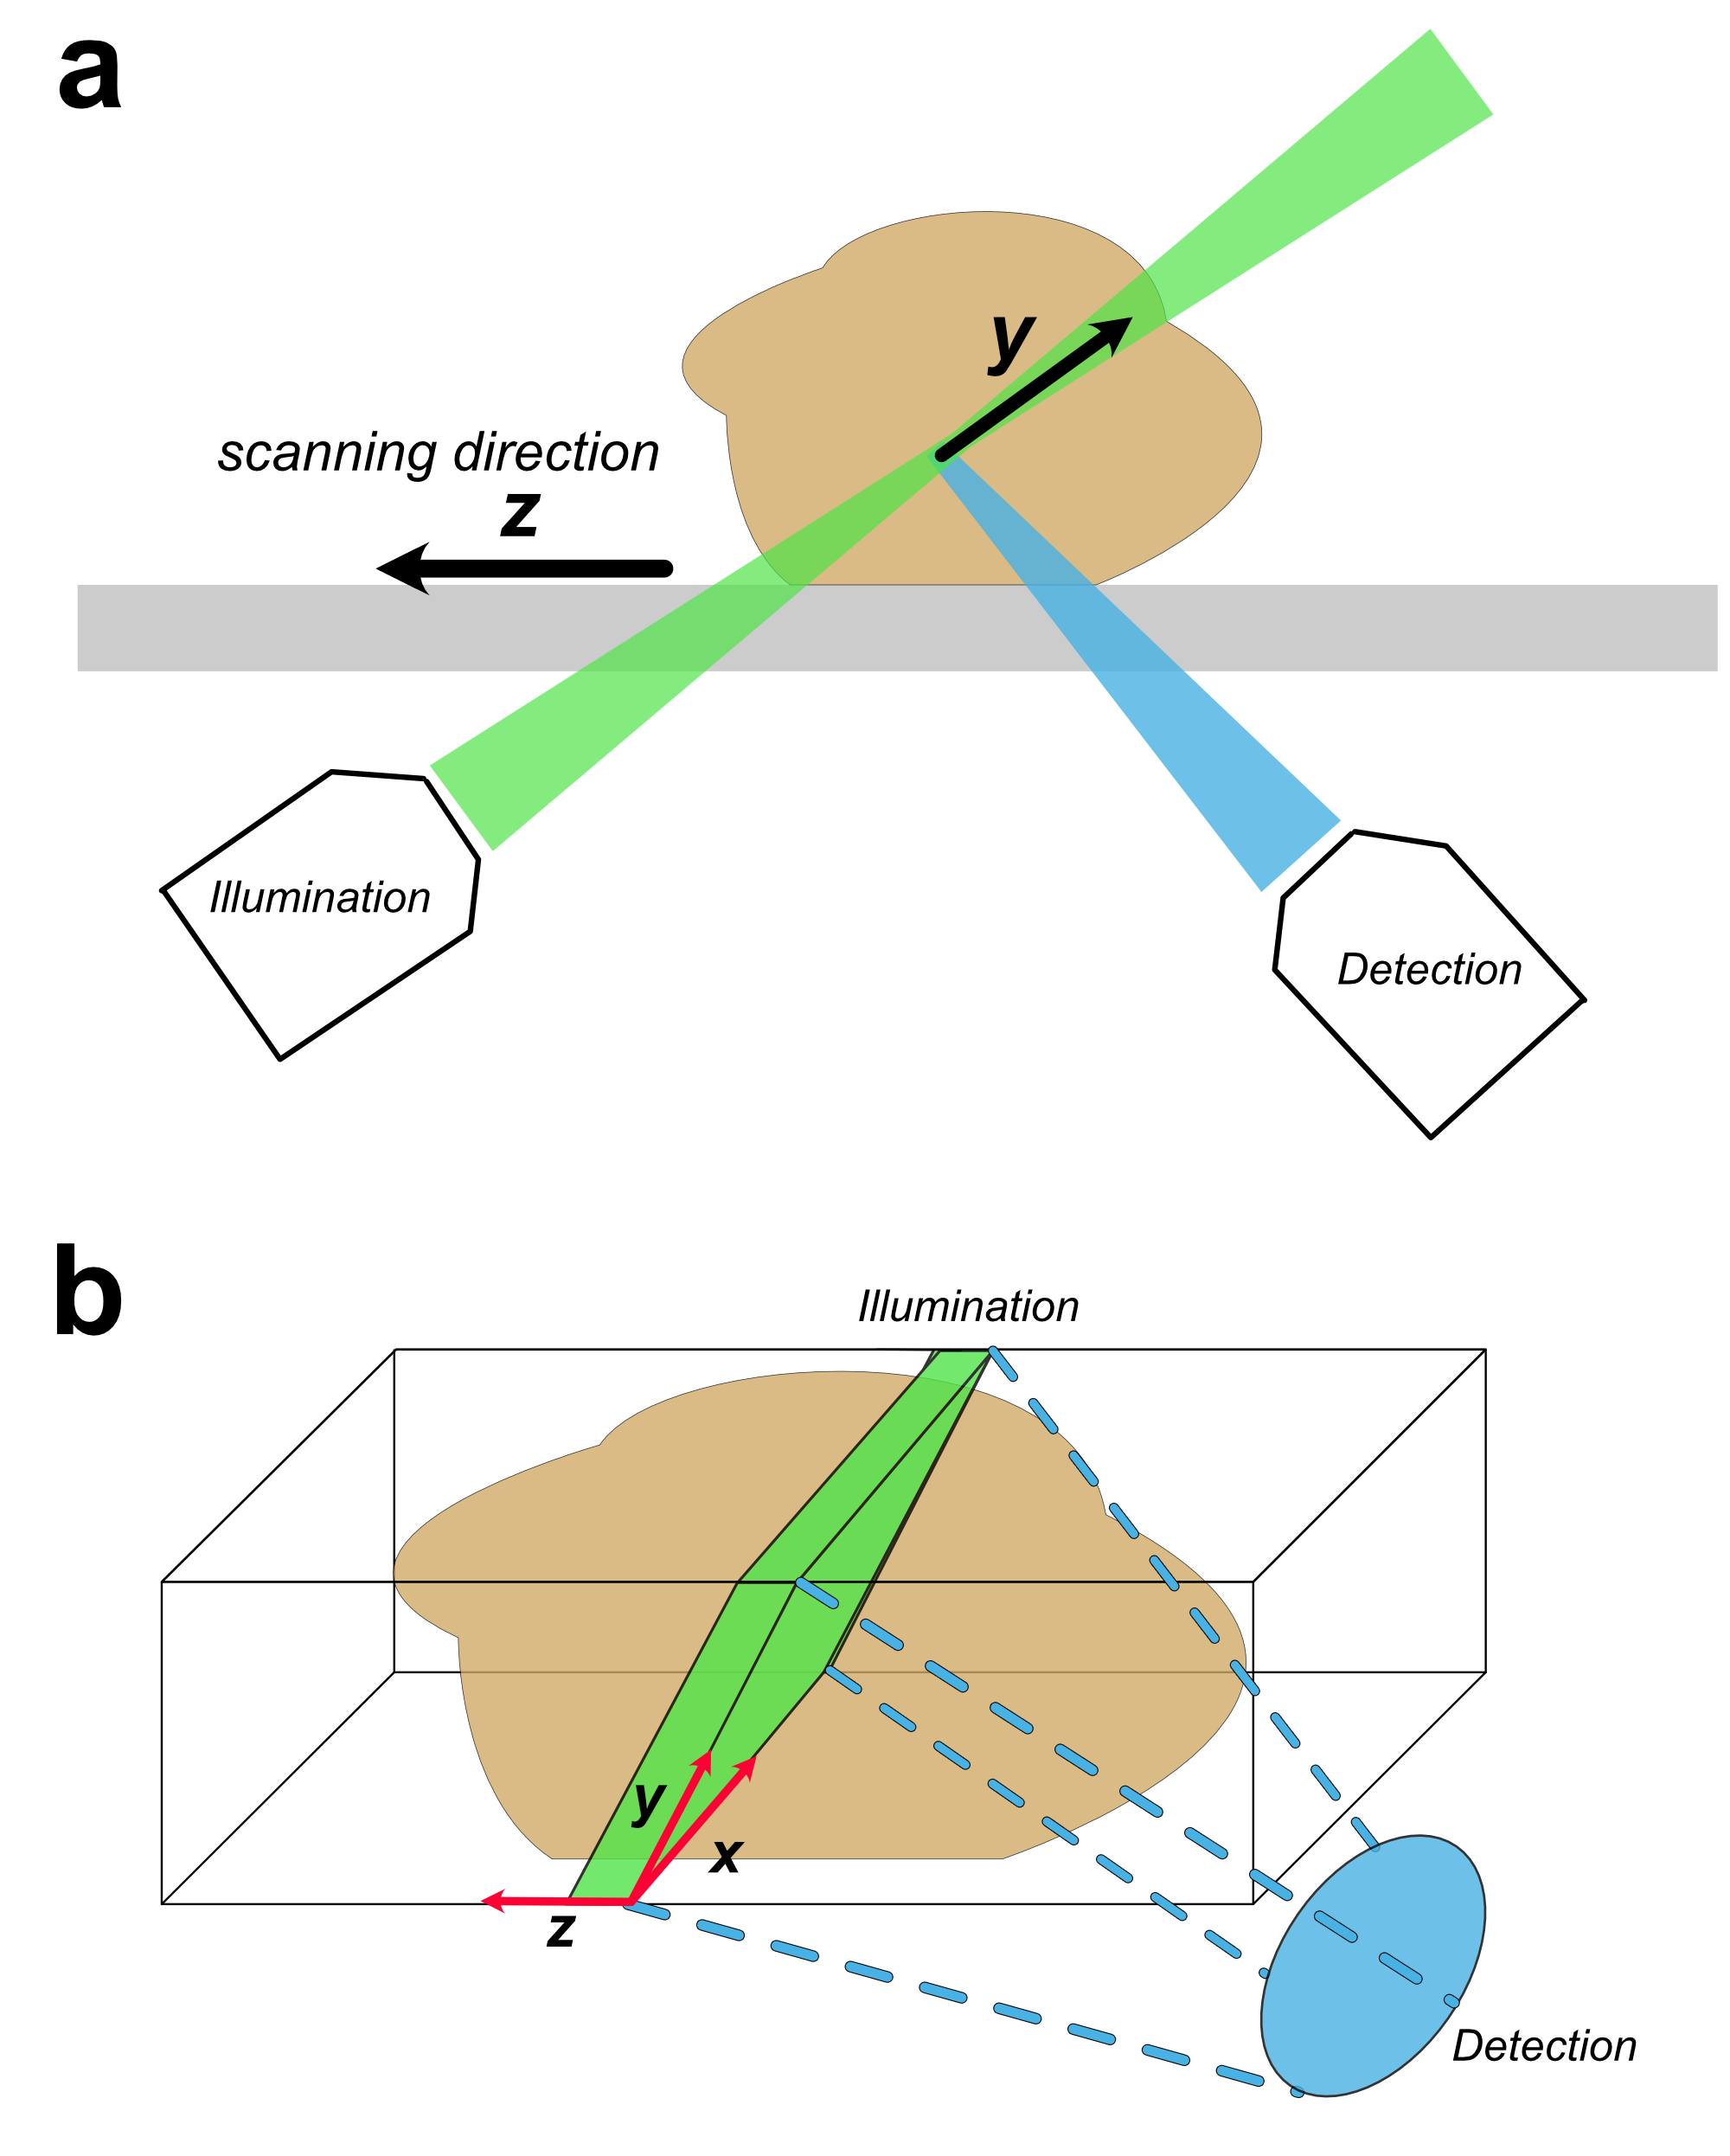
Resolution enhancement in light-sheet fluorescence microscopy Light-sheet microscopy (LSM) is a specialized microscopic technique for high throughput cellular imaging of large tissue specimens including optically cleared tissues. Current LSM systems have relatively low axial resolutions mainly driven by the optic aberration that is caused by the mismatch of refractive indices between air and immersion medium [16, 17]. In particular, open-top LSM (OT-LSM) system [28, 29] requires the excitation path and the imaging path to be perpendicular to each other and introduces distortions to the image quality that are uneven between plane and plane, although this anisotropy could be relaxed by tightly focused excitation [30]. Therefore, the anisotropy problem for an OT-LSM system usually requires the network to learn two distinct image transformations in each orthogonal plane.
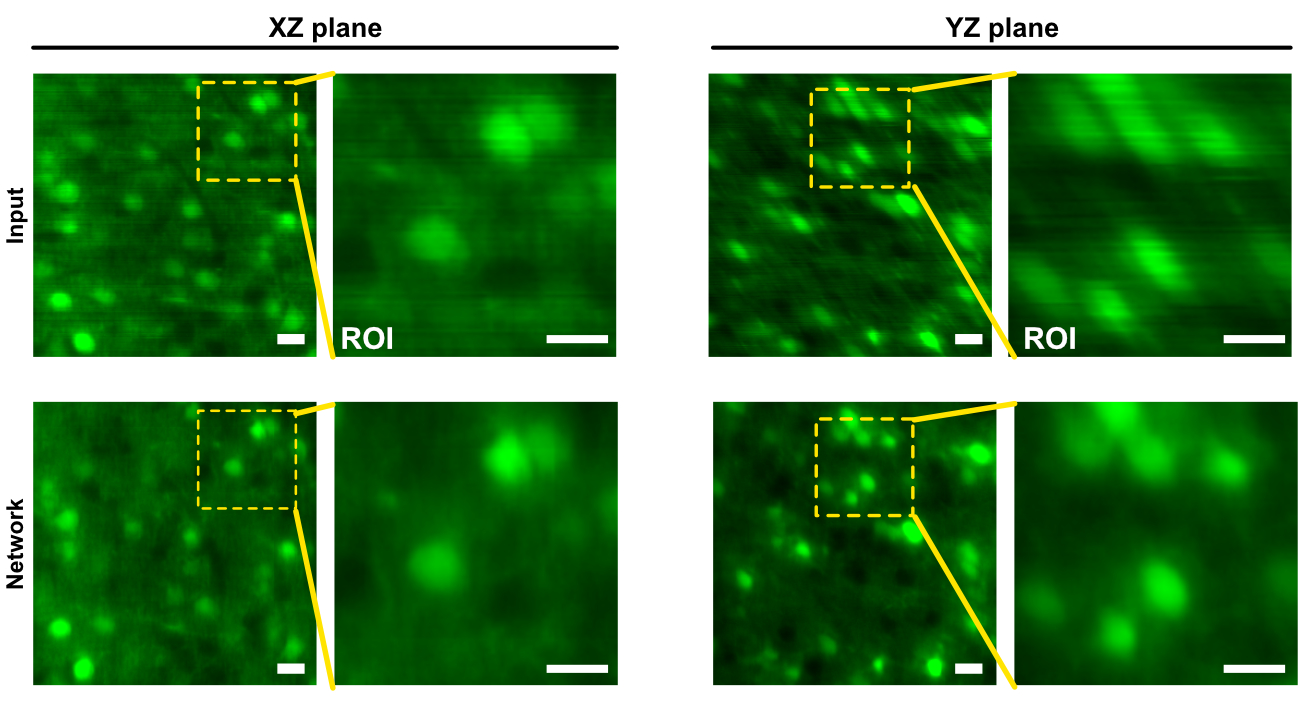
Here, we again imaged the cortical region of a tissue-cleared mouse brain labeled with Thy 1-eYFP using an OT-LSM, which has the physical size of 9309308600 m3. The image was re-sampled for reconstruction isotropically to a voxel size of 0.5m using bilinear interpolation. The microscopy system is estimated to have image resolution of 2m laterally and 4m axially, with the z-depth scanning interval of 1m. Here, the z-axis is defined as the scanning direction. For the schematics of the OT-LSM system, refer to Supplementary Fig. S7. As shown in Fig. 2a, we noticed that the image quality degradation in axial images by our OT-LSM system was nonidentical between and plane, as and images were affected in different degrees by light propagation that aligns with axis and vibration from the lateral movement of the cleared imaged sample while scanning.
As shown in Fig. 2c, the network output showed even balance of enhanced resolution between and , while also enhancing the contrast between signals and the background. This improvement enabled more detailed reconstruction of 3D neuronal morphologies, as shown in Fig. 2b. To verify the restored details, we deconvolved the image volume using the Richardson-Lucy (RL) deconvolution algorithm [31, 32] based on the PSF model that was experimentally acquired (Fig. 3). The RL deconvolution was performed with Fiji Plugin DeconvolutionLab[33], with 10 iterations. In the RL-deconvolved image, we found matching details that were previously suppressed in the input image (Fig. 2c) and which confirm that our network did not generate any spurious features. Resolution improvement in both axial planes had imperceptible differences in texture and accuracy. Furthermore, our proposed framework reduced imaging artifacts such as horizontal stripes by the sensor drift in axial imaging, while RL-deconvolved image still contains those (refer to Fig. 2c and Supplementary Figure S8). We noticed that the improved deconvolution effect by our method was consistent throughout the image volume space.
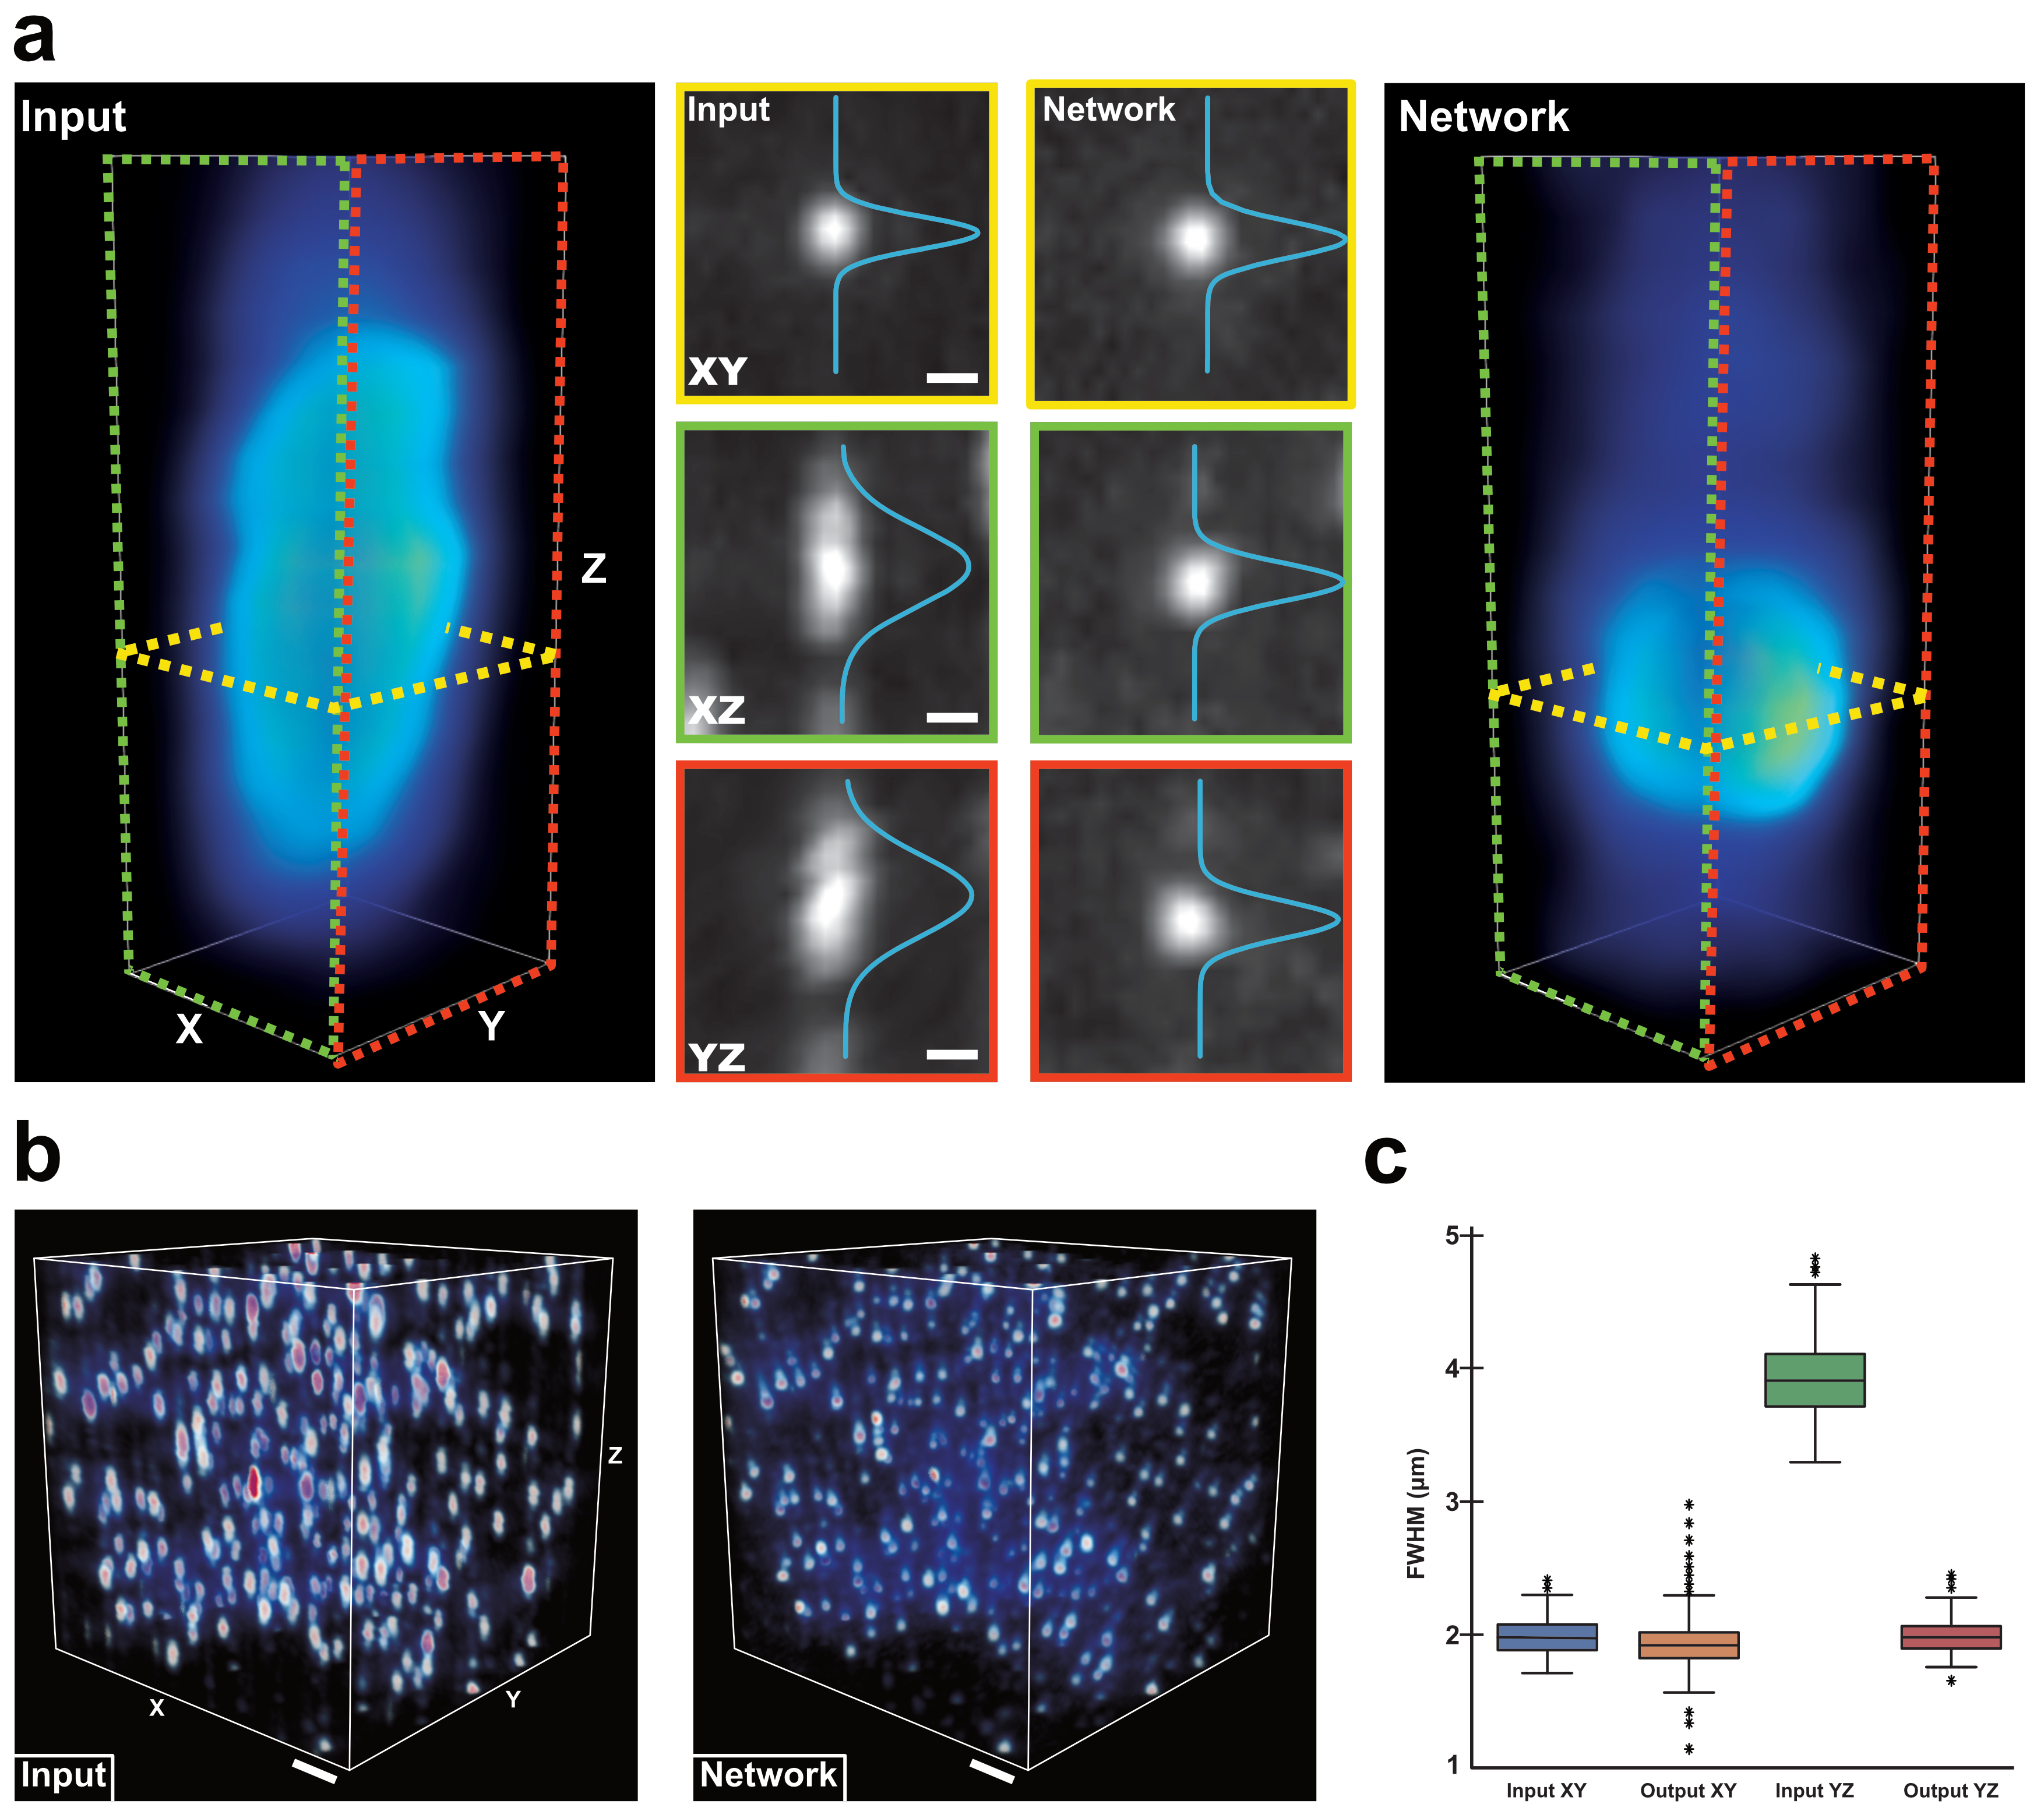
PSF-deconvolution capability To explore further on the image restoration capability of our framework, we tested for the deconvolution capability of an experimentally measured PSF. We imaged 0.5m fluorescent beads with OT-LSM in the same imaging condition, with the overall physical size of 360360160 m3. The image was again re-sampled for reconstruction isotropically to a voxel size of 0.5m using bilinear interpolation. The beads were spread arbitrarily, with some of the beads spaced closer to each other. The results by our framework are shown in Fig. 3. After the deconvolution, the 2D and 3D reconstruction of the network output indicated almost isotropic resolution, resulting in an almost spherical shape (Fig. 3a). This deconvolution effect was consistent across individual fluorescent beads (Fig. 3b). To quantify the performance of deconvolution, we calculated 2D FWHM values of more than 300 randomly selected bright spots and compared the lateral FWHM values and the axial FWHM values as in before versus after the image restoration. As shown in Fig. 3c, the FWHM distributions of the bright spots in the restored image show an almost identical match to those of the input in the lateral plane. The network output corrected the axial elongation of the PSF, with a mean FHWM of 3.91 m being reduced to 1.99 m, which is very close to a mean FHWM of 1.98 m from the lateral input. The network introduced very little deviation in the lateral plane, with a mean FWHM mismatch of 0.036 m.
So far, we demonstrated the effectiveness of our method with CFM and OT-LSM, which involve many dissimilarities between lateral and axial image quality in fluorescence image formation. Accordingly, we expect the framework to be widely applicable to other various forms in the fluorescence microscopy spectrum, as the essential component of the learning does not rely on conditions of an image formation process.
Discussion
In summary, we developed a deep-learning based super-resolution technique that enhances axial resolution of conventional microscopy by learning from high-resolution lateral images. The strength of our framework comes from taking advantage of learning from unmatched data pairs: it allows the learning of image transformation to be localized to a user-defined 3D unit space and thus to be decoupled from regional variations in image characteristics, such as aberrations or artifacts that arise naturally from the fluorescence imaging process. It also greatly reduces the effort to put into practice as the training of a network requires as little as a single 3D image stack, without a priori knowledge of the image formation process, registration of training data, or separate acquisition of target data. Some combination of those factors is generally considered so far necessary[34] for most conventional deep-learning based super-resolution methods. For this reason, our approach significantly lessens pre-existing difficulty of applying super-resolution to microscopy data.
METHODS
0.1 Sample Preparation and image acquisition
Tg(Thy1-eYFP)MJrs/J mice were identified by genotyping after heterozygous-mutant mice were bred, and mice were backcrossed onto the C57BL/6 WT background for 10 generations and then maintained at the same animal facility at the Korea Brain Research Institute (KBRI). Mice were housed in groups of 2–5 animals per cage with ad libitum access to standard chow and water in 12/12 light/dark cycle with “lights-on” at 07:00, at an ambient temperature of 20-22 ∘C and humidity (about 55 %) through constant air flow. The well‐being of the animals was monitored on a regular basis. All animal procedures followed animal care guidelines approved by the Institutional Animal Care Use Committee (IACUC) of the KBRI (IACUC-18-00018). In the preparation of the mouse brain slice, the mice were anesthetized by injection with zoletil (30 mg/kg) and xylazine (10 mg/kg body weight) mixture. Mice were perfused with 20 ml of fresh cold PBS and 20 ml of 4 % PFA solution using a peristaltic pump and whole mouse brain was extracted and fixed 4% PFA for 1-2 days at 4 ∘C. The fixed mouse brain was sliced coronally in 500 m thickness. Then, the brain slices were incubated in the RI matching solution at 36 ∘C for 1 hours for the optical clearing. The proposed method was applied to the images of optically cleared tissues of the brain slices of Thy1-eYFP mice.
For the CFM system, the optically cleared tissue specimens were mounted on the 35-mm coverslip bottom dish and were immersed in RI matching solution during image acquisition using an upright confocal microscope (Nikon C2Si, Japan) with Plan-Apochromat 10 lens (NA = 0.5, WD = 5.5 mm). The Z-stacks of optical sections taken at 3 or 4 m.
For the OT-LSM system, we used a recently developed microscopy system[30] without using tight focusing, whose design is based on the modification of the water-prism open-top light-sheet microscopy[28, 29]. The system includes an ETL (EL-16- 40-TC-VIS-5D-M27, Optotune) as part of the illumination arm for the axial sweeping of the excitation light sheet and an sCMOS camera (ORCA-Flash4.0 V3 Digital CMOS camera, Hamamatsu) in the rolling shutter mode to collect the emission light from the sample. The system uses 10 air objective lens (MY10X-803, NA 0.28, Mitutoyo) in both the illumination and imaging arms, which point toward the sample surface at +45∘ and -45∘, and a custom liquid prism filed with refractive index (RI) matching solution (C match, 1.46 RI, Crayon Technologies, Korea) for the normal light incidence onto the clearing solution. The excitation light source was either 488nm or 532nm CW lasers (Sapphire 488 LP-100, Coherent; LSR532NL-PS-II, JOLOOYO).
0.2 Image pre-processing
For the OT-LSM brain images, a median filter of 2 pixel radius was applied to remove the salt-and-pepper noise that arises from fluorescence imaging. All images were normalized to scale affinely between -1 and 1 using percentile-based saturation with bottom and top 0.03% for the CFM images and 3% for the OT-LSM images. In both OT-LSM experiments, since the OT-LSM system images a sample at 45°or -45°, we applied shearing in Y-Z axis as affine transformation to reconstruct a correct sample space.
0.3 Cycle-consistent generative adversarial network structure
To derive our algorithm, we assume that the high-resolution target space consists of imaginary 3D image volumes with isotropic resolution according to a probability measure , while the input space consists of measured 3-D volumes with anisotropic resolution with poorer axial resolution that follows the probability measure . According to the recent theory of optimal transport driven cycleGAN[23], if we were to transform one image volume in to , we can solve this problem by transporting the probability distribution to and vice versa in terms of statistical distance minimization in and simultaneously[23], which can be implemented using a cycleGAN. In our implementation, it is the role of the discriminative networks to estimate such statistical distances and guide the generative networks to minimize the distances.
Unfortunately, as consists of imaginary isotropic high resolution volumes, we cannot measure the statistical distance to from the generated volumes directly. This technical difficulty can be overcome from the following observation: since an isotropic resolution is assumed for every 3D volume , the planes , and should have the same resolution as the lateral resolution of the input volume, i.e. plane of the input volume . Accordingly, we can measure the statistical distance to the imaginary volumes in by defining the statistical distance as the sum of the statistical distances in , , and planes using the following least square adversarial loss[35]:
where
where the subscripts and refer to the and planes, respectively. Here, , which is the 2D slice image of image volume, is used as the , , and plane references from imaginary isotropic volume distribution and compared with the corresponding planes of the deblurred volume .
On the other hand, the backward path discriminator group is trained to minimize the following loss:
where
so that , , and plane images of the blurred volume follows the distribution of , , and plane images of the input volume .
Then, the full objective for the neural network training is given by:
where , as the cycle-consistency loss, is the sum of absolute differences, also known as the L1 loss, between and . , as the weight of the cycle-consistency loss, is set at 10 in our experiments. The objective function of the cycle-consistency-preserving architecture aims to achieve the balance between the generative ability and the discriminative ability of the model as it transforms the image data to the estimated target domain as close as possible, while also preserving the reversibility of the mappings between the domains. The generative versus discriminative balance is achieved by the convergence of the adversarial loss in both paths of the image transformation, as the generative network learns to maximize the loss and the discriminative network, as its adversary, learns to minimize the loss.
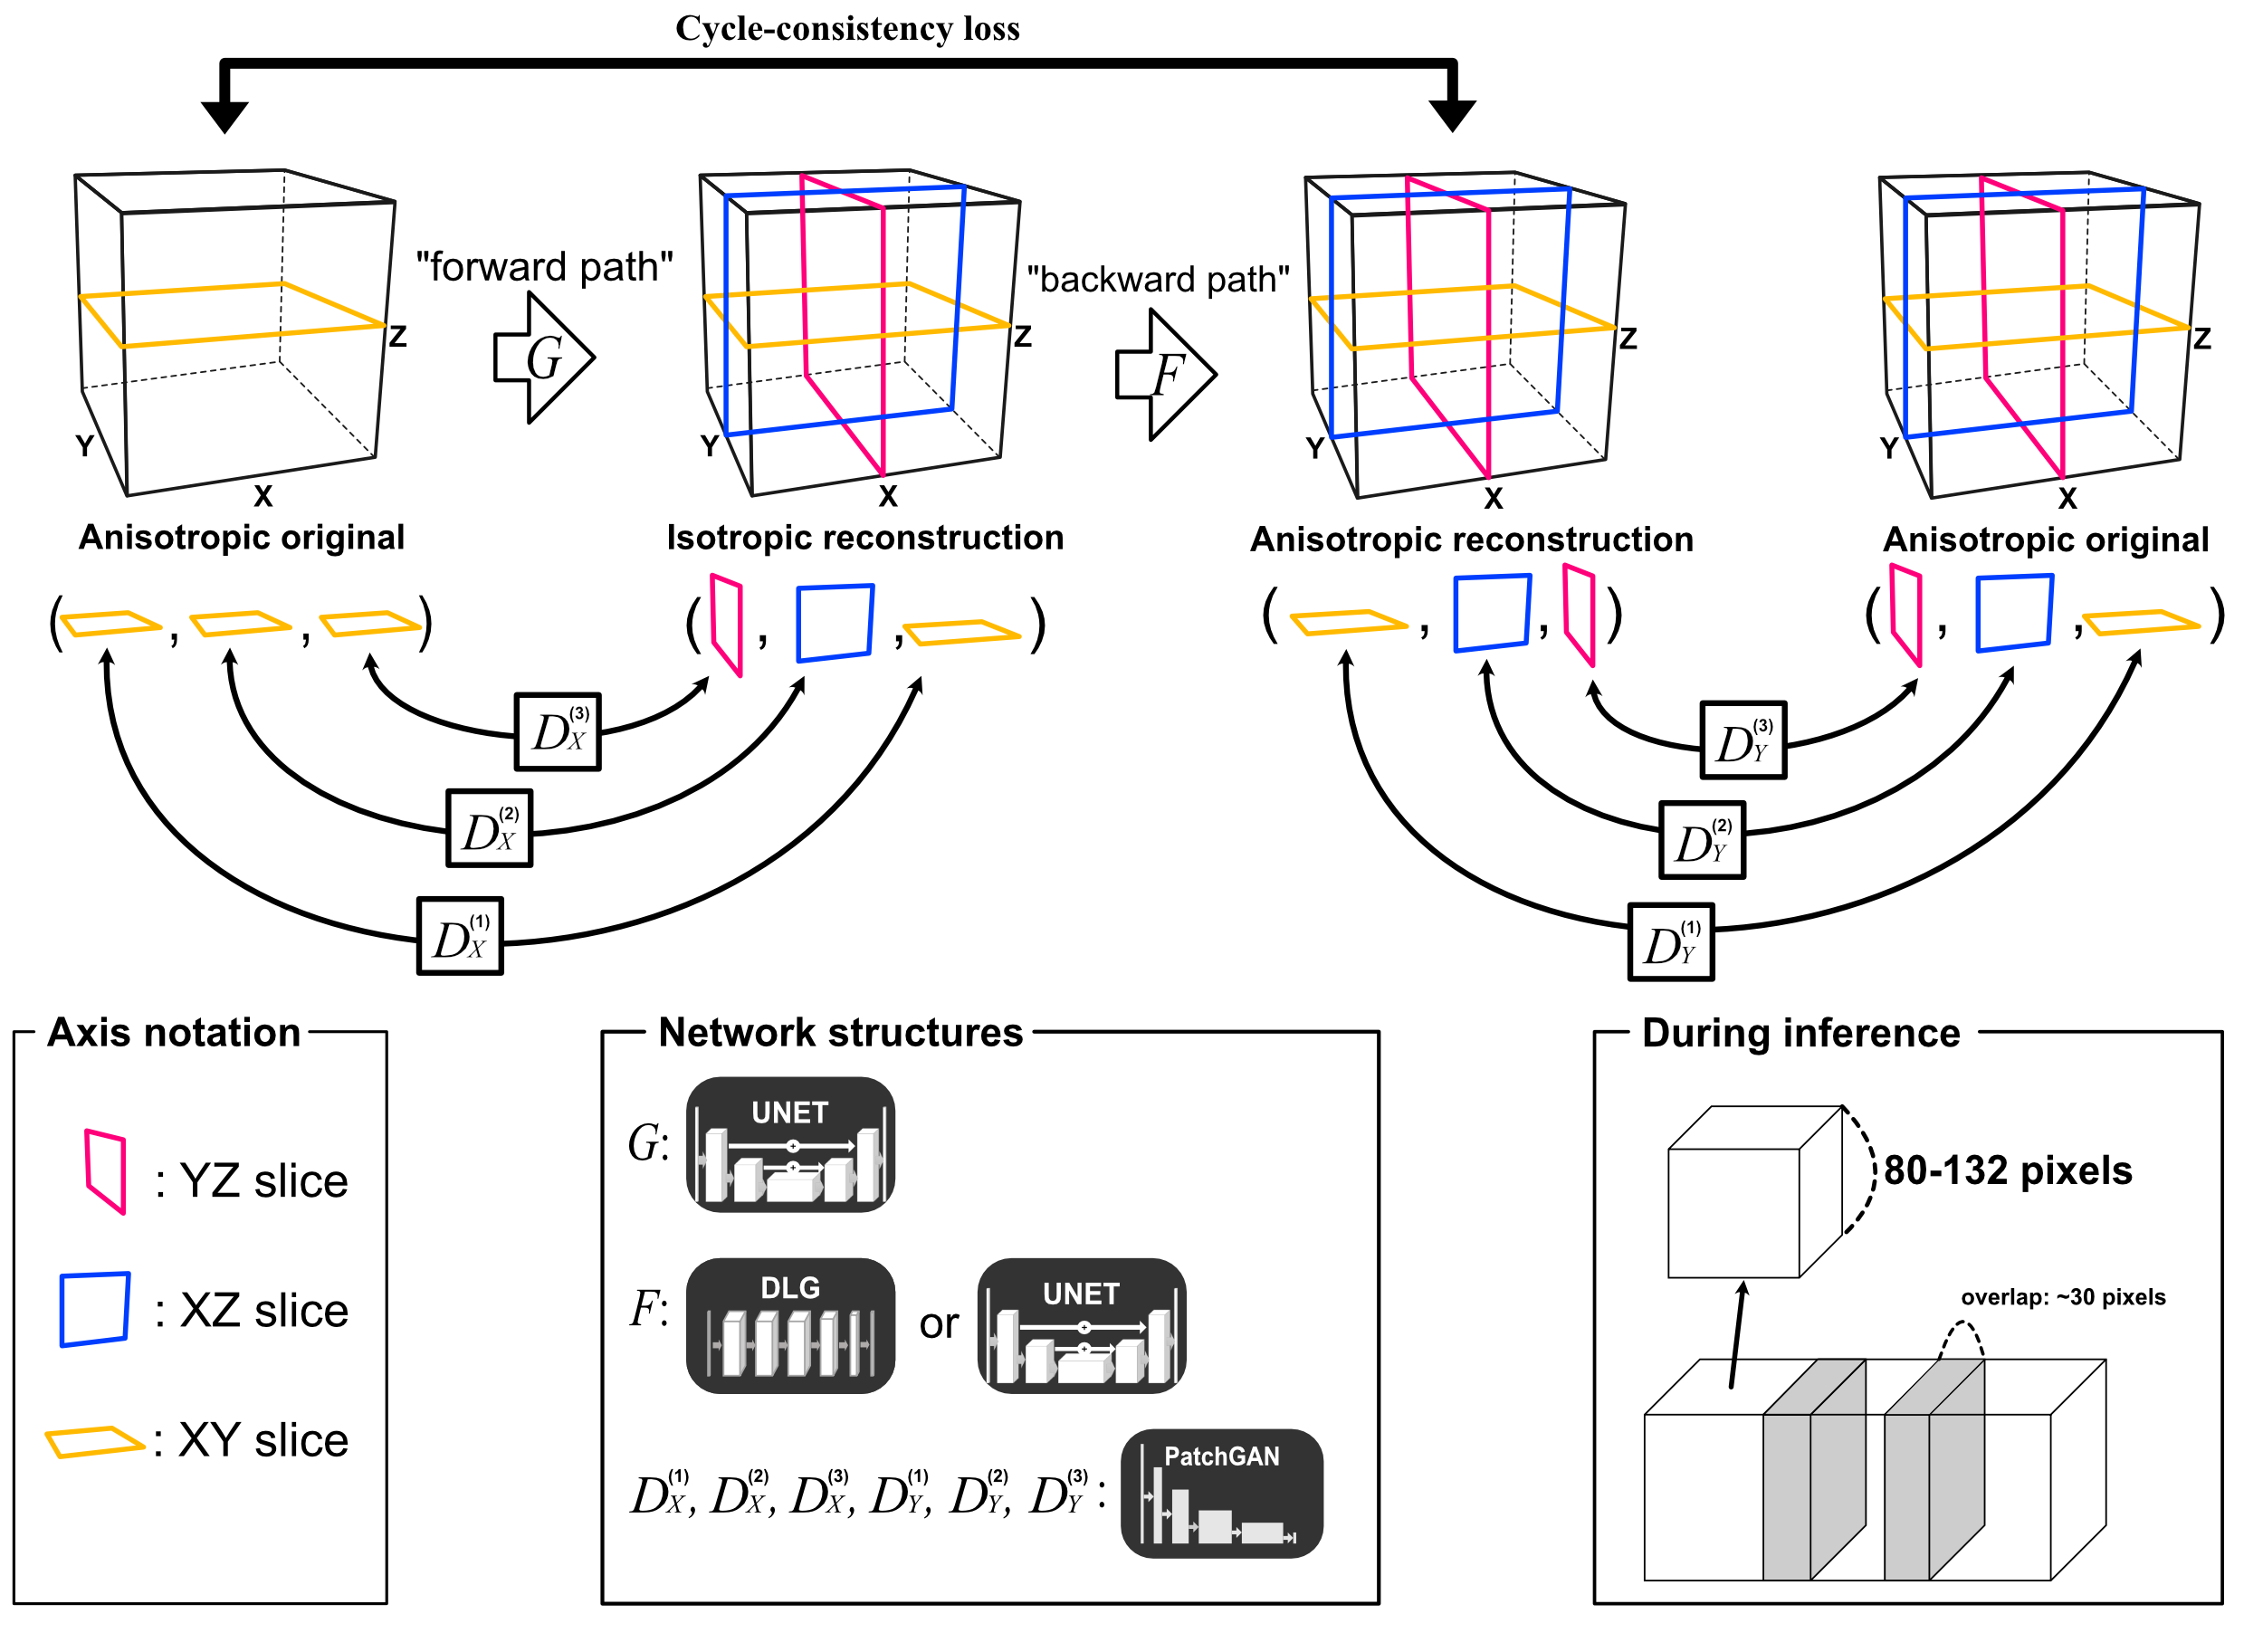
The resulting architecture consists of two deep-layered generative networks, respectively in the forward path and the backward path, and six discriminative networks, in two groups also respectively in the forward path and the backward path. The schematic is illustrated in Fig. 1d and Supplementary Figure S1.
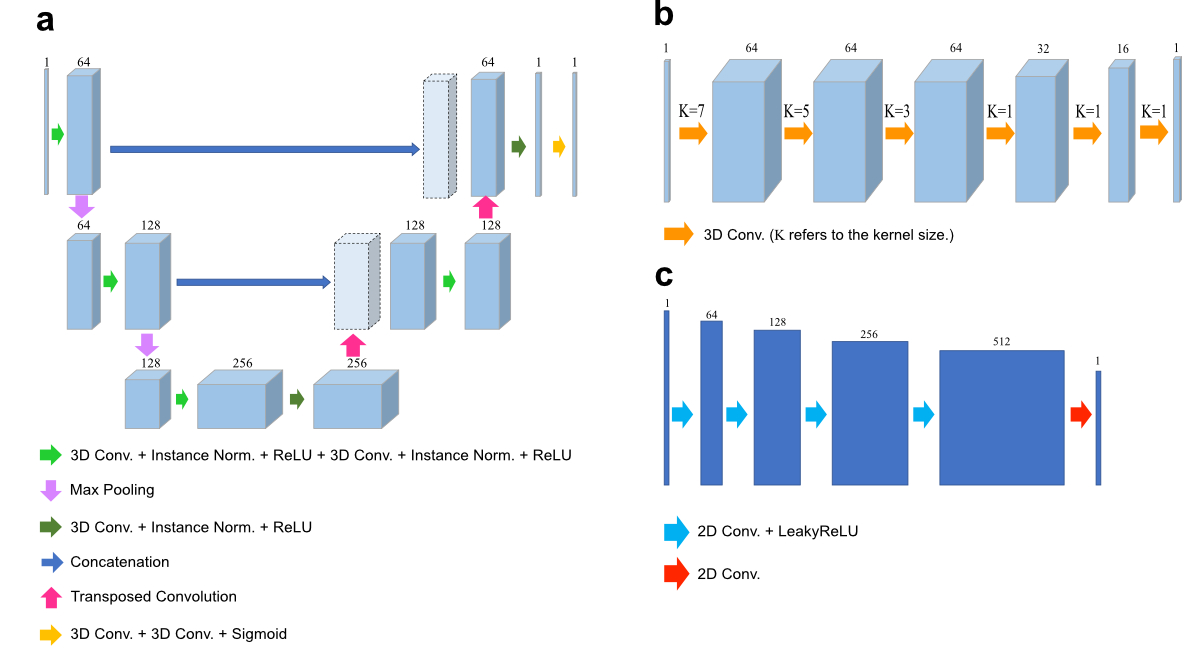
Our generative network structure in the forward path, , is based on the 3D U-Net architecture[36], which consists of the downsampling path, the bottom layer, the upsampling path, and the output layer. The schematic of this network architecture is illustrated in Supplementary Fig. S9a, whose detailed explanation is given in Supplementary Note. On the other hand, the generative network architecture in the blurring path, , is adjustable and replaceable based on how well the generative network can emulate the blurring or downsampling process in the backward path. We searched for an optimal choice empirically between the 3D U-net architecture and the deep linear generator[37] without the downsampling step (refer to Supplementary Figure S9b). For the CFM brain images and the OT-LSM fluorescent bead images, we chose deep linear generator as , while 3D U-Net is used for the OT-LSM brain images. Note that the kernel sizes in the deep linear generator vary depending on depths of the convolution layers, as shown in Supplementary Figure S9b.
0.4 Algorithm implementation and training
Before the training phase for the OT-LSM images, we diced the entire volume into sub-regions of 200-250 pixel with overlapping adjacent regions of 20-50 pixels. The number of sub-regions is 3000 for the brain image data and 580 for the fluorescent bead image data. Then we randomly cropped a region for batch training per iteration and flipped it in 3D on a randomly chosen axis as a data augmentation technique. The crop size was 132132132 for the brain images and 100100100 for the fluorescent bead images.
While the axial resolution in OT-LSM differs between and plane because of the illumination path in alignment with axis, the axial resolution from the CFM imaging is consistent across the plane. For this reason, for the CFM images, we loaded the whole image volume (1-2 Gigabytes) in memory and randomly rotated along the -axis as a data augmentation technique. Then we also randomly cropped a region and flipped on a randomly chosen axis per iteration. For this reason, the networks were trained with one whole image volume with its training progress marked in iterations instead of in epochs. The crop size is set as 144144144. During the inference phase in all experiments, the crop size is set as 120120120 with overlapping regions of 30 pixels, and we cropped out the borders (20 pixels) of each output sub-region to remove weak signals near the borders before assembling back to the original volume space. In all experiments, the batch size per iteration is set as 1.
In our 3D U-net generative networks, all 3D convolution layers have the kernel size of 3, the stride of 1 with the padding size of 1, and all transposed convolution layers have the kernel size of 2, the stride of 2, and no padding. In the deep linear generative networks, the six convolution layers have the kernel sizes of [7,5,3,1,1,1] in turn with the stride of 1 and the padding sizes of [3,2,1,0,0,0]. In the discriminative networks, the convolution layers have the kernel size of 4, the stride of 2, and the padding size of 1.
In all experiments, all the learning networks were initialized using Kaiming initialization[38] and optimized using the adaptive moment estimation (Adam) optimizer[39] with a starting learning rate . For the CFM images and the OT-LSM brain images, the training was carried out on a desktop computer with GeForce RTX 3090 graphics card (Nvidia) and Intel(R) Core(TM) i7-8700K CPU @ 3.70GHz. For the OT-LSM fluorescent bead images, the training was carried out on a desktop computer with GeForce GTX 1080 Ti graphics card (Nvidia) and Intel(R) Core(TM) i7-8086K CPU @ 4.00GHz.
Correspondence and requests for materials should be addressed to Jong Chul Ye. (email: jong.ye@kaist.ac.kr).
This research was supported by National Research Foundation of Korea (Grant NRF-2020R1A2B5B03001980 and NRF-2017M3C7A1047904).
J.C.Y. supervised the project in conception and discussion and wrote the manuscript. H.P. conceived and implemented the research. M.N. generated the CFM imaging data. S.C. supervised the CFM imaging. B.K. and S.P. generated the OT-LSM imaging data. K.K. supervised the OT-LSM imaging. H.P. wrote the manuscript.
The authors declare that they have no competing financial interests.
References
- [1] Chung, K. et al. Structural and molecular interrogation of intact biological systems. Nature 497, 332–337 (2013).
- [2] Chung, K. & Deisseroth, K. Clarity for mapping the nervous system. Nature Methods 10, 508–513 (2013).
- [3] Yang, B. et al. Single-cell phenotyping within transparent intact tissue through whole-body clearing. Cell 158, 945–958 (2014).
- [4] Richardson, D. S. & Lichtman, J. W. Clarifying tissue clearing. Cell 162, 246–257 (2015).
- [5] Hama, H. et al. Scales: An optical clearing palette for biological imaging. Nature Neuroscience 18, 1518–1529 (2015).
- [6] Santi, P. A. Light sheet fluorescence microscopy: A review. Journal of Histochemistry and Cytochemistry 59, 129–138 (2011).
- [7] Huisken, J., Swoger, J., Bene, F. D., Wittbrodt, J. & Stelzer, E. H. Optical sectioning deep inside live embryos by selective plane illumination microscopy. Science 305, 1007–1009 (2004).
- [8] Keller, P. J., Schmidt, A. D., Wittbrodt, J. & Stelzer, E. H. Reconstruction of zebrafish early embryonic development by scanned light sheet microscopy. Science 322, 1065–1069 (2008).
- [9] Verveer, P. J. et al. High-resolution three-dimensional imaging of large specimens with light sheet-based microscopy. Nature Methods 4, 311–313 (2007).
- [10] Hell, S. W. Far-field optical nanoscopy. Optics InfoBase Conference Papers 316, 1153–1158 (2009).
- [11] Gustafsson, M. G. Surpassing the lateral resolution limit by a factor of two using structured illumination microscopy. Journal of Microscopy 198, 82–87 (2000).
- [12] Schermelleh, L. et al. Subdiffraction multicolor imaging of the nuclear periphery with 3d structured illumination microscopy. Science 320, 1332–1336 (2008).
- [13] Hell, S. W. & Wichmann, J. Breaking the diffraction resolution limit by stimulated emission: stimulated-emission-depletion fluorescence microscopy. Optics Letters 19, 780 (1994).
- [14] Schermelleh, L., Heintzmann, R. & Leonhardt, H. A guide to super-resolution fluorescence microscopy. Journal of Cell Biology 190, 165–175 (2010).
- [15] Power, R. M. & Huisken, J. A guide to light-sheet fluorescence microscopy for multiscale imaging. Nature Methods 14, 360–373 (2017).
- [16] Ahrens, M. B., Orger, M. B., Robson, D. N., Li, J. M. & Keller, P. J. Whole-brain functional imaging at cellular resolution using light-sheet microscopy. Nature methods 10, 413–420 (2013).
- [17] Glaser, A. K. et al. Light-sheet microscopy for slide-free non-destructive pathology of large clinical specimens. Nature biomedical engineering 1, 1–10 (2017).
- [18] Wang, H. et al. Deep learning enables cross-modality super-resolution in fluorescence microscopy. Nature Methods 16, 103–110 (2019).
- [19] Weigert, M. et al. Content-aware image restoration: pushing the limits of fluorescence microscopy. Nature Methods 15, 1090–1097 (2018).
- [20] Weigert, M., Royer, L., Jug, F. & Myers, G. Isotropic reconstruction of 3d fluorescence microscopy images using convolutional neural networks. 126–134 (Springer International Publishing, 2017).
- [21] Zhang, H. et al. High-throughput, high-resolution deep learning microscopy based on registration-free generative adversarial network. Biomedical Optics Express 10, 1044 (2019).
- [22] Zhu, J. Y., Park, T., Isola, P. & Efros, A. A. Unpaired image-to-image translation using cycle-consistent adversarial networks. vol. 2017-Octob, 2242–2251 (IEEE, 2017).
- [23] Sim, B., Oh, G., Kim, J., Jung, C. & Ye, J. C. Optimal transport driven cycleGAN for unsupervised learning in inverse problems. SIAM Journal on Imaging Sciences 13, 2281–2306 (2020).
- [24] Lim, S. et al. CycleGAN with a blur kernel for deconvolution microscopy: Optimal transport geometry. IEEE Transactions on Computational Imaging 6, 1127–1138 (2020).
- [25] Villani, C. Optimal transport: old and new, vol. 338 (Springer Science & Business Media, 2008).
- [26] Goodfellow, I. J. et al. Generative adversarial nets. In Proceedings of the 27th International Conference on Neural Information Processing Systems - Volume 2, NIPS’14, 2672–2680 (MIT Press, Cambridge, MA, USA, 2014).
- [27] Bogovic, J. A., Hanslovsky, P., Wong, A. & Saalfeld, S. Robust registration of calcium images by learned contrast synthesis. vol. 2016-June, 1123–1126 (IEEE, 2016).
- [28] McGorty, R. et al. Open-top selective plane illumination microscope for conventionally mounted specimens. Optics Express 23 (2015).
- [29] Mcgorty, R., Xie, D. & Huang, B. High-na open-top selective-plane illumination microscopy for biological imaging. Optics Express 25 (2017).
- [30] Kim, B. et al. Open-top axially swept light-sheet microscopy. Biomedical Optics Express (2021).
- [31] Richardson, W. H. Bayesian-based iterative method of image restoration*. Journal of the Optical Society of America 62, 55 (1972).
- [32] Lucy, L. B. An iterative technique for the rectification of observed distributions. The Astronomical Journal 79 (1974).
- [33] Sage, D. et al. Deconvolutionlab2: An open-source software for deconvolution microscopy. Methods 115, 28–41 (2017). Image Processing for Biologists.
- [34] Belthangady, C. & Royer, L. A. Applications, promises, and pitfalls of deep learning for fluorescence image reconstruction. Nature Methods 16, 1215–1225 (2019).
- [35] Mao, X. et al. Least squares generative adversarial networks (IEEE, 2017).
- [36] Ronneberger, O., Fischer, P. & Brox, T. U-net: Convolutional networks for biomedical image segmentation. In Navab, N., Hornegger, J., Wells, W. M. & Frangi, A. F. (eds.) Medical Image Computing and Computer-Assisted Intervention – MICCAI 2015, 234–241 (Springer International Publishing, Cham, 2015).
- [37] Bell-Kligler, S., Shocher, A. & Irani, M. Blind super-resolution kernel estimation using an internal-GAN. In Advances in Neural Information Processing Systems 32: Annual Conference on Neural Information Processing Systems 2019, NeurIPS 2019, December 8-14, 2019, Vancouver, BC, Canada, 284–293 (2019).
- [38] He, K., Zhang, X., Ren, S. & Sun, J. Delving deep into rectifiers: Surpassing human-level performance on imagenet classification (IEEE, 2015).
- [39] Kingma, D. P. & Ba, J. Adam: A method for stochastic optimization. arXiv preprint arXiv:1412.6980 (2017).
- [40] Ulyanov, D., Vedaldi, A. & Lempitsky, V. Instance normalization: The missing ingredient for fast stylization. arXiv preprint arXiv:1607.08022 (2016).
- [41] Isola, P., Zhu, J. Y., Zhou, T. & Efros, A. A. Image-to-image translation with conditional adversarial networks. vol. 2017-Janua, 5967–5976 (2017).
Supplementary Figures

Supplementary Note
S0.5 Generative network
Our generative network structure for the super-resolving path is based on the 3D U-Net architecture[36], as illustrated in Supplementary Fig. S9a. The generator is implemented as and encoder-to-decoder architecture and consists of the downsampling path, the bottom layer, the upsampling path, and the output layer. Specifically, the downsampling path consists of the repetition of the following block:
where represents the output 3D feature tensor of the th down-sampling block, and is the input 3D volume. ReLU[] is the the rectified linear unit activation function with a slope of =1, Norm() is the instance normalization[40], Conv{} is the convolution operation, and the Maxpool[] is the max pooling operation. The bottleneck layer is as follows:
where is the output of the bottom layer. The up-sampling path consists of the repetition of the following block:
where is the output of the th upsampling block. Concat[] is the concatenation operation, and the TrConv {} is the transposed convolution. The last output layer is as follows:
where is an output 3D volume.
The generative network architecture in the backward path is adjustable and replaceable based on how well the generative network can emulate the blurring or downsampling process in the backward path. We searched for an optimal choice empirically between the 3D U-net architecture (refer to Supplementary Figure S9a) and the deep linear generator without the downsampling step (refer to Supplementary Figure S9b). The kernel sizes in the deep linear generator vary depending on depths of the convolution layers, as shown in Supplementary Figure S9b.
S0.6 Discriminative network structure
As the inputs to the discriminator networks are , and plane images, we adopted the discriminative network structure from 2D patchGAN[41] for our discriminator networks. The detailed schematic is illustrated in Supplementary Figure S9c. The patchGAN consists of multiple convolution blocks that allow the discriminator module to judge an input image based on different scales of patches.
where is the input 2D image, either real or fake as generated by the generator network. Norm() is the instance normalization. LReLU is the leaky rectified linear unit activation function with a slope of . The last layer is a convolution layer that generates a single channel prediction map.
S0.7 Definition of PSNR
The PSNR metric in this study is calculated as follows:
where is the reference image, is the reconstructed image, and both images have the dimensions of and .