Calibration of the Age-Activity relation for M dwarfs
Abstract
In this work, we calibrate the relationship between emission and M dwarf ages. We compile a sample of 892 M dwarfs with equivalent width () measurements from the literature that are either co-moving with a white dwarf of known age (21 stars) or in a known young association (871 stars)111The sample is available to download from Zenodo.. In this sample we identify 7 M dwarfs that are new candidate members of known associations. By dividing the stars into active and inactive categories according to their and spectral type (SpT), we find that the fraction of active dwarfs decreases with increasing age, and the form of the decline depends on SpT. Using the compiled sample of age-calibrators we find that and fractional luminosity () decrease with increasing age. for SpT decreases gradually up until Gyr. For older ages, we found only two early M dwarfs which are both inactive and seem to continue the gradual decrease. We also found 14 mid-type out of which 11 are inactive and present a significant decrease of , suggesting that the magnetic activity decreases rapidly after Gyr. We fit versus age with a broken power-law and find an index of for ages Myr. The index becomes much steeper at older ages however a lack of field age-calibrators ( Gyr) leaves this part of the relation far less constrained. Finally, from repeated independent measurements for the same stars we find that of these has a level of variability at young ages ( Gyr).
1 Introduction
M dwarfs are the coolest and most abundant stars in the Milky Way (Gould et al., 1996; Bochanski et al., 2010). As the lifetime of M dwarfs is longer than the current age of the Universe (e.g., Fagotto et al., 1994; Laughlin et al., 1997) those that we find throughout the Galaxy span a wide range of ages. Therefore, M dwarfs are a rich stellar population for a statistical analysis of the Milky Way evolution, dynamics and composition (e.g., Gizis et al., 2002; Faherty et al., 2009; Bochanski et al., 2007, 2010; Jones et al., 2011). In addition, M dwarfs are attractive targets to study exoplanet populations because the occurrence of small rocky exoplanets is higher for M dwarfs than any other spectral type. Furthermore, it is easier to detect small planets around low-mass stars than around higher-mass stars due to the large reflex motion (e.g., Mulders et al., 2015; Dressing & Charbonneau, 2015; Shields et al., 2016).
M dwarfs are intrinsically faint, especially towards later and cooler spectral types, and measuring their fundamental properties can therefore be challenging, even for the nearest ones (e.g., Ribas et al., 2017). However, several fundamental properties of M dwarfs have been studied extensively. For instance, using spectroscopy, photometry, and astrometry, effective temperature (e.g., Ness et al., 2015; Mann et al., 2015; Birky et al., 2020), radius (e.g., Kesseli et al., 2018), luminosity (e.g., Reid & Cruz, 2002), metallicity (e.g., Bochanski et al., 2013; Newton et al., 2014; Schmidt et al., 2016) and mass (e.g., Boyajian et al., 2012; Mann et al., 2019) measurements have been studied. Age, however, is one of the most difficult fundamental properties to evaluate, especially for M dwarfs (Soderblom, 2010).
Current age-dating methods used for higher-mass stars cannot be applied to low-mass stars. Asteroseismology (e.g., Chaplin et al., 2014) is a common age-dating method for giant stars but cannot be applied to M dwarfs because their acoustic oscillations have extremely small amplitudes and short timescales (Rodríguez et al., 2016). Isochrones from stellar evolution models are also not efficient to estimate M dwarf ages due to the extremely slow and small changes in luminosity after Gyr, making the isochrones very similar for older ages (Chabrier & Baraffe, 1997). Furthermore, there are not sufficient empirical calibrations to validate isochrones for low-mass stars, especially at young ages. As a consequence, model isochrones still suffer from significant systematic errors that are unexplored, and are inaccurate for precise age determinations (Baraffe et al., 2015). Empirical methods such as gyrochronology (e.g., Skumanich, 1972; Barnes, 2003, 2007; Angus et al., 2015; Van Saders et al., 2016) are either based on the Sun, or calibrated on higher-mass stars, and do not yield precise age estimates for M dwarfs (e.g., Angus et al., 2019). As current available methods cannot be used to estimate M dwarf ages, empirically-calibrated relations for age-related properties are needed.
Magnetic activity, age and rotation period are known to be correlated for solar type stars (e.g., Skumanich, 1972; Barry, 1988; Soderblom et al., 1991; Mamajek & Hillenbrand, 2008). These stars have a radiative core and a convective envelope and they do not rotate as a rigid body. As solar type stars rotate, a magnetic dynamo is generated in between the two layers, which is responsible for their magnetic field (Parker, 1955). Given that rotation and age are correlated for solar-type stars (e.g., Skumanich, 1972; Barnes, 2003, 2007; Angus et al., 2015; Van Saders et al., 2016), their magnetic activity is correlated with age as well. For the lowest-mass stars (spectral type ) the correlation between magnetic activity, age and rotation is not well understood because these cool stars are fully convective (Chabrier & Baraffe, 1997) and do not have an interface to produce a dynamo. However, previous studies of M dwarfs indicate that magnetic activity, rotation and age are correlated (e.g., Eggen, 1990; Fleming et al., 1995; Delfosse et al., 1998; Mohanty & Basri, 2003; West et al., 2004; Reiners et al., 2012; West et al., 2015; Riedel et al., 2017; Newton et al., 2017; Kiman et al., 2019; Angus et al., 2019).
A well-studied magnetic activity indicator in M dwarfs is the emission line (Hawley et al., 1996; West et al., 2008b, a) which is generated by collisional excitations when magnetic field lines heat the dense chromosphere (Stauffer & Hartmann, 1986). Therefore, equivalent width is an indirect measurement of the chromospheric magnetic activity of a star. The fact that M dwarf magnetic fields are driven by their rotation means that the rotation-age correlation should translate into a -age correlation (Newton et al., 2017). As a consequence, could be used as an age indicator for M dwarfs. For low-mass stars, previous studies have confirmed that emission is correlated with age by using kinematics as an age-indicator (Gizis et al., 2002; West et al., 2008b; Kiman et al., 2019). West et al. (2008a) found a functional form for the age-activity relation from a sample of M dwarfs with by modeling the relation between kinematics and age. However, to date, there has not been a study which calibrates empirically the age-activity relation for M dwarfs.
A first necessary step to calibrate the age-activity relation is to collect M dwarfs with known ages, calculated with methods independent of the magnetic activity. The second data release of Gaia (Gaia Collaboration et al., 2016, 2018; Arenou et al., 2018; Lindegren et al., 2018) plays a key role in age-dating stars. The Gaia DR2 catalog contains billion sources with a five-parameter astrometric solution: positions, parallaxes (), and proper motions () with unprecedented precision, down to a magnitude of . The parallax uncertainties () are between milliarcsecond, and for proper motion () between , depending on the magnitude of the star. With these high quality measurements, Gaia made it possible to identify new stars that belong to age-calibrated moving groups and new associations (e.g., Gagné & Faherty, 2018; Faherty et al., 2018; Kounkel & Covey, 2019; Röser & Schilbach, 2020), and new co-moving pairs of stars (e.g., Oh et al., 2017; El-Badry & Rix, 2018). Both young associations and co-moving pairs can be sources for M dwarf ages.
Moving groups and other coeval associations are ensembles of stars born from the same molecular cloud with common space velocities and a small spread of ages (Bell et al., 2015). As ages of the young associations are well calibrated down to a precision of a few Myr (Soderblom, 2010; Bell et al., 2015), the age of the association can be used to build a set of age-calibrated M dwarfs, if the stars can be identified as members.
Binary stars are born from the same molecular cloud at the same time (Bodenheimer, 2011). Therefore, we can calibrate the age of an M dwarf by constraining the age of a co-mover. For example, we can estimate a white dwarf’s total age adding the white dwarf cooling age, and the progenitor star main sequence age (Fouesneau et al., 2018). The white dwarf cooling age and mass are strongly constrained by cooling tracks, from theoretical models (e.g., Bergeron et al., 1995; Fontaine et al., 2001; Bergeron et al., 2019). Using the mass of the white dwarf and the semi-empirical initial-to-final mass relations (Cummings et al., 2018), we can estimate the mass of the progenitor star. Finally with the mass of the progenitor star, we can calculate a main-sequence age, combined with the length of the pre- and post- (but pre-white dwarf) main-sequence stages (obtained with MESA models, Dotter, 2016).
The aim of the present study is to calibrate the age-activity relation for M dwarfs using a sample of age-calibrators. We describe how we compiled a sample of M dwarfs with measurements in the literature in Section 2. We show how we obtained the age-calibrators from that sample by identifying M dwarfs co-moving with a white dwarf with known age or members of known young associations in Section 3. The final table of age-calibrators in described in Table 1. In Section 4 we describe the calculation of the fractional luminosity from for the age-calibrators, which is a key parameter to calibrate the age-activity relation. In this section we also describe a search for known unresolved binaries which could bias our calibration of the age-activity relation. In Section 5 we show how we divided the sample of age calibrators into active or inactive objects according to their measurement and photometry, and how we studied the relation between the active fraction and age for different spectral types. In Section 6 we discuss the relation between both and fractional luminosity with age and fit it using a Markov chain Monte Carlo (MCMC) algorithm. In Section 7 we compare our results for the age-activity relation with literature results for , X-ray and UV. Finally, in Section 8 we discuss our results and summarize our work and conclusions. All the code used in this work is available on Zenodo222https://doi.org/10.5281/zenodo.4660208 and GitHub333https://github.com/rkiman/M-dwarfs-Age-Activity-Relation.
2 Identifying M dwarfs in the literature with measurements
2.1 Compiling the literature search sample
In order to empirically calibrate the age-activity relation for M dwarfs, we began by collecting M-M dwarfs from the literature with a reported . In Kiman et al. (2019) they compiled one of the largest published samples of M dwarfs with , including measurements from West et al. (2011) and Schmidt et al. (2015). This sample contains M dwarfs, out of which were removed since they have a spectroscopically identified but unresolved white dwarf companion (West et al., 2011; Schmidt et al., 2015) which could increase the magnetic activity of the star (Skinner et al., 2017). The remaining M dwarfs from Kiman et al. (2019) make up the largest part of our literature search sample.
The M dwarfs in Kiman et al. (2019) are assumed to be primarily field stars. We complemented this sample with studies of M dwarfs in known star forming regions, clusters, moving groups, or co-moving with a white dwarf, as well as all the studies in the literature that have measured for cool dwarfs. All the studies we checked are listed or mentioned in Table 2. In total, we identified stars from the literature ( from Kiman et al. (2019) and from other studies)444The sample is available to download from Zenodo.. From the total number of stars in our sample, we found that stars () have photometric and astrometric information from Gaia DR2 (Gaia Collaboration et al., 2016, 2018). We applied the quality cuts described in Kiman et al. (2019) to select the best astrometric and photometric data from Gaia DR2 (the Sub Red sample). These cuts not only select best quality photometry, parallaxes and proper motions, but also remove possible unresolved binaries. We refer to Section 2.3 of Kiman et al. (2019) for more details. By applying these quality cuts we were left with M dwarfs () in our literature search sample. In Section 3, we describe the cross-match with Gaia in more detail. We use the spectral type classification from the literature when available and estimate the spectral type for the rest of the stars ( of the sample) using their Gaia red color and the relation in Kiman et al. (2019). Although most of the studies we compiled were focused on M dwarfs, some contained higher mass stars, mostly G and K dwarfs, which were removed with a cut in spectral type keeping M dwarfs ().
From our literature search sample, M dwarfs have between two and six measurements of . We identified duplicates through a position search within a radius. These duplicated stars are indicated in the column star_index in Table 1. If two or more stars have the same number in this column, then they likely are the same star. In total we found that our literature search sample has unique M dwarfs with good data from Gaia DR2 and measurements.
| Column name | Units | Description |
|---|---|---|
| ra | deg | Original R.A. from the source of the measurement |
| dec | deg | Original Decl. from the source of the measurement |
| spt | Spectral Type | |
| gaia_source_id | … | Unique Gaia source identifier (unique within DR2) |
| ra_gaia | deg | R.A. in Gaia DR2 epoch |
| dec_gaia | deg | Decl. in Gaia DR2 epoch |
| pmra | mas | Proper motion in R.A. direction in Gaia DR2 |
| pmra_error | mas | Standard error of proper motion in R.A. direction in Gaia DR2 |
| pmdec | mas | Proper motion in decl. direction in Gaia DR2 |
| pmdec_error | mas | Standard error of proper motion in decl. direction in Gaia DR2 |
| parallax | mas | Parallax in Gaia DR2 |
| parallax_error | mas | Standard error of parallax in Gaia DR2 |
| phot_g_mean_flux | electron | band mean flux |
| phot_g_mean_flux_error | electron s-1 | Error on band mean flux |
| phot_g_mean_mag | mag | band band mean magnitude |
| phot_rp_mean_flux | electron | Integrated mean flux |
| phot_rp_mean_flux_error | electron s-1 | Error on the integrated mean flux |
| phot_rp_mean_mag | mag | Integrated mean magnitude |
| phot_bp_mean_flux | electron | Integrated mean flux. |
| phot_bp_mean_flux_error | electron s-1 | Error on the integrated mean flux |
| phot_bp_mean_mag | mag | Integrated mean magnitude |
| g_corr | mag | magnitude corrected for extinction |
| rp_corr | mag | magnitude corrected for extinction |
| ewha | Equivalent width for the compatible literature search | |
| ewha_error | Equivalent width error for the compatible literature search | |
| ewha_all | Equivalent width for all the stars | |
| ewha_error_all | Equivalent width error for all the stars | |
| lhalbol | … | Fractional luminosity |
| lhalbol_error | … | Fractional luminosity error |
| age | yr | Age of the star |
| age_error_low | yr | Lower bound on the confidence interval of the estimated age |
| age_error_high | yr | Upper bound on the confidence interval of the estimated age |
| group_num | … | Number identifying the young association. indicates white dwarf companion |
| group_name | … | Young association the star belong to |
| star_index | … | Number indicating repeated stars. Same stars have the same number |
| source_num | … | Number indicating the source of the measurement |
| source_ref | … | Source of the measurement |
| potential_binary | … | if it is a potential binary, if not. |
| Reference aaCompatible catalogs without age calibrators: Gizis et al. (2002), Mochnacki et al. (2002), Reid & Cruz (2002), West et al. (2011), Song et al. (2004), Lyo et al. (2004). Catalogs with overlap but not compatibles: Mohanty et al. (2005), Shkolnik et al. (2011), Lawson et al. (2002). Catalogs without overlap: Frasca et al. (2018), Bayo et al. (2012), Reid et al. (2007), Cruz & Reid (2002), Feigelson et al. (2003), Gizis et al. (2000), Gizis & Reid (1997), Murphy et al. (2010), Phan-Bao & Bessell (2006), Bochanski et al. (2005), Mohanty & Basri (2003), Reiners & Basri (2008), Lépine et al. (2009), Reiners & Basri (2007), Lépine et al. (2003), Martin & Kun (1996), Ivanov et al. (2015), Stauffer et al. (1997), Tinney & Reid (1998). Other catalogs checked: Lodieu et al. (2005). | Spectral | of M dwarfs | OC ccOrder of compatibility. Order is compatible with Kiman et al. (2019). Order is compatible with at least one order catalog. | Ages from | ||
|---|---|---|---|---|---|---|
| Resolution | Total | Compatible bbCompatible with Kiman et al. (2019). | moving group | white dwarf | ||
| Kiman et al. (2019) | 1800 | 73729 | 73729 | 0 | 46 | 21 |
| LG11ddLepine et al. (2013); Gaidos et al. (2014) with additional data observed in an identical manner. | 1000 | 2504 | 134 | 2 | 48 | - |
| Jeffers et al. (2018) | 62000, 48000, 40000 | 2133 | 2 | 2 | 22 | - |
| Douglas et al. (2014) | 3300, 4000 | 1906 | 50 | 1 | 264 | - |
| Lepine et al. (2013) | 2000,4000 | 1577 | 1 | 2 | 4 | - |
| Riaz et al. (2006) | 1750 | 1098 | 4 | 2 | 65 | - |
| Ansdell et al. (2015) | 1000, 1200 | 794 | 35 | 2 | 31 | - |
| Gaidos et al. (2014) | 1200 | 582 | 59 | 2 | 2 | - |
| Fang et al. (2018) | 1800 | 561 | 1 | 1 | 159 | - |
| Newton et al. (2017) | 3000 | 456 | 14 | 2 | 2 | - |
| Terrien et al. (2015) | 2000 | 351 | 13 | 2 | 2 | - |
| Reid et al. (1995) | 2000 | 343 | 4 | 2 | 1 | - |
| Schneider et al. (2019) | 32000 | 336 | 10 | 2 | 26 | - |
| Bouy & Martín (2009) | Multiple | 227 | 1 | 2 | 135 | - |
| Kraus et al. (2014) | 35000 | 205 | 2 | 2 | 88 | - |
| Shkolnik et al. (2009) | 60000 | 184 | 7 | 2 | 9 | - |
| Alonso-Floriano et al. (2015) | 1500 | 179 | 8 | 2 | 3 | - |
| Slesnick et al. (2008) | 1250 | 145 | 69 | 2 | 23 | - |
| Malo et al. (2014a) | 1750 | 120 | 1 | 2 | 45 | - |
| Torres et al. (2006) | 50000, 9000 | 114 | 2 | 2 | 18 | - |
| Shkolnik et al. (2017) | 35000, 58000 | 106 | 3 | 2 | 24 | - |
| Elliott et al. (2016) | 85000, 48000 | 83 | 2 | 2 | 3 | - |
| Reiners & Basri (2010) | 31000 | 73 | 2 | 1 | 2 | - |
| Slesnick et al. (2006) | 1250 | 65 | 19 | 2 | 18 | - |
| Jayawardhana et al. (2006) | 60000 | 52 | 1 | 2 | 20 | - |
| Riedel et al. (2014) | Multiple | 50 | 3 | 2 | 5 | - |
| Hawley et al. (1996) | 2000 | 31 | 1 | 2 | 1 | - |
| Song et al. (2003) | 24000 | 25 | 1 | 2 | 3 | - |
| Rodriguez et al. (2014) | 3000, 7000 | 23 | 12 | 2 | 12 | - |
2.2 Identifying compatible measurements from the literature
The is calculated by dividing the flux under the emission line of by the flux of the continuum. Both sources of for Kiman et al. (2019) (West et al., 2011; Schmidt et al., 2015) used the same definition for the emission line: , and the surrounding continuum: and . Both West et al. (2011) and Schmidt et al. (2015) measured the from spectra with resolution. Our literature search sample, however, contains objects with measurements of from different spectral resolutions (shown in Table 2) that were calculated with slightly different definitions of the line and the continuum. Such diversity of approaches and results could cause inconsistencies in our analysis. To account for the differences between measurements, we followed a procedure similar to the one described in Newton et al. (2017). We only used the from catalogs that were compatible with the Kiman et al. (2019) sample, as that is the largest component of our literature search sample (see Section 2.1). We considered a given catalog compatible if it had at least one star in common and if at least of the stars in common had a difference in smaller than () with the measurement in Kiman et al. (2019). We chose as the limit because this is the typical variability for identified by Lee et al. (2010) in a spectroscopic survey of M dwarfs in the range . This cut assumes that of the M dwarfs have small variability. We note that this might bias against variable dwarfs, because variability increases for later types (Lee et al., 2010).
We defined the criterion described above as first order compatibility and it is indicated with a in the column “OC” of Table 2. We could only find three catalogs from the literature search that had overlapping stars with Kiman et al. (2019): Douglas et al. (2014), Fang et al. (2018) and Reiners & Basri (2010). Therefore we decided to iterate upon our method and search for further studies compatible with these three catalogs to increase the number of stars we consider compatible. We repeated the procedure described above to find what we defined as second order compatibility catalogs. These second order of compatibility catalogs do not have stars in common with Kiman et al. (2019), but they do have stars in common with at least one of the order catalogs.
In all we found unique M dwarfs ( of the sample) with measurements that were either in Kiman et al. (2019, order 0) or first or second order compatible, meaning that we can use them together to calibrate the age-activity relation. We excluded the remaining M dwarfs from our analysis.
2.3 Removing potentially accreting M dwarfs
To characterize the age-activity relation we are interested in chromospheric emission, however this spectral line could in some systems result from accretion. To distinguish between the two types of emission we used an empirical criterion which depends on the star’s and spectral type, developed by White & Basri (2003) based on a sample of low-mass T Tauri stars. They proposed that a T Tauri star is classical, meaning accreting, if for stars, for , and for stars.
Based on the White & Basri (2003) criterion, we removed stars which are outliers from our analysis that are possibly accreting. It should also be noted that by using only to discard possible accretors we are also removing outliers such as non-accreting stars whose measurement of was taken during a flare. In Table 3 we list the outliers, possibly accreting, identified in this study with their 2MASS name, spectral type, the and above the limit defined by White & Basri (2003). Given that the criteria only goes to , we did not remove any later spectral types according to their . Therefore we are likely to have some contamination from accreting later spectral types.
| 2MASS Name | SpT | aaDelta above the limit. | |
|---|---|---|---|
| J16075567-2443267 | M5.5 | ||
| J05353004+0959255 | M5.6 | ||
| J05334992+0950367 | M2.3 | ||
| J12350424-4136385 | M2.5 | ||
| J02591904-5122341 | M5.4 | ||
| J16104996-2212515 | M5.5 | ||
| J04480085+1439583 | M5.0 | ||
| J04262939+2624137 | M6.0 | ||
| J05340393+0952122 | M2.2 | ||
| J12071089-3230537 | M4.3 |
3 Identifying M dwarfs in young associations and co-moving with white dwarfs
3.1 Identifying young association members
As mentioned in Section 2.1, we complemented Kiman et al. (2019) with M dwarfs which were classified as members of young associations by previous studies and/or had measurements. However, most of these studies were completed prior to the release of Gaia DR2, which provided kinematics of an unprecedented quality.
In light of the new astrometric improvement of the Gaia DR2 survey, we decided to re-assess the likelihood of membership for each source and/or identify new members. To obtain proper motions and parallaxes for our literature search sample, we used TOPCAT (Taylor, 2005) and a arcsecond radius to match to Gaia DR2 objects. We found ( out of the original sources) of our literature search sample in Gaia DR2. As mentioned in Section 2.1, we applied the quality cuts described in Kiman et al. (2019), to obtain the best astrometric and photometric data, and to remove potential binaries, and we were left with 27,201 M dwarfs. To look for mismatches we used the M dwarfs in our sample with duplicated measurements of (see Section 2.1) and compared their Gaia source id. All the duplicated stars had the same Gaia source id, except for stars which we think are potentially unresolved M dwarf binaries because after visually inspecting these stars we found that in the image there was only one star with two Gaia sources. These stars were removed from our analysis.
To confirm or identify members of young associations from our literature search sample, we used the BANYAN bayesian membership classification algorithm (Gagné et al., 2018)555The IDL version is available at https://github.com/jgagneastro/banyan_sigma_idl. Also the Python version at https://github.com/jgagneastro/banyan_sigma, and the web portal is available at http://www.exoplanetes.umontreal.ca/banyan/banyansigma.php.. BANYAN models young associations with a multivariate gaussian density. This gaussian has a total of six dimensions: three galactic positions (XYZ) and three space velocities (UVW). BANYAN also models the galactic field within pc by combining multivariate gaussians. To calculate the probability of a star belonging to a young association or the field, BANYAN compares observables such as position and proper motion to the multivariate Gaussian model in a Bayesian classification likelihood, and marginalizes over radial velocities and distances when they are not available. The marginalization integrals are solved with an analytical solution, making the code more precise and efficient. In total, there are associations modeled in BANYAN within pc. A summary of the associations in BANYAN is in Table 4.
| Association | Short name | Age (Myr) | Age Ref.aaKenyon & Hartmann (1995), Wilking et al. (2008), Murphy & Lawson (2015), Gennaro et al. (2012), Bell et al. (2015), Pecaut & Mamajek (2016), Mamajek (2016), Gagné et al. (2018), Zuckerman (2018), Platais et al. (1998), Dahm (2015), Zuckerman et al. (2006), Jones et al. (2015), Pöhnl & Paunzen (2010), Silaj & Landstreet (2014), Douglas et al. (2019); Gao (2019), Brandt & Huang (2015) | Total members bbTotal number of stars with compatible (See section 2.2). | New members |
|---|---|---|---|---|---|
| Taurus | TAU | - | |||
| Ophiuchi | ROPH | - | - | ||
| Chamaeleontis | EPSC | ||||
| Corona Australis | CRA | - | - | ||
| TW Hya | TWA | - | |||
| Upper Scorpius | USCO | ||||
| 118 Tau | 118TAU | - | - | ||
| Upper CrA | UCRA | - | |||
| Chamaeleontis | ETAC | - | |||
| Lower Centaurus Crux | LCC | ||||
| Upper Centaurus Lupus | UCL | ||||
| 32 Orionis | THOR | - | - | ||
| Pictoris | PMG | ||||
| Octans | OCT | - | |||
| Argus | ARG | - | |||
| Columba | COL | - | |||
| Carina | CAR | - | |||
| Tucana-Horologium association | THA | - | |||
| Platais 8 | PL8 | - | - | ||
| Pleiades cluster | PLE | - | |||
| AB Doradus | ABDMG | ||||
| Carina-Near | CARN | - | |||
| core of the Ursa Major cluster | UMA | - | |||
| For | XFOR | - | - | ||
| Coma Berenices | CBER | - | |||
| Praesepe clusterccPraesepe is not included in the current public version of Banyan (v1.2, September 6 2018). | PRA | - | |||
| Hyades cluster | HYA | - |
Using BANYAN we calculated the probability that any given M dwarf belongs to a known association according to their position, proper motion, parallax, and radial velocity when available from Gaia DR2. We used this code to analyze the single, compatible, not accreting stars in our sample (See Section 2).
To remove as many false positives as possible without loosing true positives, we used a cutoff in the membership probability output by BANYAN as suggested by Gagné et al. (2018). In total we found M dwarfs which yielded probability in a known young association. The remaining stars were rejected as young association members by our cut and/or have a high probability () to be field stars according to BANYAN. In addition, objects were removed because they were rejected as young association members by Gagné et al. (2018). These objects were rejected mostly because their literature radial velocity was inconsistent with the one of the group.
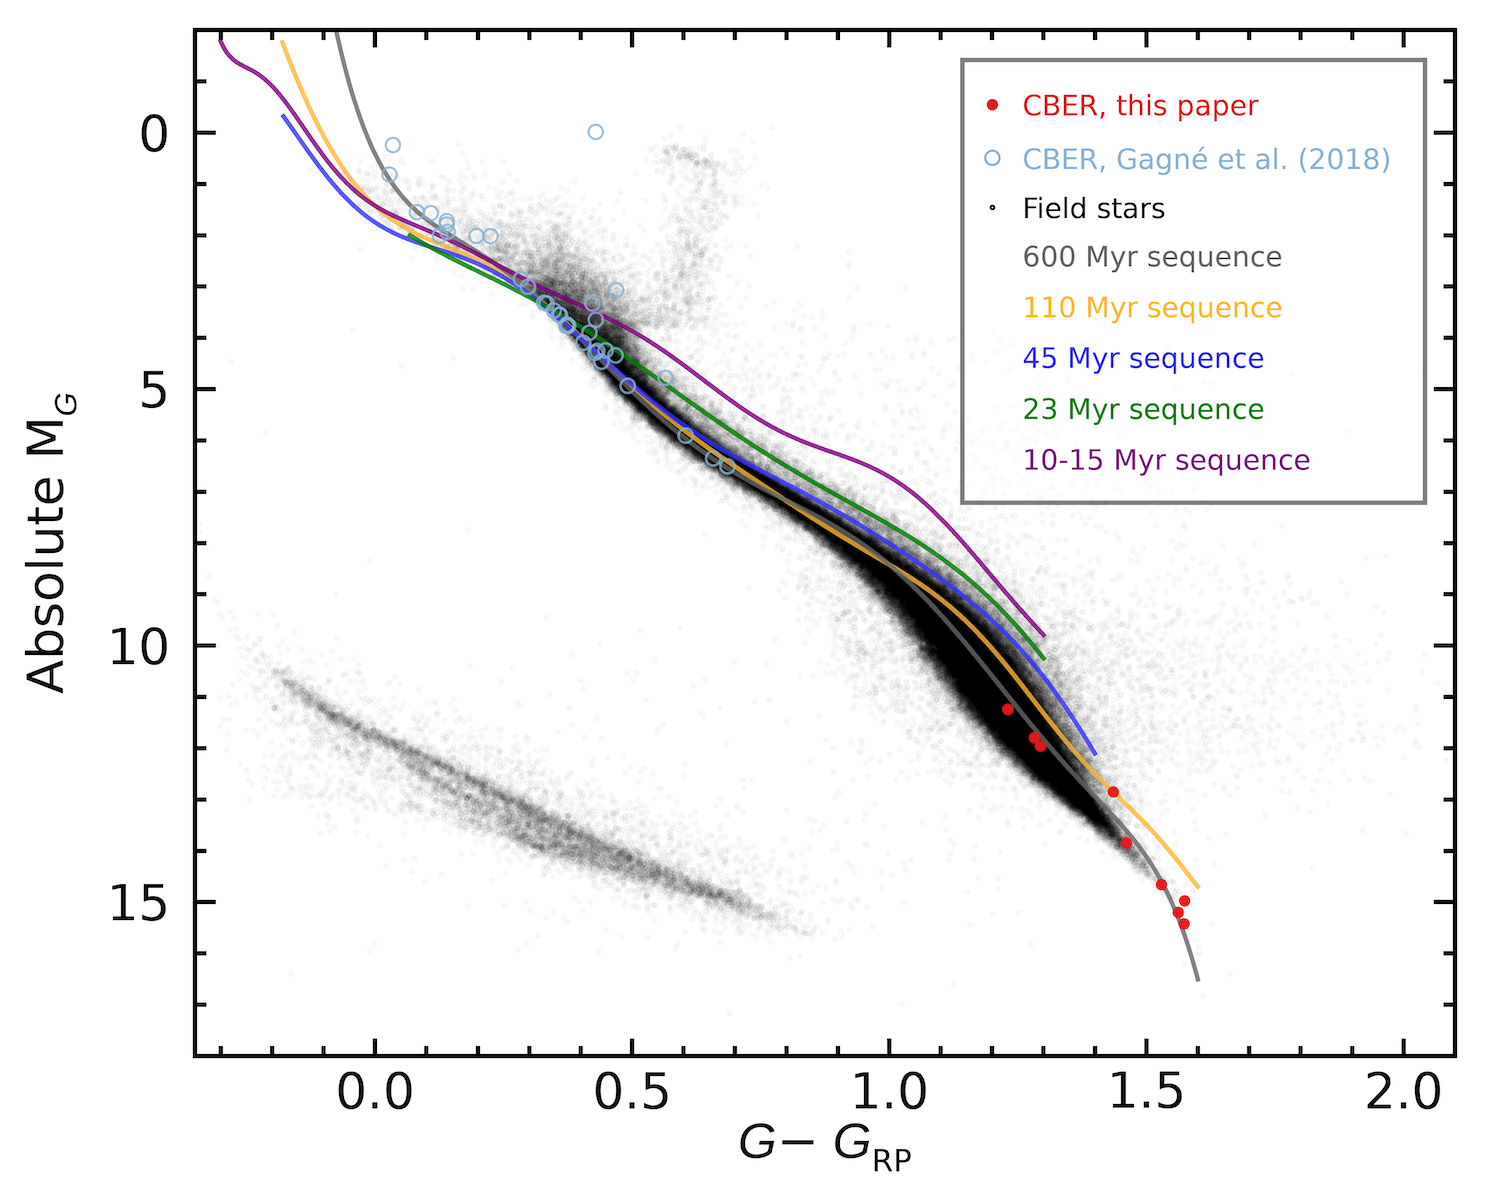
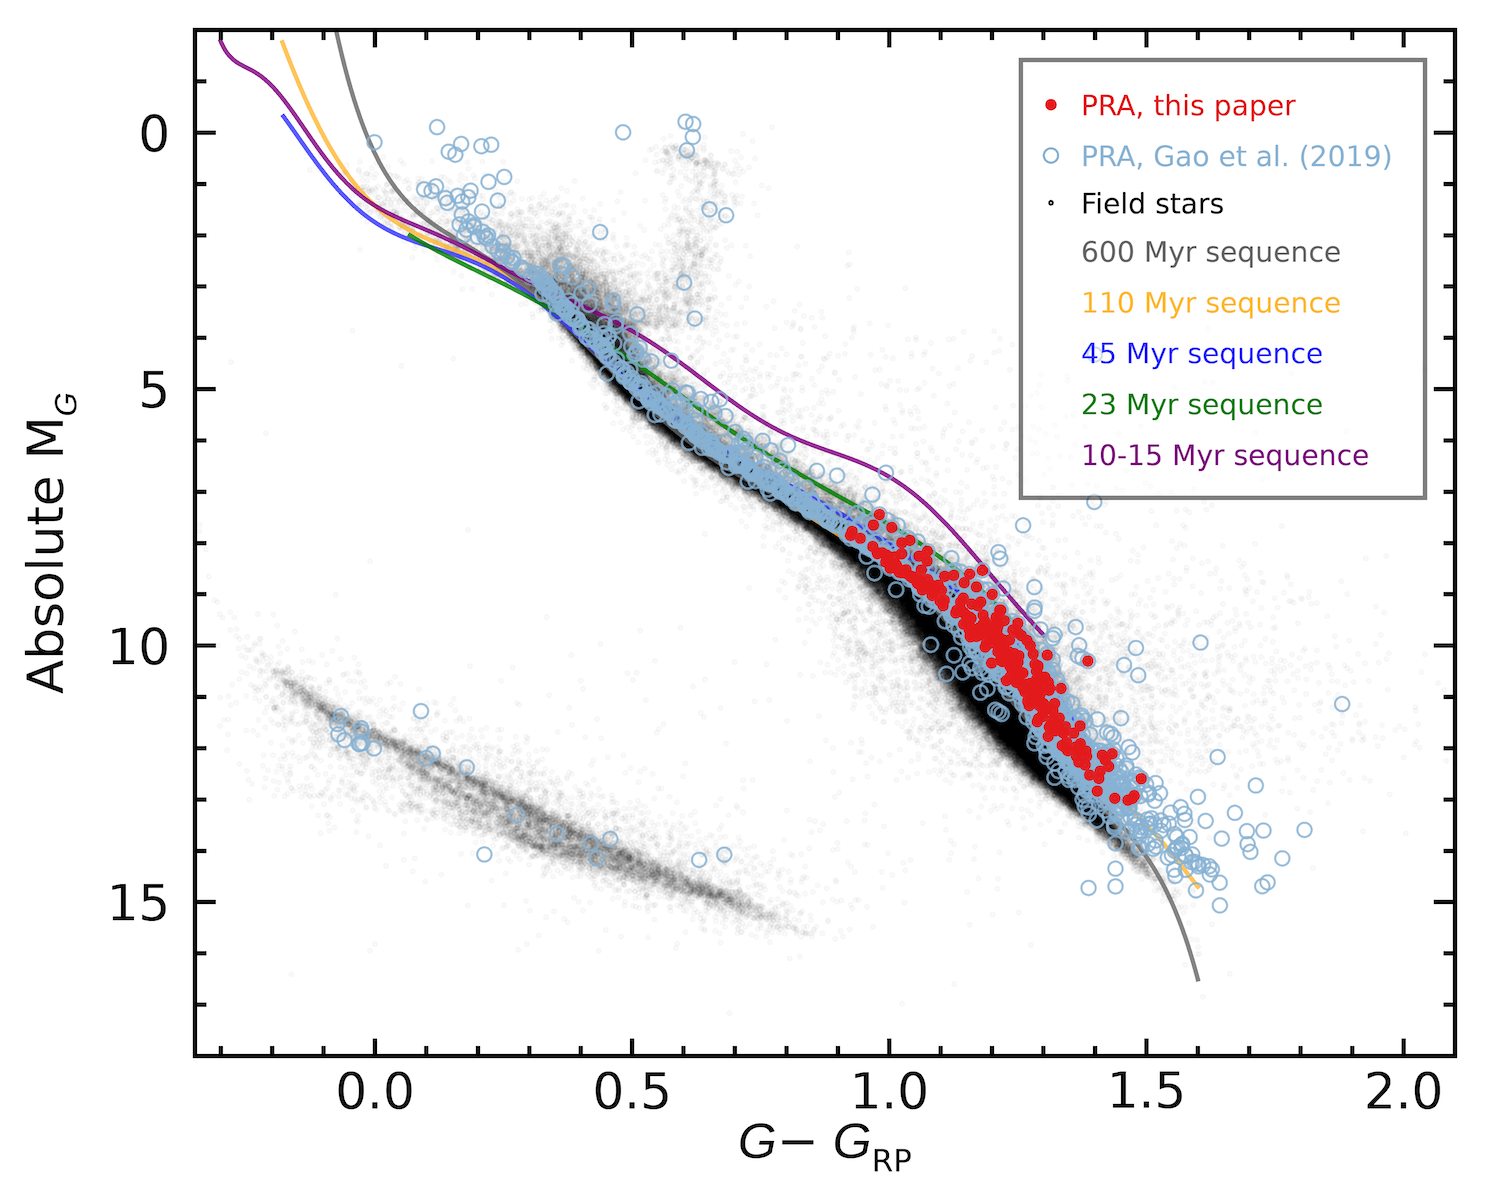
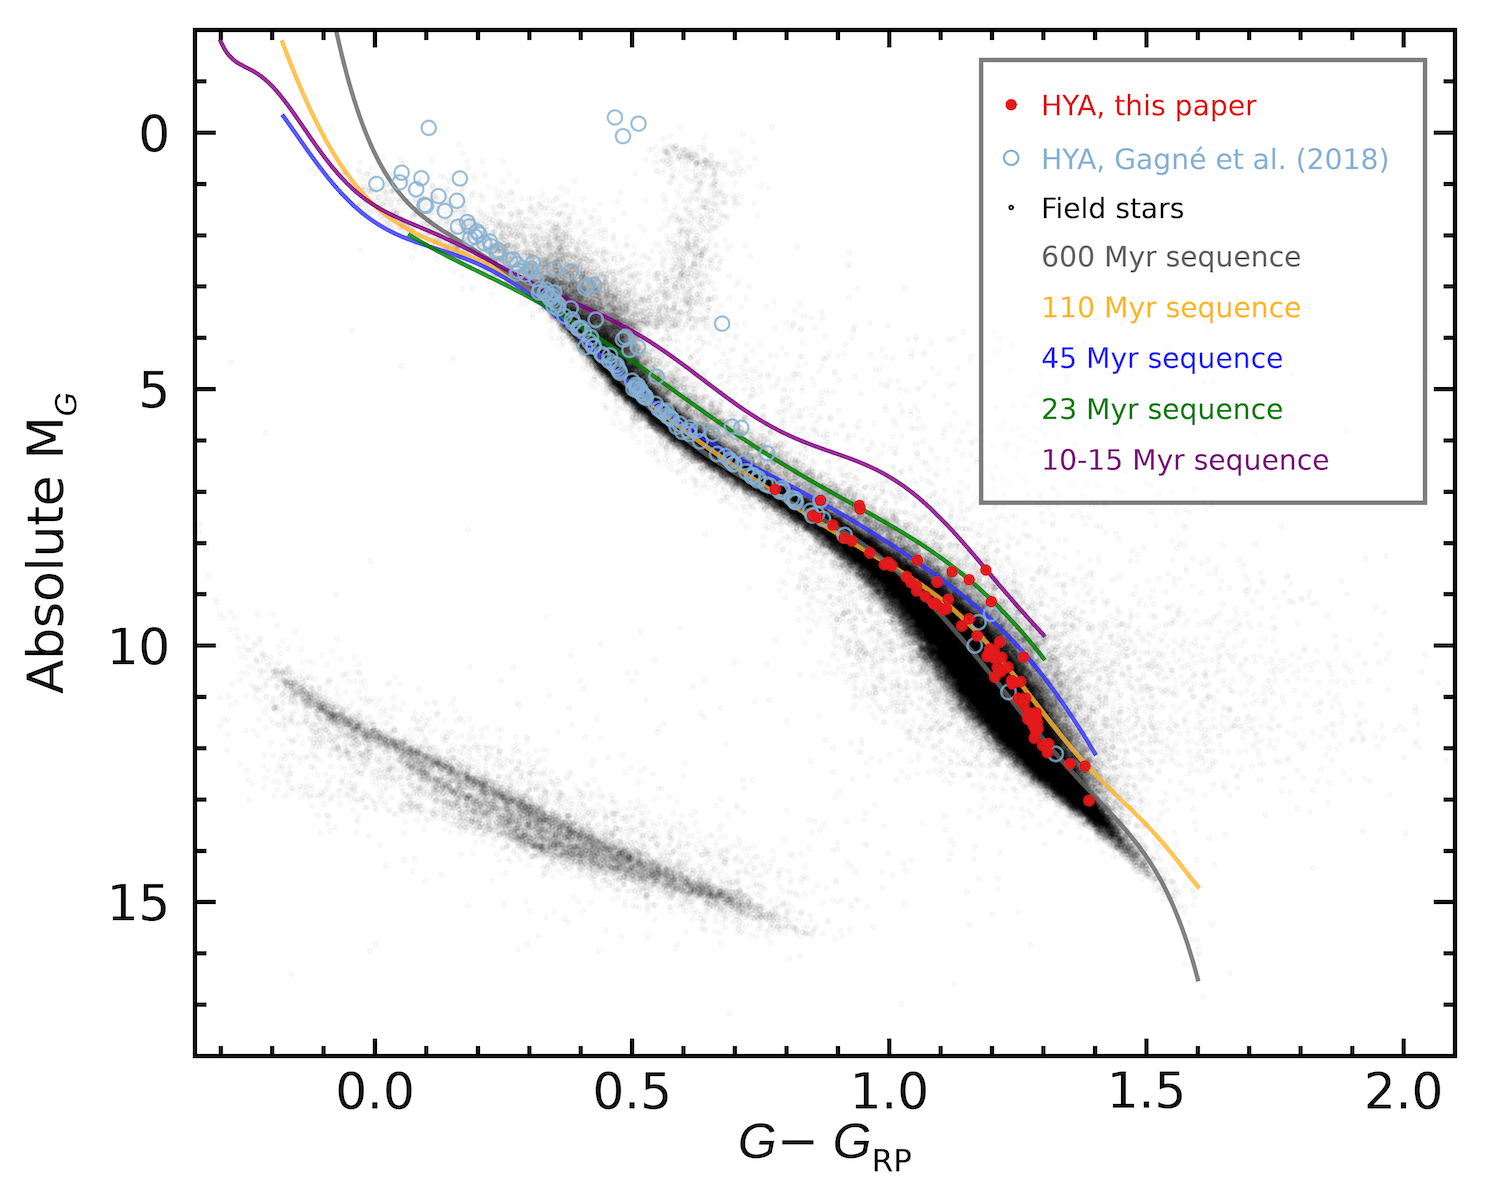
Based on experience with kinematics and lithium abundances, we expect an average contamination from false members below (Gagné et al., 2018). In the Appendix A, we show the color–magnitude diagrams for each of the young associations with all of the objects used in this study as members. We concluded that we cannot discard any objects with the color–magnitude diagrams. The distribution of members per young association is shown in Figure 1 and Table 4. We found that Praesepe ( Myr, sources) had the largest yield of objects from our sample, followed by Upper Scorpious ( Myr, sources), the Pleiades cluster ( Myr, sources) and Tucana-Horologium ( Myr, sources). Therefore, we compiled a significant number of stars covering a range of ages that allows us to calibrate the age-activity relation for ages Gyr.
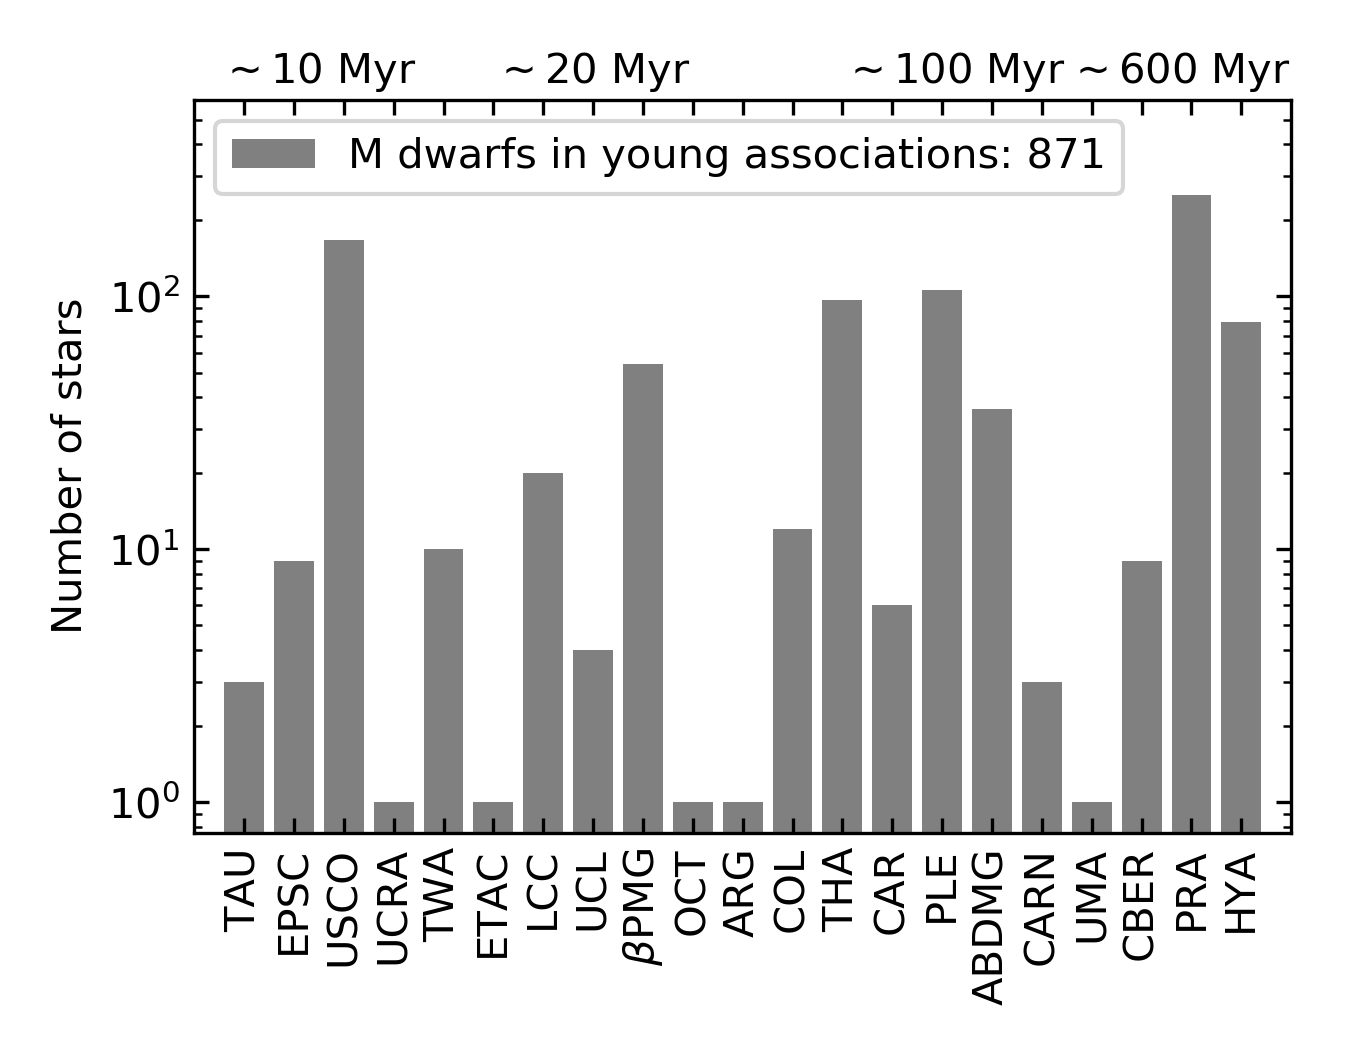
.
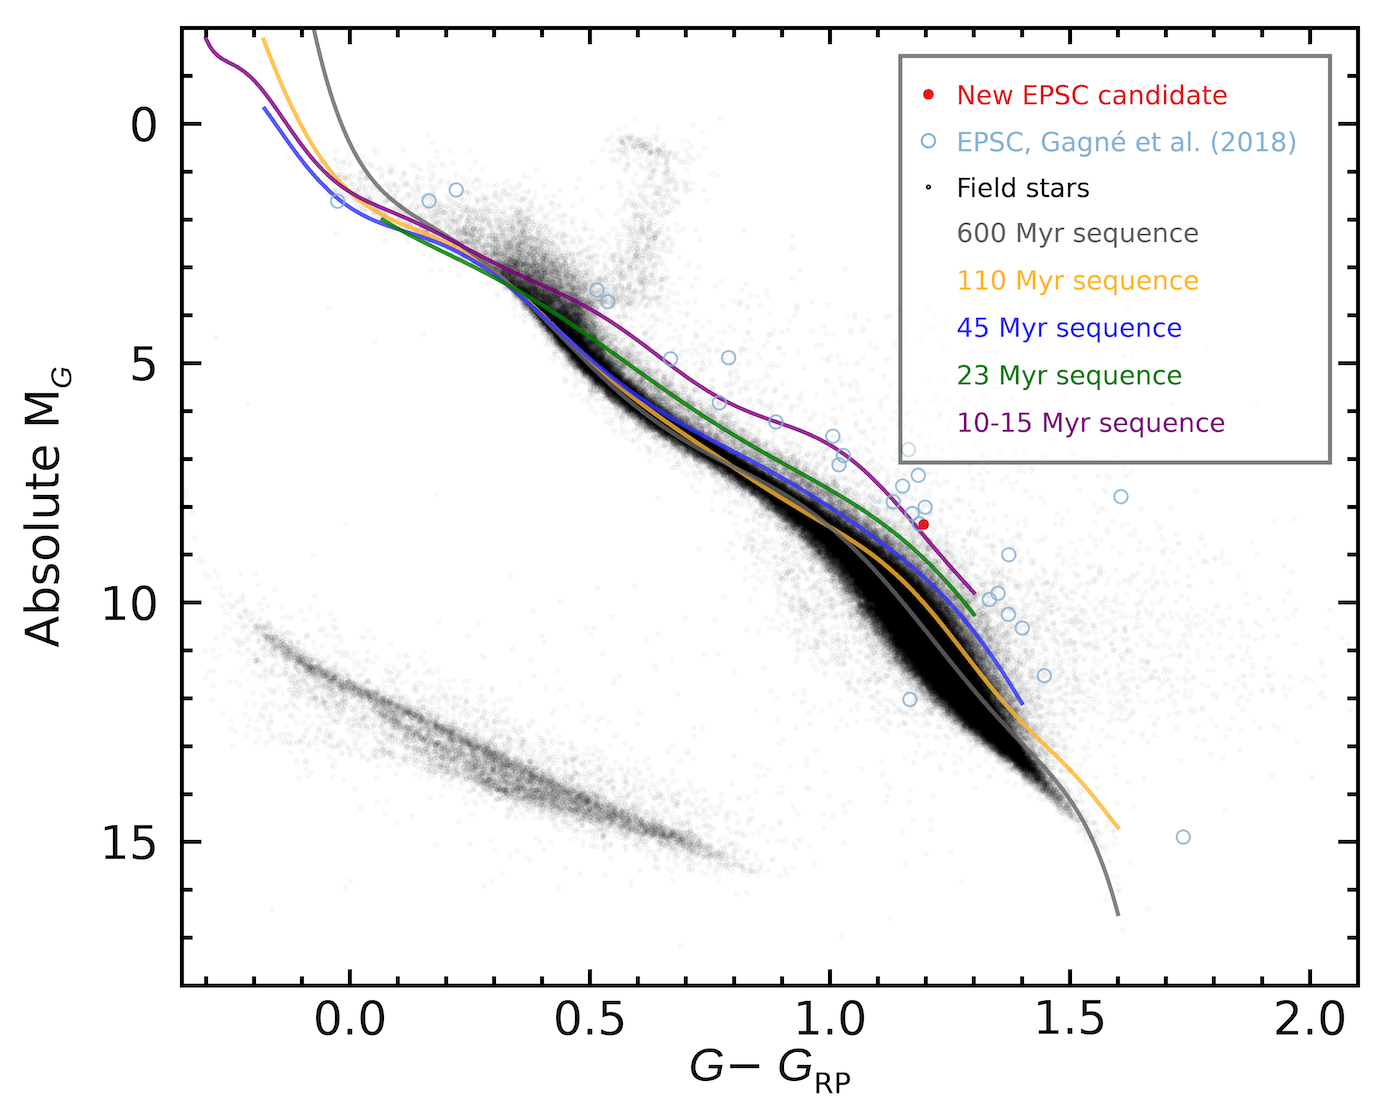
From the young association members in this work, we found that have the same original membership assigned in the literature, had their moving group membership revised and were not identified as members in our literature search. From the “new” candidate members or members that changed their membership, were rejected as members using radial velocities from the literature, and had been previously identified as young association members by studies not collected in this work, i.e. studies where measurements were not utilized (Röser et al., 2011; Galli et al., 2018; Gagné et al., 2018; Gagné & Faherty, 2018; Goldman et al., 2018; Luhman et al., 2018; Rebull et al., 2018). The remaining M dwarfs, are new candidate members of the young associations identified in this study. In particular, 2MASS J12323103-7255068 was called a member of LCC by Goldman et al. (2018), that we revised to be member of EPSC. These stars are summarized in Table 4 and listed in Table 5.
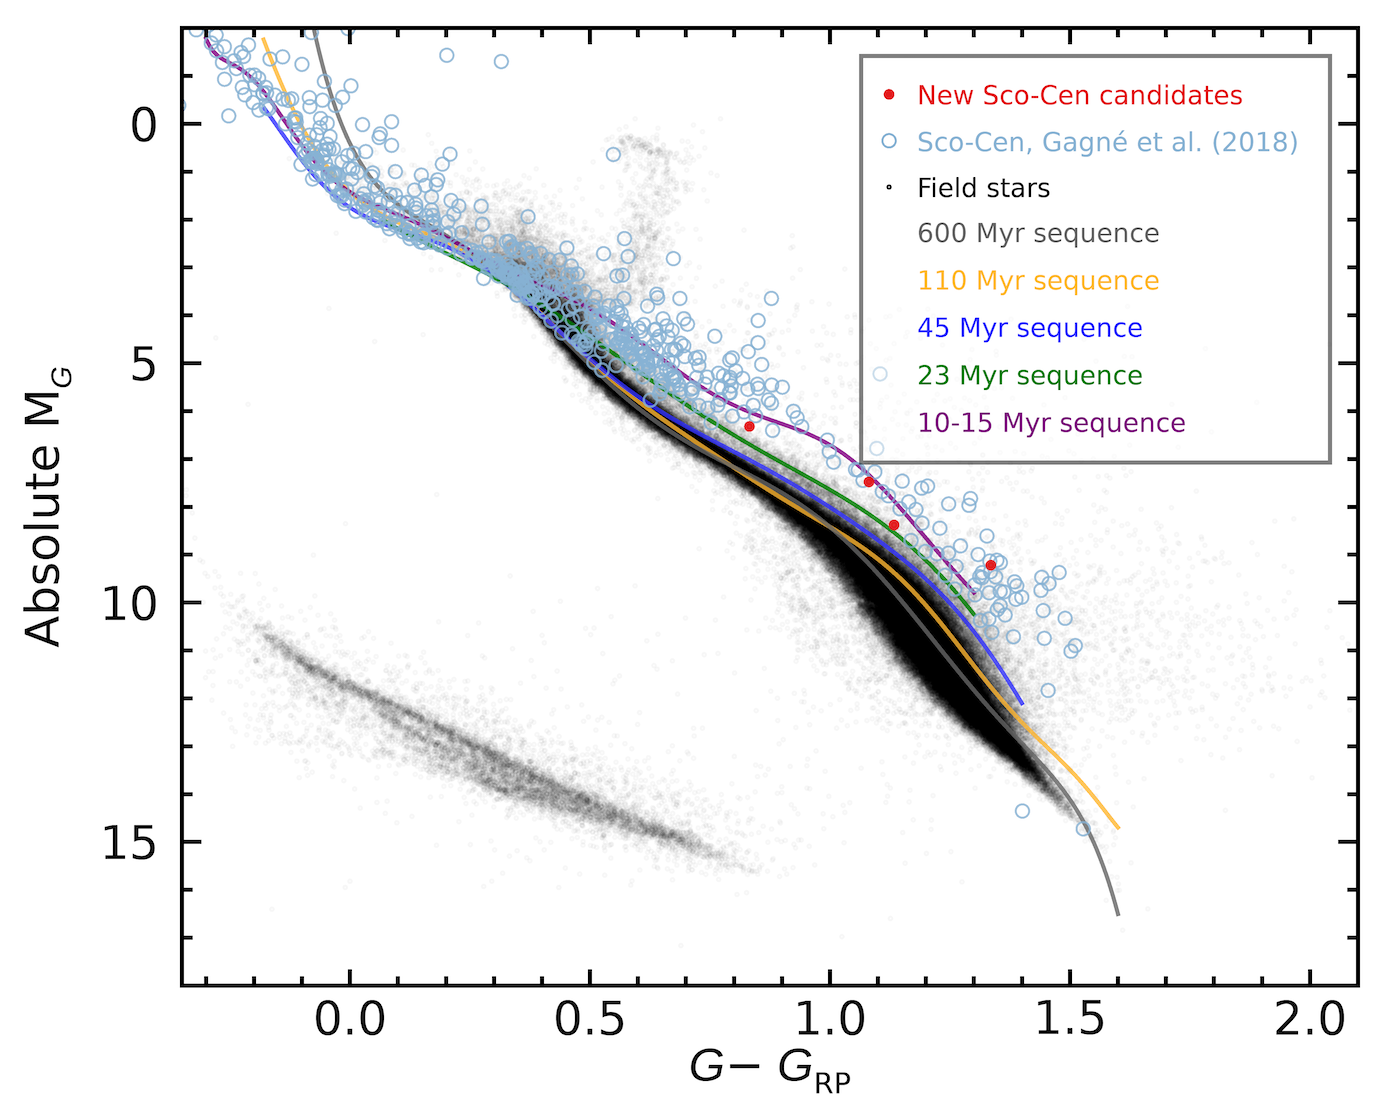
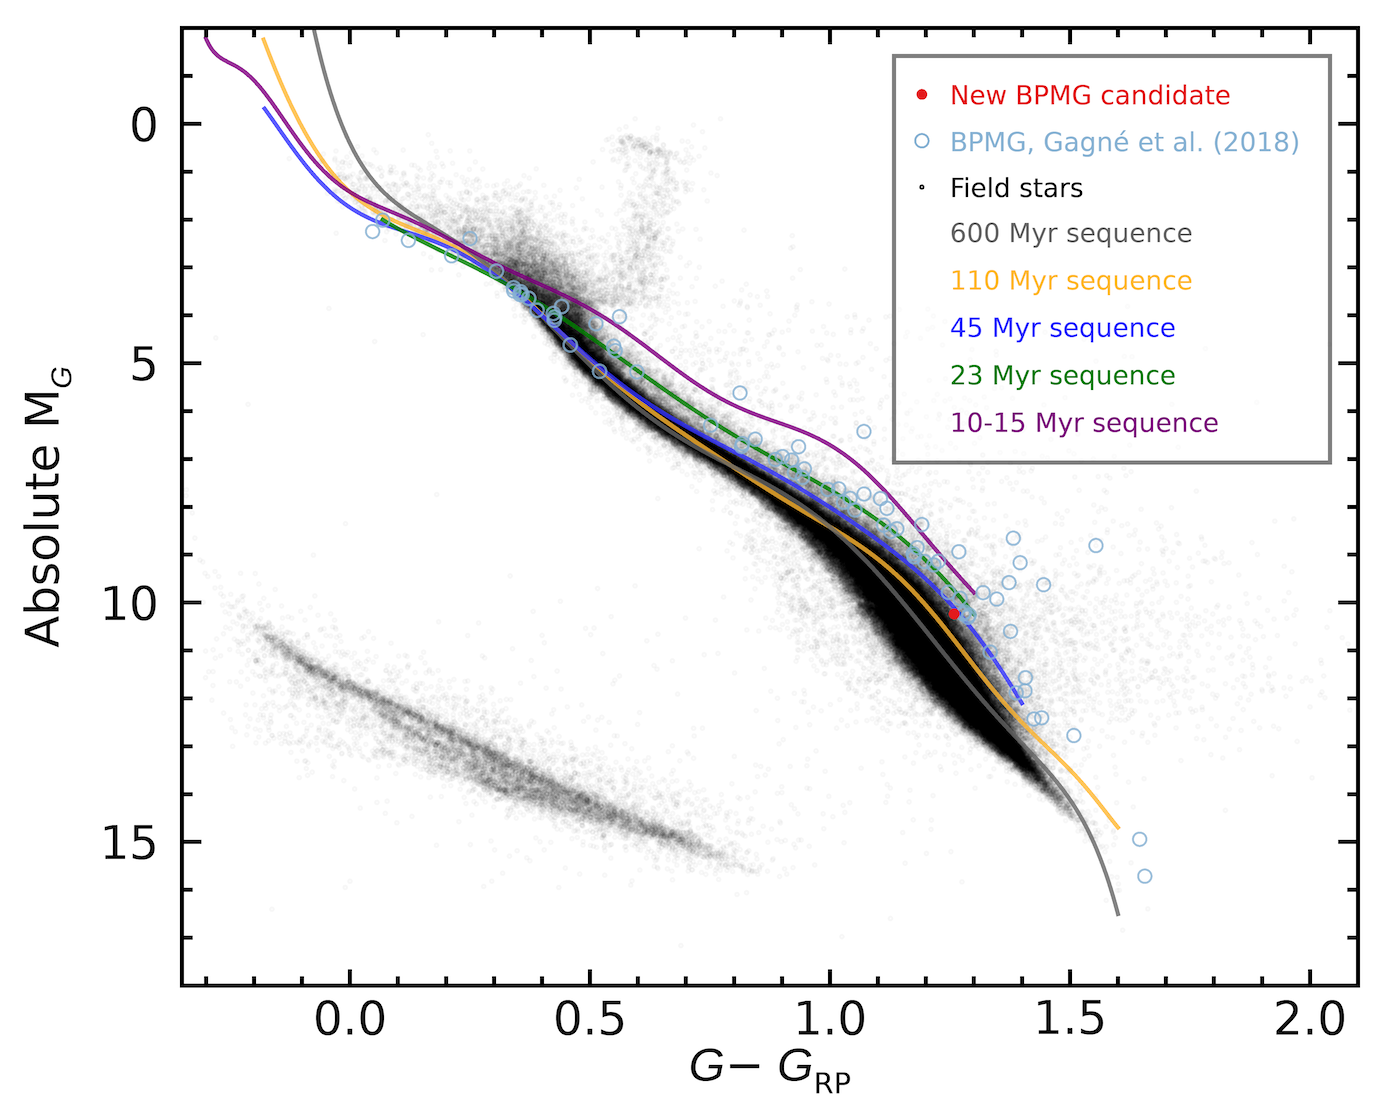
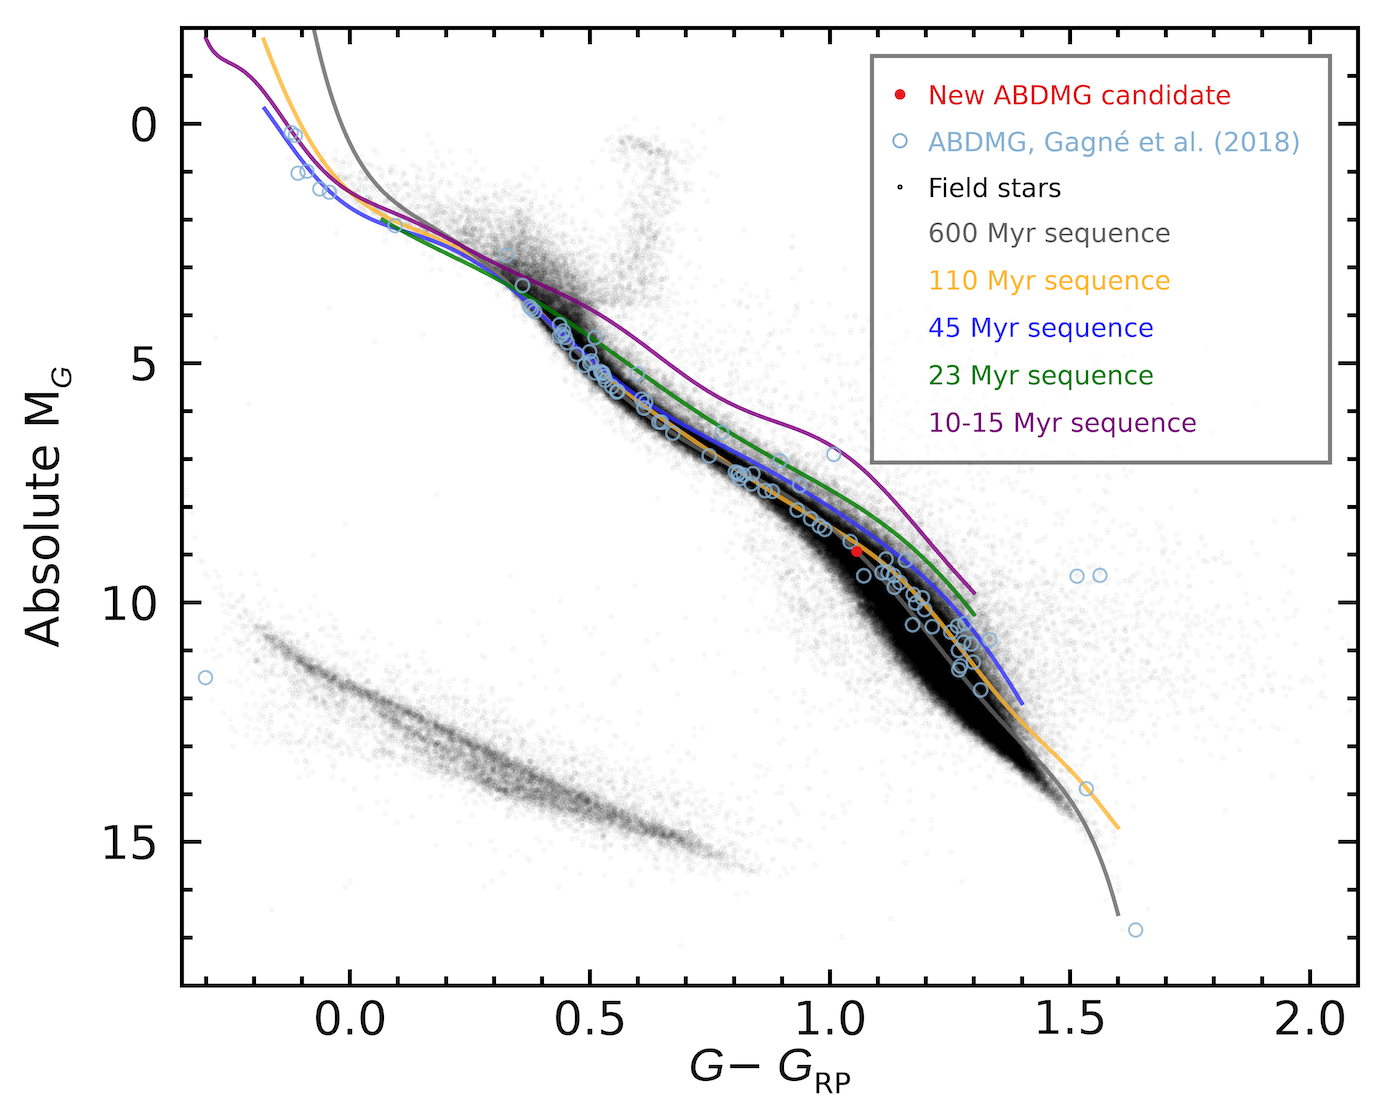
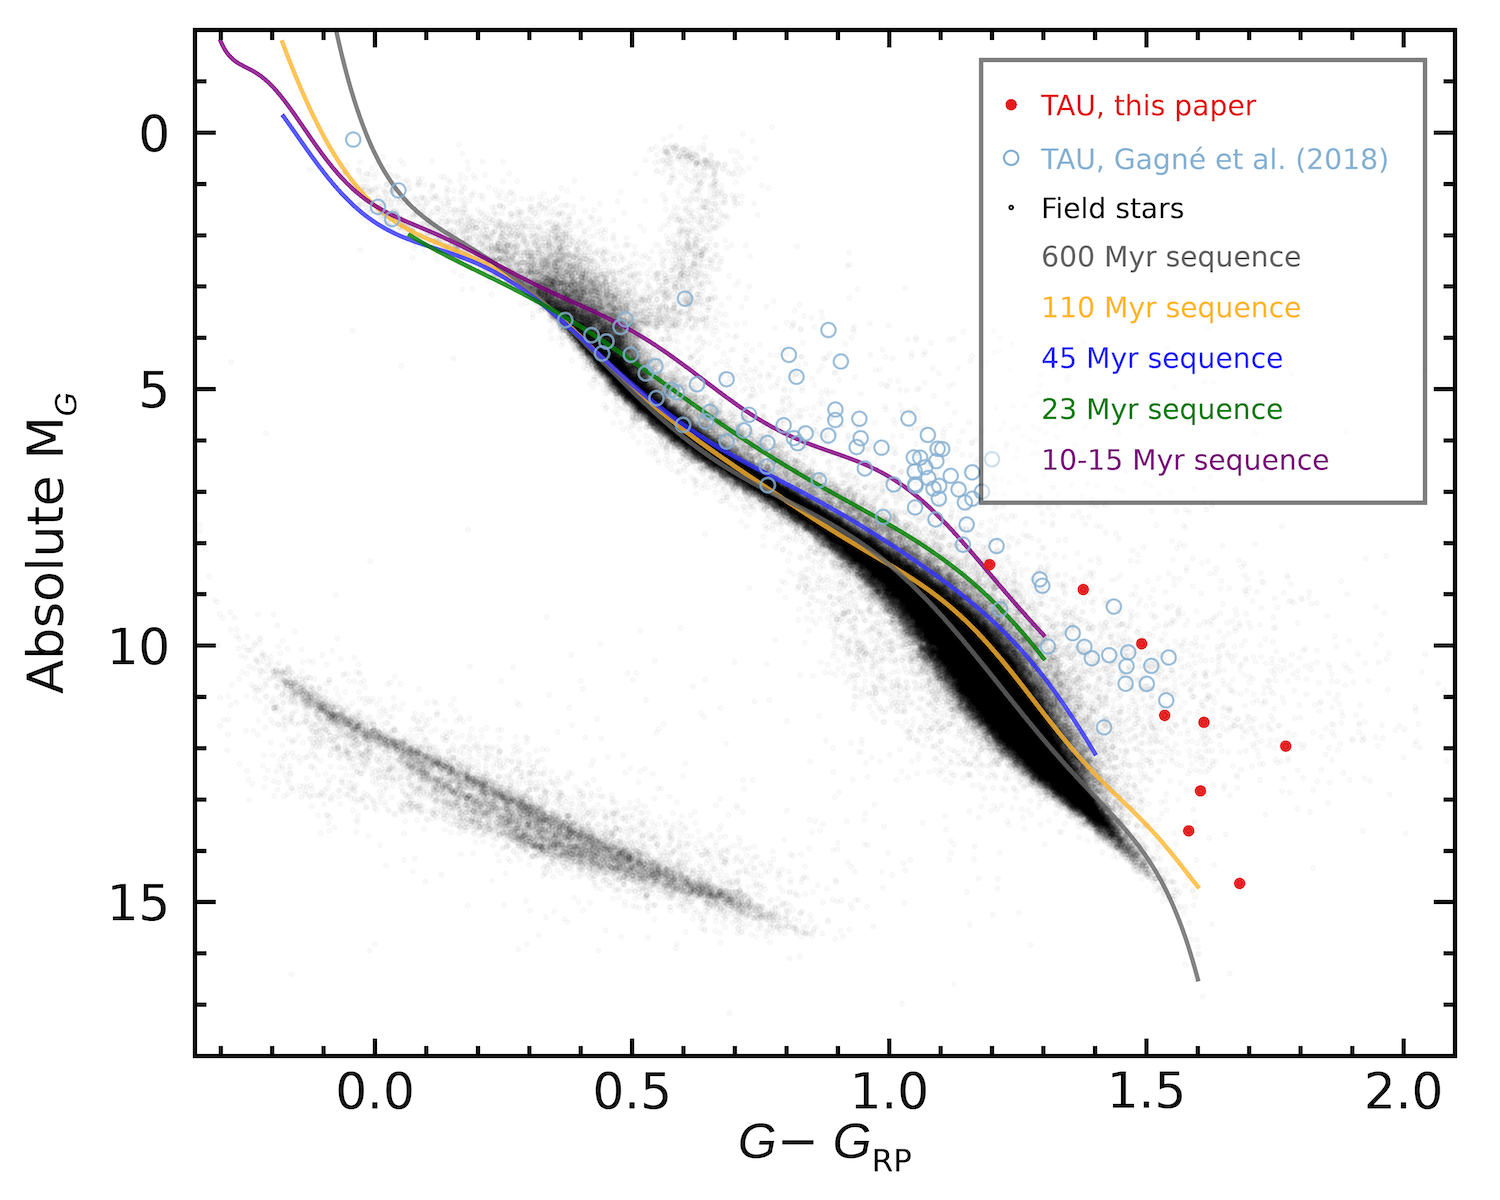
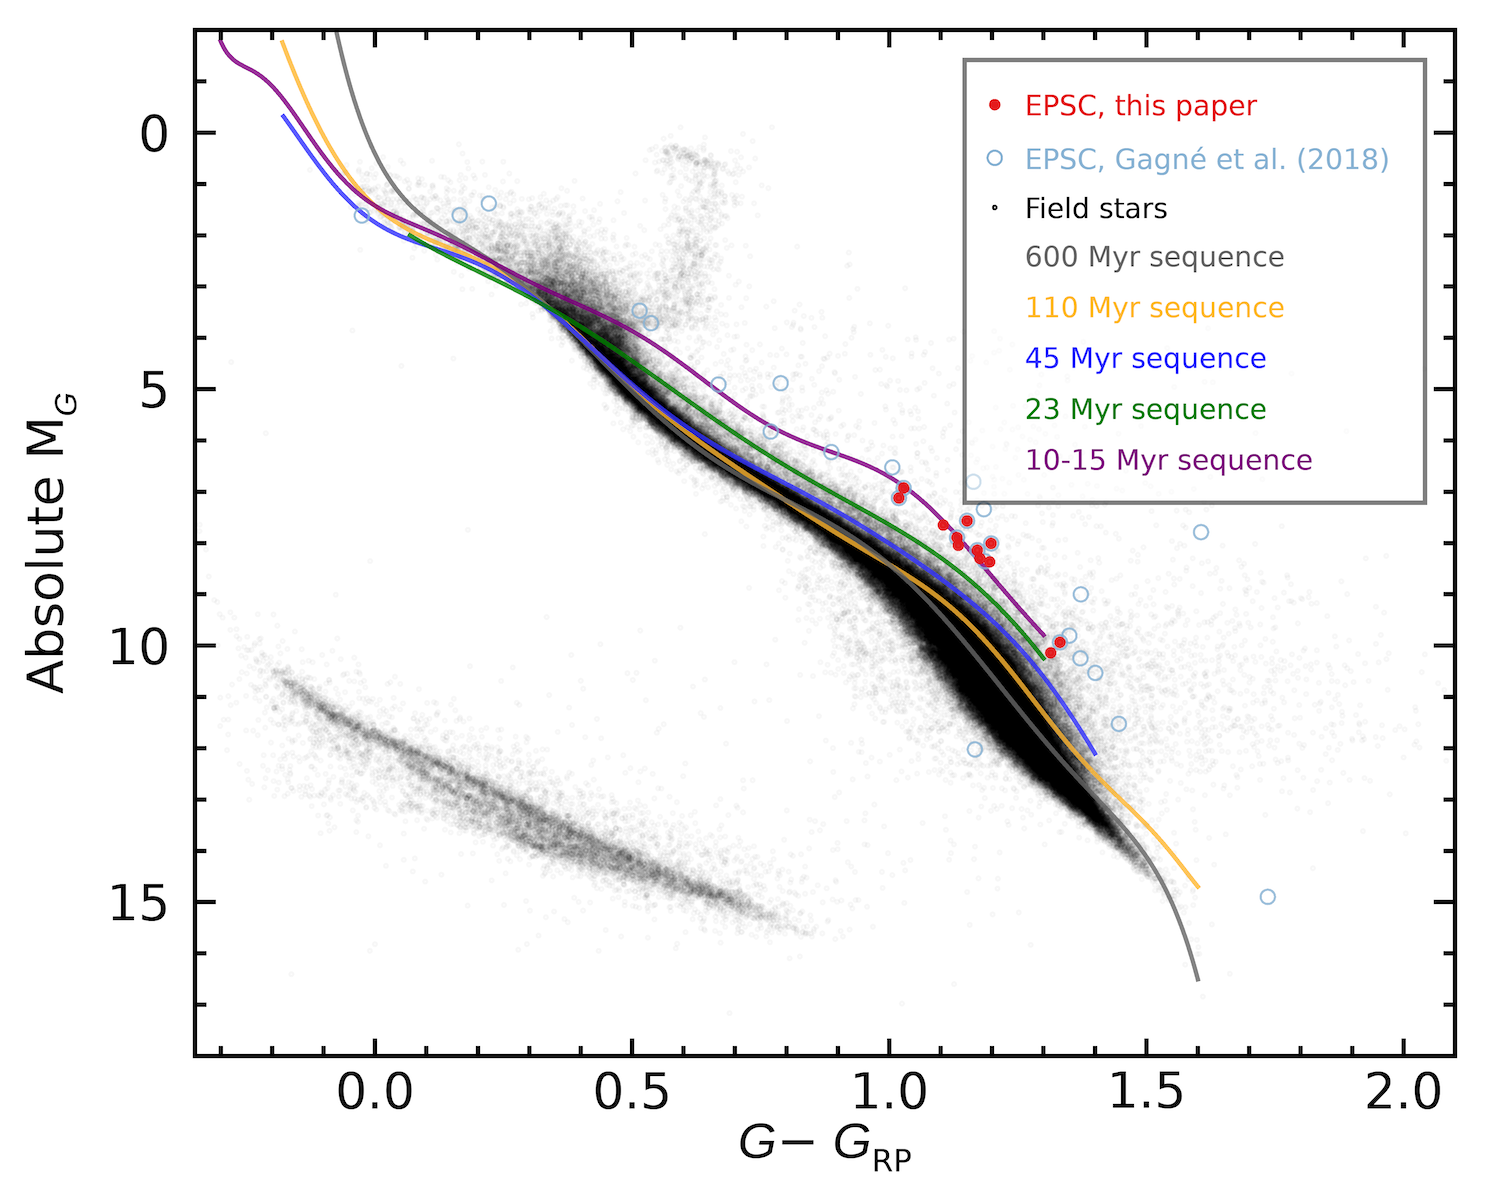
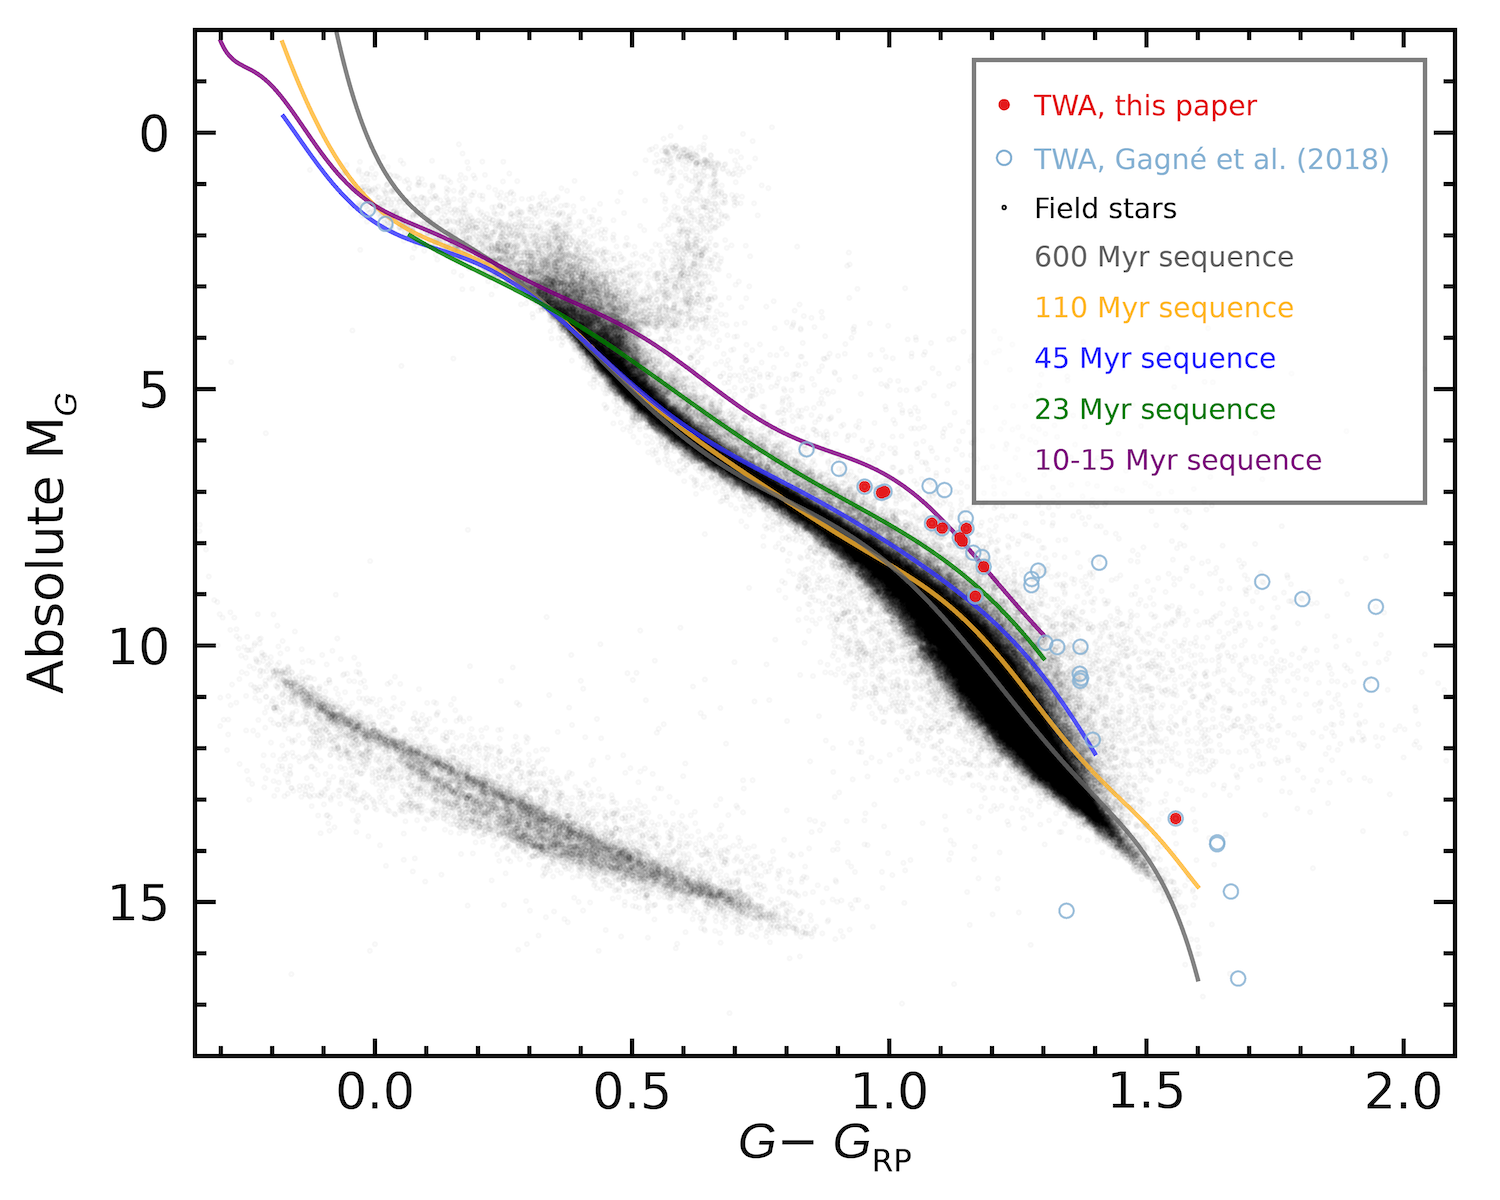
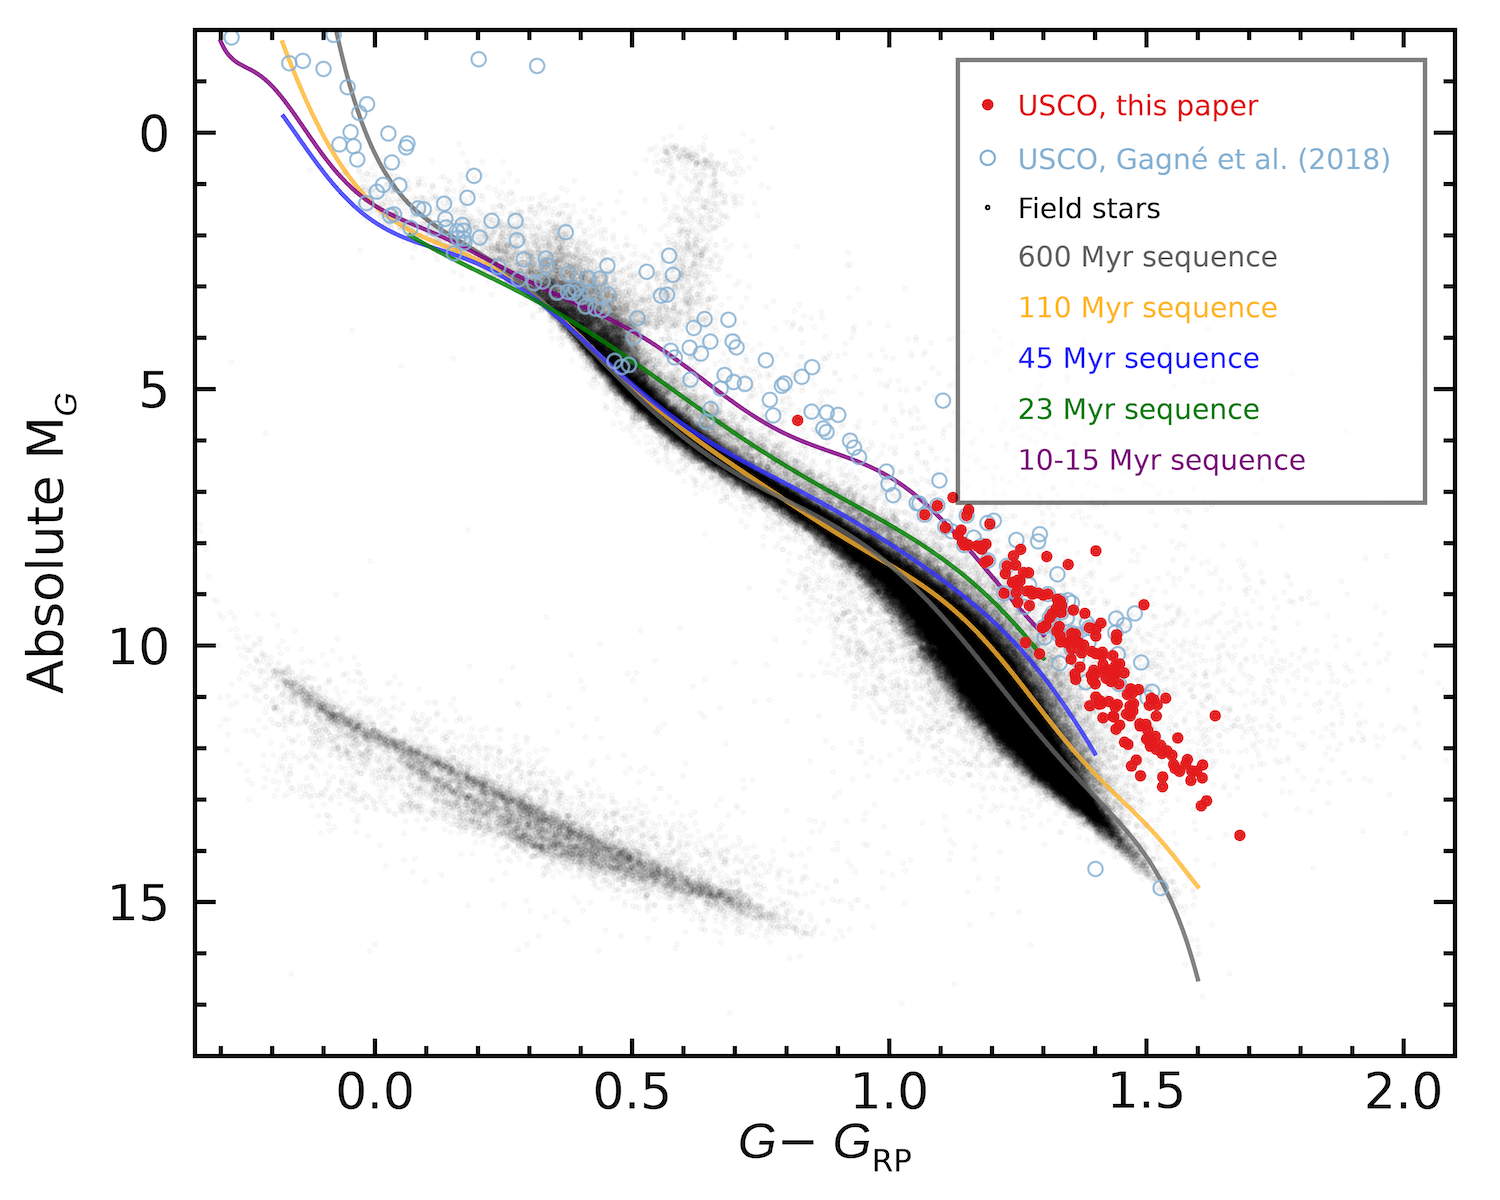
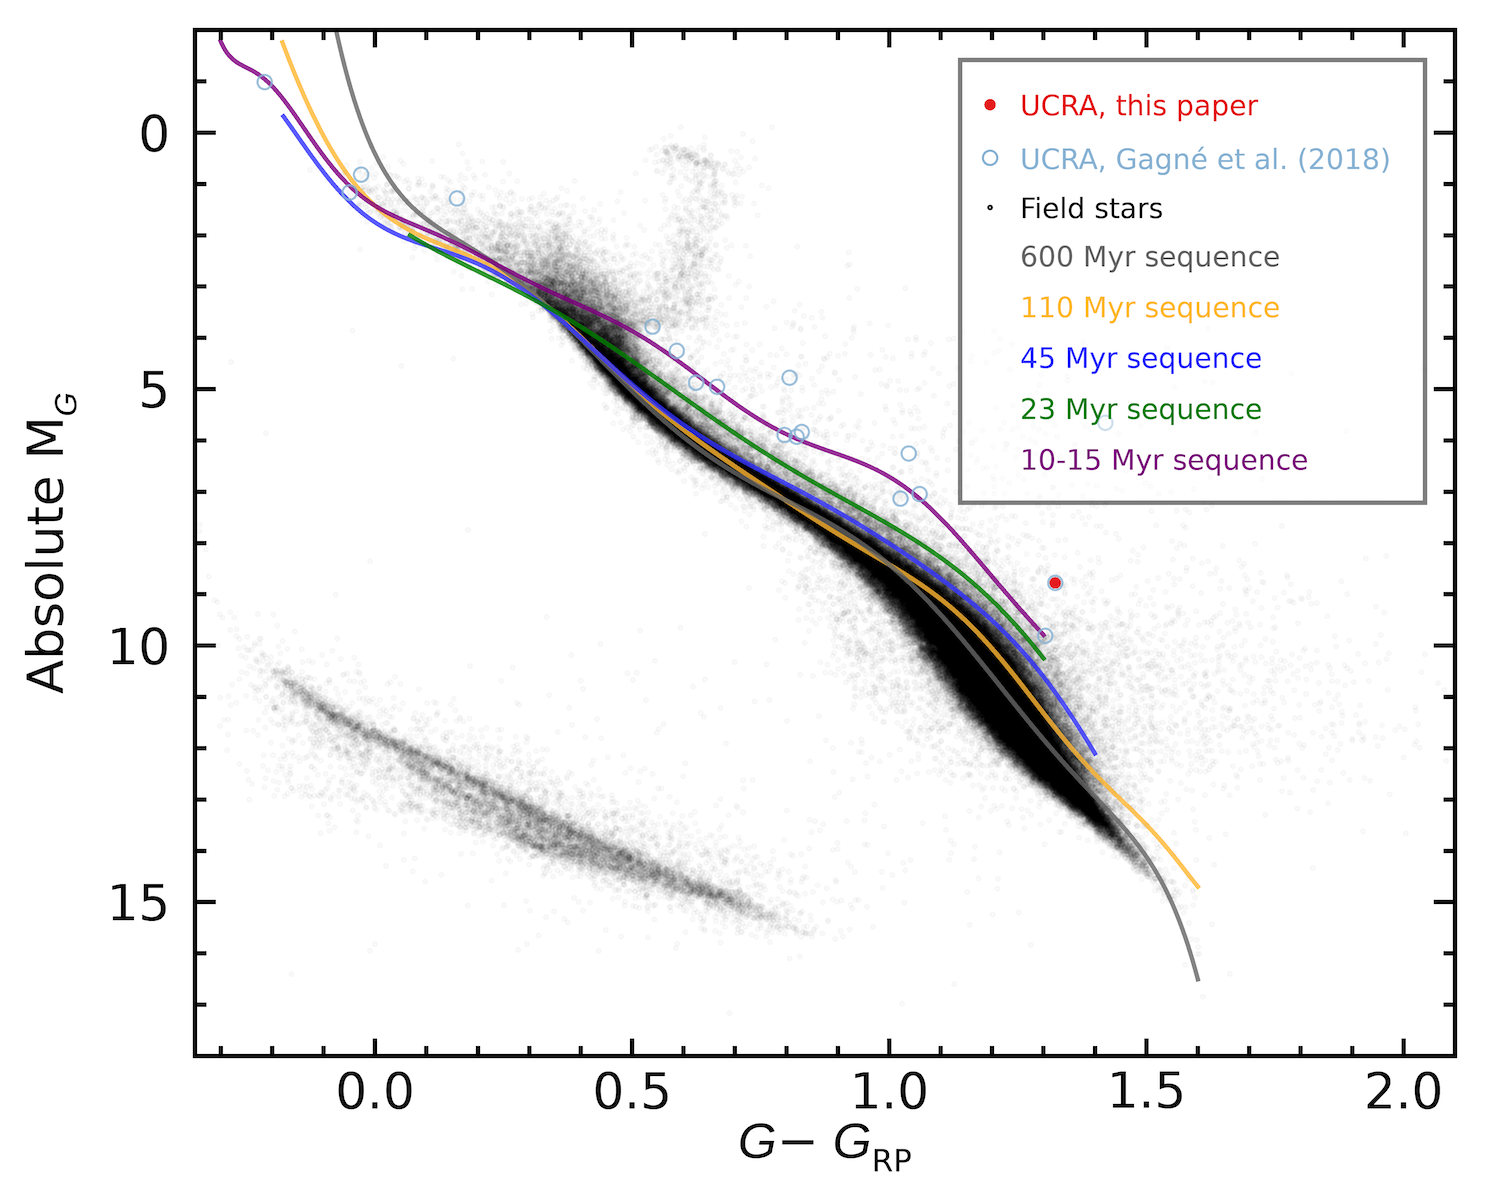
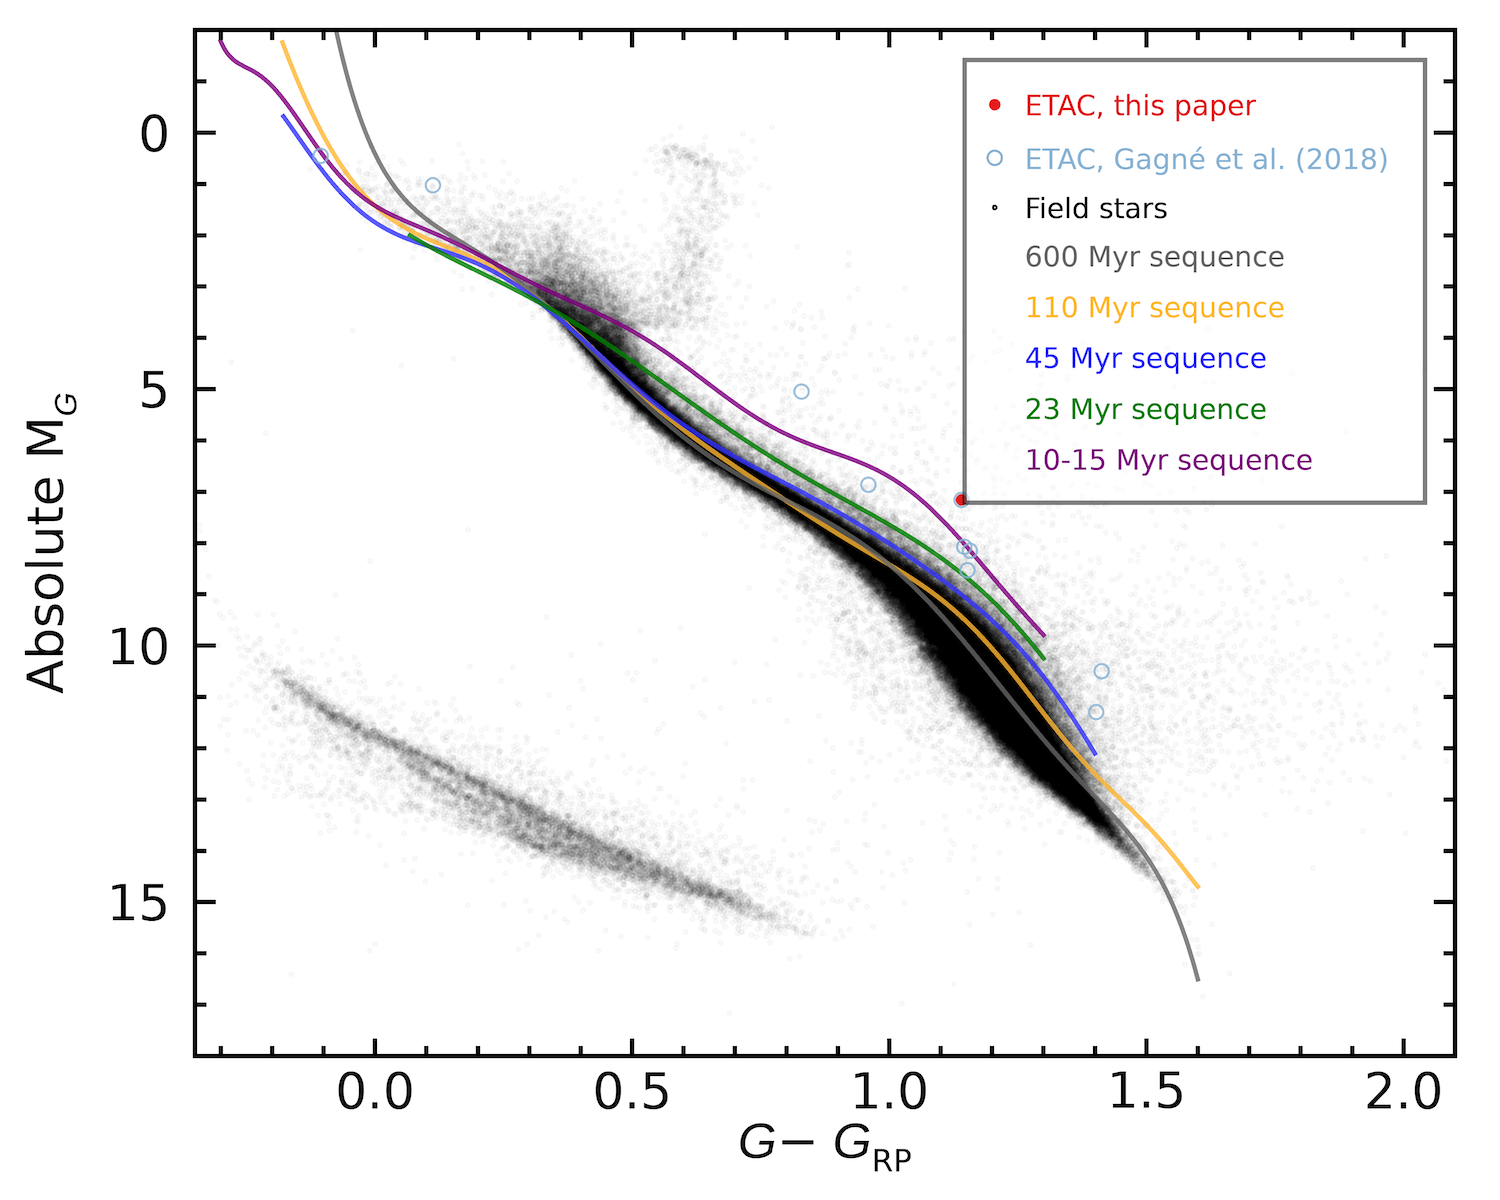
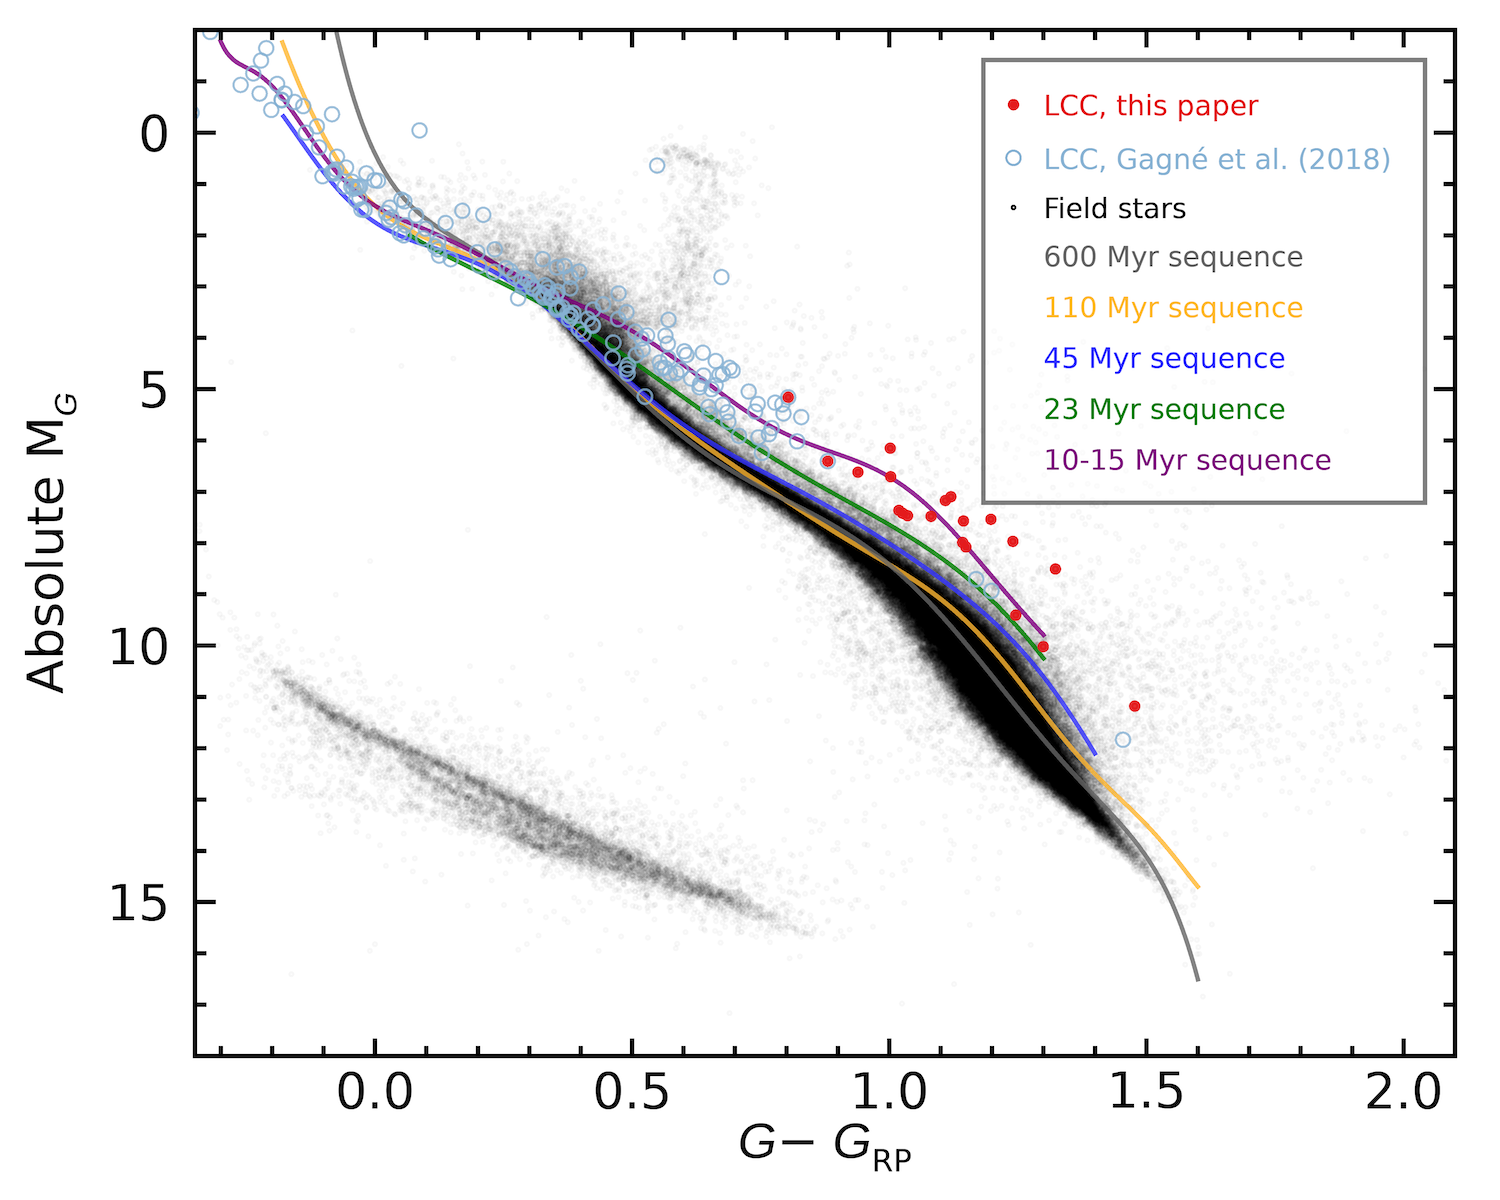
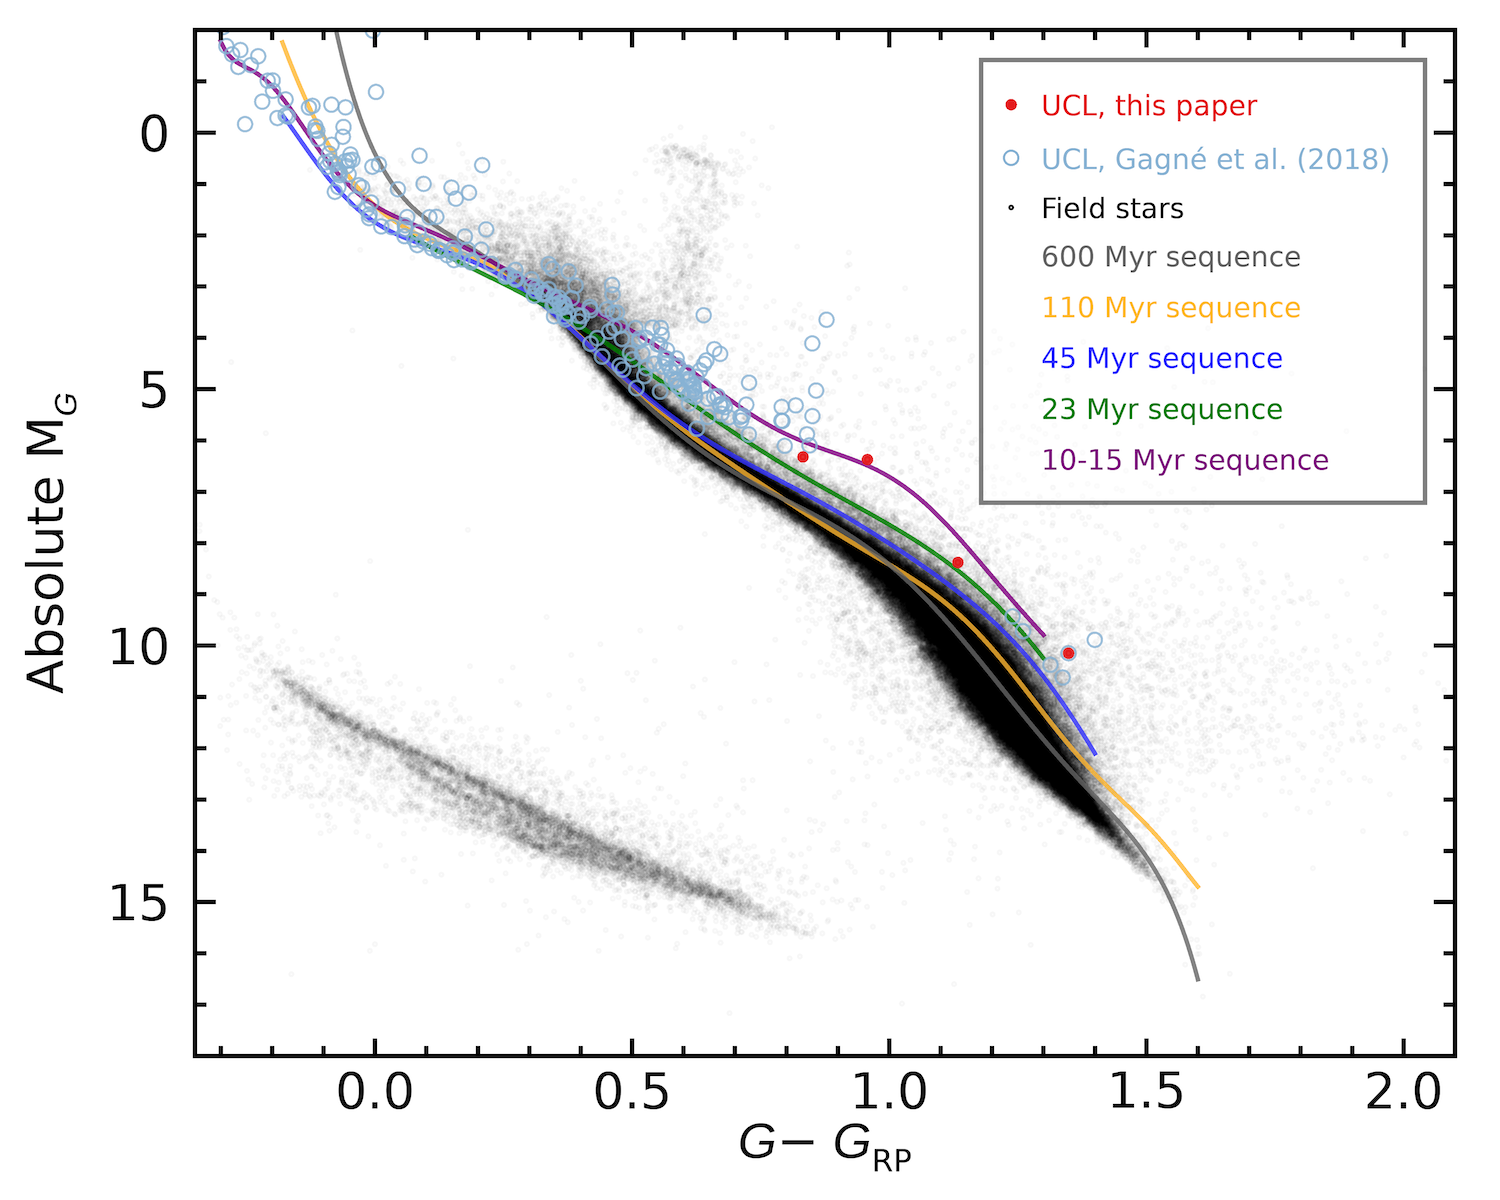
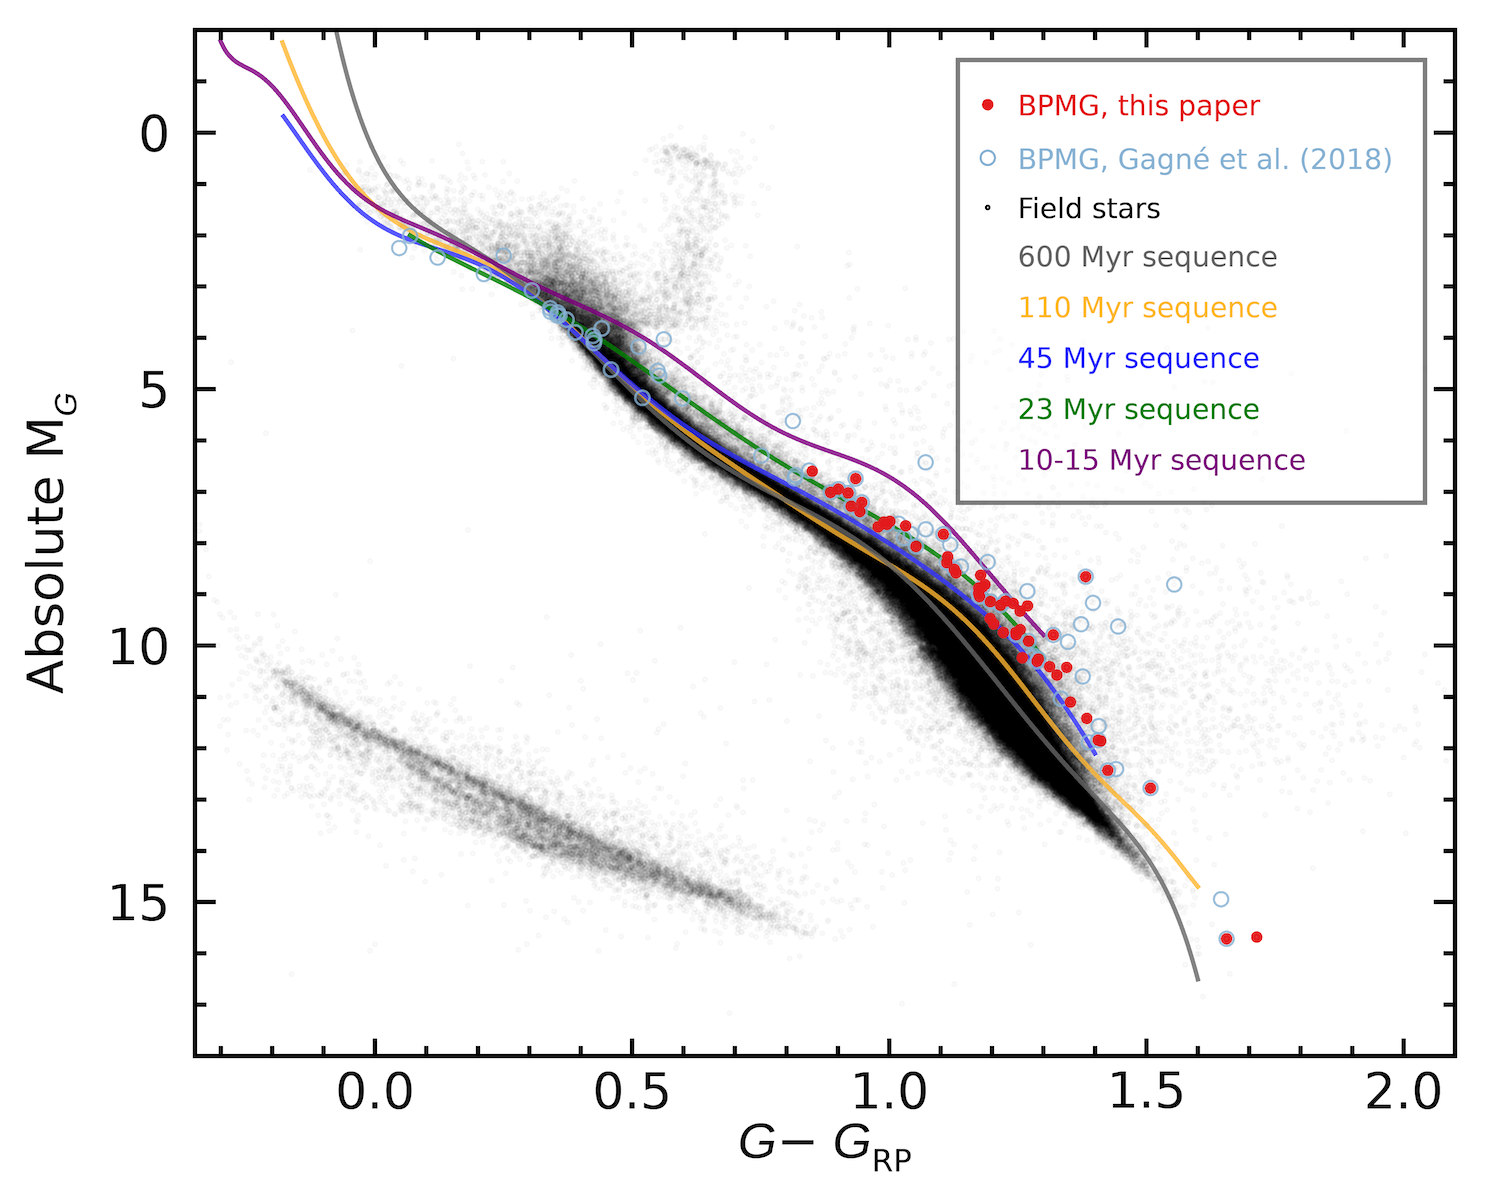
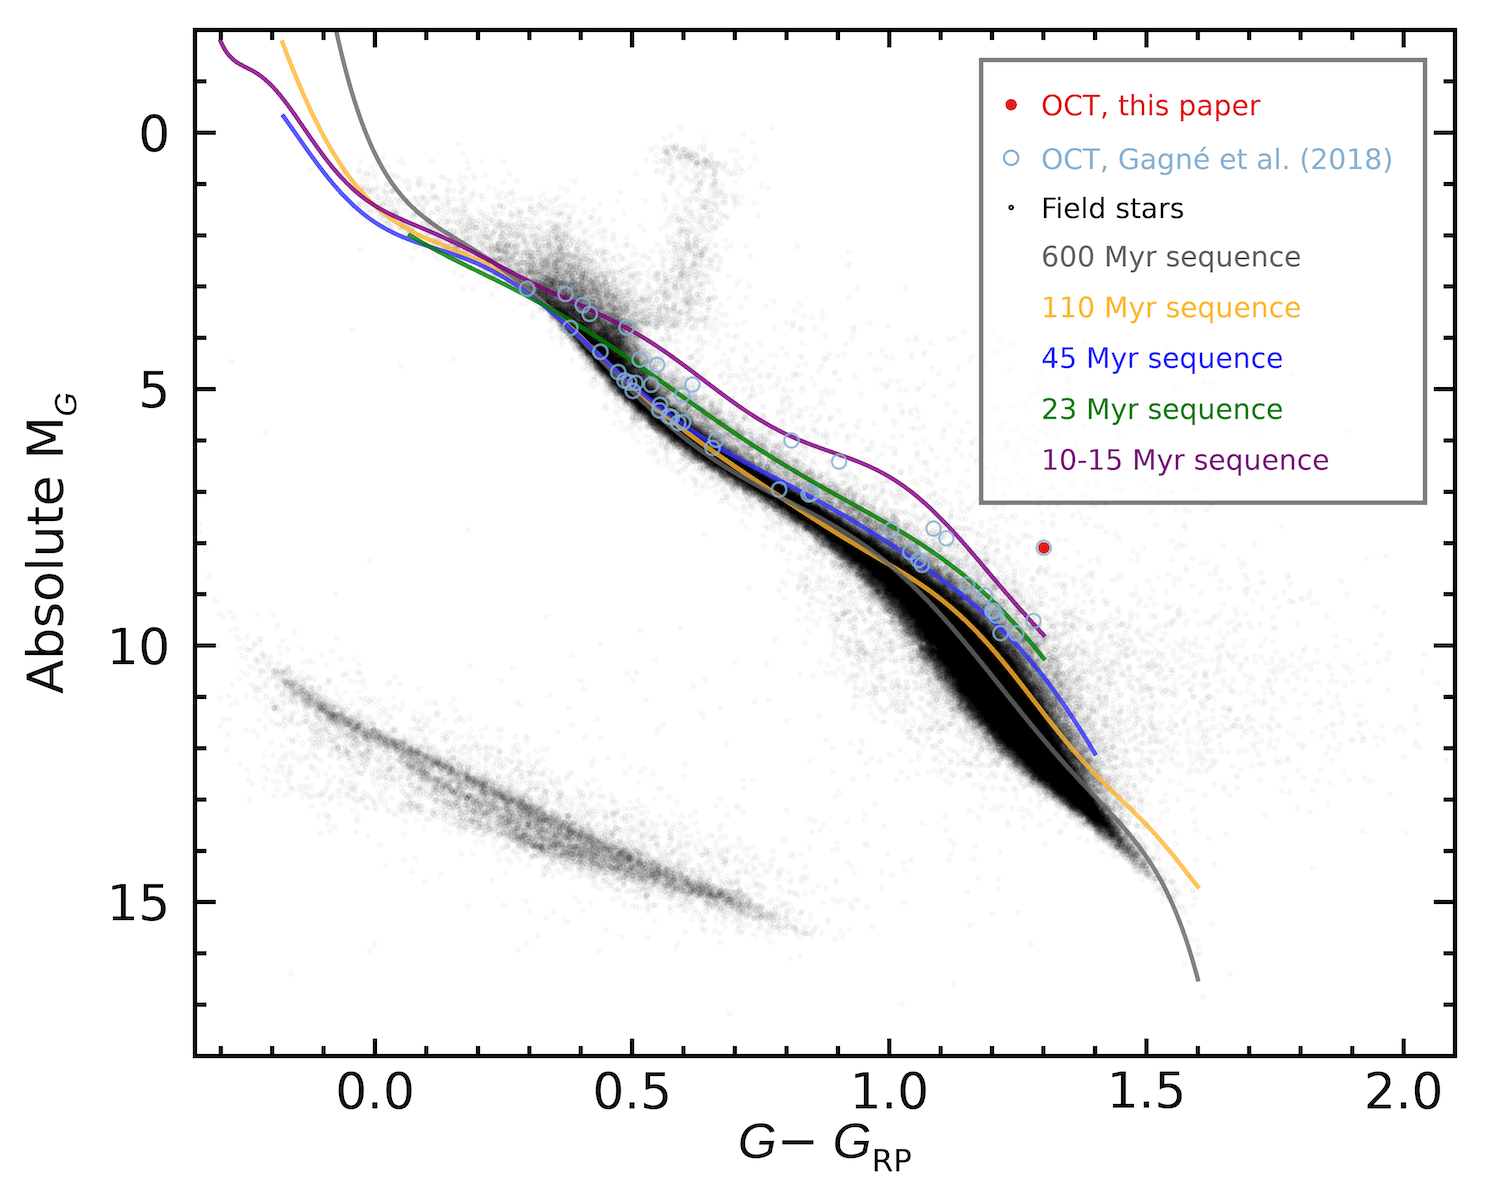
As a further check on the membership probabilities for the new candidate members (or that changed membership group), we compared their position on the Gaia color–magnitude diagram to that of empirical sequences based on bona fide members of young association of different ages (Gagné et al., 2020), and members of each association (Gagné et al., 2018). To compare an individual star’s position on a color–magnitude diagram, it is important to evaluate the extinction due to interstellar dust. We used the extinction maps of STructuring by Inversion of the Local InterStellar Medium (STILISM; Lallement et al., 2014; Capitanio et al., 2017; Lallement et al., 2018)666Available at https://stilism.obspm.fr and the method of Gagné et al. (2020) to calculate de-reddened Gaia DR2 - and -band magnitudes. In summary, a template spectrum of the appropriate spectral type is used to calculate the effect of a typical interstellar dust extinction curve on the full Gaia bandpasses and stellar spectra, a step that is required because the Gaia bandpasses are particularly wide. Interstellar extinction will thus typically move M dwarfs down along isochrones (redder colors and fainter magnitudes) in a Gaia absolute versus color–magnitude diagram, but it will move the high-mass stars horizontally to redder colors, and across distinct isochrones. The position in the color–magnitude diagram of our new candidate members are shown in Figure 2, and are compared to empirical sequences based on bona fide members of young association of different ages (Gagné et al., 2020), and members of Upper Scorpius, Lower Centaurus Crux, Upper Centaurus Lupus, Pictoris, and AB Doradus (Gagné et al., 2018). We performed a visual inspection of all the high-probability members, and found that all the stars lie around the corresponding age sequences and/or within the scatter of the groups. This comparison corroborates their BANYAN membership classifications when taking into account the scatter of the group. However more study will be needed before they are confirmed as members. The summary of the catalogs used to compile all these M dwarf age calibrators with measurements with a probability of membership in a young association are given in Table 2.
| 2MASS Name | SpT | Young association | Source |
|---|---|---|---|
| J06511842-2154268 | M | ABDMG | Riaz et al. (2006) |
| J03273084+2212382 | M | BPMG | Jeffers et al. (2018) |
| J12323103-7255068 | M | EPSC | Riaz et al. (2006) |
| J12554838-5133385 | M | LCC | Riaz et al. (2006) |
| J15264071-6110559 | M | UCL | Riaz et al. (2006) |
| J16544682-3502540 | M | UCL | Riaz et al. (2006) |
| J16040453-2346377 | M | USCO | Slesnick et al. (2006) |
3.2 Identifying and age-dating co-movers with white dwarfs
With BANYAN we can cover age-calibrators up to Myr. For older ages we turned to white dwarfs as chronometers to identify older age calibrators. White dwarf cooling models and model atmospheres are robustly developed to estimate precise and reliable cooling ages and masses (Fontaine et al., 2001). These models can be used to calculate total ages with precision (Fouesneau et al., 2018) and as old as Gyr (Cummings et al., 2018). Therefore using co-moving white dwarf systems as age calibrators greatly expands the range used for grounding the age-activity relation.
The summary of the catalogs where we found M dwarf with a white dwarf co-mover, that served as age calibrators are in Table 2. To find M dwarfs co-moving with white dwarfs we cross-matched our literature search sample with the Gentile Fusillo et al. (2019) white dwarf catalog using a radius. Gentile Fusillo et al. (2019) used a catalog of spectroscopically identified white dwarfs from the Sloan Digital Sky Survey (York et al., 2000) to define cuts to select white dwarfs from the Gaia DR2 color–magnitude diagram. In our study we only used the high-confidence white dwarf candidates () as suggested by Gentile Fusillo et al. (2019).
To find M dwarfs co-moving with a white dwarf we used the sources which had good Gaia data but were rejected as young association members and/or have a high probability () to be field stars according to BANYAN (Section 3.1). We did not look for white dwarfs co-moving with M dwarf members of young associations because the age of the moving group is better constrained than the estimation of the white dwarf age (see Section 1). Additionally, companion searches within young associations based solely on kinematics produces many false positives due to their high probability of chance alignment.
We considered an M-dwarf and a white dwarf to be co-moving if:
-
1.
-
2.
-
3.
-
4.
-
5.
.
The cut on signal-noise ratio for the white dwarf parallax (), is lower than for M dwarfs as suggested by Gentile Fusillo et al. (2019) and the signal-noise ratio for M dwarfs () follows the suggestions by Lindegren et al. (2018). For both components of the proper motion ( and ) and the parallax () we required that the difference between the value for the white dwarf and the M dwarf in a pair to be smaller than , where is the sum of the errors in each parameter. In total we found pairs with this criteria.
To remove false positive companions, we calculated the probability of chance alignment for each M dwarf by re-assigning the proper motions of all the white dwarfs in Gentile Fusillo et al. (2019) and repeating the search for co-movers with the criteria described above, times. We then calculated the probability of chance alignment for each M dwarf as , where is the number of random co-movers and required it to be smaller than to include a pair in our analysis. By adding this cut on probability of chance alignment we remove pairs with several close-by white dwarfs which makes a random match more likely. Out of the pairs found, had a probability of chance alignment higher than .
To calibrate the age-activity relation, wide white dwarf-M dwarf pairs are key to assume both components evolved as single stars without interacting. We estimated the physical separation between the pairs as , where is the separation in AU, is the angular separation and is the distance in parsecs. We found that the closest pair is separated by AU, therefore we can assume the two stars in each pair evolved independently (Dhital et al., 2015; Skinner et al., 2017).
Once we identified the M dwarf-white dwarf pairs, we used the open source Python package available online wdwarfdate (Kiman et al. in prep.)777https://wdwarfdate.readthedocs.io/en/latest/ to estimate their age. wdwarfdate estimates ages of white dwarfs in a Bayesian framework from an effective temperature and a surface gravity. From the total number of pairs, had effective temperature and surface gravity from Gentile Fusillo et al. (2019) and were in the ranges where the models we use are valid. Using this information and cooling models (Bergeron et al., 1995; Fontaine et al., 2001; Holberg & Bergeron, 2006; Kowalski & Saumon, 2006; Bergeron et al., 2011; Tremblay et al., 2011; Blouin et al., 2018)888http://www.astro.umontreal.ca/ bergeron/CoolingModels/ we obtained the cooling ages and the masses of the white dwarfs. With a semi-empirical initial-final mass relation (Cummings et al., 2018) and the masses of the white dwarfs we obtained the masses of the progenitor stars which were used with the MESA Isochrones (Choi et al., 2016; Dotter, 2016; Paxton et al., 2011, 2013, 2015, 2018) to determine the ages of the progenitors. By adding the cooling ages and the ages of the progenitors we obtained the total ages. In this process we assumed that all the white dwarfs are DA, meaning have a hydrogen-dominated atmosphere, which is a good approximation given that most of the white dwarfs in the galaxy are DA. We also assumed solar metallicity and for the progenitors. We refer to Kiman et al. (in prep.) for more details on the calculation of the ages of the white dwarfs co-moving with an M dwarf. The results are shown in Table 6, where we provide the Gaia DR2 source_id for the M dwarf and the white dwarf in each co-moving pair and the estimated total age. Uncertainties are calculated as the percentile minus the median as high error and median minus the percentile as low error.
| Gaia source id | Total age | |
|---|---|---|
| M dwarf | White dwarf | (Gyr) |
4 Measurements and unresolved binaries
4.1 Calculating for the age-calibrators
The activity strength of M dwarfs is usually quantified with the ratio of the luminosity to the bolometric luminosity (Hawley et al., 1996; West et al., 2008b; Schmidt et al., 2015). Using this fractional luminosity removes the dependence on the continuum of the and facilitates comparison of stars of different effective temperatures. was calculated using the “” factor (e.g. Walkowicz et al., 2004), where
The values were empirically calibrated as a function of spectral type using from the Praesepe and Hyades clusters by Douglas et al. (2014). Given that at the ages of these clusters ( Myr) M dwarfs have almost completely converged to the main sequence, we can assume that the values are valid for field dwarfs. However, the values may vary for younger stars and/or stars with different metallicities. In our analysis, we assume that the difference in values for younger stars or different metallicities is not significant. Note that these might be strong assumptions, but to our knowledge there is no better suited calibration of the values available. Also note that we used the convention that means is in emission and means it is in absorption.
To calculate the uncertainty, we generated a normal distribution of with its literature reported error as the standard deviation for each star and calculated the for each value in the normal distribution. We adopted the standard deviation of the final distribution as error for . We did not include errors of the values in the error calculation.
4.2 Unresolved binary identification
We performed a search for known external factors that could increase the magnetic activity of the star, such as close binarity (Morgan et al., 2012; Skinner et al., 2017) and accretion disks outside the White & Basri (2003) criteria (see Section 2.3) between our age-calibrators. We used the empirical sequences based on bona fide members for each young association (Gagné et al., 2020) to search for photometric binaries by identifying M dwarfs in the binary sequence, hence at most brighter in absolute magnitude () for a given color () than the value indicated by the model. We visually inspected each potential binary in the color–magnitude diagram of its respective young associations, and only selected stars that we could confirm they lived in the binary sequence. We only applied this method for stars with because the binary sequence is highly scattered for redder stars. We identified potential binaries which are indicated in the age-calibrators sample in the column potential_binary with a . These stars were removed from the following analysis.
For M dwarfs co-moving with a white dwarf in our sample we performed a literature search looking for known binaries or other factors that could increase the magnetic activity. All the following cases were removed from the following analysis: 2MASS J18393839+1623136 was identified as an unresolved X-ray binary (Haakonsen & Rutledge, 2009) and 2MASS J13545778+0512391 has an accretion disk around it (Theissen & West, 2014).
5 Activity Fraction
We used the young part of the sample of age calibrators, described in the previous section, to calculate the activity fraction as a function of color for M dwarfs younger than Gyr and compared it with previous activity studies of field dwarfs. In this section we describe how we classified M dwarfs as active or inactive, and the resulting activity fraction.
5.1 Fitting the inactive sequence
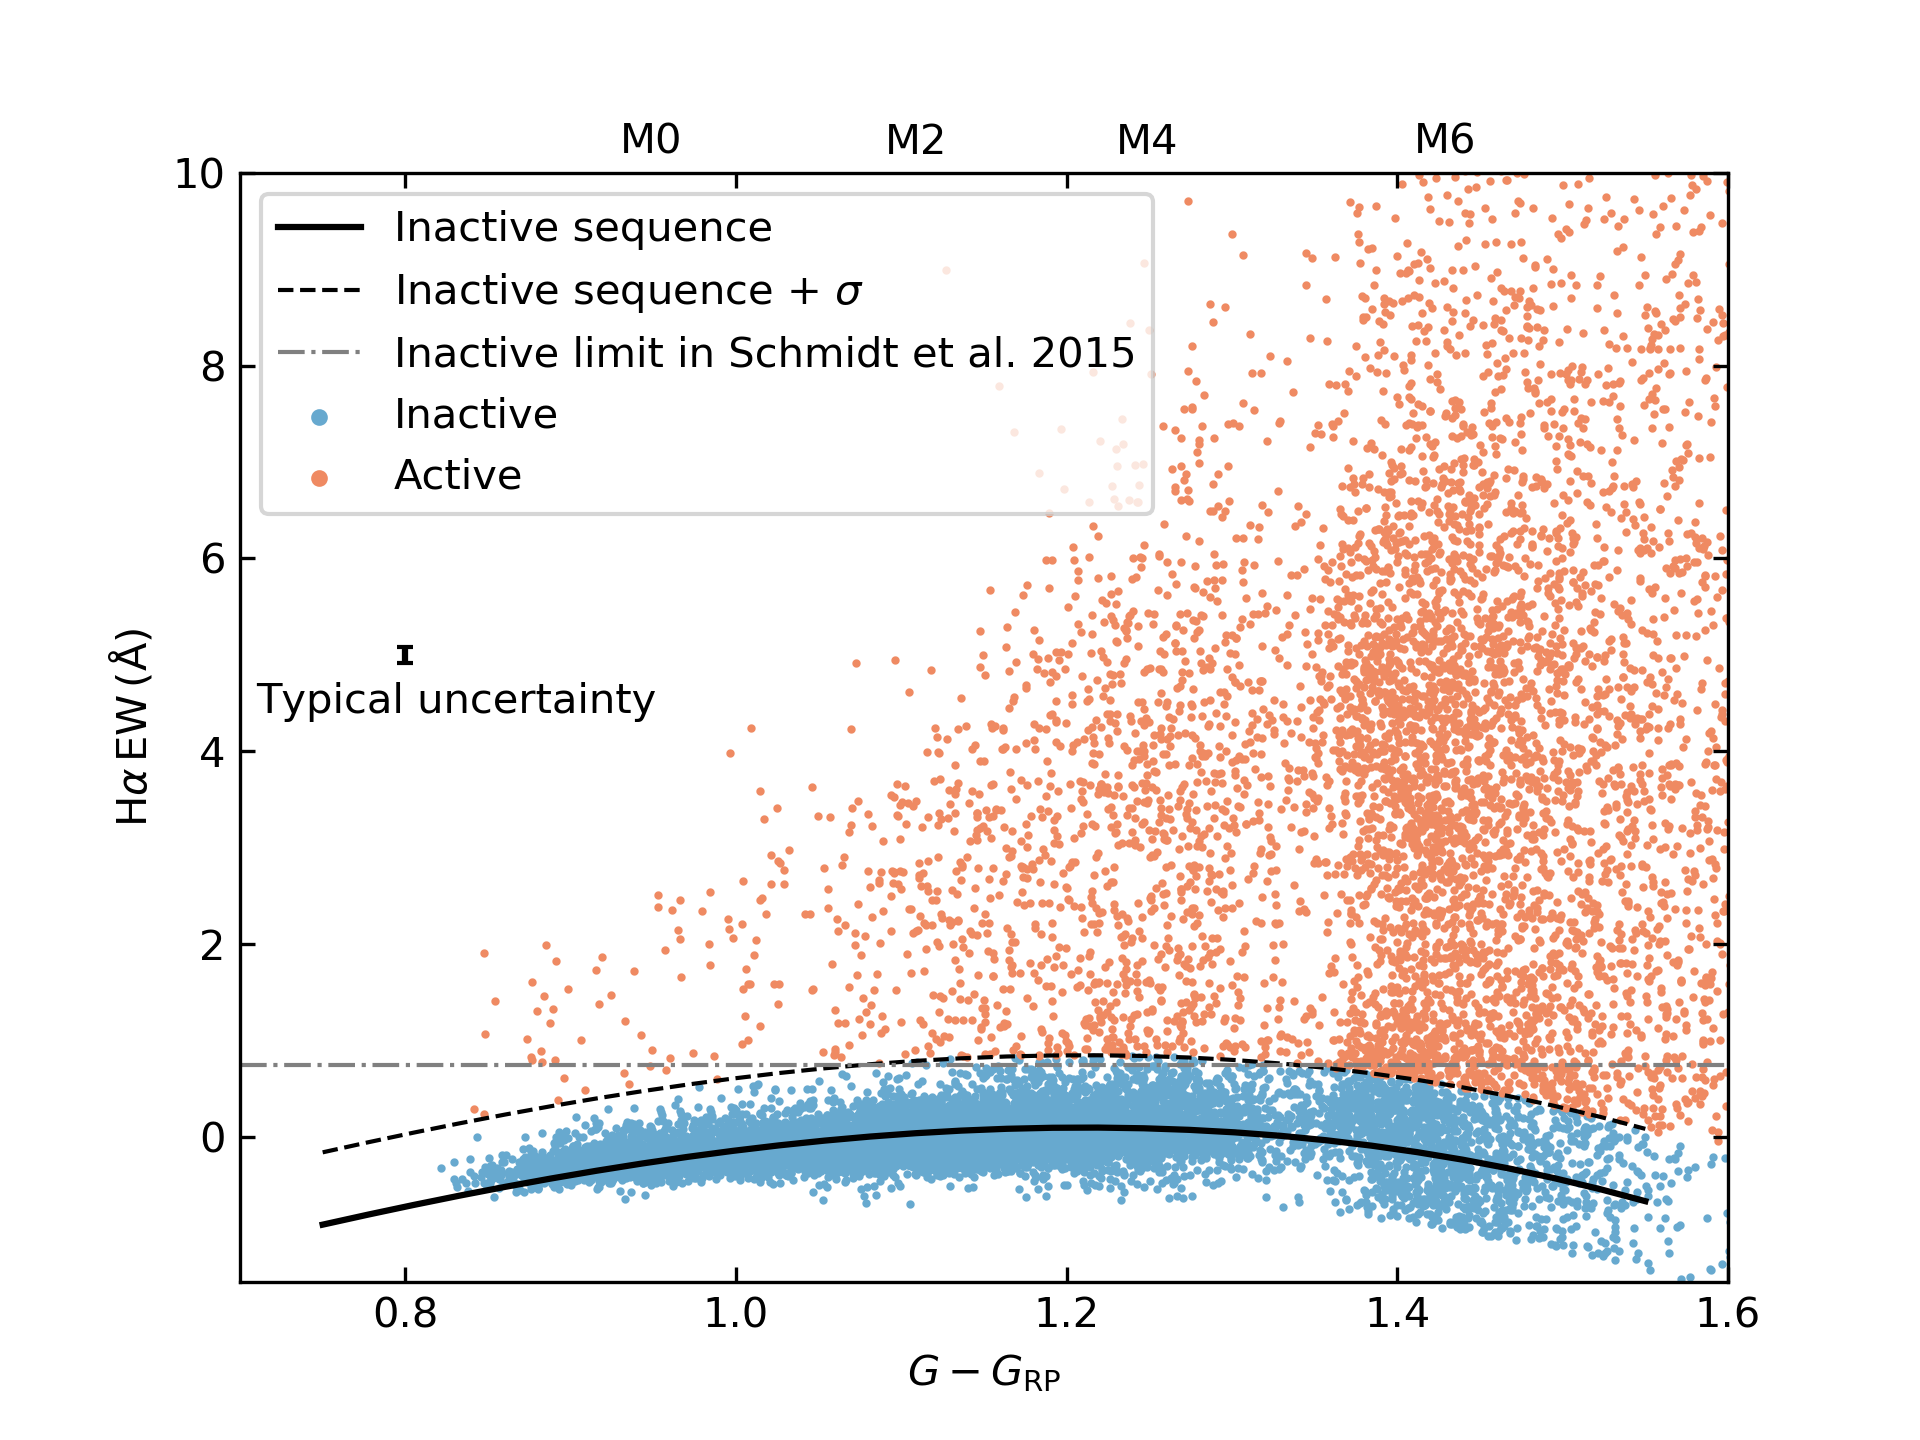
Previous studies have identified what we define as the inactive sequence in this study, in versus mass or effective temperature for M dwarfs (e.g. Stauffer & Hartmann, 1986; López-Santiago et al., 2010; Newton et al., 2017; Fang et al., 2018). This inactive sequence is defined as the lower boundary of the versus mass, color or spectral type relation, and it shows an increase in from higher to lower masses (or redder colors). This increase in is related to a decrease in the absorption from the photosphere, meaning a decrease in photospheric luminosity (Stauffer & Hartmann, 1986) and not to an increase in emission. We used Kiman et al. (2019) objects to establish the inactive sequence for versus and with it, the active or inactive category. To establish the inactive sequence following Newton et al. (2017), we did iterations of a third degree polynomial fit to stars with . In each iteration we rejected the stars that had an higher than the best fit. We defined the activity boundary as the best fit to the inactive sequence plus a small increment, :
| (1) |
where and it was added to make our classification in active and inactive compatible with previous definitions (West et al., 2011; Schmidt et al., 2015). This limit is valid in the range (). We considered all the stars which have an above the boundary to be active. All other objects were considered inactive. We show the activity boundary, the best fit to the inactive sequence and our classification as active and inactive in Figure 3. As a comparison, we show the limit for active and inactive used by Schmidt et al. (2015). Among other cuts related to signal to noise, Schmidt et al. (2015) considered inactive stars as those with . Their limit agrees with our definition, except for a small deviation for spectral types and .
.
5.2 Calculating active fraction as a function of age
Using the definition of active and inactive described above, we calculated the active fraction in bins of the red Gaia DR2 color and studied its dependence with age. We used the histogram function available in the Python package numpy (Oliphant, 2006; Van Der Walt et al., 2011) to define the bins in color, because it is optimized for non-normal data. We repeated this calculation for the following age-bins: Myr, Myr, Myr, Myr and Myr. The results are shown in Figure 4, where we included a reference to the mean spectral type (SpT) for each color at the top of the figure. We also included the activity fraction for the sample from Kiman et al. (2019) in black, which are assumed to be primarily field stars, and it reproduces the results from previous studies (West et al., 2004, 2011; Schmidt et al., 2015). The errors for each point were calculated based on a binomial distribution as
where and are the active fraction and uncertainty, and is the number of stars in the bin.
By analysing the active fraction as a function of age in Figure 4, we show that the active fraction of M dwarfs evolves with age. There is a clear difference in the evolution of the active fraction between early () and mid-M dwarfs (). While the active fraction for early M dwarfs decreases from to almost between Myr and Myr, for mid-M dwarfs the active fraction stays close to . This difference between early and mid-M dwarfs agrees with previous studies which showed that later-type M dwarfs stay active longer than earlier-type stars (West et al., 2004, 2011; Schmidt et al., 2015).
The active fraction for early-type M dwarfs in Figure 4 decreases progressively from Myr to field age dwarfs, while for mid spectral types () it seems to decrease more abruptly from Myr (blue line) to field stars (black line). Note that the field active fraction is representing a distribution of different ages. Therefore the difference between the bins Myr and field for mid-type M dwarfs could be indicating that late types stay active longer and we do not have enough age resolution to distinguish the progressive decrease of the active fraction with age. This discrepancy also could be indicating that the magnetic activity of mid-type M dwarfs decreases more abruptly than for early-types.
Both Myr and Myr age bins (the two blue lines) are statistically equivalent and present a transition period centered at where the active fraction increases from to , for . Significantly, this transition is completed close to spectral type , the limit between partially and fully convective M dwarfs (Chabrier & Baraffe, 1997). The shape of this transition for both bins could be affected by other physical effects which increase the magnetic activity of a star. For example, the active fraction could increase because of close companions of the stars which increase their magnetic activity (e.g., Kraus et al., 2011; Morgan et al., 2012; Dhital et al., 2015; Skinner et al., 2017). For the colors the fraction of active stars is , which is close to the multiplicity fraction of M dwarfs of at separations AU found by Winters et al. (2019). We searched the literature for references of binarity and we did not find known binaries for these stars. Also, our sample is not complete, so we cannot compare directly to the results in Winters et al. (2019). Follow up observations are necessary to distinguish if these stars are still active at Myr, or they have an unresolved binary keeping them active.

.
6 Updated age-activity relation for active M dwarfs
6.1 Characterizing versus age
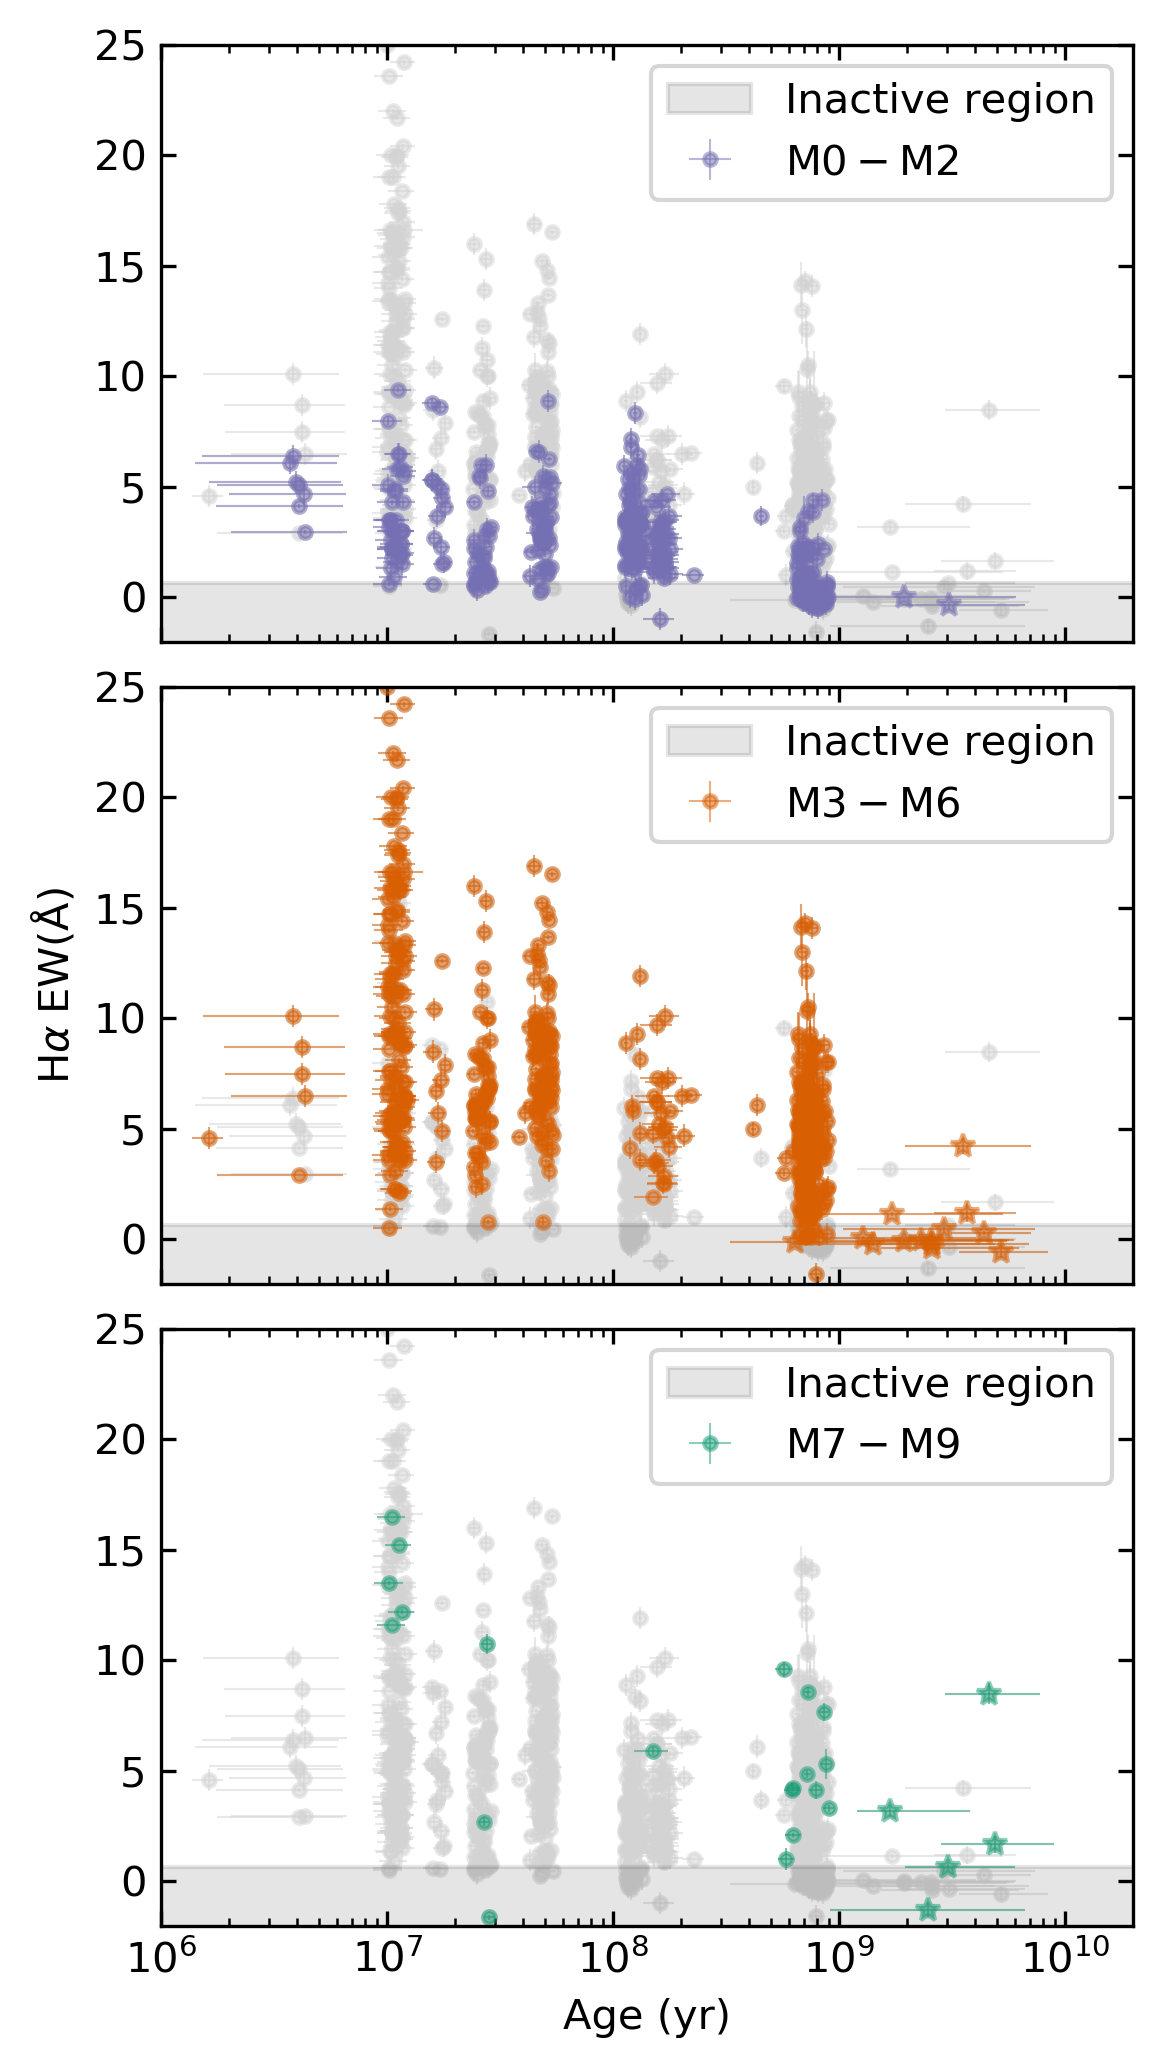
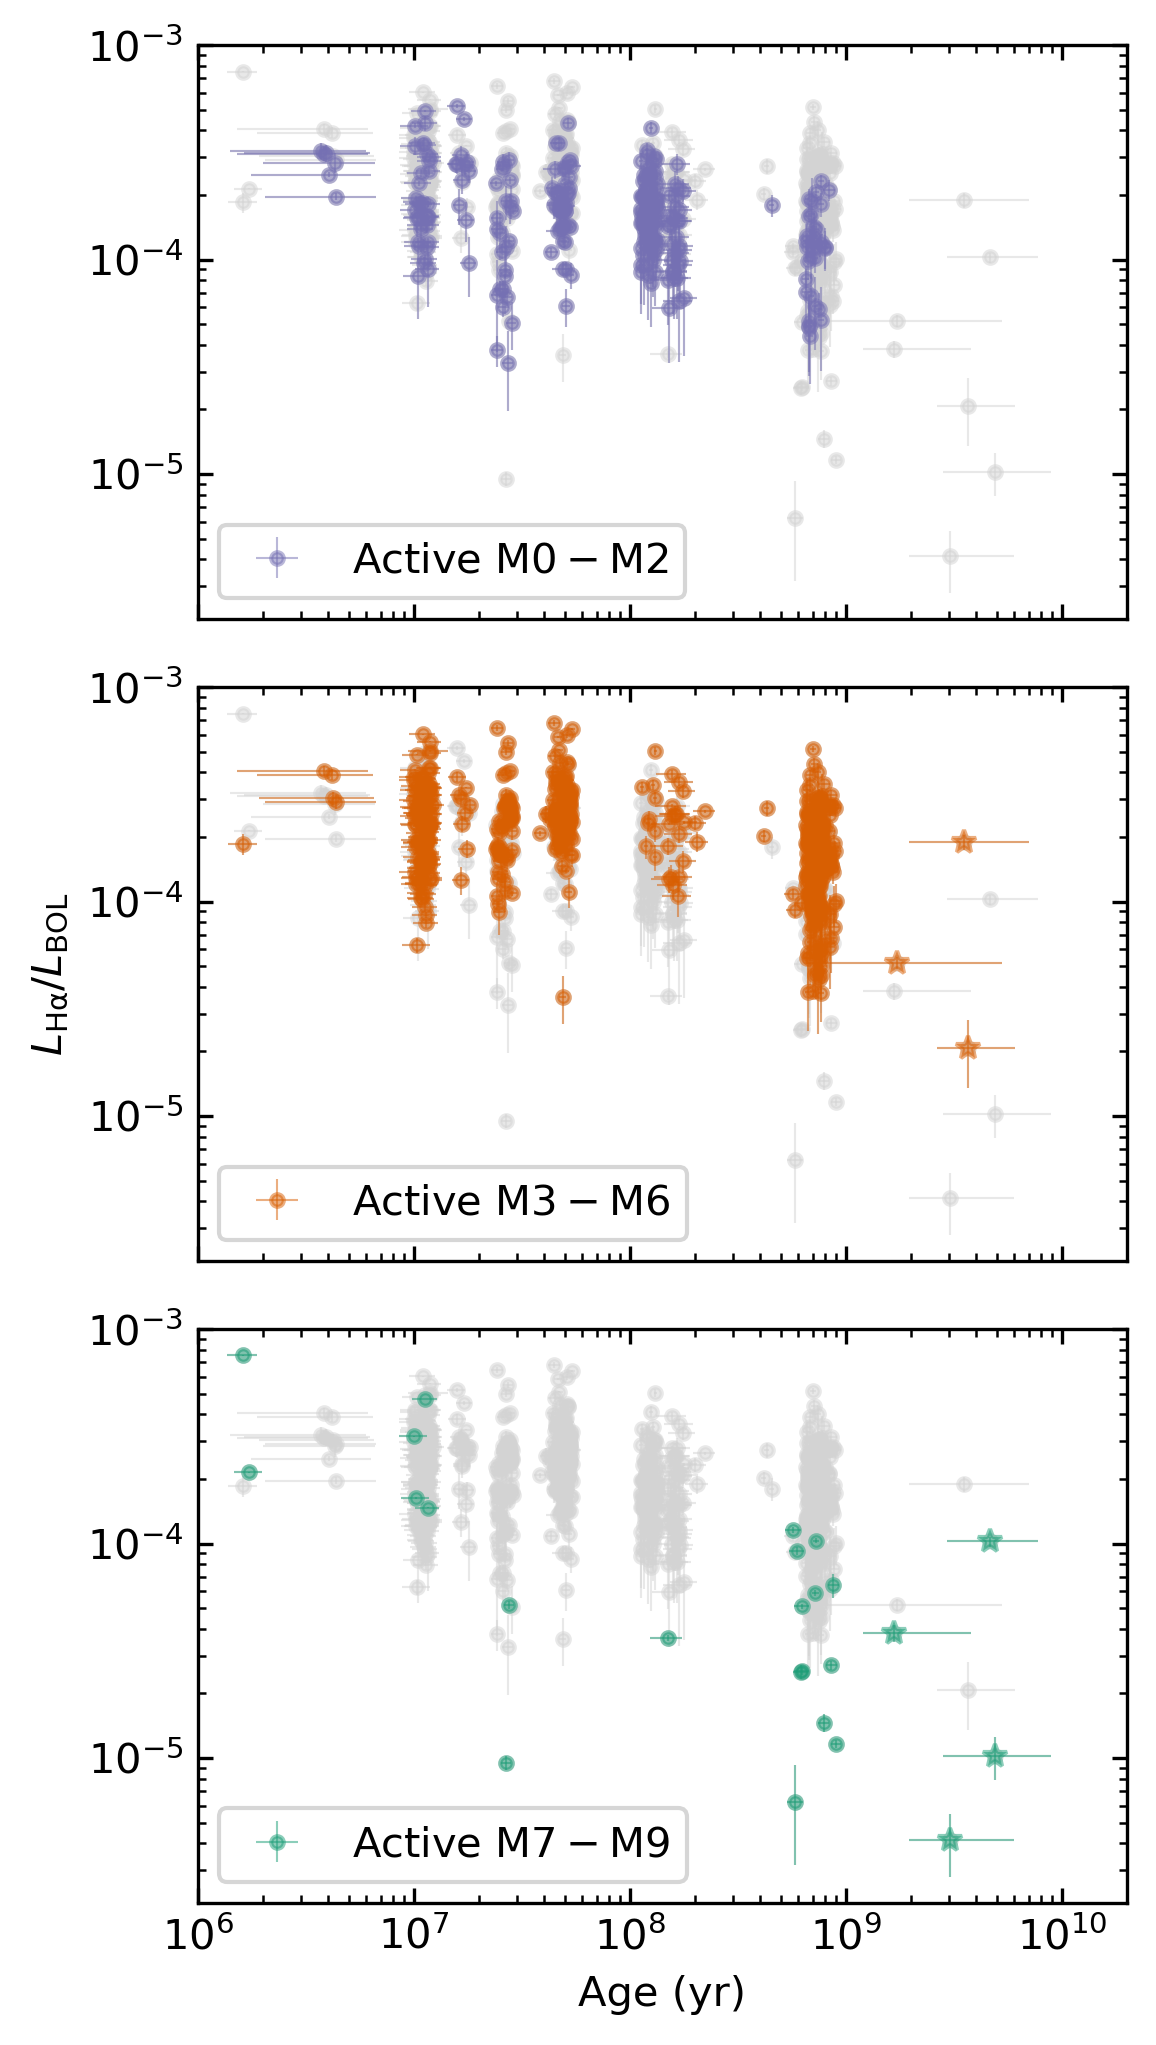
We used our calibrators for and to study activity strength as a function of age (Figures 5a and 5b respectively). We divided the calibrators into three panels according to their spectral type: , and which roughly correspond to early-type partially convective, mid-type fully convective, and ultracool fully convective M dwarfs, respectively. In the plots we only show active stars. Inactive stars have with too low signal-to-noise to be significant (gray area in Figures 5a).
There is a large spread of between early, mid and late spectral type M dwarfs, especially at the younger ages, shown in Figure 5a. As indicated by previous studies (e.g. Stauffer & Hartmann, 1986; West et al., 2011; Schmidt et al., 2015), increases from early-to-late M dwarfs of the same age, which explains this effect, and it is removed when calculating , as can be seen in Figure 5b.
We found less than ten mid- and late-type old ( Gyr) active M dwarfs according to their , and none early-types. We could not identify any external factors related to these stars, such as a close binary which would increase their magnetic activity. Therefore, we consider them to be true active stars (see Section 4.2). The three youngest late-type M dwarfs in the are not displayed in the plot, because their equivalent width values are higher than , and thus outside of the axis limit.
We also note that there are stars in the inactive region at all ages in Figure 5a ( , gray area), meaning that a small does not necessarily indicate old age for an M dwarf. However, we do see an increase in the number of stars with low in the inactive region as age increases.
To study the trends of activity strength with age, we calculated the median values, and percentile for a sliding window of width in units of for both and . Results are shown in Figures 6a and 6b respectively. The relation between and age for early M dwarfs (purple lines in Figure 6a), shows a gradually decline from approximately to in Gyr. For mid spectral types (, orange lines) we observe a progressive decrease of with age until Gyr. After Gyr, we observe a large decline in (). There are too few late type dwarfs in our sample to be able to make a robust conclusion. However, we do observe a decline in the value of with age.
presents a similar decay of magnetic activity for early- and mid-types (purple and orange lines) for ages Gyr in Figure 6b. After this age, early-type M dwarfs are all inactive in our sample, while mid-type M dwarfs present a transition to a steeper decrease of the magnetic activity with age. However, we need more old M dwarfs with measurements to make a conclusion about the evolution of magnetic activity after Gyr.


There is significant scatter both in and at each age bin, partially due to the intrinsic variability of (Lee et al., 2010; Bell et al., 2012). To study the scatter in more detail, we analysed the M dwarfs in our sample which have duplicate measurements of . Some of these duplicated stars come from different studies of the same young association, which did their own measurements. We also noticed that the duplicated age-calibrators are, on average, at a slightly shorter distance than non duplicated age-calibrators. This tendency may be due to these stars being more likely to be selected by studies given the better quality of the data. We see not such tendency with spectra type. Therefore, we are confident that we can use these duplicated measurements to study variability. Our sample of age-calibrators contains stars with independent measurements of which are shown in the top panel of Figure 7 with the different measurements of corresponding to the same star joined by a line. We also show the difference between the maximum and the minimum value of for each star in the bottom panel of Figure 7. We note that of the M dwarfs in the sample has an intrinsic variability . By doing a literature search of the stars with higher we found that most of the stars which have are known variable stars (Kiraga, 2012; Schmidt et al., 2015; Samus’ et al., 2017). This analysis on variability shows that our cut to distinguish compatible measurements was conservative (see Section 2.2). We also note that there is correlation between and measurements in agreement with the results from Lee et al. (2010); Bell et al. (2012).
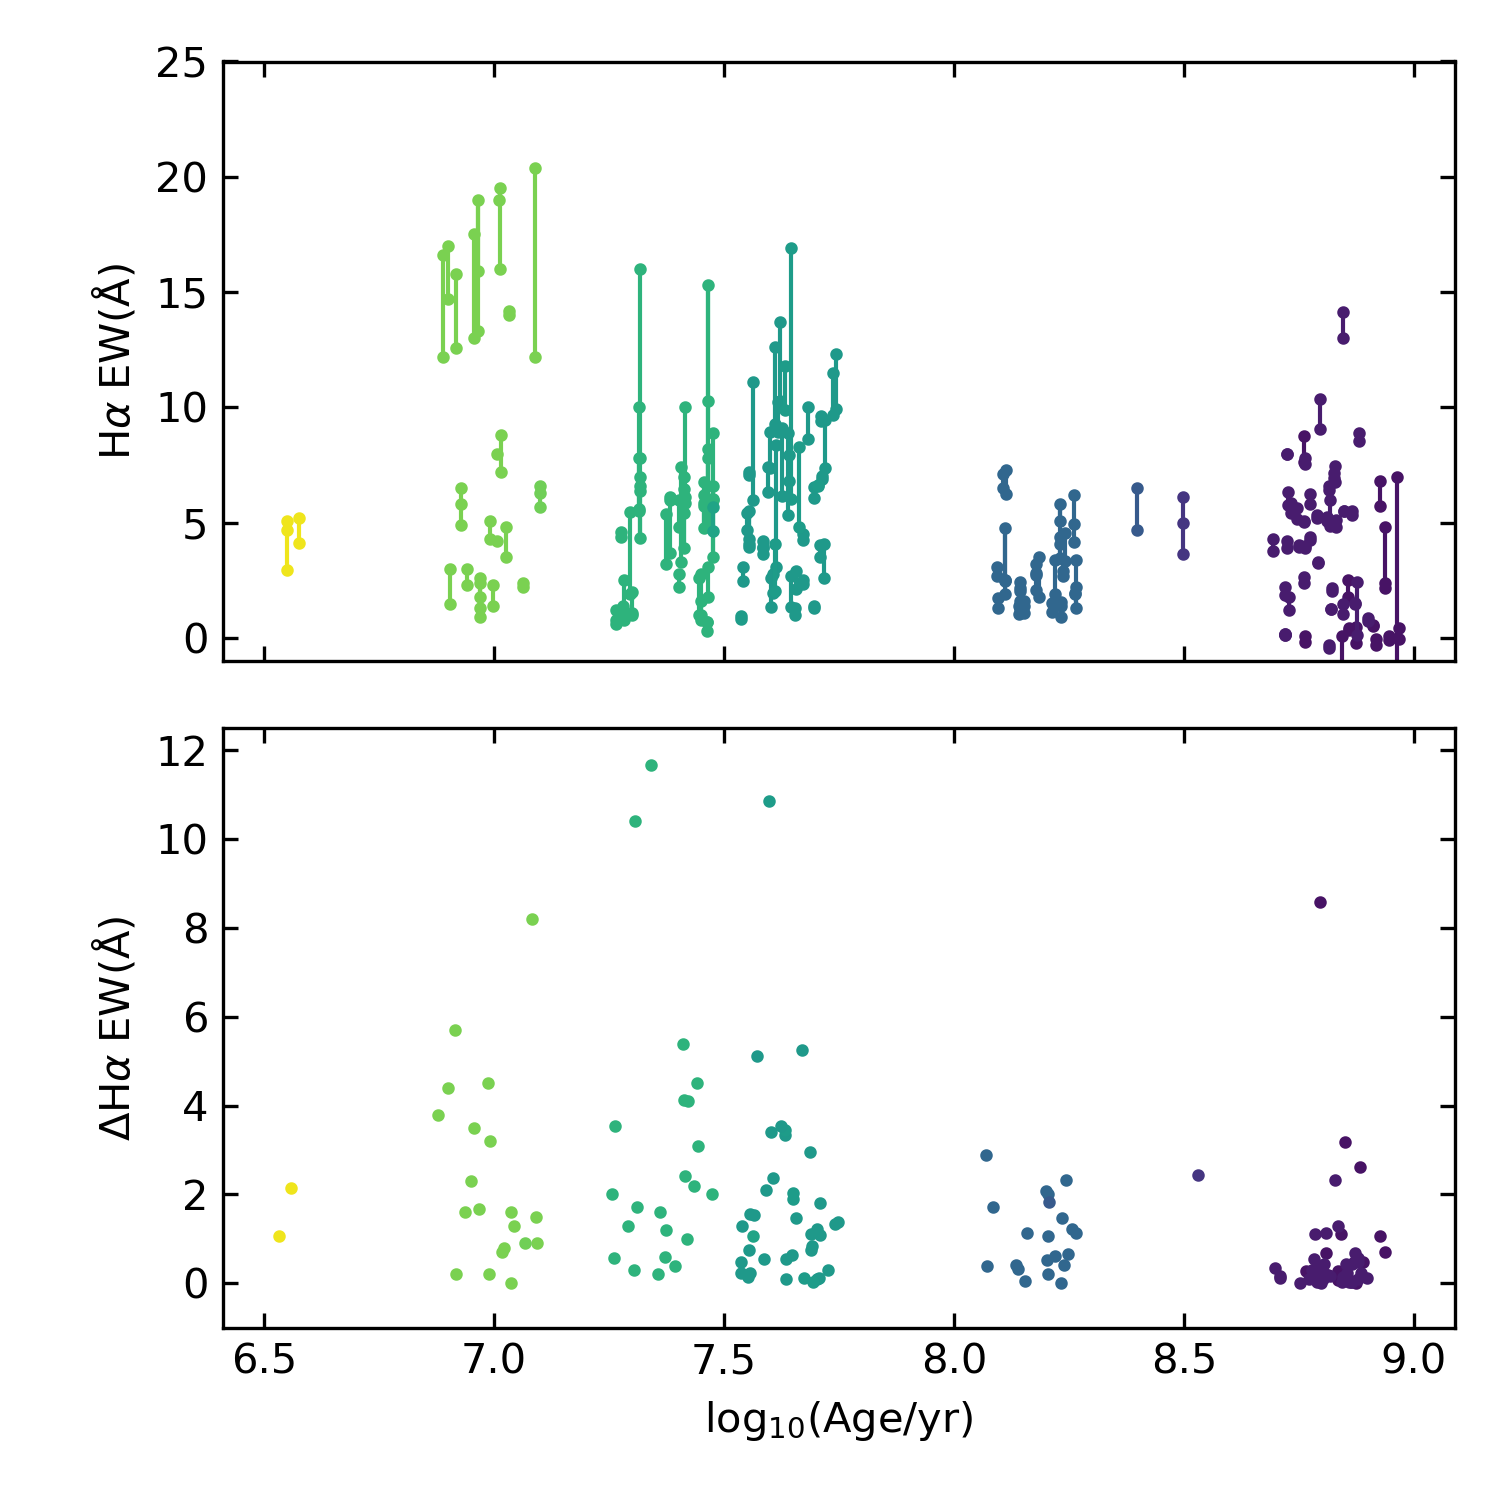
.
6.2 Fitting the age-activity relation
We fit the age-activity relation measured with for all active age-calibrator ( stars, Tables 2 and 1) without binning by spectral type ranges, given that we lack enough information per bin. A broken power-law has been used in several previous studies of the X-ray age-activity relation (e.g., Jackson et al., 2012; Booth et al., 2017) and for the rotation-activity relation (e.g., Delfosse et al., 1998; Douglas et al., 2014; Núñez et al., 2016; Newton et al., 2017) for cool dwarfs to model a saturation regime where remains constant, followed by a power-law decay. Furthermore, West et al. (2008a) found that for M dwarfs, remains constant for young ages and then decays. Therefore, we decided to use a broken power-law to fit the age-activity relation. See the Appendix B for a comparison between the broken power-law and polynomials of different degrees using the cross-validation method.
We performed a Markov chain Monte Carlo (MCMC) fit to the age-activity relation using emcee (Foreman-Mackey et al., 2013) to estimate the parameters of the broken power-law and their uncertainties. The broken power-law we fit to the relation was of the form:
| (2) |
where is the age of the star. We used a Gaussian function as the likelihood and uniform priors on each parameter. As discussed before, the age-activity relation for is scattered due in part to the intrinsic variability of this emission line. We included an extra parameter, , to model the intrinsic variability of assuming the variability of is the same for all stars, in other words, that the intrinsic variability is proportional to (Lee et al., 2010; Bell et al., 2012). The resulting likelihood for our model is:
| (3) |
where we sum over each measurement of and age.
To ensure that the MCMC had converged, we calculated the autocorrelation time () for our likelihood and sampled our posterior by doing steps to assure independent samples999To calculate the autocorrelation time we followed the tutorial in https://emcee.readthedocs.io/en/stable/tutorials/autocorr/.
We show the maximum likelihood of the parameters of the broken power-law and the over the age-calibrators in Figure 8, as well as one hundred random samples from the posterior distributions of the broken power-law parameters. We show the full posterior distributions and the maximum likelihood values for each parameter in Figure 9. As discussed in Section 6.1, we found for a decrease in activity strength from Myr to Myr with a power-law index of , with a variability of . For ages Myr, the relation shows a decline in magnetic activity with a power-law index of . However, and the power-law index for old stars are based on fewer than active old stars. Therefore, these parameters are not well constrained with our data, as shown by the purple line fits in Figure 8. We do not recommend using this fit for stars with ages Myr. More data for older ages is needed to calibrate the decay. From Figure 8 we can conclude that there is a breaking point at which the magnetic activity starts to decline with a steeper slope according to , and that it is at an age Myr, as indicated by our parameter. As shown in Figure 5b, the old active stars are of spectral type , therefore this breaking point corresponds only to late-type stars. We note that this age activity relation was obtained using only active stars. We will develop a model combining , active fraction, color and age in future work.
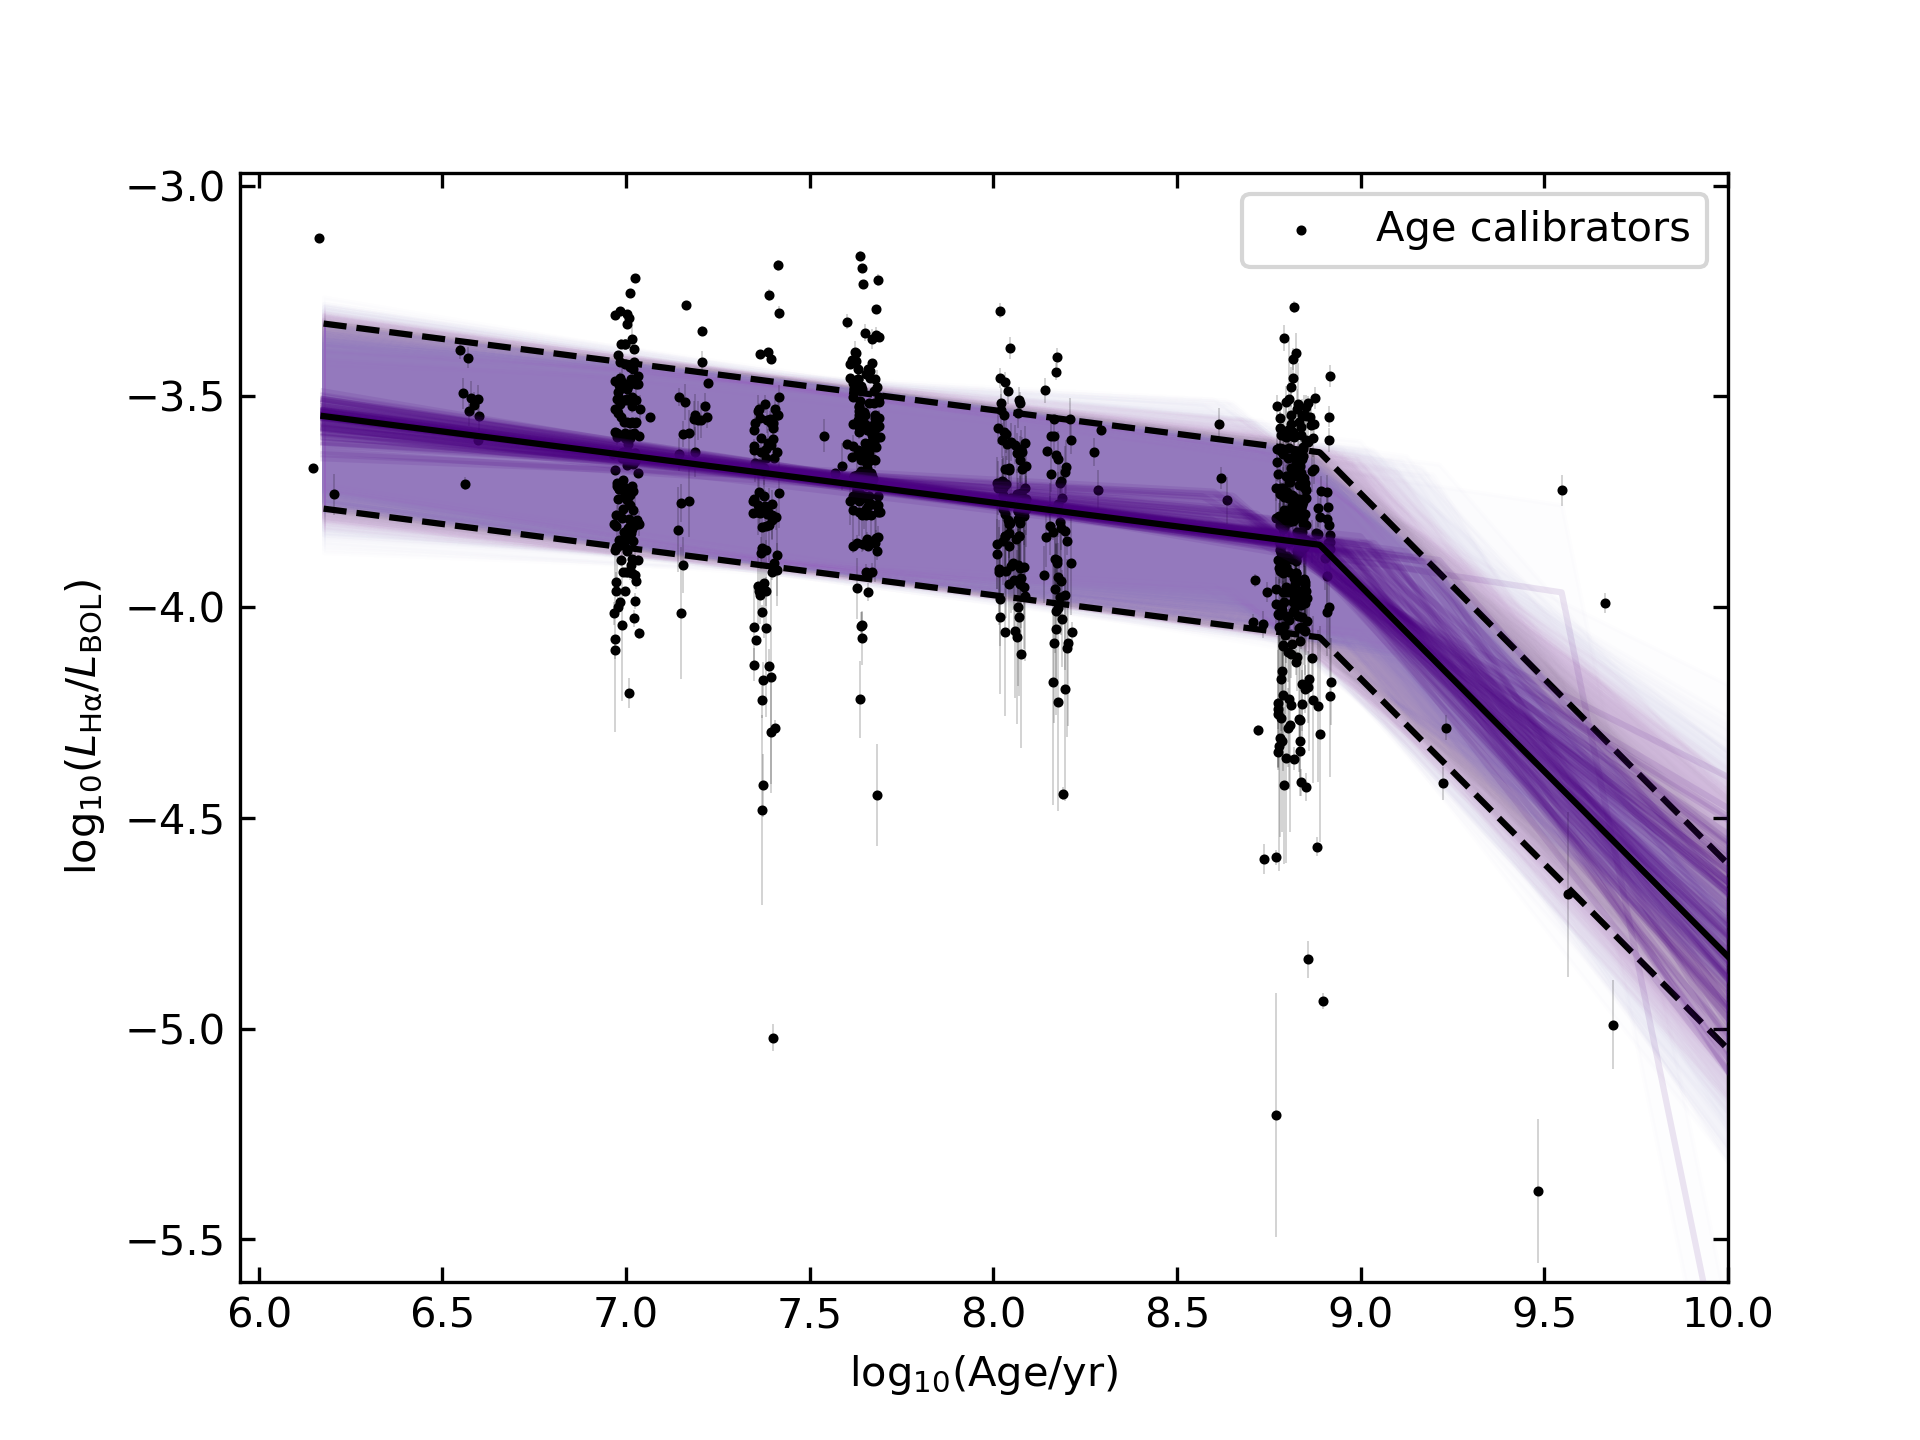
.

.
7 Comparison to previous age-activity relations
West et al. (2006) studied the age-activity relation by collecting a sample of M dwarfs with 3D positions, 3D kinematics and equivalent widths and luminosities. They found that decreases with increasing vertical distance from the galactic plane and that the slope of the relation depends on the spectral type. As vertical distance is an age indicator such that older stars are located farther from the plane (Wielen, 1977; Hänninen & Flynn, 2002), their conclusion was that decreases with increasing age. They also found that the active fraction of M dwarfs also decreases with vertical height. West et al. (2008b) used a one-dimensional model to simulate the dynamics of stars in the Galaxy and fit the relation between active fraction and vertical height. They found that the active lifetime of M dwarfs increases from Gyr to Gyr with spectral type ( to ), meaning that later-type M-dwarfs stay active longer than early-type ones. The results from our study of the active fraction as a function of color for different ages (Figure 4) agrees with the results from West et al. (2006) and other works that did a similar analysis (e.g., Hawley et al., 1996; West et al., 2011; Schmidt et al., 2015). In addition, our age-activity relation (Figures 5, 6 and 8) qualitatively agrees with the results from West et al. (2008b).
West et al. (2008a) used a similar simulation as the one described above, to find ages from the vertical height of the stars, and studied the relation between and age for M-M dwarfs. These relations are plotted as dotted-dashed lines in Figure 10 for , and over the data for our age calibrators, which are divided according to spectral type range. We also included our results for the fit from Figure 8, as reference. We do not have enough M dwarf-white dwarf pairs with measurements to constrain the power-law index for ages Gyr, so we did not include this part of the fit. We found that West et al. (2008a) overestimated the value of the activity strength for early-type M dwarfs and slightly underestimated it for late-type M dwarfs. Their relation also indicates that remains constant for young ages up to the decline for all M dwarfs. Our fit does a better job at describing the data, and unlike West et al. (2008a), we found that for early- and mid-type M dwarfs decreases progressively for ages Gyr with a slope . As shown by the relation between and age for each spectral type bin in Figure 6a, the magnetic activity of old ( Gyr) mid- and late-type M dwarfs seems to decline more rapidly than young stars, in agreement with West et al. (2008a). However, we found that early-type M dwarfs become progressively inactive unlike their result, which indicates a steep decline.

.
The age-activity relation has been studied for other magnetic activity indicators. Stelzer et al. (2013) using a complete sample of M dwarfs within pc, found that the fluxes of , X-ray and UV are correlated. This correlation was expected given that the three parameters are magnetic activity indicators. Therefore we also compared our results to X-ray and UV age-activity relations. Jackson et al. (2012) studied the age-activity relation using X-ray luminosity for young F, G and K dwarfs from known young associations ( Gyr) and found a saturated region for ages Myr where the X-ray luminosity remains constant and then declines with a power-law index between and . Booth et al. (2017) also studied the dependence of X-ray luminosity for a sample of F, G, K and M dwarfs with ages obtained from astroseismology or from white dwarf co-movers, such that the stars had an age Gyr. They found that X-ray luminosity decreases with age with a power-law index of . Instead of a saturated region where remains constant, we found that magnetic activity for stars with ages Gyr decreases with a small power-law index of and for stars Gyr of (Figures 8 and 9). Although is not well constrained by our model, our results seem to agree with Jackson et al. (2012) and Booth et al. (2017) in that the decrease of magnetic activity is faster for old stars that for young stars ( Gyr).
Schneider & Shkolnik (2018) studied a sample of M dwarfs from young associations ( Gyr) and compared it to field dwarfs to characterize the UV age-activity relation. They found that mid- to late- M dwarfs ( ) remain relatively active throughout their lifetimes according to UV flux density, with only a small decrease of magnetic activity from young to field ages. They also found that early-Ms ( ) have a much more significant decrease of magnetic activity over the same age range. This result agrees with our result for the evolution of the magnetic activity using . For the active fraction as a function of color for different age bins in Figure 4, we found that the active fraction of early-type M dwarfs decreases from to almost zero for field dwarfs while the active fraction for mid-type M dwarfs remains close to one for ages Gyr and declines at an older age.
8 Conclusions
In this study, we analyze the age-dependence of the magnetic activity of M dwarfs from three complementary perspectives: (1) the dependence of the active fraction of spectral subtypes with age, (2) the dependence of equivalent width () with age, and (3) the dependence of fractional luminosity () with age. We compiled a sample of compatible single dwarfs ( in total, including repeated measurements and not compatible) to serve as age calibrators, based on M dwarfs with measurements collected from the literature, focusing on M dwarf members of young associations or co-moving with a white dwarf. We cross-matched our sample with Gaia DR2 to obtain proper motions and parallaxes and found that of our sample was in Gaia DR2. From this sample we identified M dwarf members of known young associations ( Gyr) using Gaia DR2 kinematics and parallaxes, and BANYAN (Gagné et al., 2018), as well as M dwarfs co-moving with a white dwarf from Gentile Fusillo et al. (2019). The age for M dwarf members of young associations was obtained from the estimated age of their association. For M dwarfs co-moving with a white dwarf, the age was calculated with the Python package wdwarfdate (Kiman et al. in prep) available online101010https://wdwarfdate.readthedocs.io/en/latest/. We have made the code used in this work available on Zenodo111111https://doi.org/10.5281/zenodo.4660208 and GitHub121212https://github.com/rkiman/M-dwarfs-Age-Activity-Relation.
We present the results of our analysis as follows:
-
1.
From the identified members of young associations in this study, are new candidate members (Table 5).
-
2.
We studied the variability of at young ages for M dwarfs with independent measurements. We found that of the sample has a for ages Gyr, where is the difference between the maximum and the minimum value of (see Figure 7).
-
3.
We confirmed that both and decrease with age for spectral types . We lacked a large enough sample to determine a precise trend in late M dwarfs (). Kiman et al. (2019) found a dependence of on vertical action dispersion, which is also a proxy for age (Wielen, 1977; Hänninen & Flynn, 2002). Figure of Kiman et al. (2019), shows that decreases from to for both mid () and late spectral types (), which agrees with the dependence of with age we found for M dwarfs co-moving with white dwarfs (see Figure 5b). This result indicates that mid-type M dwarfs ( ) have a similar age-activity relation to ultracool dwarfs ().
-
4.
We classified our age-calibrators as active or inactive according to their . Using this classification we calculated the active fraction per color bin. We confirmed that the active fraction increases with color, which is a proxy for decreasing mass, from in agreement with West et al. (2004) and Schmidt et al. (2015). Moreover, by calculating the active fraction per color per age bin, we found that the active fraction varies with age according to spectral type: the active fraction of early M dwarfs () decreases gradually from to close to between Myr, while later types stay active longer, such that their active fraction stays close to unity for ages Gyr (see Figure 4).
-
5.
We found that the active fraction for early-type M dwarfs in the age-bin Myr is close to the field value ( Gyr), while mid-types have an active fraction close to unity in the age-bin Myr and for the field. The difference in active fraction between early and mid-types after Gyr could be indicating that late types stay active longer and we do not have enough age resolution to distinguish the progressive decrease of the active fraction with age. This discrepancy also could be indicating that the magnetic activity of mid-type M dwarfs decreases rapidly after Gyr (See Figure 4).
-
6.
By comparing and as a function of age, we found that the magnetic activity strength of early- and mid-type M dwarfs () gradually decreases during the first Gyr of their lives. After Gyr, early- and mid-types seem to behave differently. We found only two early M dwarfs (), which are both inactive and that continue the trend of a gradual decrease of magnetic activity. For mid-type M dwarfs we found old stars out of which are inactive and present a large decline in ( ), which seems to indicate that the magnetic activity of mid-type M dwarfs decreases rapidly after Gyr. However, higher numbers of old stars ( Gyr) are needed to make a robust conclusion.
-
7.
We found that the power-law index for the relation between and age – using all spectral types to fit the data – is for ages Myr. For older ages we only have measurements for spectral types (early-types found are inactive). We found a power-law index of for ages Myr, yet it is poorly constrained since it was fit on a sample of old active stars; hence we do not recommend using this relation for stars with ages of Myr (see Figures 8 and 9). We conclude that spectral types show a sharp decrease in at ages Myr. More measurements of M dwarfs co-moving with white dwarfs are needed to fit the age-activity relation for older ages.
In this study we did not take into account metallicity to calibrate the age-activity relation. Previous studies have shown that the metallicity is a source of scatter for the relation between magnetic activity indicators and age: as the metallicity increases, the convection becomes more efficient which enhances chromospheric activity (e.g., Lyra & De Mello, 2005; Lorenzo-Oliveira et al., 2016). Metallicity should not affect the age-relation obtained from young associations given than the ones used in this study have similar values (Malo et al., 2014b). While metallicity might affect the relation for older stars, we are not setting a strong constraint in the age-relation for older stars, so it does not modify our conclusions.
This work represents a big advancement on the understanding of M dwarfs magnetic activity and evolution. In addition, this work is key for studying star-planet interactions, identifying habitable exoplanets and identifying true planet signals with the radial velocity method, which can be affected if the host star is magnetically active (ex. Robertson et al., 2013). In future work, we plan to model the relation between and age using the calibration from this study. We will use this model in a Bayesian algorithm to estimate ages of individual M dwarfs from their combined with other age indicators to improve the precision and accuracy of M dwarf ages.
9 Acknowledgements
The authors would like to thank Evgenya Shkolnik and Amelia Bayo for helpful references of equivalent width measurements and Jeff Andrews and Alejandro Núñez, Siyi Xu for great discussions. The authors would also like to thank John Bochanski for the helpful comments on the paper.
Support for this project was provided by a PSC-CUNY Award, jointly funded by The Professional Staff Congress and The City University of New York.
This material is based upon work supported by the National Science Foundation under Grant No. 1614527.
This work has been supported by NASA K2 Guest Observer program under award 80NSSC19K0106.
This work was supported by the SDSS Faculty and Student Team (FAST) initiative.
Support for this work was provided by the William E Macaulay Honors College of The City University of New York.
Appendix A Color–magnitude diagrams of young associations members used in this study
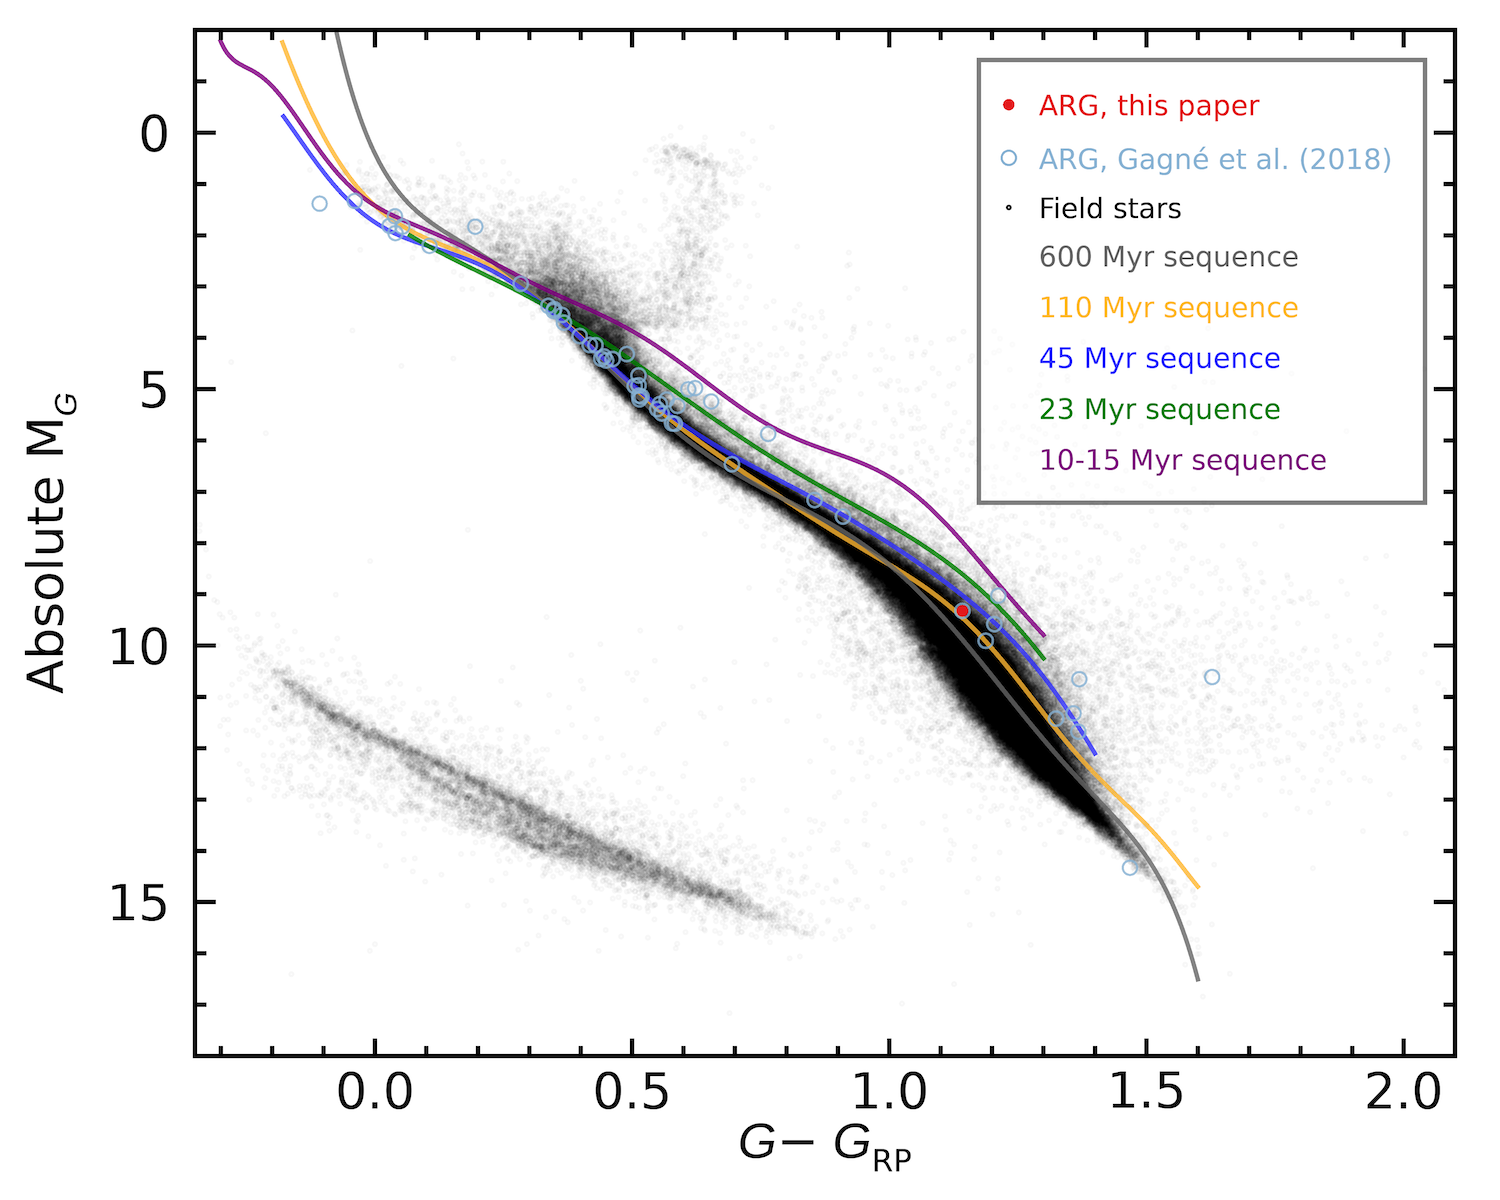
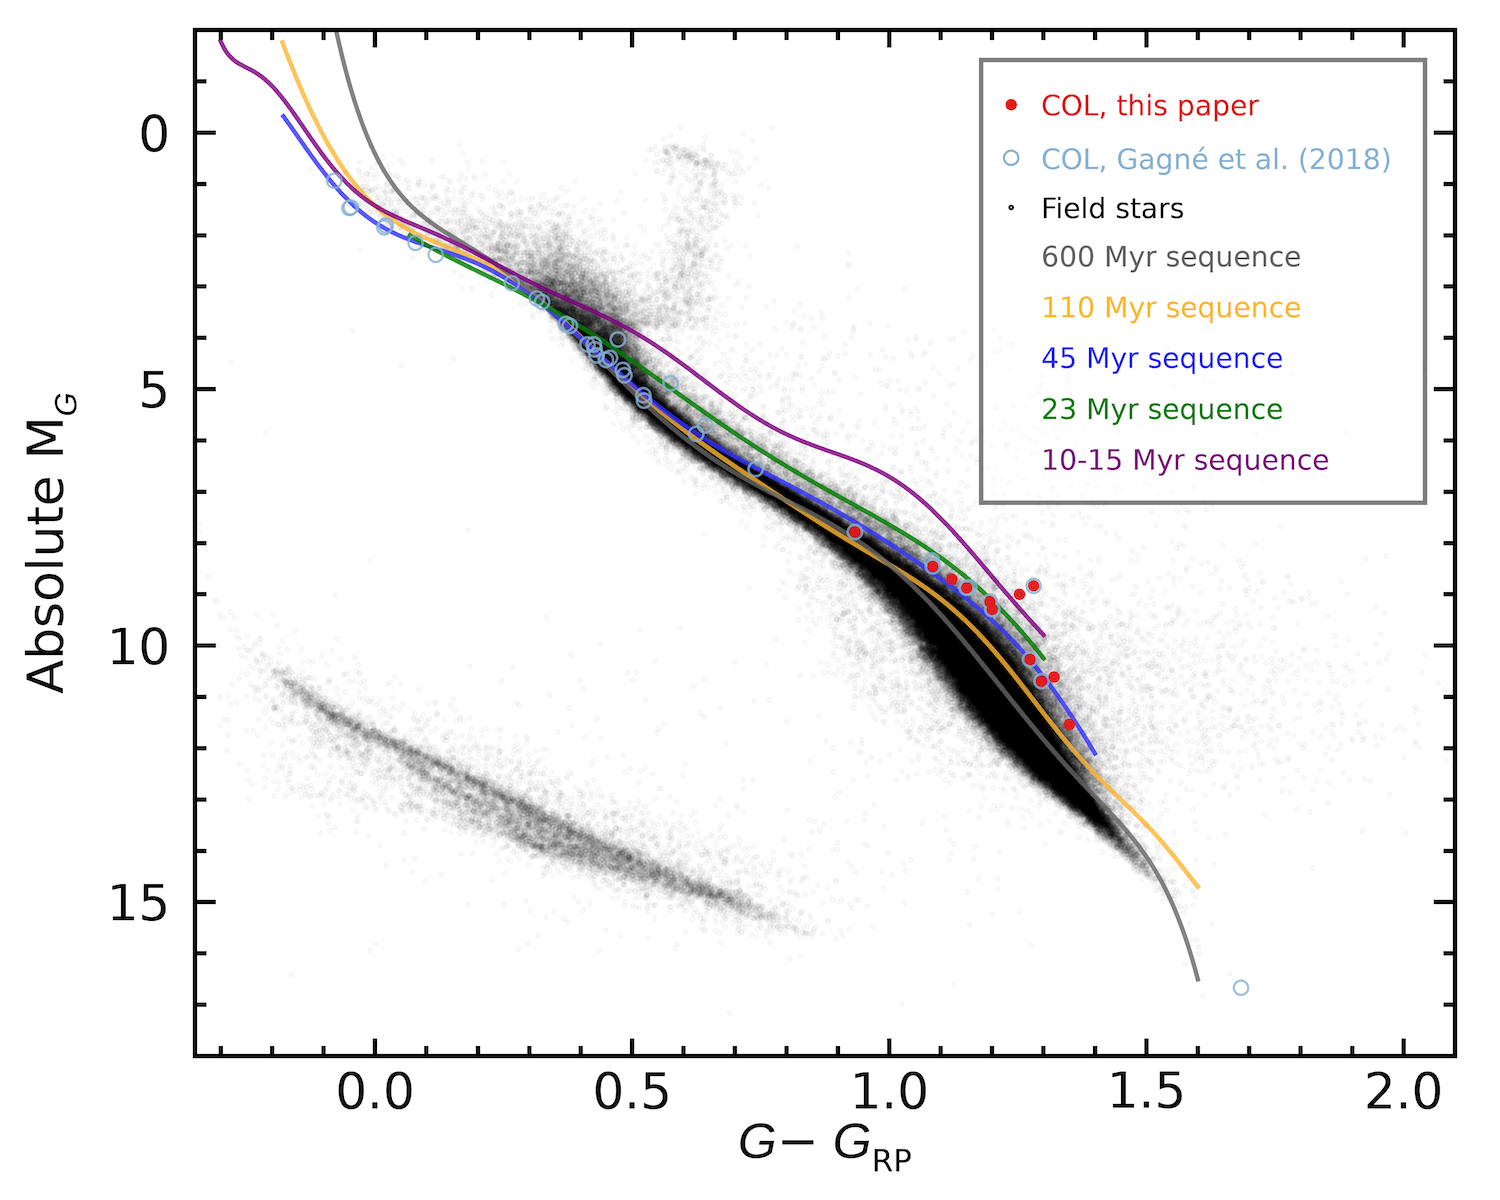
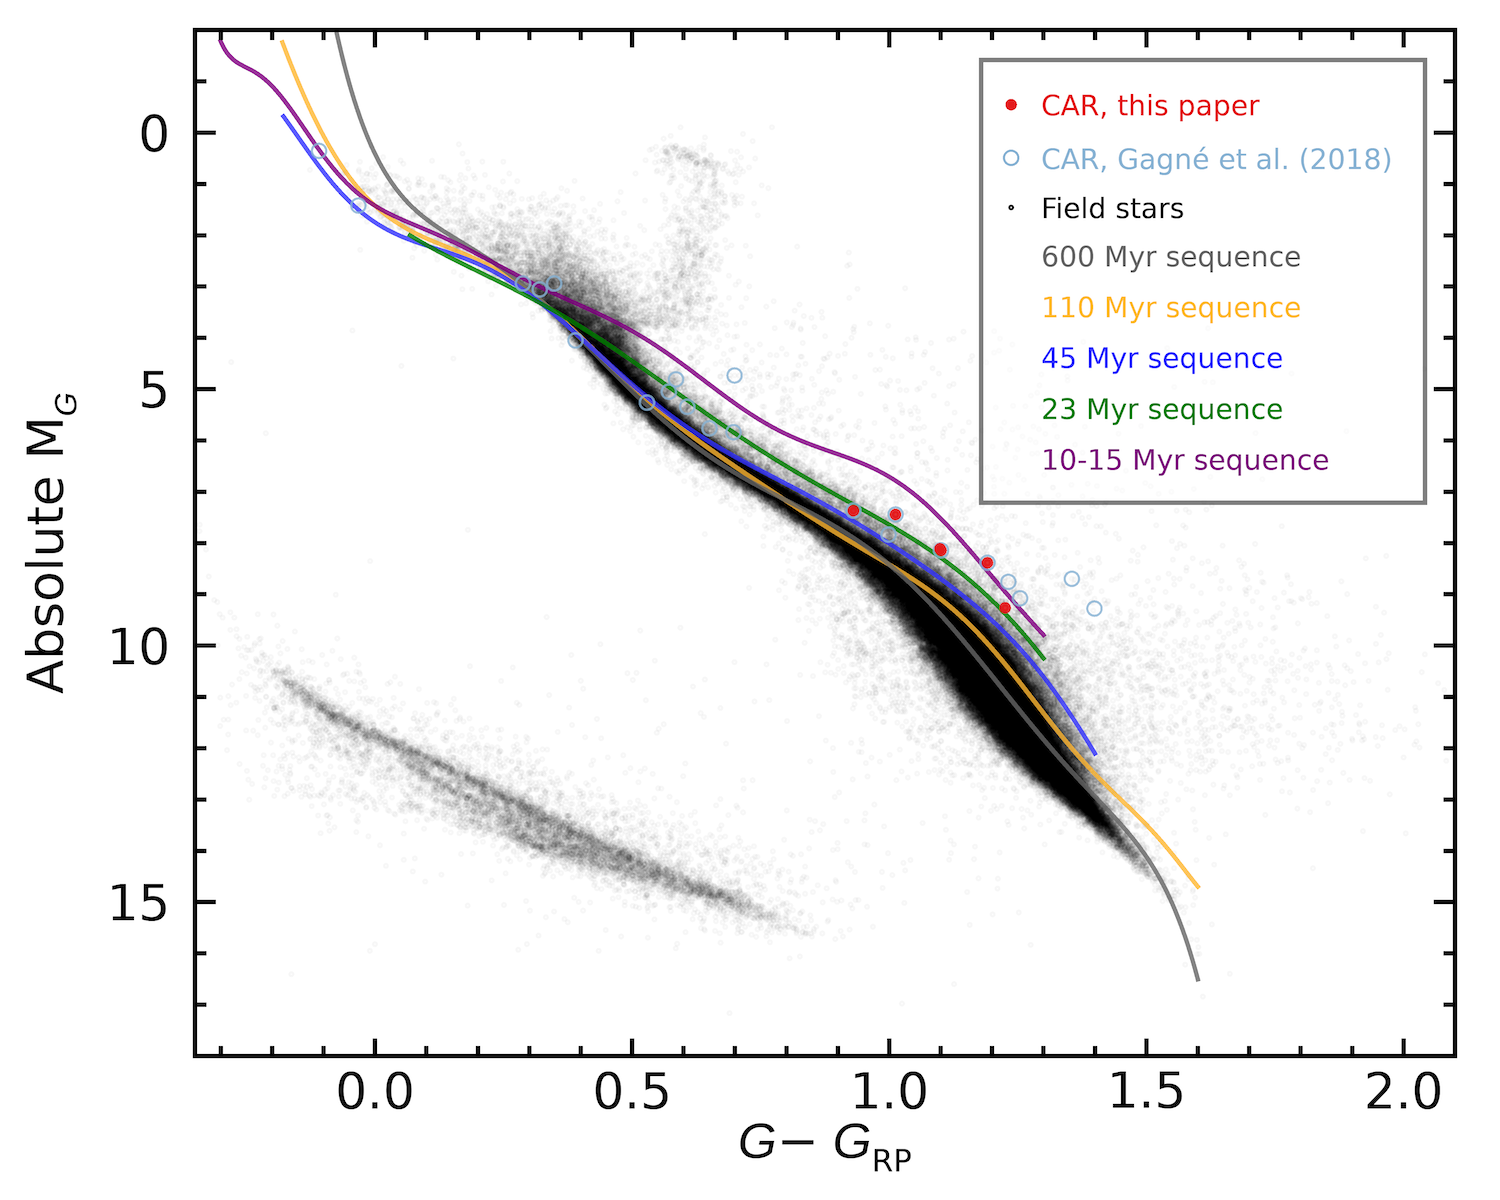
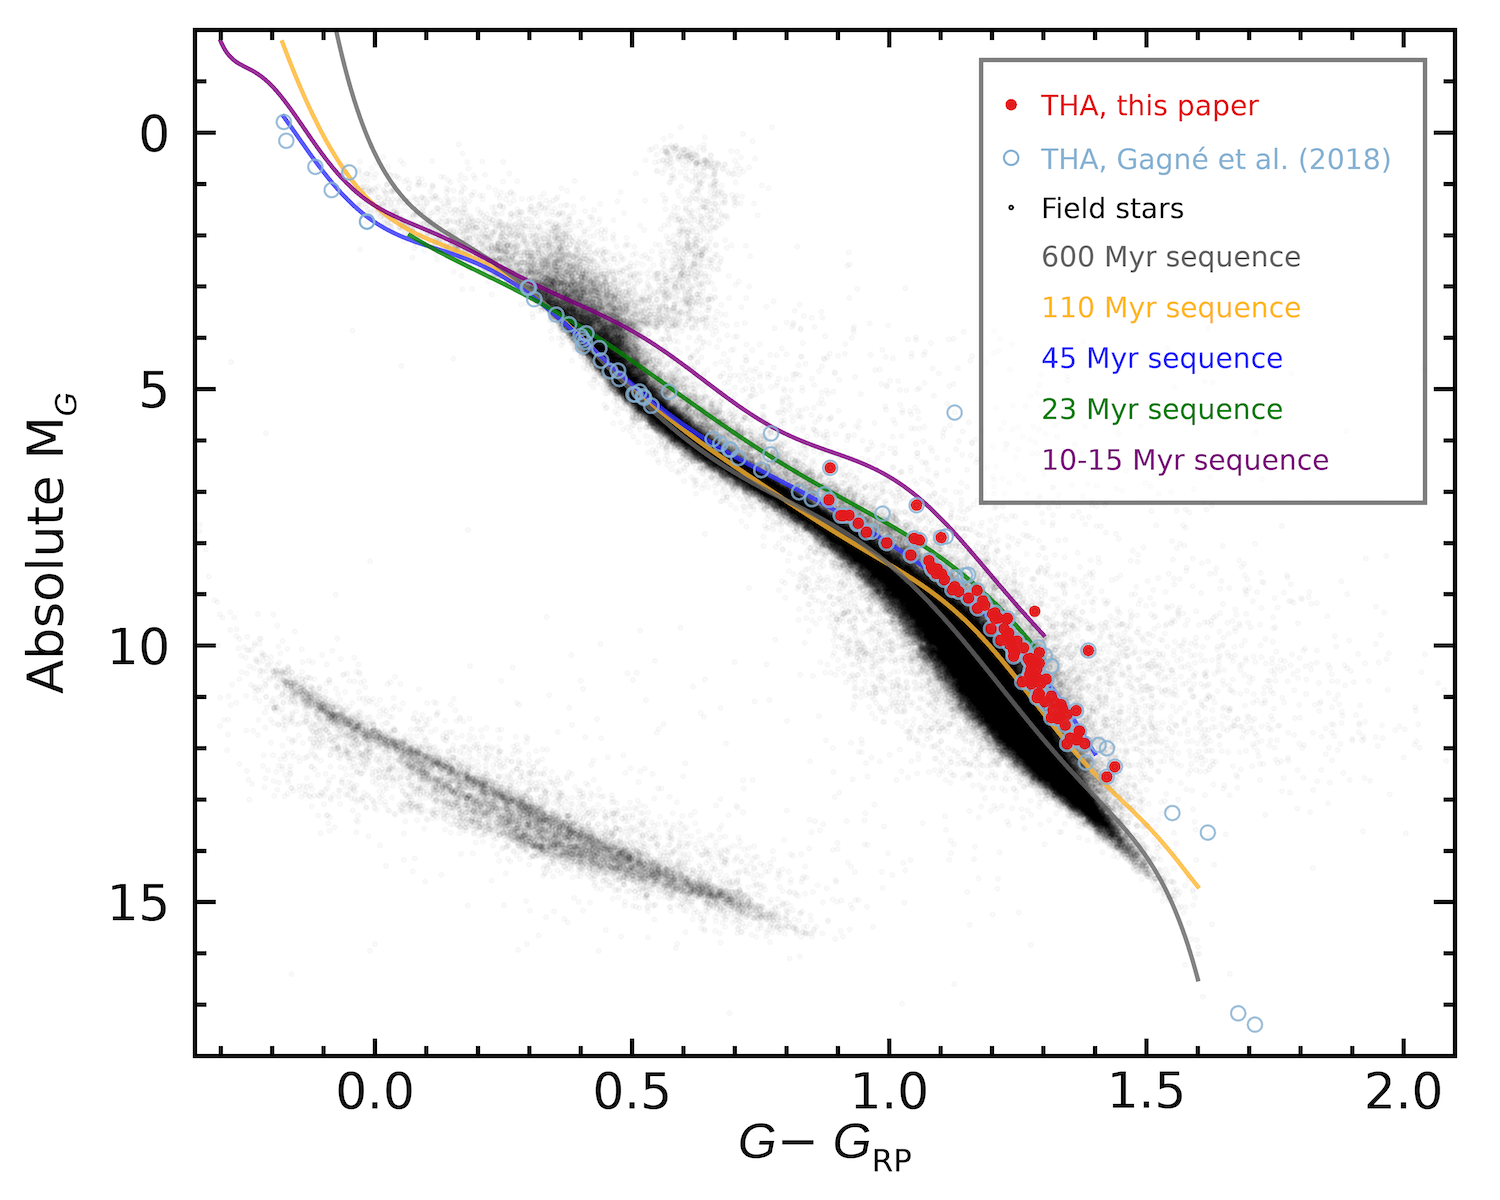
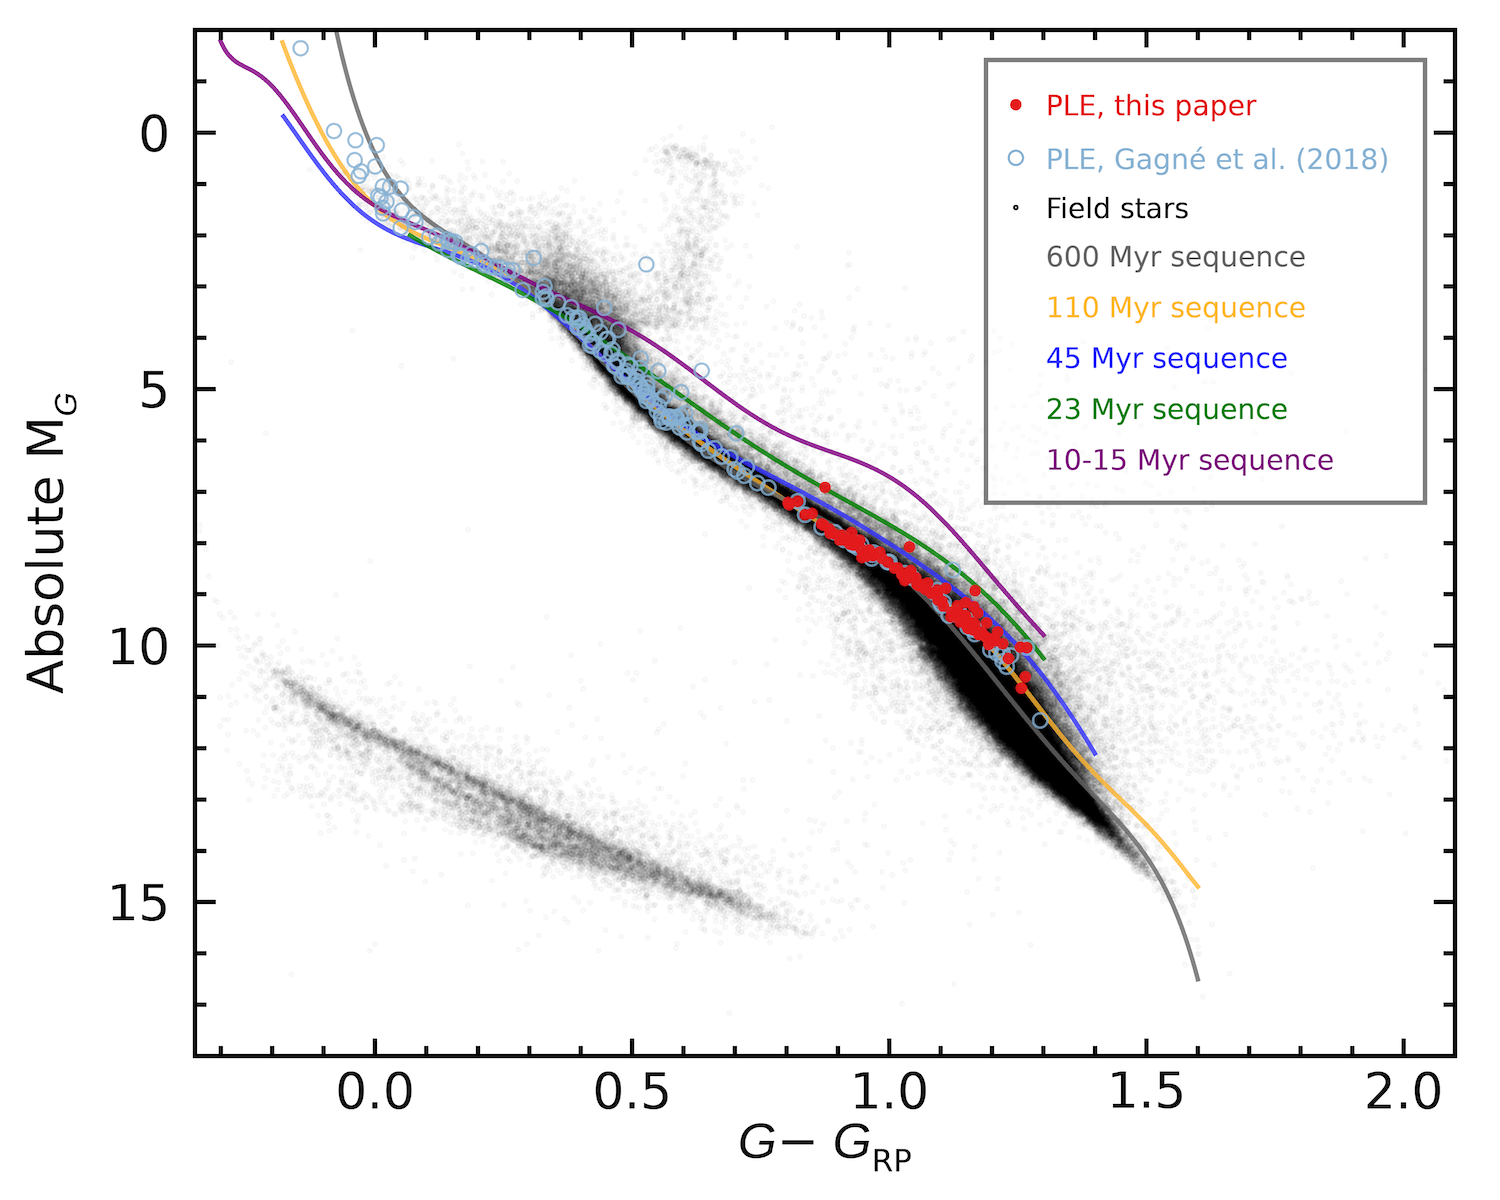
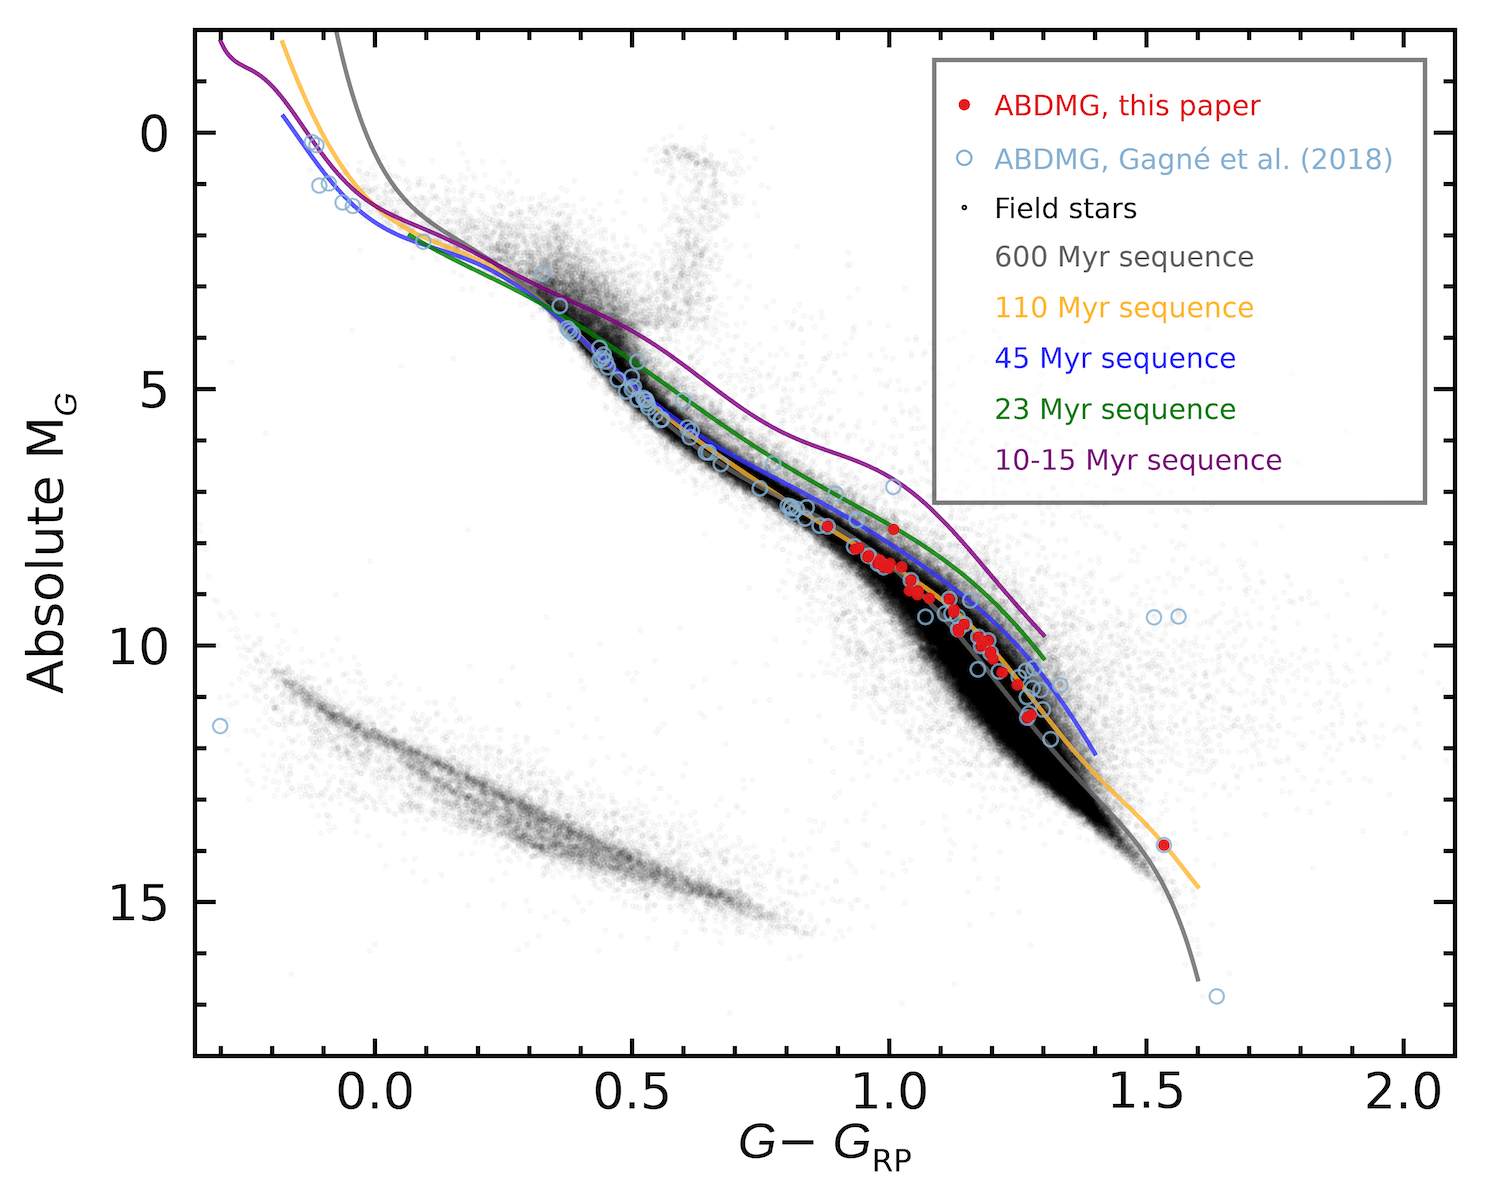
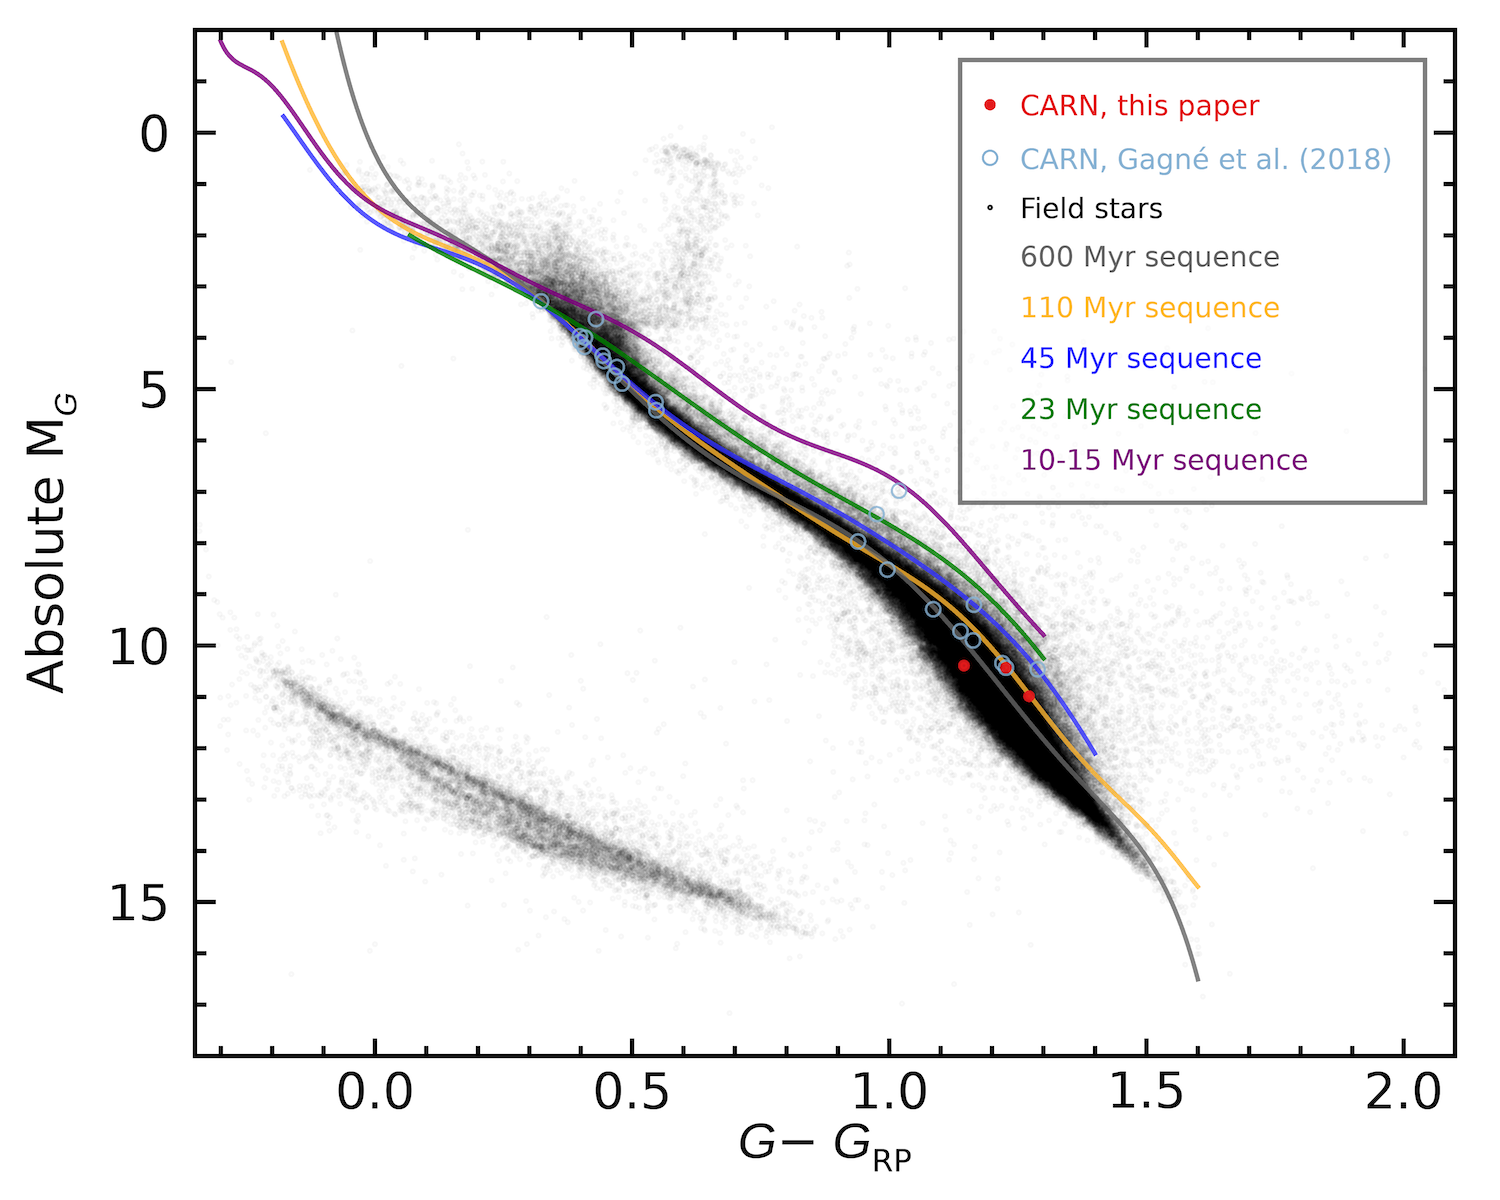
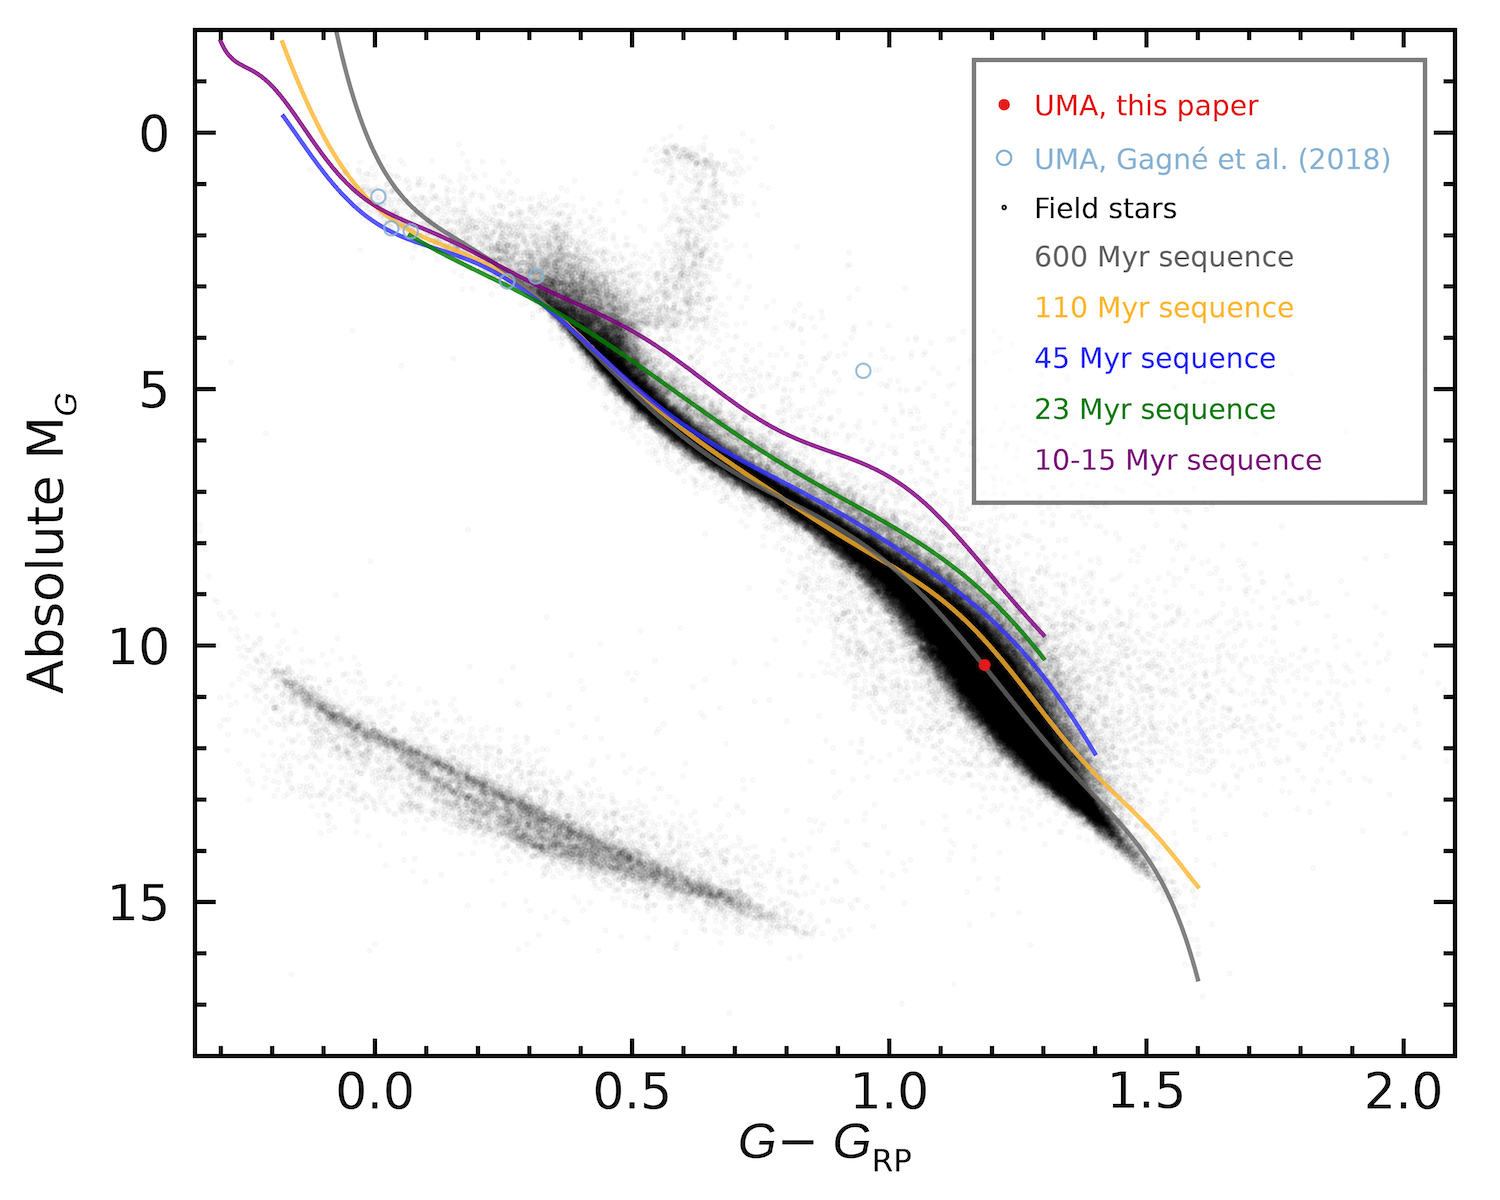
In this section we compare the position in the Gaia color–magnitude diagram of the stars used as members of young associations in this study, with the position of candidate members of each young association (Gagné et al., 2018), and empirical sequences based on bona fide members of young association of different ages (Gagné et al., 2020). The color–magnitude diagrams for each young association are in Figure 11. We conclude that the stars used in this study as members are not discarded with the color–magnitude diagrams: although some stars do not follow the corresponding age sequence, they present a similar scatter as the candidate members (light blue empty circles). More study of these systems will be needed before they are confirmed as members.
Appendix B Comparison models to fit the age-activity relation
Previous studies have used the broken power-law to fit age-activity relations (See Section 6.2). As we are interested in the predictive power of our model, we tested the broken power-law against polynomials of degrees to using a cross-validation method. In this method, we leave one of the calibration stars out and fit the rest with one of the models we want to compare. Then we use the fitted model to predict the value of the left out element and we calculate how close the predicted value is to the true value. The total score for each model is defined as:
| (B1) |
where and are the equivalent width and the age of the excluded -element respectively and represents the model being tested so predicts the value of . The model with the lowest score does the best job at predicting new data.
Applying the described cross-validation method with the scipy Python package (Virtanen et al., 2020), we found that a first degree polynomial and a broken power-law had the lowest cross-validation scores, indicating that those models can more accurately predict ages based on . Therefore we confirm the choice of a broken power-law to fit the age-activity relation.
References
- Alonso-Floriano et al. (2015) Alonso-Floriano, F. J., Morales, J. C., Caballero, J. A., et al. 2015, Astron. Astrophys., 577, 128, doi: 10.1051/0004-6361/201525803
- Angus et al. (2015) Angus, R., Aigrain, S., Foreman-Mackey, D., & McQuillan, A. 2015, Mon. Not. R. Astron. Soc., 450, 1787, doi: 10.1093/mnras/stv423
- Angus et al. (2019) Angus, R., Morton, T. D., Foreman-Mackey, D., et al. 2019, Astron. J., 158, 173, doi: 10.3847/1538-3881/ab3c53
- Ansdell et al. (2015) Ansdell, M., Gaidos, E., Mann, A. W., et al. 2015, Astrophys. J., 798, 41, doi: 10.1088/0004-637X/798/1/41
- Arenou et al. (2018) Arenou, F., Luri, X., Babusiaux, C., et al. 2018, A&A, 616, A17, doi: 10.1051/0004-6361/201833234
- Astropy Collaboration et al. (2013) Astropy Collaboration, Robitaille, T. P., Tollerud, E. J., et al. 2013, A&A, 558, A33, doi: 10.1051/0004-6361/201322068
- Baraffe et al. (2015) Baraffe, I., Homeier, D., Allard, F., & Chabrier, G. 2015, Astron. Astrophys., 577, A42, doi: 10.1051/0004-6361/201425481
- Barnes (2003) Barnes, S. A. 2003, Astrophys. J., 586, 464, doi: 10.1086/367639
- Barnes (2007) —. 2007, Astrophys. J., 669, 1167, doi: 10.1086/519295
- Barry (1988) Barry, D. C. 1988, Astrophys. J., 334, 436, doi: 10.1086/166848
- Bayo et al. (2012) Bayo, A., Barrado, D., Huélamo, N., et al. 2012, Astron. Astrophys., 547, doi: 10.1051/0004-6361/201219374
- Bell et al. (2015) Bell, C. P., Mamajek, E. E., & Naylor, T. 2015, Mon. Not. R. Astron. Soc., 454, 593, doi: 10.1093/mnras/stv1981
- Bell et al. (2012) Bell, K. J., Hilton, E. J., Davenport, J. R. A., et al. 2012, Publ. Astron. Soc. Pacific, 124, 14, doi: 10.1086/664024
- Bergeron et al. (2019) Bergeron, P., Dufour, P., Fontaine, G., et al. 2019, Astrophys. J., 876, 67, doi: 10.3847/1538-4357/ab153a
- Bergeron et al. (1995) Bergeron, P., Wesemael, F., & Beauchamp, A. 1995, Publ. Astron. Soc. Pacific, 107, 1047, doi: 10.1086/133661
- Bergeron et al. (2011) Bergeron, P., Wesemael, F., Dufour, P., et al. 2011, Astrophys. J., 737, 28, doi: 10.1088/0004-637X/737/1/28
- Birky et al. (2020) Birky, J., Hogg, D. W., Mann, A. W., & Burgasser, A. 2020, Astrophys. J., 892, 31, doi: 10.3847/1538-4357/ab7004
- Blouin et al. (2018) Blouin, S., Dufour, P., & Allard, N. F. 2018, Astrophys. J., 863, 184, doi: 10.3847/1538-4357/aad4a9
- Bochanski et al. (2010) Bochanski, J. J., Hawley, S. L., Covey, K. R., et al. 2010, Astron. J., 139, 2679, doi: 10.1088/0004-6256/139/6/2679
- Bochanski et al. (2005) Bochanski, J. J., Hawley, S. L., Reid, I. N., et al. 2005, Astron. J., 130, 1871, doi: 10.1086/444417
- Bochanski et al. (2007) Bochanski, J. J., Munn, J. A., Hawley, S. L., et al. 2007, Astron. J., 134, 2418, doi: 10.1086/522053
- Bochanski et al. (2013) Bochanski, J. J., Savcheva, A. S., West, A. A., & Hawley, S. L. 2013, Astron. J., 145, 40, doi: 10.1088/0004-6256/145/2/40
- Bodenheimer (2011) Bodenheimer, P. H. 2011, Principles of Star Formation (Springer Berlin Heidelberg), doi: 10.1007/978-3-642-15063-0
- Booth et al. (2017) Booth, R. S., Poppenhaeger, K., Watson, C. A., Aguirre, V. S., & Wolk, S. J. 2017, Mon. Not. R. Astron. Soc., 471, 1012, doi: 10.1093/MNRAS/STX1630
- Bouy & Martín (2009) Bouy, H., & Martín, E. L. 2009, Astron. Astrophys., 504, 981, doi: 10.1051/0004-6361/200811088
- Boyajian et al. (2012) Boyajian, T. S., Von Braun, K., Van Belle, G., et al. 2012, Astrophys. J., 757, 112, doi: 10.1088/0004-637X/757/2/112
- Brandt & Huang (2015) Brandt, T. D., & Huang, C. X. 2015, Astrophys. J., 807, 24, doi: 10.1088/0004-637X/807/1/24
- Capitanio et al. (2017) Capitanio, L., Lallement, R., Vergely, J. L., Elyajouri, M., & Monreal-Ibero, A. 2017, Astronomy & Astrophysics, 606, A65, doi: 10.1051/0004-6361/201730831
- Chabrier & Baraffe (1997) Chabrier, G., & Baraffe, I. 1997, Astron. Astrophys., 327, 1039. http://articles.adsabs.harvard.edu/cgi-bin/nph-iarticle{_}query?1997A{%}26A...327.1039C{&}data{_}type=PDF{_}HIGH{&}whole{_}paper=YES{&}type=PRINTER{&}filetype=.pdf
- Chaplin et al. (2014) Chaplin, W. J., Basu, S., Huber, D., et al. 2014, Astrophys. Journal, Suppl. Ser., 210, 1, doi: 10.1088/0067-0049/210/1/1
- Choi et al. (2016) Choi, J., Dotter, A., Conroy, C., et al. 2016, Astrophys. J., 823, 48, doi: 10.3847/0004-637X/823/2/102
- Cruz & Reid (2002) Cruz, K. L., & Reid, I. N. 2002, Astron. J., 123, 2828, doi: 10.1086/339973
- Cummings et al. (2018) Cummings, J. D., Kalirai, J. S., Tremblay, P.-E., Ramirez-Ruiz, E., & Choi, J. 2018, Astrophys. J., 866, 21, doi: 10.3847/1538-4357/aadfd6
- Dahm (2015) Dahm, S. E. 2015, Astrophys. J., 813, 108, doi: 10.1088/0004-637X/813/2/108
- Delfosse et al. (1998) Delfosse, X., Forveille, T., Perrier, C., & Mayor, M. 1998, Astron. Astrophys., 331, 581. http://cdsweb.u-strasbg.fr/Abstract.html
- Dhital et al. (2015) Dhital, S., West, A. A., Stassun, K. G., Schluns, K. J., & Massey, A. P. 2015, Astron. J., 150, 57, doi: 10.1088/0004-6256/150/2/57
- Dotter (2016) Dotter, A. 2016, Astrophys. J. Suppl. Ser., 222, 11, doi: 10.3847/0067-0049/222/1/8
- Douglas et al. (2019) Douglas, S. T., Curtis, J. L., Agüeros, M. A., et al. 2019, Astrophys. J., 879, 100, doi: 10.3847/1538-4357/ab2468
- Douglas et al. (2014) Douglas, S. T., Agüeros, M. A., Covey, K. R., et al. 2014, Astrophys. J., 795, 161, doi: 10.1088/0004-637X/795/2/161
- Dressing & Charbonneau (2015) Dressing, C. D., & Charbonneau, D. 2015, Astrophys. J., 807, doi: 10.1088/0004-637X/807/1/45
- Eggen (1990) Eggen, O. J. 1990, Astron. Soc. Pacific, 102, 166
- El-Badry & Rix (2018) El-Badry, K., & Rix, H.-W. 2018, Mon. Not. R. Astron. Soc., 480, 4884, doi: 10.1093/mnras/sty2186
- Elliott et al. (2016) Elliott, P., Bayo, A., Melo, C. H. F., et al. 2016, Astron. Astrophys., 590, A13, doi: 10.1051/0004-6361/201628253
- Fagotto et al. (1994) Fagotto, F., Bressan, A., Bertelli, G., & Chiosi, C. 1994, Astron. Astrophys. Suppl. Ser., 105, 29. http://articles.adsabs.harvard.edu/pdf/1994A{%}26AS..105...29F
- Faherty et al. (2018) Faherty, J. K., Bochanski, J. J., Gagné, J., et al. 2018, Astrophys. J., 863, 22, doi: 10.3847/1538-4357/aac76e
- Faherty et al. (2009) Faherty, J. K., Burgasser, A. J., Cruz, K. L., et al. 2009, Astron. J., 137, 1, doi: 10.1088/0004-6256/137/1/1
- Fang et al. (2018) Fang, X. S., Zhao, G., Zhao, J. K., & Kumar, Y. B. 2018, Mon. Not. R. Astron. Soc., 476, 908, doi: 10.1093/mnras/sty212
- Feigelson et al. (2003) Feigelson, E. D., Lawson, W. A., & Garmire, G. P. 2003, Astrophys. J., 599, 1207, doi: 10.1086/379365
- Fleming et al. (1995) Fleming, T. A., Schmitt, J. H. M. M., & Giampapa, M. S. 1995, Astrophys. J., 450, 401, doi: 10.1086/176150
- Fontaine et al. (2001) Fontaine, G., Brassard, P., & Bergeron, P. 2001, Publ. Astron. Soc. Pacific, 113, 409, doi: 10.1086/319535
- Foreman-Mackey et al. (2013) Foreman-Mackey, D., Hogg, D. W., Lang, D., & Goodman, J. 2013, Publ. Astron. Soc. Pacific, 125, 306, doi: 10.1086/670067
- Fouesneau et al. (2018) Fouesneau, M., Rix, H.-W., von Hippel, T., Hogg, D. W., & Tian, H. 2018, Astrophys. J., 870, 9, doi: 10.3847/1538-4357/aaee74
- Frasca et al. (2018) Frasca, A., Guillout, P., Klutsch, A., et al. 2018, Astron. Astrophys., 612, 96, doi: 10.1051/0004-6361/201732028
- Gagné et al. (2020) Gagné, J., David, T. J., Mamajek, E. E., et al. 2020. https://arxiv.org/abs/2008.06139
- Gagné & Faherty (2018) Gagné, J., & Faherty, J. K. 2018, Astrophys. J., 862, 138, doi: 10.3847/1538-4357/aaca2e
- Gagné et al. (2018) Gagné, J., Mamajek, E. E., Malo, L., et al. 2018, Astrophys. J., 856, 23, doi: 10.3847/1538-4357/aaae09
- Gaia Collaboration et al. (2018) Gaia Collaboration, Brown, A. G. A., Vallenari, A., Prusti, T., & J, D. B. J. H. 2018, Astron. Astrophys., 616, A1, doi: 10.1051/0004-6361/201833051
- Gaia Collaboration et al. (2016) Gaia Collaboration, Prusti, T., de Bruijne, J. H. J., et al. 2016, Astron. Astrophys., 595, A1, doi: 10.1051/0004-6361/201629272
- Gaidos et al. (2014) Gaidos, E., Mann, A. W., Lépine, S., et al. 2014, Mon. Not. R. Astron. Soc., 443, 2561, doi: 10.1093/mnras/stu1313
- Galli et al. (2018) Galli, P. A. B., Joncour, I., & Moraux, E. 2018, Monthly Notices of the Royal Astronomical Society: Letters, 477, L50, doi: 10.1093/mnrasl/sly036
- Gao (2019) Gao, X. H. 2019, Mon. Not. R. Astron. Soc., 486, 5405, doi: 10.1093/mnras/stz1213
- Gennaro et al. (2012) Gennaro, M., Prada Moroni, P. G., & Tognelli, E. 2012, Mon. Not. R. Astron. Soc., 420, 986, doi: 10.1111/j.1365-2966.2011.19945.x
- Gentile Fusillo et al. (2019) Gentile Fusillo, N. P., Tremblay, P.-E. E., Gänsicke, B. T., et al. 2019, Mon. Not. R. Astron. Soc., 482, 4570, doi: 10.1093/mnras/sty3016
- Gizis et al. (2000) Gizis, J. E., Monet, D. G., Reid, I. N., et al. 2000, Astron. J., 120, 1085, doi: 10.1086/301456
- Gizis & Reid (1997) Gizis, J. E., & Reid, I. N. 1997, Probing the LHS Catalog I. New Nearby Stars and the Coolest Subdwarf, Tech. Rep. 738
- Gizis et al. (2002) Gizis, J. E., Reid, I. N., & Hawley, S. L. 2002, Astron. J., 123, 3356, doi: 10.1086/340465
- Goldman et al. (2018) Goldman, B., Röser, S., Schilbach, E., Moór, A. C., & Henning, T. 2018, The Astrophysical Journal, 868, 32, doi: 10.3847/1538-4357/aae64c
- Gould et al. (1996) Gould, A., Bahcall, J. N., & Flynn, C. 1996, Astrophys. J., 465, 759, doi: 10.1086/177460
- Haakonsen & Rutledge (2009) Haakonsen, C. B., & Rutledge, R. E. 2009, The Astrophysical Journal Supplement Series, 184, 138, doi: 10.1088/0067-0049/184/1/138
- Hänninen & Flynn (2002) Hänninen, J., & Flynn, C. 2002, Mon. Not. R. Astron. Soc., 337, 731, doi: 10.1046/j.1365-8711.2002.05956.x
- Hawley et al. (1996) Hawley, S. L., Gizis, J. E., & Reid, I. N. 1996, Astron. J., 112, 2799, doi: 10.1086/118222
- Holberg & Bergeron (2006) Holberg, J. B., & Bergeron, P. 2006, Astron. J., 132, 1221, doi: 10.1086/505938
- Hunter (2007) Hunter, J. D. 2007, Computing in Science & Engineering, 9, 90, doi: 10.1109/MCSE.2007.55
- Ivanov et al. (2015) Ivanov, V. D., Vaisanen, P., Kniazev, A. Y., et al. 2015, Astron. Astrophys., 574, 64, doi: 10.1051/0004-6361/201424883
- Jackson et al. (2012) Jackson, A. P., Davis, T. A., & Wheatley, P. J. 2012, Mon. Not. R. Astron. Soc., 422, 2024, doi: 10.1111/j.1365-2966.2012.20657.x
- Jayawardhana et al. (2006) Jayawardhana, R., Coffey, J., Scholz, A., Brandeker, A., & van Kerkwijk, M. H. 2006, Astrophys. J., 648, 1206, doi: 10.1086/506171
- Jeffers et al. (2018) Jeffers, S. V., Schöfer, P., Lamert, A., et al. 2018, Astron. Astrophys., 614, 76, doi: 10.1051/0004-6361/201629599
- Jones et al. (2011) Jones, D. O., West, A. A., & Foster, J. B. 2011, Astron. J., 142, doi: 10.1088/0004-6256/142/2/44
- Jones et al. (2015) Jones, J., White, R. J., Boyajian, T. S., et al. 2015, Astrophys. J., 813, 58, doi: 10.1088/0004-637X/813/1/58
- Kenyon & Hartmann (1995) Kenyon, S. J., & Hartmann, L. 1995, Astrophys. J. Suppl. Ser., 101, 117, doi: 10.1086/192235
- Kesseli et al. (2018) Kesseli, A. Y., Muirhead, P. S., Mann, A. W., & Mace, G. 2018, Astron. J., 155, 14, doi: 10.3847/1538-3881/aabccb
- Kiman et al. (2019) Kiman, R., Schmidt, S. J., Angus, R., et al. 2019, Astron. J., 157, 231, doi: 10.3847/1538-3881/ab1753
- Kiraga (2012) Kiraga, M. 2012, ASAS photometry of ROSAT sources. I. Periodic variable stars coincident with bright sources from the ROSAT All Sky Survey. https://arxiv.org/abs/1204.3825
- Kounkel & Covey (2019) Kounkel, M., & Covey, K. 2019, Astron. J., 158, 122, doi: 10.3847/1538-3881/ab339a
- Kowalski & Saumon (2006) Kowalski, P. M., & Saumon, D. 2006, Astrophys. J., 651, L137, doi: 10.1086/509723
- Kraus et al. (2014) Kraus, A. L., Shkolnik, E. L., Allers, K. N., & Liu, M. C. 2014, Astron. J., 147, 146, doi: 10.1088/0004-6256/147/6/146
- Kraus et al. (2011) Kraus, A. L., Tucker, R. A., Thompson, M. I., Craine, E. R., & Hillenbrand, L. A. 2011, Astrophys. J., 728, 48, doi: 10.1088/0004-637X/728/1/48
- Lallement et al. (2014) Lallement, R., Vergely, J.-L., Valette, B., et al. 2014, Astronomy & Astrophysics, 561, A91, doi: 10.1051/0004-6361/201322032
- Lallement et al. (2018) Lallement, R., Capitanio, L., Ruiz-Dern, L., et al. 2018, Astronomy & Astrophysics, 616, A132, doi: 10.1051/0004-6361/201832832
- Laughlin et al. (1997) Laughlin, G., Bodenheimer, P., & Adams, F. C. 1997, Astrophys. J., 482, 420, doi: 10.1086/304125
- Lawson et al. (2002) Lawson, W. A., Crause, L. A., Mamajek, E. E., & Feigelson, E. D. 2002, Mon. Not. R. Astron. Soc., 329, L29, doi: 10.1046/j.1365-8711.2002.05093.x
- Lee et al. (2010) Lee, K. G., Berger, E., & Knapp, G. R. 2010, Astrophys. J., 708, 1482, doi: 10.1088/0004-637X/708/2/1482
- Lepine et al. (2013) Lepine, S., Hilton, E. J., Mann, A. W., et al. 2013, Astron. J., 145, 29, doi: 10.1088/0004-6256/145/4/102
- Lépine et al. (2003) Lépine, S., Rich, R. M., & Shara, M. M. 2003, Astron. J., 125, 1598, doi: 10.1086/345972
- Lépine et al. (2009) Lépine, S., Thorstensen, J. R., Shara, M. M., & Rich, R. M. 2009, Astron. J., 137, 4109, doi: 10.1088/0004-6256/137/5/4109
- Lindegren et al. (2018) Lindegren, L., Hernandez, J., Bombrun, A., et al. 2018, Astron. Astrophys., 616, A2, doi: 10.1051/0004-6361/201832727
- Lodieu et al. (2005) Lodieu, N., Scholz, R. D., McCaughrean, M. J., et al. 2005, Astron. Astrophys., 440, 1061, doi: 10.1051/0004-6361:20042456
- López-Santiago et al. (2010) López-Santiago, J., Montes, D., Gálvez-Ortiz, M. C., et al. 2010, Astron. Astrophys., 514, doi: 10.1051/0004-6361/200913437
- Lorenzo-Oliveira et al. (2016) Lorenzo-Oliveira, D., de Mello, G. F. P., Schiavon, R. P., Porto De Mello, G. F., & Schiavon, R. P. 2016, Astron. Astrophys., 594, L3, doi: 10.1051/0004-6361/201629233
- Luhman et al. (2018) Luhman, K. L., Herrmann, K. A., Mamajek, E. E., Esplin, T. L., & Pecaut, M. J. 2018, The Astronomical Journal, 156, 76, doi: 10.3847/1538-3881/aacc6d
- Lyo et al. (2004) Lyo, A.-R., Lawson, W. A., Feigelson, E. D., & Crause, L. A. 2004, Mon. Not. R. Astron. Soc, 347, 246, doi: 10.1111/j.1365-2966.2004.07194.x
- Lyra & De Mello (2005) Lyra, W., & De Mello, G. F. 2005, Astron. Astrophys., 431, 329, doi: 10.1051/0004-6361:20040249
- Malo et al. (2014a) Malo, L., Artigau, É., Doyon, R., et al. 2014a, Astrophys. J., 788, 81, doi: 10.1088/0004-637X/788/1/81
- Malo et al. (2014b) Malo, L., Doyon, R., Feiden, G. A., et al. 2014b, Astrophys. J., 792, 37, doi: 10.1088/0004-637X/792/1/37
- Mamajek (2016) Mamajek, E. E. 2016, A New Candidate Young Stellar Group at d=121 pc Associated with 118 Tauri, doi: 10.6084/m9.figshare.3122689.v1
- Mamajek & Hillenbrand (2008) Mamajek, E. E., & Hillenbrand, L. A. 2008, Astrophys. J., 687, 1264, doi: 10.1086/591785
- Mann et al. (2015) Mann, A. W., Feiden, G. A., Gaidos, E., Boyajian, T. S., & Braun, K. V. 2015, Astrophys. J., 804, 1, doi: 10.1088/0004-637X/804/1/64
- Mann et al. (2019) Mann, A. W., Dupuy, T., Kraus, A. L., et al. 2019, Am. Astron. Soc., 871, 63, doi: 10.3847/1538-4357/aaf3bc
- Martin & Kun (1996) Martin, E. L., & Kun, M. 1996, Astron. Astrophys. Suppl., 116, 467. 1996A{&}AS..116..467M
- Mochnacki et al. (2002) Mochnacki, S. W., Gladders, M. D., Thomson, J. R., et al. 2002, Astron. J., 124, 2868, doi: 10.1086/343055
- Mohanty & Basri (2003) Mohanty, S., & Basri, G. 2003, Astrophys. J., 583, 451, doi: 10.1086/345097
- Mohanty et al. (2005) Mohanty, S., Jayawardhana, R., & Basri, G. 2005, Astrophys. J., 626, 498, doi: 10.1086/429794
- Morgan et al. (2012) Morgan, D. P., West, A. A., Garcés, A., et al. 2012, Astron. J., 144, 93, doi: 10.1088/0004-6256/144/4/93
- Mulders et al. (2015) Mulders, G. D., Pascucci, I., & Apai, D. 2015, Astrophys. J., 814, 130, doi: 10.1088/0004-637X/814/2/130
- Murphy & Lawson (2015) Murphy, S. J., & Lawson, W. A. 2015, Mon. Not. R. Astron. Soc., 447, 1267, doi: 10.1093/mnras/stu2450
- Murphy et al. (2010) Murphy, S. J., Lawson, W. A., & Bessell, M. S. 2010, Mon. Not. R. Astron. Soc. Lett., 406, L50, doi: 10.1111/j.1745-3933.2010.00879.x
- Ness et al. (2015) Ness, M., Hogg, D. W., Rix, H. W., Ho, A. Y., & Zasowski, G. 2015, Astrophys. J., 808, 16, doi: 10.1088/0004-637X/808/1/16
- Newton et al. (2014) Newton, E. R., Charbonneau, D., Irwin, J., et al. 2014, Astron. J., 147, 24, doi: 10.1088/0004-6256/147/1/20
- Newton et al. (2017) Newton, E. R., Irwin, J., Charbonneau, D., et al. 2017, Astrophys. J., 834, 85, doi: 10.3847/1538-4357/834/1/85
- Núñez et al. (2016) Núñez, A., Agüeros, M. A., Covey, K. R., & López-Morales, M. 2016, Astrophys. J., 834, doi: 10.3847/1538-4357/834/2/176
- Oh et al. (2017) Oh, S., Price-Whelan, A. M., Hogg, D. W., Morton, T. D., & Spergel, D. N. 2017, Astron. J., 153, 257, doi: 10.3847/1538-3881/aa6ffd
- Oliphant (2006) Oliphant, T. E. 2006, A guide to NumPy, Vol. 1 (Trelgol Publishing USA)
- Parker (1955) Parker, E. N. 1955, Astrophys. J., 122, 293, doi: 10.1086/146087
- Paxton et al. (2011) Paxton, B., Bildsten, L., Dotter, A., et al. 2011, Astrophys. Journal, Suppl. Ser., 192, 35, doi: 10.1088/0067-0049/192/1/3
- Paxton et al. (2013) Paxton, B., Cantiello, M., Arras, P., et al. 2013, Astrophys. Journal, Suppl. Ser., 208, 42, doi: 10.1088/0067-0049/208/1/4
- Paxton et al. (2015) Paxton, B., Marchant, P., Schwab, J., et al. 2015, Astrophys. Journal, Suppl. Ser., 220, 44, doi: 10.1088/0067-0049/220/1/15
- Paxton et al. (2018) Paxton, B., Schwab, J., Bauer, E. B., et al. 2018, Astrophys. J. Suppl. Ser., 234, 50, doi: 10.3847/1538-4365/aaa5a8
- Pecaut & Mamajek (2016) Pecaut, M. J., & Mamajek, E. E. 2016, Mon. Not. R. Astron. Soc., 461, 794, doi: 10.1093/mnras/stw1300
- Phan-Bao & Bessell (2006) Phan-Bao, N., & Bessell, M. S. 2006, Astron. Astrophys., 446, 515, doi: 10.1051/0004-6361:20054064
- Platais et al. (1998) Platais, I., Kozhurina-Platais, V., & van Leeuwen, F. 1998, Astron. J., 116, 2423. http://adsabs.harvard.edu/cgi-bin/nph-data{_}query?bibcode=1998AJ....116.2423P{&}link{_}type=ABSTRACT{%}5Cnpapers3://publication/doi/10.1086/300606
- Pöhnl & Paunzen (2010) Pöhnl, H., & Paunzen, E. 2010, Astron. Astrophys., 514, 81, doi: 10.1051/0004-6361/200810855
- Price-Whelan et al. (2018) Price-Whelan, A. M., Sipőcz, B. M., Günther, H. M., et al. 2018, AJ, 156, 123, doi: 10.3847/1538-3881/aabc4f
- Rebull et al. (2018) Rebull, L. M., Stauffer, J. R., Cody, A. M., et al. 2018, doi: 10.3847/1538-3881/aab605
- Reid & Cruz (2002) Reid, I. N., & Cruz, K. L. 2002, Astron. J., 123, 2806, doi: 10.1086/339699
- Reid et al. (2007) Reid, I. N., Cruz, K. L., & Allen, P. R. 2007, Astron. J., 133, 2825, doi: 10.1086/517914
- Reid et al. (1995) Reid, N., Hawley, S. L., & Mateo, M. 1995, MNRAS, 216, 210. http://cdsads.u-strasbg.fr/cgi-bin/nph-iarticle{_}query?1995MNRAS.277..210C{&}data{_}type=PDF{_}HIGH{&}whole{_}paper=YES{&}type=PRINTER{&}filetype=.pdf
- Reiners & Basri (2007) Reiners, A., & Basri, G. 2007, Astrophys. J., 656, 1121, doi: 10.1086/510304
- Reiners & Basri (2008) —. 2008, Astrophys. J., 684, 1390, doi: 10.1086/590073
- Reiners & Basri (2010) —. 2010, Astrophys. J., 710, 924, doi: 10.1088/0004-637X/710/2/924
- Reiners et al. (2012) Reiners, A., Joshi, N., & Goldman, B. 2012, Astron. J., 143, 93, doi: 10.1088/0004-6256/143/4/93
- Riaz et al. (2006) Riaz, B., Gizis, J. E., & Harvin, J. 2006, Astron. J., 132, 866, doi: 10.1086/505632
- Ribas et al. (2017) Ribas, I., Gregg, M. D., Boyajian, T. S., & Bolmont, E. 2017, Astron. Astrophys., 603, A58, doi: 10.1051/0004-6361/201730582
- Riedel et al. (2017) Riedel, A. R., Alam, M. K., Rice, E. L., Cruz, K. L., & Henry, T. J. 2017, Astrophys. J., 840, doi: 10.3847/1538-4357/840/2/87
- Riedel et al. (2014) Riedel, A. R., Finch, C. T., Henry, T. J., et al. 2014, Astron. J., 147, 85, doi: 10.1088/0004-6256/147/4/85
- Robertson et al. (2013) Robertson, P., Endl, M., Cochran, W. D., & Dodson-Robinson, S. E. 2013, Astrophys. J., 764, 3, doi: 10.1088/0004-637X/764/1/3
- Rodriguez et al. (2014) Rodriguez, D. R., Zuckerman, B., Kastner, J. H., et al. 2014, Astrophys. J., 774, doi: 10.1088/0004-637X/774/2/101
- Rodríguez et al. (2016) Rodríguez, E., Rodríguez-López, C., López-González, M. J., et al. 2016, Mon. Not. R. Astron. Soc., 457, 1851, doi: 10.1093/mnras/stw033
- Röser & Schilbach (2020) Röser, S., & Schilbach, E. 2020, {EDP} Sci., 638, A9. https://arxiv.org/abs/2002.03610
- Röser et al. (2011) Röser, S., Schilbach, E., Piskunov, A. E., Kharchenko, N. V., & Scholz, R.-D. 2011, Astronomy & Astrophysics, 531, A92, doi: 10.1051/0004-6361/201116948
- Samus’ et al. (2017) Samus’, N. N., Kazarovets, E. V., Durlevich, O. V., Kireeva, N. N., & Pastukhova, E. N. 2017, Astron. Reports, 61, 80, doi: 10.1134/S1063772917010085
- Schmidt et al. (2015) Schmidt, S. J., Hawley, S. L., West, A. A., et al. 2015, Astron. J., 149, doi: 10.1088/0004-6256/149/5/158
- Schmidt et al. (2016) Schmidt, S. J., Wagoner, E. L., Johnson, J. A., et al. 2016, Mon. Not. R. Astron. Soc., 460, 2611, doi: 10.1093/mnras/stw1139
- Schneider & Shkolnik (2018) Schneider, A. C., & Shkolnik, E. L. 2018, Astron. J., 155, 122, doi: 10.3847/1538-3881/aaaa24
- Schneider et al. (2019) Schneider, A. C., Shkolnik, E. L., Allers, K. N., et al. 2019, Astron. J., 157, 234, doi: 10.3847/1538-3881/ab1a26
- Shields et al. (2016) Shields, A. L., Ballard, S., & Johnson, J. A. 2016, The habitability of planets orbiting M-dwarf stars, doi: 10.1016/j.physrep.2016.10.003
- Shkolnik et al. (2017) Shkolnik, E. L., Allers, K. N., Kraus, A. L., Liu, M. C., & Flagg, L. 2017, Astron. J., 154, 69, doi: 10.3847/1538-3881/aa77fa
- Shkolnik et al. (2009) Shkolnik, E. L., Liu, M. C., & Reid, I. N. 2009, Astrophys. J., 699, 649, doi: 10.1088/0004-637X/699/1/649
- Shkolnik et al. (2011) Shkolnik, E. L., Liu, M. C., Reid, I. N., Dupuy, T., & Weinberger, A. J. 2011, Astrophys. J., 727, 6, doi: 10.1088/0004-637X/727/1/6
- Silaj & Landstreet (2014) Silaj, J., & Landstreet, J. D. 2014, Astron. Astrophys., 566, 132, doi: 10.1051/0004-6361/201321468
- Skinner et al. (2017) Skinner, J. N., Morgan, D. P., West, A. A., Lépine, S., & Thorstensen, J. R. 2017, Astron. J., 154, 118, doi: 10.3847/1538-3881/aa83b5
- Skumanich (1972) Skumanich, A. 1972, Astrophys. J., 171, 565, doi: 10.1086/151310
- Slesnick et al. (2006) Slesnick, C. L., Carpenter, J. M., & Hillenbrand, L. A. 2006, Astron. J., 131, 3016, doi: 10.1086/503560
- Slesnick et al. (2008) Slesnick, C. L., Hillenbrand, L. A., & Carpenter, J. M. 2008, Astrophys. J., 688, 377, doi: 10.1086/592265
- Soderblom (2010) Soderblom, D. R. 2010, Annu. Rev. Astron. Astrophys., 48, 581, doi: 10.1146/annurev-astro-081309-130806
- Soderblom et al. (1991) Soderblom, D. R., Duncan, D. K., & Johnson, D. R. H. 1991, Astrophys. J., 375, 722, doi: 10.1086/170238
- Song et al. (2003) Song, I., Zuckerman, B., & Bessell, M. S. 2003, Astrophys. J., 599, 342, doi: 10.1086/379194
- Song et al. (2004) —. 2004, Astrophys. J., 600, 1016, doi: 10.1086/380086
- Stauffer & Hartmann (1986) Stauffer, J. R., & Hartmann, L. W. 1986, Astrophys. J. Suppl. Ser., 61, 531, doi: 10.1086/191123
- Stauffer et al. (1997) Stauffer, J. R., Hartmann, L. W., Prosser, C. F., et al. 1997, Astrophys. J., 479, 776, doi: 10.1086/303930
- Stelzer et al. (2013) Stelzer, B., Marino, A., Micela, G., López-Santiago, J., & Liefke, C. 2013, Mon. Not. R. Astron. Soc., 431, 2063. https://arxiv.org/abs/arXiv:1302.1061v1
- Taylor (2005) Taylor, M. B. 2005, Astron. Data Anal. Softw. Syst. XIV - ASP Conf. Ser., 347, 29. http://articles.adsabs.harvard.edu/cgi-bin/nph-iarticle{_}query?2005ASPC..347...29T{&}data{_}type=PDF{_}HIGH{&}whole{_}paper=YES{&}type=PRINTER{&}filetype=.pdf
- Terrien et al. (2015) Terrien, R. C., Mahadevan, S., Deshpande, R., & Bender, C. F. 2015, Astrophys. Journal, Suppl. Ser., 220, 16, doi: 10.1088/0067-0049/220/1/16
- Theissen & West (2014) Theissen, C. A., & West, A. A. 2014, Astrophys. J., 794, 146, doi: 10.1088/0004-637X/794/2/146
- Tinney & Reid (1998) Tinney, C. G., & Reid, I. N. 1998, Mon. Not. R. Astron. Soc., 301, 1031, doi: 10.1046/j.1365-8711.1998.02079.x
- Torres et al. (2006) Torres, C. A., Quast, G. R., Da Silva, L., et al. 2006, Astron. Astrophys., 460, 695, doi: 10.1051/0004-6361:20065602
- Tremblay et al. (2011) Tremblay, P. E., Bergeron, P., & Gianninas, A. 2011, Astrophys. J., 730, 128, doi: 10.1088/0004-637X/730/2/128
- Van Der Walt et al. (2011) Van Der Walt, S., Colbert, S. C., & Varoquaux, G. 2011, Computing in Science & Engineering, 13, 22
- Van Saders et al. (2016) Van Saders, J. L., Ceillier, T., Metcalfe, T. S., et al. 2016, Nature, 529, 181, doi: 10.1038/nature16168
- Virtanen et al. (2020) Virtanen, P., Gommers, R., Oliphant, T. E., et al. 2020, Nature Methods, 17, 261, doi: https://doi.org/10.1038/s41592-019-0686-2
- Walkowicz et al. (2004) Walkowicz, L. M., Hawley, S. L., & West, A. A. 2004, Publ. Astron. Soc. Pacific, 116, 1105, doi: 10.1086/426792
- West et al. (2006) West, A. A., Bochanski, J. J., Hawley, S. L., et al. 2006, Astron. J., 132, 2507, doi: 10.1086/508652
- West et al. (2008a) West, A. A., Hawley, S. L., Bochanski, J. J., Covey, K. R., & Burgasser, A. J. 2008a, Proc. Int. Astron. Union, 4, 327, doi: 10.1017/S1743921309031986
- West et al. (2008b) West, A. A., Hawley, S. L., Bochanski, J. J., et al. 2008b, Astron. J., 135, 785, doi: 10.1088/0004-6256/135/3/785
- West et al. (2015) West, A. A., Weisenburger, K. L., Irwin, J., et al. 2015, Astrophys. J., 812, 3, doi: 10.1088/0004-637X/812/1/3
- West et al. (2004) West, A. A., Hawley, S. L., Walkowicz, L. M., et al. 2004, Astron. J., 128, 426, doi: 10.1086/421364
- West et al. (2011) West, A. A., Morgan, D. P., Bochanski, J. J., et al. 2011, Astron. J., 141, 97, doi: 10.1088/0004-6256/141/3/97
- White & Basri (2003) White, R. J., & Basri, G. 2003, Astrophys. J., 582, 1109, doi: 10.1086/344673
- Wielen (1977) Wielen, R. 1977, Astron. Astrophys., 60, 263. http://adsabs.harvard.edu/abs/1977A{%}26A....60..263W
- Wilking et al. (2008) Wilking, B., Gagne, M., & Allen, L. 2008, Handb. Star Form. Reg. Vol. II. ed. B. Reipurth (Tucson, AZ Univ. Arizona Press., 5, 351. https://arxiv.org/abs/0811.0005
- Winters et al. (2019) Winters, J. G., Henry, T. J., Jao, W.-C., et al. 2019, Astron. J., 157, 216, doi: 10.3847/1538-3881/ab05dc
- York et al. (2000) York, D. G., Adelman, J., Anderson, J. E., et al. 2000, Astron. J., 120, 1579, doi: 10.1086/301513
- Zuckerman (2018) Zuckerman, B. 2018, The Nearby, Young, Argus Association: Membership, Age, and Dusty Debris Disks, arXiv, doi: 10.3847/1538-4357/aaee66
- Zuckerman et al. (2006) Zuckerman, B., Bessell, M. S., Song, I., & Kim, S. 2006, Astrophys. J., 649, L115, doi: 10.1086/508060