Jet-driven AGN feedback on molecular gas and low star-formation efficiency in a massive local spiral galaxy with bright X-ray halo ††thanks: Based on data obtained with ALMA through program 2019.1.01492.S and with IRAM through program 08019.
It has long been suspected that powerful radio sources may lower the efficiency with which stars form from the molecular gas in their host galaxy, but so far, alternative mechanisms, in particular related to the stellar mass distribution in the massive bulges of their host galaxies, are not ruled out. We present new, arcsecond-resolution ALMA CO(1–0) interferometry, which probes the spatially resolved, cold molecular gas in the nearby (), massive (), isolated, late-type spiral galaxy 2MASSX J23453269044925, which is outstanding for having two pairs of powerful, giant radio jets, and a bright X-ray halo of hot circumgalactic gas. The molecular gas is in a massive (), 24 kpc wide, rapidly rotating ring, which is associated with the inner stellar disk. Broad ( km s-1) emission lines with complex profiles associated with the radio source are seen over large regions in the ring, indicating gas velocities that are high enough to keep the otherwise marginally Toomre-stable gas from fragmenting into gravitationally bound, star-forming clouds. About 1-2% of the jet kinetic energy are required to power these motions. Resolved star-formation rate surface densities derived from GALEX fall factors 5075 short of expectations from the standard Kennicutt-Schmidt law of star-forming galaxies, and near gas-rich early-type galaxies with signatures of star formation lowered by jet feedback. We argue that radio AGN feedback is the only plausible mechanism to explain the low star-formation rates in this galaxy. Previous authors have already noted that the X-ray halo of J23450449 implies a baryon fraction that is close to the cosmic average, which is very high for a galaxy. We contrast this finding with other, equally massive, and equally baryon-rich spiral galaxies without prominent radio sources. Most of the baryons in these galaxies are in stars, not in the halos. We also discuss the implications of our results for our general understanding of AGN feedback in massive galaxies.
Key Words.:
Galaxies – … – …1 Introduction
The energy injection from active galactic nuclei (AGN) into the interstellar gas of their host galaxy is now a widely accepted mechanism of galaxy evolution, supported mainly by the observation of fast outflows in galaxies associated with powerful AGN (e.g., Morganti et al. 2005; Nesvadba et al. 2006, 2008; Hardcastle et al. 2012; Mahony et al. 2013; Nyland et al. 2013; Harrison et al. 2014; Woo et al. 2016; Karouzos et al. 2016; Fiore et al. 2017; Nesvadba et al. 2017; Mukherjee et al. 2018a; Komossa et al. 2018; Menci et al. 2019; Zovaro et al. 2019; Santoro et al. 2020). About 30% of nearby massive radio galaxies, which host considerable amounts of warm or cold molecular gas (Ocaña Flaquer et al. 2010; Ogle et al. 2010; Dicken et al. 2014), have also been found to have less intense star formation for their molecular gas content than other types of more typical star-forming galaxies (e.g., Nesvadba et al. 2010; Ogle et al. 2010; Alatalo et al. 2011; Lanz et al. 2016). Sabater et al. (2019) found that nuclear radio activity seems to be near-ubiquitous in massive, early-type galaxies with stellar masses, M⊙, making feedback from radio sources in AGN host galaxies a very interesting mechanism to explain the dearth of star formation in many massive galaxies at low and intermediate redshifts.
In spite of the current popularity of these models, AGN feedback is not the only mechanism that has been proposed in the literature to explain the generally low star-formation rates in gas-rich early-type galaxies. Some authors point out, that it would be more natural to explain the low star-formation rates in parts of the galaxy population through the structural properties of the host galaxies or underlying dark-matter halos. Proposed mechanisms include the long gas cooling times of gas heated by the virial shock as it falls into massive dark-matter halos (e.g., White & Rees 1978; Birnboim et al. 2007; Ogle et al. 2019, but see also, e.g., Kereš et al. 2005), the high angular momentum of gas accreted onto massive rotating galaxies (e.g., Renzini 2020; Peng & Renzini 2020), and the high stellar mass surface densities and spheroidal shape of early-type galaxies and massive bulges (Dekel & Burkert 2014; Tacchella et al. 2016; Martig et al. 2009, 2013). Low star-formation rates may also be a consequence of strong bars in spiral galaxies (Fraser-McKelvie et al. 2018). Moreover, massive galaxies reside preferentially in dense environments, where galaxies may lose their gas content rapidly through ram-pressure stripping and interactions with neighboring galaxies, perhaps even before being accreted onto a massive central galaxy (Donnari et al. 2020). In particular such mechanisms would have the advantage that they are universal byproducts of the mass assembly of massive galaxies themselves. Feedback, in contrast, is an additional process which must be assumed to be at work. It is also limited to the activity periods of the supermassive black hole, which can be very short compared to a Hubble time (e.g., Eilers et al. 2017). These scenarios do pose an important challenge to AGN feedback models, because they imply that low star-formation rates and AGN activity in galaxies, even when driving outflows, may be coincidental without requiring a causal, physical link.
A simple, straight forward way to break the degeneracy between radio AGN feedback and those other mechanisms would be to study the interstellar medium and star formation in a massive, gas-rich radio galaxy, which shows signatures of feedback, but which has neither bars, nor a rich environment, nor a bulge or unusually high stellar mass-surface densities. Such galaxies are however very hard to come by, as powerful radio-loud AGN activity is almost inextricably related to massive bulges. For example, Tadhunter (2016) find that % of radio galaxies in the 2 Jy and 3 CR radio samples are hosted by spiral galaxies (typically spirals with massive bulges) over their entire range in stellar mass. Their radio sources are usually compact and populate the low-power end of the radio luminosity function. The fraction of spiral galaxies decreases further when focusing on radio sources with more complex morphologies. For example, Singh et al. (2015) identified only four galaxies with two pairs of radio jets in a sample of 187 000 spiral galaxies, for which they identified radio counterparts in the NVSS and FIRST radio surveys. Such giant, double-lobed radio sources are generally considered evidence of sustained, repeated, AGN activity over long timescales.
Rare, outstanding galaxies can be extremely valuable to understand a more general astrophysical mechanism, if their properties allow us to isolate an individual process that cannot be studied very easily in the dominant galaxy population because of the co-existence of other, potentially rivalling mechanisms producing a similar effect. Showing that radio jets can lower star formation rates in even a single galaxy where competing mechanisms can be ruled out, would demonstrate that jets are in principle capable of doing so also in the overall galaxy population.
Here we present an analysis of newly obtained, arcsecond-resolution ALMA interferometry of CO(1–0) of the nearby, z=0.0755, massive spiral galaxy 2MASSX J23453269044925 (J23450449 hereafter) with a stellar mass of M⊙ and a radio power of W Hz-1 at 1.4 GHz (Bagchi et al. 2014; Walker et al. 2015). The galaxy was first mentioned in the literature by Machalski et al. (2007), and then further discussed by Bagchi et al. (2014), who obtained low-frequency radio observations with the GMRT and optical longslit spectroscopy along the major and minor axis of the 35″ large stellar disk. They identified two pairs of bright, giant radio jets extending over 390 kpc and 1.6 Mpc, respectively, suggesting that radio AGN activity has been on-going for long timescales.
J2345-0449 is particularly suited to investigate the impact of powerful radio activity onto the star formation in its host galaxy, because it shows no indication of several other, potentially rivaling quenching mechanisms: It has a small (1.5 kpc) pseudo-bulge contributing at most 15% of the total stellar mass, which probably formed from secular processes (Bagchi et al. 2014; Kormendy & Kennicutt 2004). It also resides in a poor environment, with only one intermediate-mass neighbor at a distance of 240 kpc (Bagchi et al. 2014). The nuclear spectrum is at the same time that of a Low-Excitation Radio Galaxy (LERG), a Weak-Line Radio Galaxy (WERG Tadhunter et al. 1998), and a LINER (Bagchi et al. 2014), ruling out the presence of strong radiative feedback from a bolometrically bright AGN. Star formation is too weak to drive an outflow (Walker et al. 2015).
Walker et al. (2015) showed with Chandra X-ray imaging that the galaxy is surrounded by a bright X-ray halo, potentially with cavities along the jet axis, which they attribute to hot gas heated by the radio source. They estimated a jet kinetic energy of erg s-1, enough to produce a bright, hot gaseous halo as observed with Chandra out to 80 kpc. The total mass of this halo was recently estimated with XMM-Newton spectroscopy (Mirakhor et al. 2020), and is M⊙ out to the virial radius, corresponding to a baryon fraction of J23450449 that is close to the cosmic average, implying that the underlying dark-matter halo would have retained nearly all its baryons. This is unusual compared to other spiral galaxies with stellar masses of few M⊙, which are rather poor in hot circumgalactic gas (Li et al. 2018), but rich in colder baryons: Posti et al. (2019) find that the most massive galaxies in the SPARCS survey (Lelli et al. 2015) may have stellar-to-dark-matter mass ratios that are near the cosmic average, placing them amongst the sites of most efficient star formation known.
Dabhade et al. (2020) recently observed J23450449 as part of a sample of galaxies with giant radio jets with the IRAM 30-m telescope, and found that J23450449 hosts about M⊙ of cold molecular gas, which is highly unusual for giant radio galaxies, which are generally gas-poor. This result was obtained independently from us and published well after our own IRAM single-dish, and ALMA interferometric datasets had already been taken.
How did J23450449 obtain such unusual properties? Borzyszkowski et al. (2017) and Jackson et al. (2020) have proposed, based on cosmological models of galaxy evolution, that locations near, but outside of massive galaxy clusters may favor the occurrence of massive spiral galaxies with particularly quiescent evolutionary histories. They reason that the node in the Cosmic Web traced by the cluster would serve as an attractor to neighbouring galaxies which would otherwise have produced merging events destroying the large stellar disk. J23450449 only has three neighbors at kpc distance, but lies in the wider vicinity of the massive, X-ray galaxy cluster RBS 2042 at 2.8 Mpc distance. This may perhaps explain why this galaxy could retain its late-type spiral structure until today. The reason why the supermassive black hole in this galaxy has developed such an outstanding radio source is currently unclear. Bagchi et al. (2014) discuss several hypotheses. This does not hinder us to investigate the effect of the radio source on the interstellar medium and the on-going star-formation based on the galaxy properties that we can observe in-situ.
We will in the following describe our observations of the molecular gas and stellar continuum of J23450449, and discuss our results in the light of AGN feedback and star formation in massive galaxies. We will start with presenting the new data set and ancillary, publicly available data that we used for our analysis in Section 2 before deriving additional properties of the stellar population that will be needed for the subsequent analysis (Section 3). In Section 4 we will discuss the properties of the newly discovered molecular ring, the gas kinematics and gas mass surface density, before showing in Section 5 how they relate to the kpc-scale structure of the radio source seen in FIRST. In Section 6 we demonstrate that the resolved star-formation rate densities and gas mass surface densities place J23450449 firmly below the sequence formed by spiral galaxies with normal star formation in the Kennicutt-Schmidt and alaternative star-formation laws, and into the realm of gas-rich early-type radio galaxies with signatures of heating of molecular gas through radio jets. In the same section we also examine the rotational support of the gas with help of the Toomre criterion. In Section 7 we discuss the implications of our results and previous X-ray observations for AGN feedback from radio jets and alternative mechanisms. We summarize our work in Section 8.
Throughout the paper we use the flat CDM cosmology from Planck Collaboration et al. (2018) with km s-1 Mpc-1, , and . At the luminosity distance is Mpc, kpc are projected onto one arcsecond.
2 Observations and data reduction
2.1 IRAM/EMIR single-dish observations
We initially obtained 3 mm single-dish data of J2345-0449 with the wide-band millimeter receiver EMIR at the 30-m telescope of IRAM in one short, 7.5 hrs run on 3 July, 2019 under program-ID 080-19 (PI Nesvadba). The receiver was tuned to 107.179 GHz, the expected frequency of CO(1–0) for a redshift z=0.0755. We used the FTS and WILMA backends with Wobbler switching throws of 60″, which is significantly larger than the diameter of our source. To point the telescope we used blind offsets from a nearby quasar, and performed a pointing about every 2 hrs. The telescope was refocused after 4 hrs.
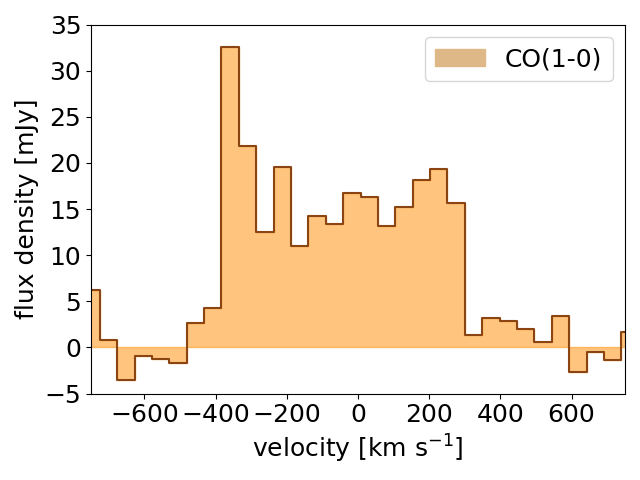
Data were calibrated at the telescope and reduced with the CLASS package of the GILDAS software of IRAM (Gildas Team 2013). Each individual scan was inspected by eye, and we used simple first-order polynomials to remove the baselines, after carefully masking the spectral range where we expected CO(1–0) to fall. We used the values given on the EMIR website111http://www.iram.es/IRAMES/mainWiki/Iram30mEfficiencies to translate the measured brightness temperatures into units of flux density (Jy). Fig. 1 shows that the line is well detected at the expected frequency, with a clear, although asymmetric, double-horn profile of FWHM=68418 km s-1 and an integrated line flux of Jy km s-1. A similar spectrum has recently been obtained by Dabhade et al. (2020) who measured a somewhat greater integrated line flux of 14.0 Jy km s-1. The difference might be due to calibration uncertainties. We will in the following use our own measurement as a single-dish reference when discussing the new ALMA interferometry.
2.2 ALMA CO(1–0) interferometry
Our ALMA data were taken with the 12 m-array on 17 October, 2019, through observing program 2019.1.01492.S (PI Nesvadba). We used 47 antennae in the 3 mm band at a representative frequency of 107.179 GHz with the 43-3 configuration. The on-source observing time was 1179.36 sec, which we obtained under average conditions with a column of precipitable water vapor, mm. The quasar J00060623 was used as bandpass and flux calibrator. We used the Common Astronomy Software Application (CASA) version 5.6 to reduce the data, applying the automatic flagging of visibilites, to calibrate the bandpass, phase, amplitude and flux. Synthesized beam-deconvolved data cubes were constructed with CLEAN, using briggs weighting with . The spatial sampling of the final data cube is 0.2″, and spectral channel sizes are 11 km s-1. The rms is 332 Jy bm-1. The beam size of the synthesized data cube is 1.32″1.07″, with a position angle of 273.2∘. The detailed analysis of this data set is described in Section 4.
2.3 Ancillary data
We complement these new proprietary data with several publicly available data sets of J23450449. To study the optical and near-infrared stellar continuum in our source, we obtained u, g, r, i, and z-band imaging from the SDSS data release 16, as well as near-infared J, H, and Ks band imaging from 2MASS. Moreover, we retrieved the fully reduced and calibrated GALEX Near and Far-UV imaging and the WISE infrared imaging from the respective archives.
J23450449 also has 1.4 GHz imaging available that was obtained at the Very Large Array as part of the FIRST survey in the B-array (Becker et al. 1995). The beam size is 5″, and the depth at the position of J23450449 is rms=0.37 mJy bm-1. The core and lobes of J23450449 are well resolved. The lobes span 1.6 Mpc, making J23450449 one one of the largest radio sources on the sky (Bagchi et al. 2014). The core has an integrated flux density of 4.4 mJy in FIRST and extends from the nucleus to about 10″ north north west (Fig. 8).
3 J23450449 as a massive spiral galaxy
3.1 Bulge-disk decomposition
We will in the following give separate mass estimates for the bulge and disk of J24350449. Bagchi et al. (2014) already decomposed the optical continuum of J23450449 into a bulge and a disk component, finding bulge sizes of kpc, i.e., 0.6″-0.8″, and a low contribution of the bulge to the total optical luminosity of 14-18%, depending on the band.
However, they did not quantify the stellar mass in each component. This is best done in the near-infrared, where the mass-to-light ratio of stellar populations does not depend as strongly on the star-formation history as in the optical (e.g., Bell et al. 2003). We therefore provide a new estimate, using the J-band image from 2MASS. J-band is favored over the K-band because of the higher image quality.
To separate the bulge from the disk component, we construct an azimuthally averaged surface-brightness profile with the Python implementation of the Ellipse package (Jedrzejewski 1987), and use the LM-fitting routine of Markwardt (2012) to model this profile with two Sersic functions, each convolved with a two-dimensional Gaussian to take into account the seeing.
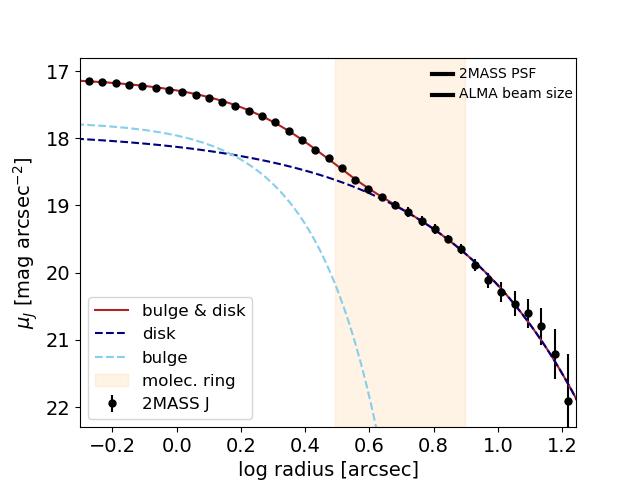
The result is shown in Fig. 2. The surface-brightness profile of J23450449 in the J-band is well fitted with two Sersic components, that are convolved with a Gaussian kernel of , to approximate the size of the seeing disk in the 2MASS image. For the central bulge component, we find a Sersic parameter, , and for the disk component, . Corresponding effective radii are 1.7″ and 8.1″, respectively. These Sersic parameters are within the range of those previously found by Bagchi et al. (2014) in the optical, however, the effective radii are systematically larger. The seeing is comparable in the optical and near-infrared data, however, the spatial sampling in the 2MASS data is much coarser, with 1″ pixel size, and the signal-to-noise ratio is lower, in particular in the outer disk. This does not affect the main purpose of our fit, which is to constrain the observed radius where the bulge blends into the disk, but it might affect the detailed fit results, in particular the measured radii. In the following we will consider all light emitted from within 3″ of the nucleus as coming from the bulge, and light from outside that radius as coming from the disk.
3.2 Stellar masses, and stellar mass surface densities
Massive spiral galaxies have likely formed most of their stars in rapid bursts of star formation at high redshift (Zhou et al. 2020). To translate the J-band magnitudes and surface brightnesses of J23450449 into estimates of stellar mass and mass surface density, we therefore used the population synthesis models of Bruzual & Charlot (2003) to estimate the mass-to-light ratios, , of a fiducial 10-Gyr old stellar population formed in a fairly short (200 Myr) period of constant star formation of 50 M⊙ yr-1, as is frequently observed in massive galaxies at redshifts z2. For these parameters we find .
At a luminosity distance of Mpc, J23450449 has an absolute J-band magnitude of 12.7 mag, corresponding to a stellar mass of M M⊙. This is somewhat less than the previous estimate of M M⊙ found by Walker et al. (2015), who used the integrated K-band magnitude of J23450449 and a fiducial mass-to-light ratio of taken from Bell et al. (2003). A systematic discrepancy of 25% is acceptable for the purpose of our analysis, and corresponds, e.g., to the difference in the J-band mass-to-light ratio of a stellar population with 10 and 12 Gyrs of age, respectively. Providing a more robust estimate would require detailed population synthesis modeling of the star-formation history, as will be possible when our VLT/MUSE observations will become available, which have been delayed due to the Covid-19 shutdown of the VLT.
Individual integrated magnitudes of the bulge and disk component of J23450449 are 13.9 mag and 13.1 mag, respectively, corresponding to stellar masses of M⊙ and M⊙, respectively, assuming that both have old stellar populations. Corresponding stellar mass surface densities are M⊙ pc-2 and M⊙ pc-2 for the bulge and disk, respectively.
Values of pc-2 are typical for bulges of spiral galaxies, including of lower mass, and for early-type galaxies (e.g., Kauffmann et al. 2003; Fang et al. 2013; González Delgado et al. 2015). Likewise, stellar mass surface densities of pc-2 are not untypical for late-type galaxies over large ranges in stellar mass (e.g. Kauffmann et al. 2003; Fang et al. 2013; González Delgado et al. 2015). Thus, J23450449 may have an extraordinarily large integrated stellar mass for being a spiral galaxy, however, the mass surface densities are not outstanding. J23450449 is more massive than other spiral galaxies, because it is more extended, not because it has a higher stellar mass surface density in either the bulge or the disk.
3.3 Star formation
Estimating star-formation rates in AGN host galaxies is notoriously difficult, as most tracers can be contaminated by the AGN. We integrated the far-UV flux in the GALEX image of J23450449, finding Jy, which corresponds to an integrated star-formation rate of yr-1. We derived this estimate with the relationship of Kennicutt (1998b), but adopted the today more widely used Kroupa (Kroupa 2001) stellar initially mass function instead of that of Salpeter (Salpeter 1959), as Kennicutt (1998b) did initially. The uncertainty includes only the error of the measurement, not the systematic uncertainties. Dabhade et al. (2020) estimated M⊙ yr-1 from the 22 m flux measured with WISE, whereas Walker et al. (2015) found SFR=1.6 M⊙ yr-1 from the same GALEX UV continuum that we also used. Both adopted a Salpeter initial mass function. We estimated a star-formation rate by combining the UV and IR measurements into a single estimator, using the relationship of Leroy et al. (2008). They approximate the star-formation rate by setting . We use the FUV intensity measured with GALEX, , and the 22 m intensity corresponding to the magnitude given by Dabhade et al. (2020), mag. This gives a very similar value to our above estimate using GALEX alone, yr-1, with a best estimate of M⊙ yr-1. This suggest that the UV does not miss significant amounts of star formation in this galaxy.
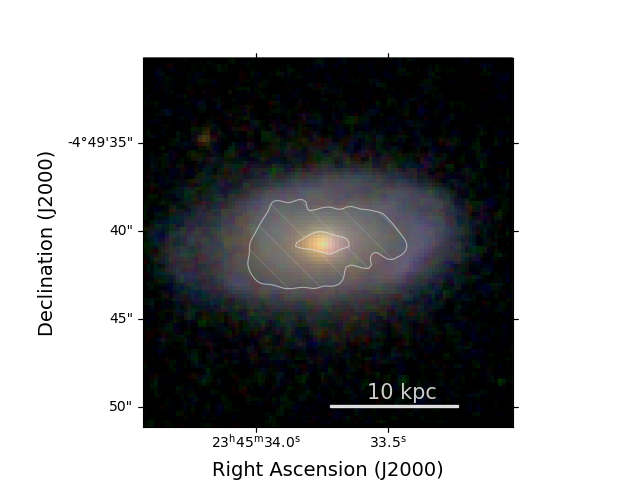
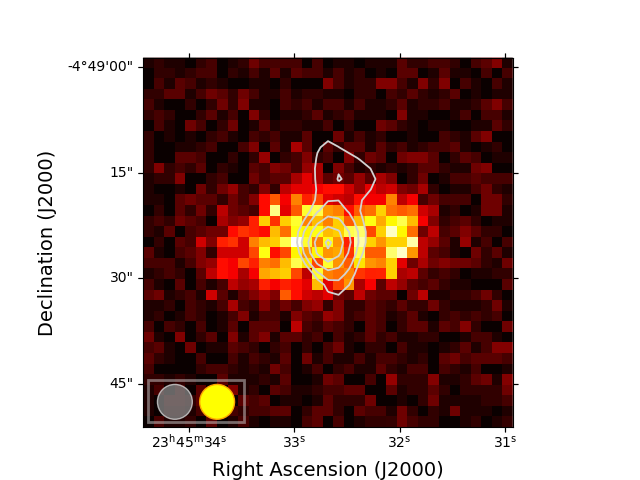
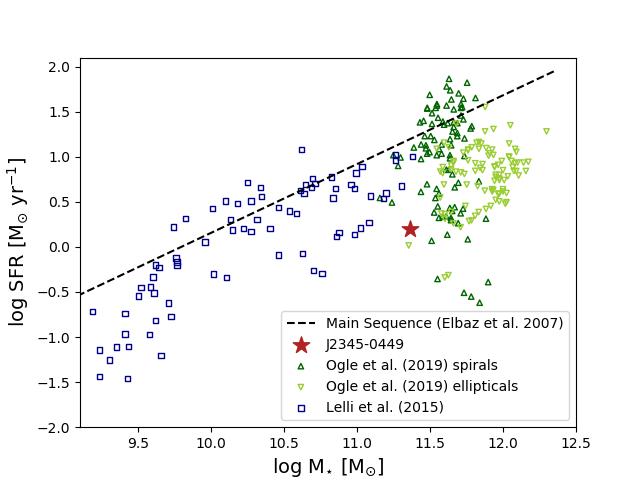
The GALEX and WISE imaging also allow us to investigate where the star formation in J23450449 is located relative to the molecular gas, radio jet, and stellar disk. The left panel of Fig. 3 shows the near-UV image of J23450449, which is well resolved at PSF5″, and has a relatively uniform surface-brightness distribution without signature of a nuclear point source. Diffuse UV emission is detected over an area with a deconvolved size of 28.6″ 14.0″, corresponding to 43 kpc 21 kpc, i.e., over most of the size of the 50 kpc large stellar disk. Peak surface brightnesses are reached in the eastern and western regions of the disk, and do not coincide with the position of the radio source shown as contours. From the deconvolved size estimate of the disk and the integrated SFR=1.25 M⊙ yr-1, we estimate an average star-formation rate surface density of M⊙ yr-1 kpc-2. Local minima and maxima correspond to M⊙ yr-1 kpc-2.
The spatial resolution of the WISE 22 m image (not shown), which has a point spread function of ″, is even less than that of GALEX, making it difficult to use to estimate star-formation rate surface densities. However, WISE does resolve the disk of the galaxy, with a measured major-axis size of ″, corresponding to 25.7″ after correcting for the PSF. This is comparable to the spatial extent of the UV emission, suggesting that both FIR and UV are emitted from the same regions of the galaxy.
In the right panel of Fig. 3 we show where J23450449 falls relative to the main sequence of star-forming galaxies of Elbaz et al. (2007), and other samples of spiral and elliptical galaxies taken from Ogle et al. (2019) and Lelli et al. (2015), which both include very spiral galaxies with M⊙. J23450449 falls 0.95 dex below the ridge-line of Elbaz et al. (2007), and near the low end of star-formation activity of massive spiral galaxies generally. Interestingly, as also shown in Fig. 3, the star-formation rate is also at the low end of the range spanned by elliptical galaxies in the same mass range. With SFR=1.25 M⊙ and M M⊙, the specific star-formation rate of J23450449 is sSFR= Gyr-1.
3.3.1 Radio source
Singh et al. (2015) found only four spirals with multiple pairs of radio jets in a sample of over 187 000 spiral galaxies. Current samples of very massive (M M⊙) spiral galaxies are very small, and do not allow for a systematic analysis, however, we investigated the radio morphologies of all massive spiral galaxies in the samples of Lelli et al. (2015) and Ogle et al. (2019) in the NVSS and FIRST surveys (32 sources in total), and did not identify a single galaxy with a radio morphology akin to that of J23450449. Galaxies with radio AGN are usually point sources in FIRST at 5″ beam size. Sources which are extended have morphologies that follow the stellar disk, sometimes even showing the same spiral structure. Their radio luminosities are also consistent with being related to star formation, not AGN activity. It is difficult to draw firm quantitative conclusions from these sources, since they are not taken from a complete sample. However, they are at least consistent with powerful radio jets being rare in spiral galaxies with stellar masses M⊙, further highlighting the exceptional nature of J23450449 already pointed out by Singh et al. (2015).
4 The molecular ring of J23450449
4.1 CO(1–0) morphology
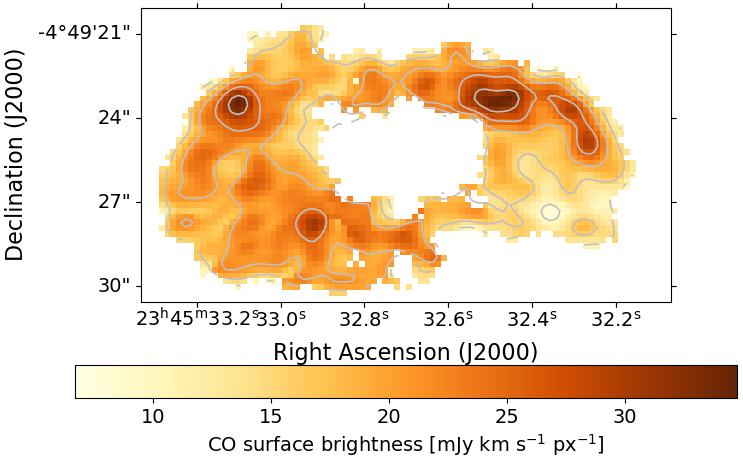
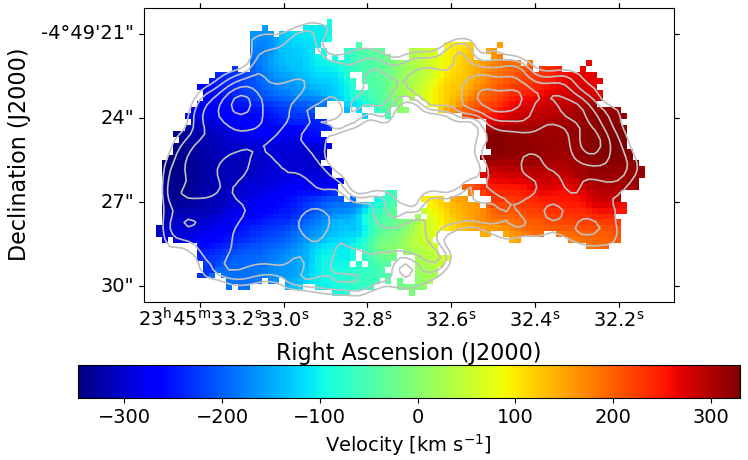
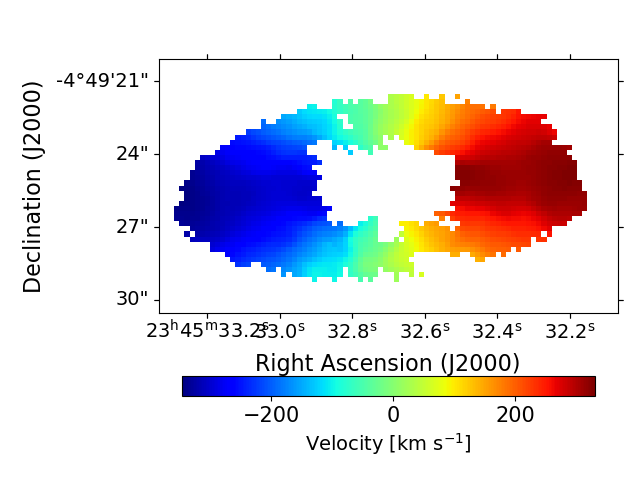
Fig. 4 shows the maps of CO(1–0) that we obtained with ALMA. The molecular gas is in a large ring with an outer radius of 7.9″4.4″ (11.8 kpc6.6 kpc), and has a strong gradient of projected velocities of 67625 km s-1 increasing from West to East. For an inclination angle of (Bagchi et al. 2014, see also §4.2), this corresponds to a deprojected, intrinsic velocity offset of 78925 km s-1. We saw in Section 3.2 that the size of the bulge in the J-band is somewhat larger, 3″, but can be accomodated within the measurement uncertainties set by the large pixel scale and size of the seeing disk (both are 1″).
We do not detect any CO(1–0) line emission inside a region of 2.8″1.5″ from the nucleus, corresponding to a diameter of 4.2 kpc2.2 kpc at the redshift of J23450449, and down to a flux limit of r.m.s.=332 Jy bm-1. This is more than twice the effective radius of the stellar bulge in the SDSS r-band image, kpc, the largest size measured by Bagchi et al. (2014). We can therefore safely conclude that the molecular gas is associated with the inner disk of J23450449, and avoids the bulge. This is a significant difference to quasars, for which disks of molecular gas are found to have much smaller radii of kpc, e.g., Molina et al. (2021). The morphology is fairly irregular, showing several bright clouds with sizes of 1″(1.5 kpc), and potentially, gas that is following the spiral arm structure in the north-western part of the ring. The radial width of the ring varies from a minimum of 2.0″ (3.0 kpc) along around in the southern part to 5.7″ (8.5 kpc) along around (position angle PA is measured counterclockwise from north towards east). Given the irregular overall morphology, this cannot be attributed only to projection effects. The ring extends to a smaller radius than that of the stellar disk seen with the SDSS (which has a radius of 16.9″ in the -band image of the SDSS down to 3, Fig. 2). This corresponds to 25.2 kpc at the redshift of J23450449.
The total line flux is Jy km s-1, comparable to what was previously found in the single-dish observations of Dabhade et al. (2020, Jy km s-1) and our own measurements ( Jy km s-1). We suspect that the reason for the difference is the large diameter of the ring, which we trace out to 19.6″, comparable to the half-power beamsize of the IRAM 30-m telescope of 22.9″ at the observed frequency. Line emission at large radii would be attenuated by the lower efficiency in the outer regions of the beam of the 30 m telescope of IRAM.
To test more quantitatively whether this is a viable explanation, we convolve the ALMA map with a two-dimensional Gaussian distribution with FWHM widths corresponding to the beam size of the 30-m telescope, and centered on the position at which we pointed the telescope. We find a total flux of Jy km s-1. This is less than from the integrated flux of mJy we measure with the 30 m telescope, and slightly lower than the 14 Jy km s-1 found by Dabhade et al. (2020), and suggests that the large size of the ring compared to the telescope beam is indeed the likely cause of the lower flux measurement in the single-dish data. For our ALMA observations this implies that we have recovered at least 94% of the single-dish flux, if the Dabhade et al. (2020) estimate is closer to the actual flux of J2345-0449. If our estimate is more accurate, it would suggest a systematic uncertainty in the relative flux calibration of about 3%, which is also very plausible. In either case, we can conclude that the amount of missing flux is small, and we will neglect it in our following analysis.
4.2 Gas kinematics
To extract spatially-resolved information about the molecular gas kinematics in this galaxy we constructed spectra from square apertures with 1.0″1.0″ in size in a data cube with 11 km s-1 wide spectral channels, comparable to the beam size, and as broad as possible to measure line widths for the molecular gas. We then fitted each spectrum with a single Gaussian component. This was done for all pixels with signal-to-noise ratio in an emission-line map constructed from directly integrating all flux in the redshift range where line emission was detected. Typical signal-to-noise ratios per spectral channel at the line peak were between 3 and 6 for the broad, and 8 to 11 for the narrow emission lines.
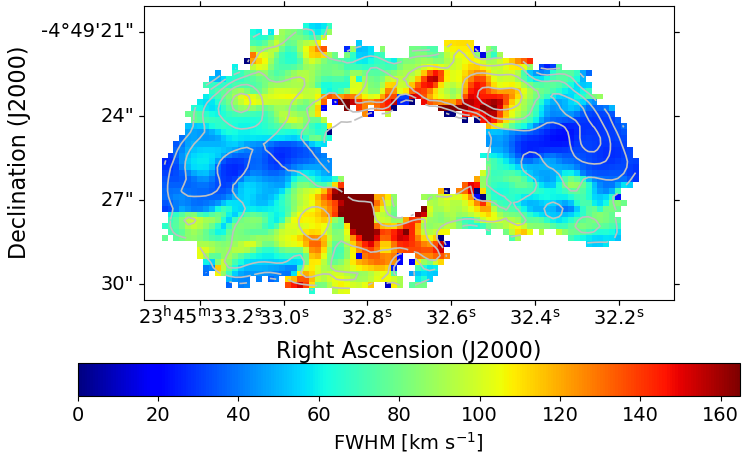
Fig. 4 shows the results: In the left panel, the integrated line flux derived from the single-Gaussian fits can be seen, indicating several massive gas clouds embedded into an extended, irregular ring. The central panel shows the local gas velocities as measured from the centroids of the single-component Gaussian line profiles, given relative to a redshift (Bagchi et al. 2014). The right panel shows the FWHM line widths in each aperture.
4.3 Fourier-analysis of the large-scale velocity field
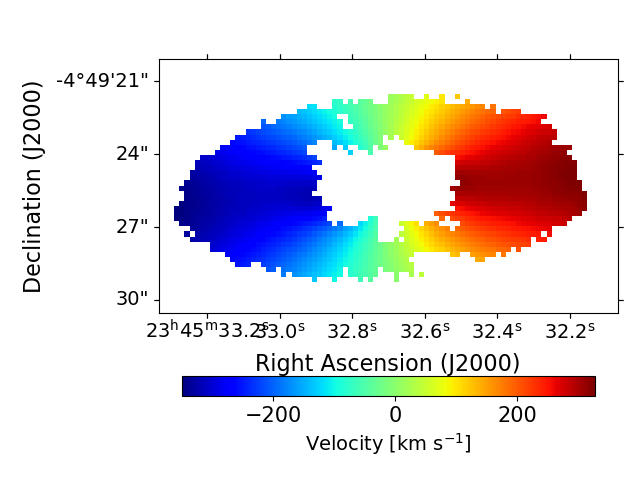
The gas velocities in J23450449 are very regular and increase smoothly from east to west as expected from rotation within the gravitational potential of the host galaxy (central panel of Fig. 4). We used Kinemetry (Krajnović et al. 2006) to describe the velocity distribution more quantitatively. Kinemetry performs a fifth-order Fourier analysis of the kinetic moments of the line-of-sight velocity distribution of a gas disk or ring along concentric ellipses, thereby representing a generalization of the classical surface photometry. It is a standard tool to analyze data cubes obtained with integral-field spectrographs. The ring of J23450449 is well spatially resolved with a total of about 30 individual spatial resolution elements, so that a detailed analysis as done with Kinemetry can be expected to yield meaningful results.
Kinemetry requires that the centroid position and inclination angle of the disk are fitted externally. To do so, we used the gas morphology, which we fitted with the Python implementation of the IRAF task ellipse (Jedrzejewski 1987). We find that the ring is centered on position (J2000) RA=23:45:32.708, Dec=-04:49:25.42, where ALMA also shows a faint ( mJy) radio continuum point source, presumably the nucleus. The position angle on the sky is , and the inclination angle , the same values previously also found for the stellar component by Bagchi et al. (2014). This is another indication that most of the gas in the disk, as measured from the line centroids, rotates largely unperturbed within the gravitational potential of the host galaxy.
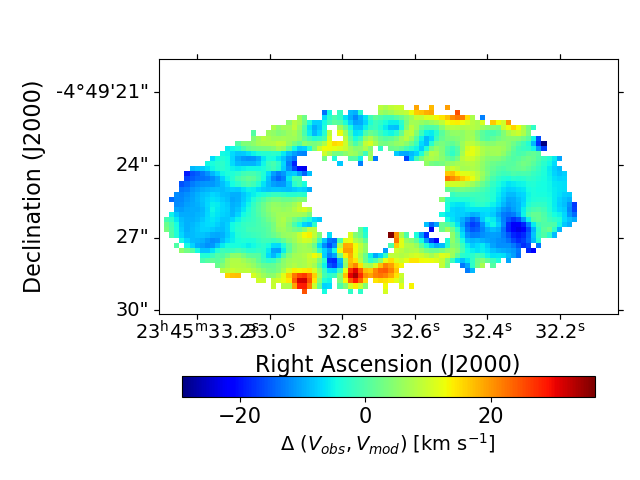
A comparison of the observed and modeled velocity distributions in the ring (corresponding to the velocity map) is shown in Fig. 5. Differences are small and difficult to discern by eye. The right panel of the figure shows the residual map obtained from subtracting the model from the measured velocity distribution. Residuals are less than about km s-1 in most of the disk, or % of the measured total velocity offset, with somewhat greater offsets ( km s-1) along the outer rim. Parts of these differences may also come from complex line profiles which may affect the centroid position of the single-Gaussian fits. We have also compared offsets between higher kinetic moments, finding that model and observations agree generally within about 2%. To summarize, gas velocities in the ring as probed by the line centroids do not show significant deviations from rotational motion within the gravitational potential of J23450449.
4.4 Position-velocity diagram
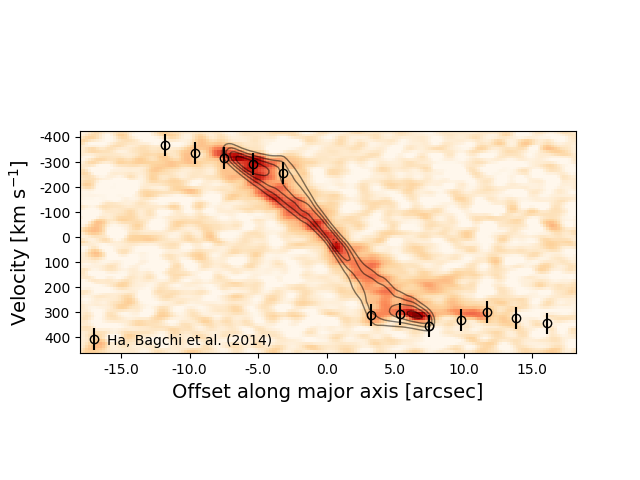
Another way to visualize the good agreement of the gas kinematics in the ring of J2345-0449 with rotational motion is by analyzing the position-velocity (PV) diagram shown in Fig. 6. Distances are measured from the nucleus of the galaxy along the morphological and kinematic major axis of the galaxy at . The Figure shows a near-linear decline in observed velocity from east to west out to kpc on either side, where velocities flatten, suggesting that the ring samples the rotation curve at radii just outside the turnover radius. Contours show the PV-diagram of the best-fit model obtained with Kinemetry for comparison (§4.3). The slight mismatch between the observed and modeled ring in the eastern hemisphere is caused by the irregular surface-brightness distribution of the ring, which was not taken into account in the modeled data set. Overall, the figure shows few residuals in the data with the exception of faint line emission to the outermost radii in the western part of the disk.
We further overplot the rotation curve obtained previously by Bagchi et al. (2014) from H longslit spectroscopy extracted along the morphological major axis of the disk. Both gas components show very similar kinematics, suggesting that both arise from the same structure. However, H samples the gas out to larger radii. The warm ionized gas seems also to extend somewhat further inward that the molecular gas. However, Bagchi et al. (2014) report a dearth of H within a radius of 1.5″ from the nucleus, where they detect only [NII]6548, 6583. It is therefore possible that most of the warm ionized gas is also in a ring rather than a disk. The faint line emission found in the extreme outer western part of the ring follows the velocities measured in H, and may be a faint molecular component emitted from the same environment.
The circular velocity of the ring in J23450449 obtained from this fit is km s-1, derived from the projected (observed) velocity of = 316 km s-1 at the turnover radius of 5.2 kpc, and corrected for an inclination of . The turnover radius is probably an upper limit, given that it falls near the inner edge of the ring.
Fig. 6 also shows that this velocity is consistent with the velocity previously found by Bagchi et al. (2014) from H at the same radius. Their asymptotic circular velocity estimate, km s-1 is however larger, since H samples the velocity curve out to larger radii, and velocities continue to increase slowly, in particular on the eastern side of the ring. The enclosed dynamical mass within the turnover radius, , is M⊙, corresponding to about 44% of the integrated stellar mass (§3.2). This is not much larger than the stellar mass previously estimated for the bulge (§3.2), showing that the dark-matter content in the central regions of J23450449 is low.
4.5 Line widths
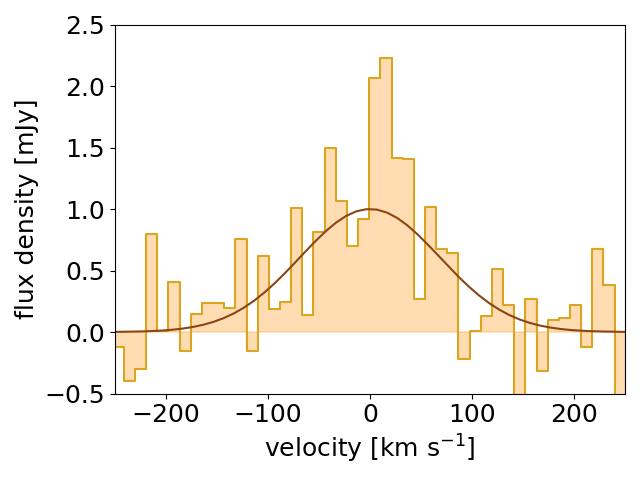
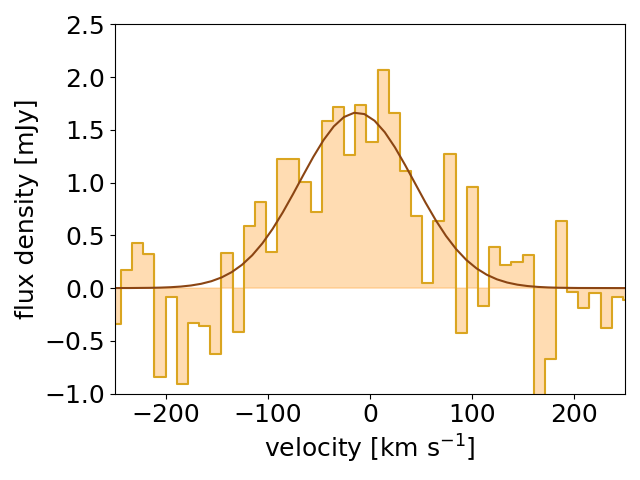
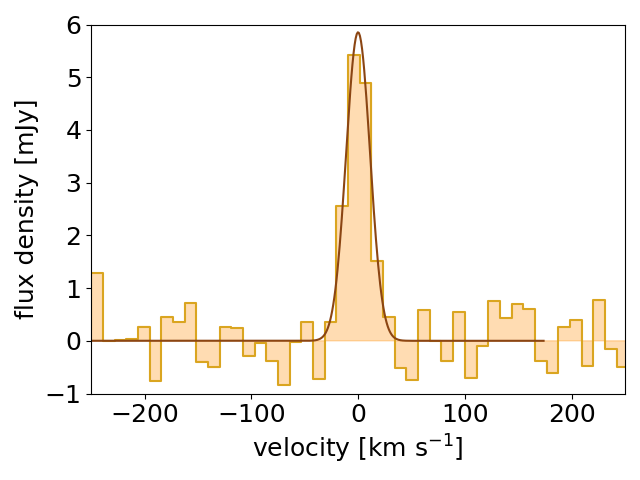
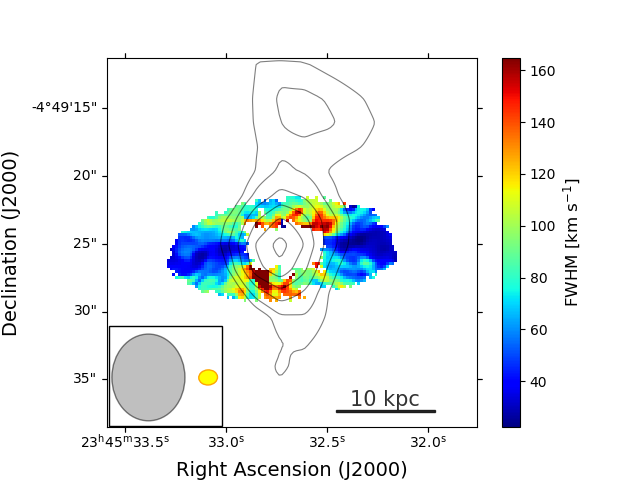
In spite of the smooth velocity map, the CO line profiles are very irregular, and full-widths at half maximum (FHWMs) of the CO emission lines change rapidly throughout the ring, increasing from a minimum of about 20 km s-1 in the eastern and western parts of the ring to more than 120 km s-1 in the northern and southern region as seen in projection (Fig. 4). Overall, we observe significant line broadening over large ranges in position angle, from to , and from to . Generally, line widths are greater in the inner regions of the ring (Fig. 4).
A closer look at the line profiles in individual pixels also shows that the gas kinematics are strongly perturbed. We identify secondary components in regions of narrow line widths, and in the transition regions between narrow and broad line emission. In the regions of broadest widths, however, the line profiles appear fairly smooth, consisting of a single component, at least at the spatial and spectral resolution of our data (Fig. 7).
4.6 Integrated molecular gas mass and gas mass surface densities
We use Equation 3 of Solomon et al. (1997) to estimate a molecular gas mass from the CO flux measurement, by setting , where is the observed frequency, the redshift, and the luminosity distance of our target. For an observed integrated CO(1–0) line flux of Jy km s-1, we find L′ = K km s-1 pc2. For a CO-to- conversion factor of [K km s-1 pc2]-1, commonly used for nearby spiral and early-type galaxies (e.g., Bolatto et al. 2013), we find a total molecular gas mass of M M⊙. We did not include a correction for He and other metals, if we had, this mass estimate would be 36% higher, M M⊙.
This is at par with cold molecular gas masses previously measured from CO(1-0) in the most gas-rich, nearby, classical radio galaxies like 3C 293, 3C 84, or 4C 12.50. However, these are typically S0 galaxies rather than classical elliptical galaxies. The most gas-rich elliptical radio galaxies have cold molecular gas masses of at most few M⊙ (Ocaña Flaquer et al. 2010, see also the compilation of Lanz et al. 2016, and references therein), factors of a few greater than typical gas masses in quiescent radio galaxies (Tadhunter 2016). In exceptional cases, gas-rich elliptical galaxies can have warm molecular gas masses from shocked gas, presumably by the AGN, equal to or even above M⊙ in the most extreme cases (Ogle et al. 2010). A similar mass range, M⊙, is also suggested by Herschel/SPIRE measurements of the dust mass in radio AGN host galaxies drawn from the 2 Jy sample by Dicken et al. (2014), assuming gas-to-dust ratios of 140.
Since we have spatially well resolved measurements of the molecular gas in the ring, we can also estimate the local gas mass surface densities in individual 1.5 kpc apertures, corresponding to the 1″ beam size. Assuming that a single CO-to-H2 conversion factor of M⊙ [K km s-1 pc2]-1 applies throughout J23450449, the average of the molecular gas mass surface densities for the 381 kpc2 surface of the ring is M⊙ pc2, with a median of M⊙ pc-2, and a maximum surface density of M⊙ pc-2 reached in the brightest clouds.
These gas mass surface densities are at the upper end, but still comparable to those found in other spiral galaxies, and at the lower end of starbursts (e.g., Kennicutt 1998b). They are also in the range of those of massive early-type radio galaxies with large amounts of molecular gas studied by Ogle et al. (2010) and Lanz et al. (2016).
5 Signatures of AGN-driven gas kinematics
Fig. 4 showed that the molecular gas in J23450449 is in a large molecular ring associated with the stellar disk of the host galaxy, which is rapidly rotating, and shows strongly increased line widths up to km s-1 in the northern and southern part of the ring. We will now discuss this line broadening in more detail, show that it is outstanding compared to other spiral galaxies in the same mass range, and demonstrate that the radio jet is the most likely cause.
5.1 Radio jets as origin of the broad line emission
In Fig. 8 we show the map of FWHMs of the CO(1-0) line emission with the small-scale morphology of the radio jet overplotted as contours. The radio image was taken from the VLA FIRST survey (Becker et al. 1995) obtained at 1.4 GHz with 5″ beam size. In spite of the relatively large beam size compared to the ALMA data, we can clearly see that the radio source is extended along an axis roughly going from north to south. The region over which the broad CO line emission is detected clearly coincides with the region of the ring intercepted by the radio source. This makes it very plausible that the radio emission from the AGN is also the main responsible for the broadening of the emission lines.
Moreover, the observed CO(1–0) line widths of FWHM km s-1 in this region are outstanding compared to other massive spiral galaxies without prominent radio jets. There are not many such galaxies in the literature with stellar masses M⊙ and detailed analyses of the line widths measured from spatially resolved CO data sets. Existing data include NGC 5055, NGC 7331, NGC 2841, and NGC 3521 from the THINGS survey (Tamburro et al. 2009), which have circular velocities between 200 and 300 km s-1 and velocity dispersions that are similar to those measured in HI, km s-1 corresponding to km s-1. Tamburro et al. (2009) find a maximum of km s-1 in in NGC 5055 within the central regions of the galaxy, with smaller values further outside.
We caution that the data of these galaxies were obtained at 10″ beam size, much larger than the beam size with which we observed J23450449. Thus, these dispersions are probably much more affected by beam smearing effects. They should therefore be treated as conservative upper limits. Nonetheless, these observations allow us to conclude that maximal intrinsic velocity dispersions, , in J23450449 caused by gravitational motion or other processes in common with massive disk galaxies without prominent radio source, are probably below km s-1, corresponding to FWHMs which are below 70 km s-1. Line widths 70 km s-1 must therefore be caused by another process, and the spatial association with the radio source points clearly to the most likely culprit, even more so as we do not see any evidence for other processes that could potentially increase the line widths in J23450445, like a strong bar or interactions with a massive neighbor. Moreover, Walker et al. (2015) have already argued why star formation in J23450449 is not strong enough to drive an outflow.
We have also used a toy model to investigate how much of this line broadening can be attributed to blending of gas motions within the rapidly rotating ring in our own data. We used the modeled velocity field to construct an artificial data cube with the same signal-to-noise ratio and beam size as observed in our data, and extracted the emission-line kinematics in precisely the same was as previously done for the data. We found that beam smearing doubles the widths of lines with intrinsic km s-1, whereas lines with an intrinsic width of km s-1 are broadened by at most km s-1. This is negligible compared to the observed range in line widths of up to 180 km s-1 and shows that most of the line widths observed in the northern and southern hemisphere of the ring cannot be explained by beam smearing.
In total, K km s-1 pc2 of the line flux in J2345-0449 are emitted from gas with km s-1, and K km s-1 pc2 from gas that is more quiescent. Assuming that similar CO-to-H2 conversion factors apply to both regions, molecular gas masses are M⊙ and M⊙, respectively. Corresponding gas mass surface densities are M⊙ pc-2 and M⊙ pc-2, respectively, for the perturbed and the quiescent gas. It is of course possible, that the perturbed mass would be lower because another CO-to-H2 conversion factor applies in the perturbed gas (e.g. Alatalo et al. 2011). Adopting instead [K km s-1 pc2]-1 as a lower limit, appropriate for optically thin gas at low excitation temperature (Bolatto et al. 2013), we would find that M⊙ of molecular gas are perturbed by the radio source. This would still be a significant fraction of the total molecular gas content of this galaxy, and comparable to the total molecular gas mass in many radio-loud early-type galaxies (e.g., Ogle et al. 2010).
5.2 Search for outflow signatures
To investigate the properties of coherent non-circular gas motions over scales of several kpc, as could be expected from filamentary gas at the edge of an expanding bubble, an outflow, or galactic fountains, we have tried to perform a multi-component fit to the line profiles, and also adopted non-parametric methods. We have also performed fits with priors, e.g., on the modeled large-scale velocity maps from Kinemetry (Krajnović et al. 2006, see also §4.3), trying to isolate a systemic gas component from additional lines with non-rotational kinematics like outflows.
However, although the line profiles extracted from larger apertures clearly indicate that such components are present, likely indicating that the gas is in multiple molecular clouds or filaments with distinct kinematic properties, the signal-to-noise ratios in individual small apertures are not sufficient to probe the global kinematic properties of multiple components robustly and in more detail. Tracing such components over larger areas consisting of multiple spectral elements is also hindered by the blending of rotational and non-rotational components, whose velocity offset is often commensurate with the steep velocity gradient from rotational motion over few pixels. Probing non-rotational components would therefore require deeper observations with higher spatial and spectral resolution than the 20 min of on-source observing time we have obtained for this program, and which was only meant to yield a detection of CO line emission in this galaxy.
We have in particular searched for evidence of outflows that would be fast enough to escape either from the molecular ring and underlying stellar disk, or even the galaxy altogether, in either case depleting the molecular reservoir for on-going star formation. While the complex line profiles make it difficult to identify individual outflow components, pronounced line wings extending to velocities greater than the circular velocity of the disk should be more easily seen. We did not identify any such component down to a peak rms = 1.2 mJy in our data cube. For an assumed line width of FWHM=180 km s-1, the largest seen in this galaxy, this would correspond to a 3 upper limit of 0.69 Jy km s-1, corresponding to 5% of the integrated CO(1-0) flux of the galaxy, or M⊙ in case that the same CO-to-H2 conversion factor applies that we adopted for the disk. This has the character of an upper limit, as molecular outflows have previously been found to be optically thin (Alatalo et al. 2011; Dasyra et al. 2016), which would lower the potential outflowing mass by about an order of magnitude.
We have very little constraints on the motion of other gas phases in this region of J23450449. The only constraints we are aware of are from Bagchi et al. (2014), who show the flat radial velocity profile of H extracted from a 1.5″ slit aligned with the morphological minor axis of the galaxy, indicating no significant offsets from the systemic redshift. It is unclear whether this implies the absence of line broadening, or perhaps a wind of ionized gas, however, since they make no statement about the line widths and profiles. A more complete picture will emerge once that we will have MUSE data of J23450449 at hand, which were delayed due to the Covid-19 shutdown.
5.3 Kinetic energy
We can give a rough estimate of the kinetic energy corresponding to the line broadening in this region, by setting , i.e., assuming isotropic gas broadening in three dimensions. Summing the CO line flux over all regions where km s-1 suggests that a total of M⊙ is being stirred up by interactions with the radio source, corresponding to about 75% of the total molecular gas mass in the ring (Section 4.6). Using the local Gaussian line widths measured in each spatial element to estimate the kinetic energy, we find a total of erg in the gas.
Can the required energy to power these gas flows be produced by the radio source in J23450449? Walker et al. (2015) used the Cavagnolo et al. (2010) relationship between observed jet power at 1.4 GHz and the kinetic energy traced through X-ray cavities in galaxy clusters to estimate the kinetic power of the radio jet in J23450449, . They found erg s-1, corresponding to a total energy ejection of erg for a fiducial jet lifetime of 10 Myr. They consider such a lifetime, which they derive from the 780 kpc size of each of the outer jets and an assumed maximal jet advance speed of as a plausible lower limit. Detailed analyses of other giant radio galaxies find that jet advance speeds can be as low as (e.g., Jamrozy et al. 2005), increasing this age estimate to as much as 250 Myr, in which case the total kinetic energy carried by the radio source would increase to erg. We also note that the Cavagnolo et al. estimate was derived from the work done by FRI radio galaxies in galaxy clusters to inflate X-ray cavities. While this estimate is frequently used to estimate jet kinetic energies, it may systematically underestimate the true jet kinetic energy, which is however very difficult to constrain directly (e.g., Mukherjee et al. 2018b). Nonetheless, this represents a very large energy output, comparable to that of the AGN in massive central cluster galaxies, in spite of being emitted from a black hole residing in the center of a late-type spiral galaxy.
Over 10 Myrs of jet lifetime, 2% of the jet kinetic energy would need to be deposited in the gas to explain the observed line widths. This is comparable to the values found by Mukherjee et al. (2016) from relativistic hydrodynamic simulations (see also Mukherjee et al. 2017). For comparison, if we had adopted the common velocity estimate of initially proposed by Rupke et al. (2005), a commonly adopted measure of outflow velocity in quasars, the kinetic energy estimate would be erg, corresponding to 8% of the jet kinetic energy. We caution, however, that this estimate is only valid under certain assumptions, which are likely not met in this case. It provides an interesting quantity, however, to compare with more generic sets of AGN probed with spatially unresolved data.
5.4 Alternative scenarios
We have just argued that the radio jet itself carries more kinetic energy than required to explain the gas kinematics in J23450449, in agreement with the results of hydrodynamic simulations. However, to demonstrate that this is a unique interpretation, it is also necessary to rule out alternative scenarios.
The kinetic power of the jet is much higher than that carried by other mechanisms that could cause feedback in J23450449. Direct constraints on the presence of the bolometric luminosity of the AGN are scarce in the literature, however, Bagchi et al. (2014) do show the spectrum of the bulge, which clearly falls into the LERG (Buttiglione et al. 2010) or WLRG (Tadhunter et al. 1998) regime of radio galaxies characteristic for sources with very weak (if any) bolometric AGN emission. [OIII]4949,5007 line emission is not seen in this spectrum, and we can use the empirical relationship of Heckman et al. (2004), to estimate the bolometric AGN luminosity by setting . With the upper limit of erg s-1 given by Bagchi et al. (2014) for optical line emission, this would correspond to erg s-1. Radiative processes like, e.g., radiation pressure, would therefore be at least about a factor 10 less energetic than the kinetic power carried by the radio source.
Walker et al. (2015) already argued that star formation would also be too weak to cause significant feedback in J23450449. They estimate a supernova rate of 0.12 M⊙ yr-1. Adopting that each supernova ejects erg s-1 in kinetic power (e.g., Dalla Vecchia & Schaye 2008), this would correspond to a kinetic energy injection of erg s-1 from star formation, more than three orders of magnitude less than from the radio source. We conclude, in agreement with Walker et al. (2015), that the radio source is by far the dominant source of kinetic energy in J23450449.
6 Star-formation law
6.1 J23450449 as an outlier in the standard Kennicutt-Schmidt law and alternative relationships
Numerous studies have addressed the relationship between the mass surface densities of the cold neutral (molecular and atomic) gas in galaxies and their star-formation rate surface densities. This includes above all the seminal work of Schmidt (1959) and Kennicutt (1989), who established a single, tight ( dex), empirical star-formation law which governs the efficiency with which stars form from cold neutral gas in galaxies over more than five orders of magnitude. While there is a broad consensus that this relationship heralds a close physical link between gas and star formation, the detailed physical processes underlying this relationship are still a matter of active debate.
Moreover, alternative relationships have been proposed for the star-formation rate surface density, in particular with the ratio of gas surface density to dynamical (disk rotational) time (Kennicutt 1998b). More recently, Shi et al. (2011) and Shi et al. (2018) pointed out that a relationship which not only accounts for the surface density of gas, but also of stellar mass, remains valid also for star-formation at very low metallicities and gas mass surface densities, where the classical star-formation law breaks down.
Finding significant, systematic offsets in AGN hosts from the star-formation law of purely star-forming galaxies would be one signature indicating that AGN feedback can indeed affect star formation in their host galaxies. This would be more constraining than the presence of outflows, because it may indicate a direct physical link between the injection of AGN jet energy into the gas and a suppression of star formation and galaxy growth. Several studies of other classes of AGN have not identified a deficit in star formation in spite of the presence of fast outflows (e.g., Genzel et al. 2014; Harrison et al. 2016).
Nesvadba et al. (2010) and Ogle et al. (2010) were the first to show that the star formation intensity at a given gas mass surface density (star-formation efficiency) may be unusually low in the subset of early-type radio galaxies which are rich in relatively dense molecular gas, including gas that is heated by shocks. They found a characteristic offset from the usual Kennicutt-Schmidt relationship by about a factor 10 relative to other galaxy populations. This result was later on confirmed by Herschel far-infrared photometry of dust heated by star formation (Lanz et al. 2016).
These authors initially attributed the offset towards lower star formation efficiencies to the gas being perturbed by the radio jet (Nesvadba et al. 2011), a process which might also create and maintain the large reservoirs of warm molecular hydrogen found in these galaxies, which appear to be heated by shocks (Ogle et al. 2007; Nesvadba et al. 2010; Ogle et al. 2010).
However, this interpretation was subsequently challenged by Martig et al. (2013) and Saintonge et al. (2012), who proposed that the reason for low star-formation efficiencies in early-type galaxies was inherent to the spheroidal morphology of their stellar component, which would stabilize the gas against becoming gravitationally bound and forming stars. In this case, the presence of radio jets and turbulent gas would just be a coincidence, with no direct physical link to the star formation.
Comparing the star-formation efficiency in J23450449 with that of radio galaxies of Ogle et al. (2010) is very interesting, because the molecular ring in J23450449 is associated with the disk, not the bulge of the galaxy. Hence the high stellar mass surface density or the morphological quenching invoked by Martig et al. (2009, 2013) cannot regulate the star formation in this gas. Demonstrating that the gas and star formation density in J23450449 fall near the Ogle et al. (2010) radio galaxies would therefore demonstrate that a radio source alone is able to produce such an offset in star-formation efficiency, even in the absence of the high stellar mass surface densities and spheroidal morphologies typically found in early-type galaxies. A potential impact of angular momentum and stellar mass surface density can be further investigated by comparing J23450449 with the alternative star-formation laws. Finding significant offsets in all these relationships would be an important piece of evidence to demonstrate that AGN feedback is a viable mechanism to lower star-formation rates in massive, gas-rich galaxies.
6.1.1 Standard Kennicutt-Schmidt relation
We will now use the star-formation rate surface densities from Section 3.3, and the gas-mass surface densities from Section 4.6, to obtain average surface densities in both quantities. Currently available data can only provide us with average values, because GALEX has a relatively low spatial resolution of only 5″. However, as already discussed in detail in Section 3.3, both the UV and 22 m continuum morphologies of J23450449 are spatially resolved and show that star formation is extended over the entire stellar disk, with very similar, low, integrated star-formation rates of SFR= yr-1. This implies that GALEX does not systematically miss a strong star-forming component deeply embedded in dust.
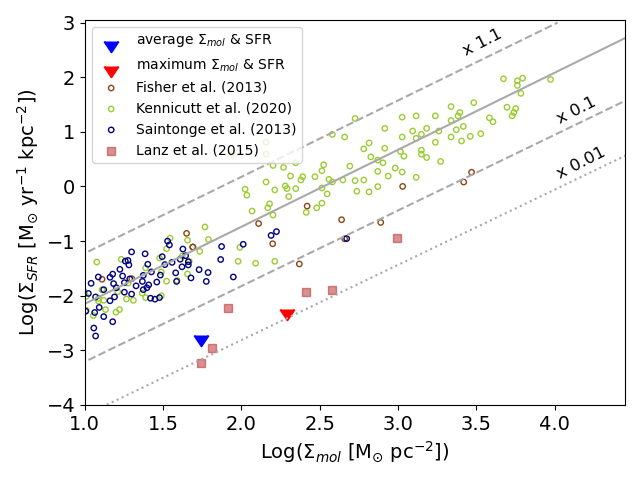
Fig. 9 shows where J23450449 falls in the Kennicutt-Schmidt diagram with respect to low-redshift spiral and starburst galaxies, and the radio galaxies of Ogle et al. (2010) and Lanz et al. (2016), for which spatially resolved measurements of CO line emission are available. For J23450449 we plot the average and maximal gas-mass surface densities derived from our ALMA interferometry (Section 4.6), and the minimum and maximum of local star-formation densities as given in Section 3.3, and M⊙ yr-1 kpc-2, respectively. These two data points are therefore not unique values derived for a specific pair of local surface density of star formation and molecular gas, but they are chosen to illustrate a representative range of surface densities of molecular gas mass and star formation in J23450449, respectively.
For both, the galaxy falls well below the standard Kennicutt-Schmidt relationship and into the regime that is set by the radio galaxies of Ogle et al. (2010), Nesvadba et al. (2010), and Lanz et al. (2016). Taken at face value, local star formation rates are factors 50 to 75 lower than what is expected from the standard Kennicutt-Schmidt relation at the given gas mass surface densities. Throughout the paper, we have already argued that this cannot be the result of the same structural properties as for bulges, because J23450449 has no prominent bulge, no unusual stellar mass surface densities compared to other galaxies, and no dense environment. The unusually bright X-ray halo compared to other spiral galaxies in the same mass range, and presence of M⊙ of cold molecular gas also show that shock heating of infalling gas at the virial radius alone has not been able to inhibit the accumulation of significant amounts of gas in this galaxy.
6.1.2 Alternative relationships
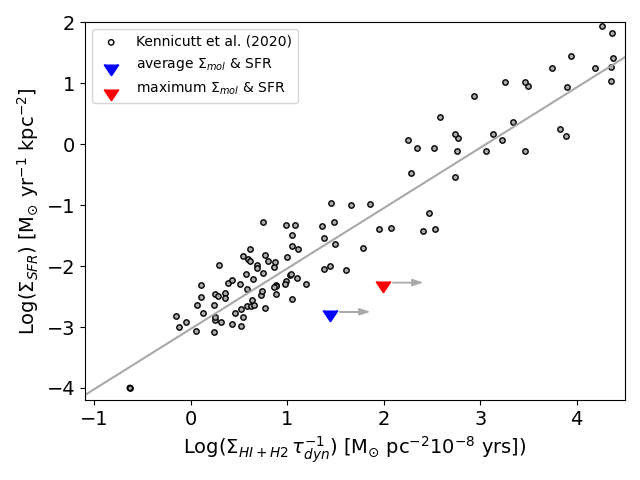
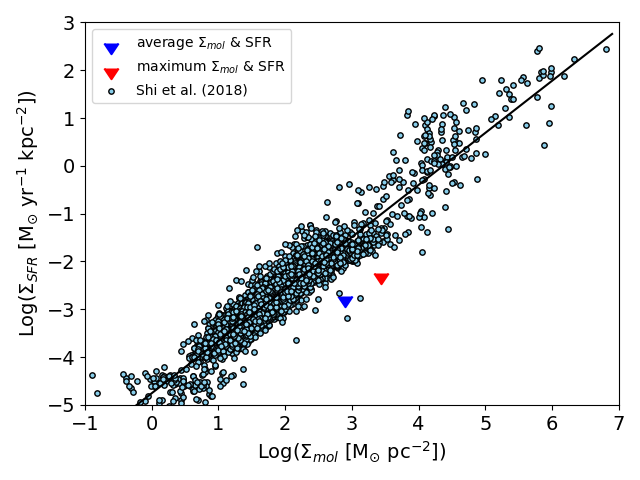
In Figs. 10 and Figs. 11, we investigate whether J23450449 is more typical in alternative star-formation laws, like the Silk-Elmegreen law between star-formation rate surface density and gas-mass surface density divided by the dynamical time (Kennicutt 1998a), and the extended Schmidt Law (Shi et al. 2011, 2018), which takes into account the effect of stellar mass surface density by relating star-formation rate densities with the product of the gas mass surface density, and square root of the stellar mass surface density , i.e. 200 M⊙ pc-1 in J23450449 (Section 3.1). This quantity scales with the hydrostatic mid-plane pressure of the galaxy. For neither relationship does J23450449 fall onto the ordinary relationship between gas and star formation rate density. The offset from the Silk-Elmegreen relationship is smaller than that in the Kennicutt-Schmidt relationship, however, our result should be considered a lower bound. The comparison sample uses the masses of cold molecular and atomic gas combined. In J23450449, the molecular gas mass alone is already sufficient to produce an offset of 0.65 dex from the sequence of ordinary galaxies. An offset that can only increase if cold atomic gas was included.
The extended Schmidt-law overpredicts the star formation rate surface density in J23450449 as well, by 1.0 dex for average, and by 1.3 dex (a factor 21) for the highest mass surface densities. We conclude that J23450449 falls off all three star-formation laws, as would be expected if star formation was regulated by a mechanisms which is not present in the overall galaxy population.
6.2 Rotational support in the ring with and without radio jet
An additional hypothesis to explain the low star-formation efficiency in J23450449, which is specific to massive spiral galaxies with high angular momentum compared to bulges, is that the high rotational velocity of the ring could make the gas rotationally stable at the observed gas-mass surface densities (e.g., Ogle et al. 2019). It is therefore very instructive to contrast the results of such an analysis for gas without and with line broadening caused by the radio source.
We use the Toomre (1964) criteria to estimate the minimal gas-mass surface density which would allow the gas in the ring in J23450449 to become self-gravitating, fragment, and form stars. Following, e.g., Toomre (1964) or Martin & Kennicutt (2001), the critical mass surface density, for gas to become Toomre-unstable is , where is the Gaussian line width, , the gravitational constant, and the epicyclic frequency. We follow Genzel et al. (2014) in setting . is the circular velocity at a given galactocentric radius, is that radius, and is a factor that takes into account the geometric properties in the disk. We adopt , appropriate for the flat part of the rotation curve.
Adopting an appropriate value for the gas velocity dispersion in absence of the radio jet is somewhat delicate, as line widths are very broad in most of the ring. The lowest values found in the eastern and western ring, about orthogonal to the jet axis, are around km s-1 (Fig. 4), similar to those found in other massive spiral galaxies without prominent radio sources (e.g., Tamburro et al. 2009). We will therefore adopt km s-1 as typical value for the gas velocity dispersion in absence of the radio source.
With these definitions, setting kpc and kpc for the inner and outer edge of the molecular disk, respectively, and using the deprojected rotation velocities km s-1 and km s-1 measured at these radii, respectively, we find critical gas mass surface densities of 90.5 M⊙ pc-2 in the inner, and 34.0 M⊙ pc-2 in the outer ring. Many authors, including in particular Martin & Kennicutt (2001), have found that normally star-forming galaxies have gas-mass surface densities which are between about 0.6 and 1.5 the critical value. The same is the case for most of the gas in the molecular ring of J23450449 when adopting typical gas velocity dispersions in galaxies with M⊙, km s-1, and the average, median, and maximal gas mass surface densities of 55, 83, and 196 , respectively (Section 4.6).
It therefore seems that the rapid ring rotation alone cannot explain why star-formation rates in J23450449 are so much lower than in other spiral galaxies. However, this changes, of course, when considering the measured line widths instead of those measured in absence of powerful radio jets. For example, at km s-1, the threshold value we adopted to uniquely identify gas affected by the radio jet in Section 5.2, or at km s-1, corresponding to the highest line widths measured in the ring, critical gas mass surface densities in the outer ring are yr-1 and yr-1, respectively. At the inner edge of the ring, they would be ever higher. This illustrates that the line broadening from the radio jet may well make gas in an otherwise marginally rotationally supported gas disk unable to fragment into individual, self-gravitating, and star-forming gas clouds. A more detailed analysis would require higher-resolution constraints on the star formation in J23450449, and will become possible once our scheduled MUSE observations have been taken.
7 Discussion
7.1 A case for jet-ISM interactions in the molecular ring
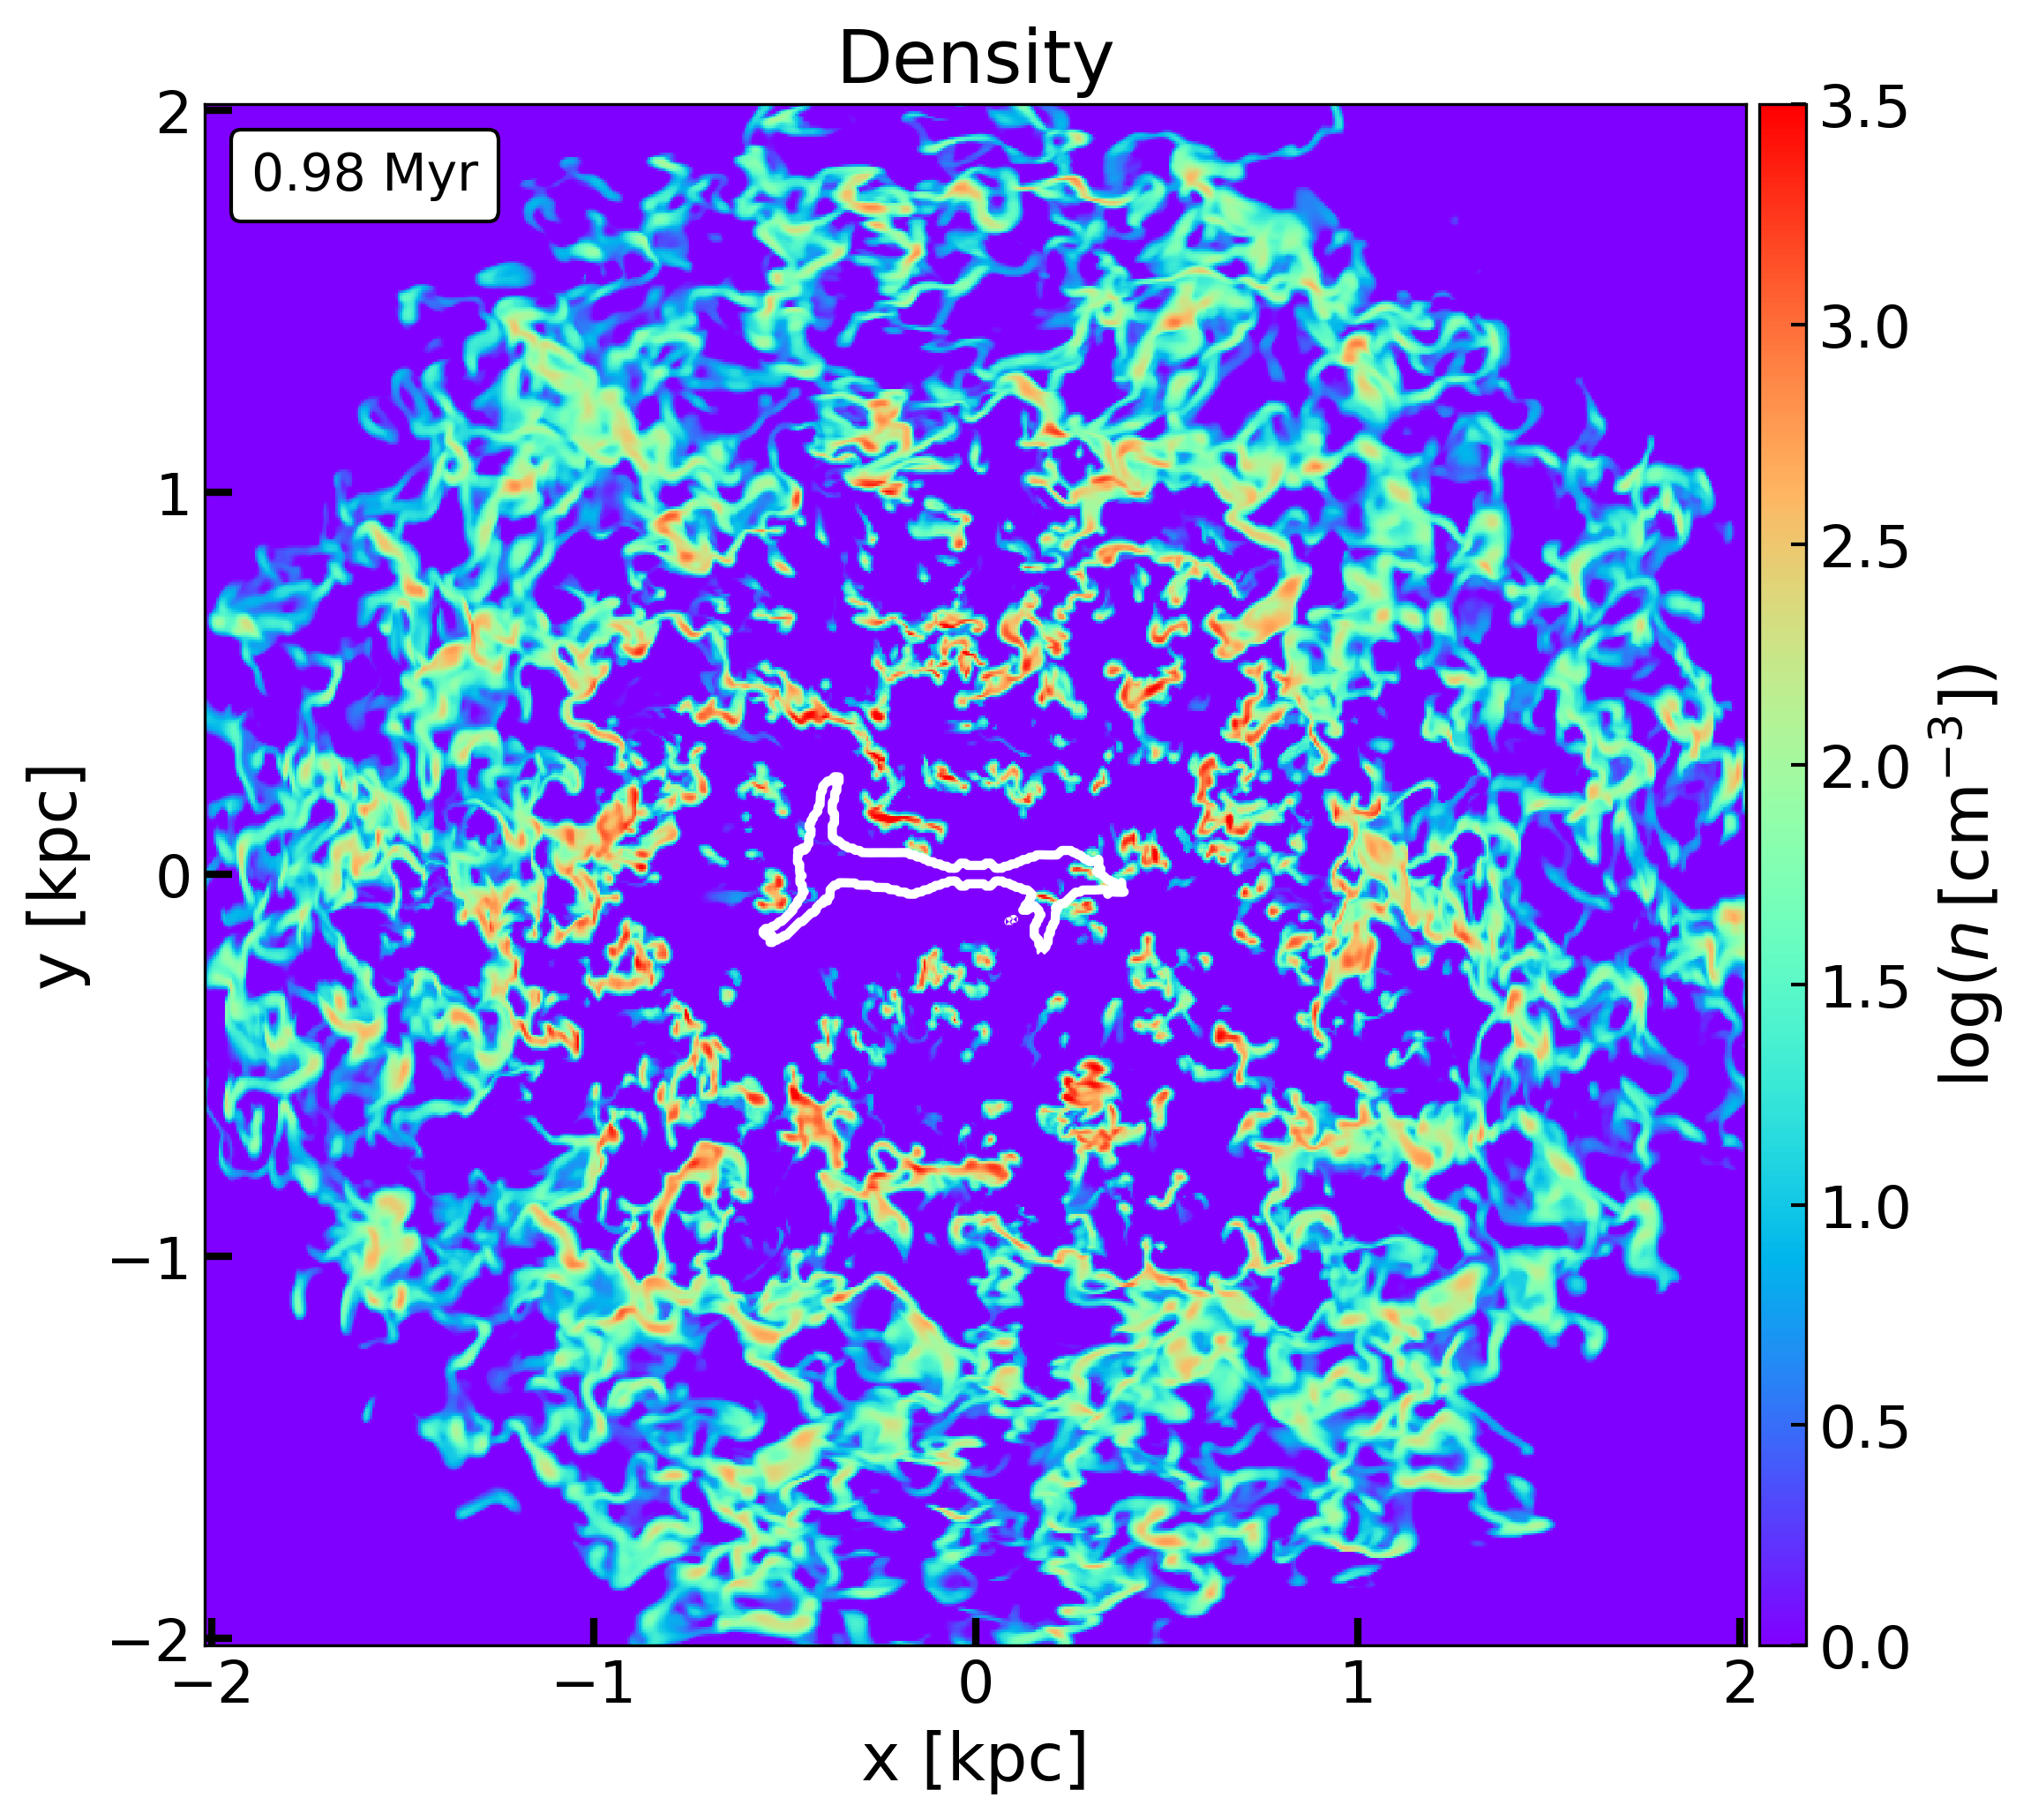
It is instructive to compare these observational results for J23450449 with existing simulations of the interactions between relativistic jets and the interstellar medium. Mukherjee et al. (2018a) performed a set of relativistic hydrodynamic simulations of radio galaxies with a range of jet power, gas conditions, and jet orientations relative to the gas disk to explore the propagation and interaction of the radio jet with an inhomogeneous, turbulent, multi-phase interstellar medium on kpc scales. Although these simulations were not conducted to model a specific radio galaxy, they demonstrate how jets heat, disperse, and drive out warm and cold gas. Hence, they can help us make a qualitative comparison with the data presented in this paper. In the following, we use their simulation D, which describes the signature of a radio jet with power erg s-1 impinging at an inclination angle of 45∘ on a 4 kpc diameter gas disk with mass . For the full list of simulation parameters, see Mukherjee et al. (2018a, Tables 1 and 2). Since the jet is inclined by 45∘ to the disc, this simulation most closely resembles the geometry of the jet-disc system in J23450449.
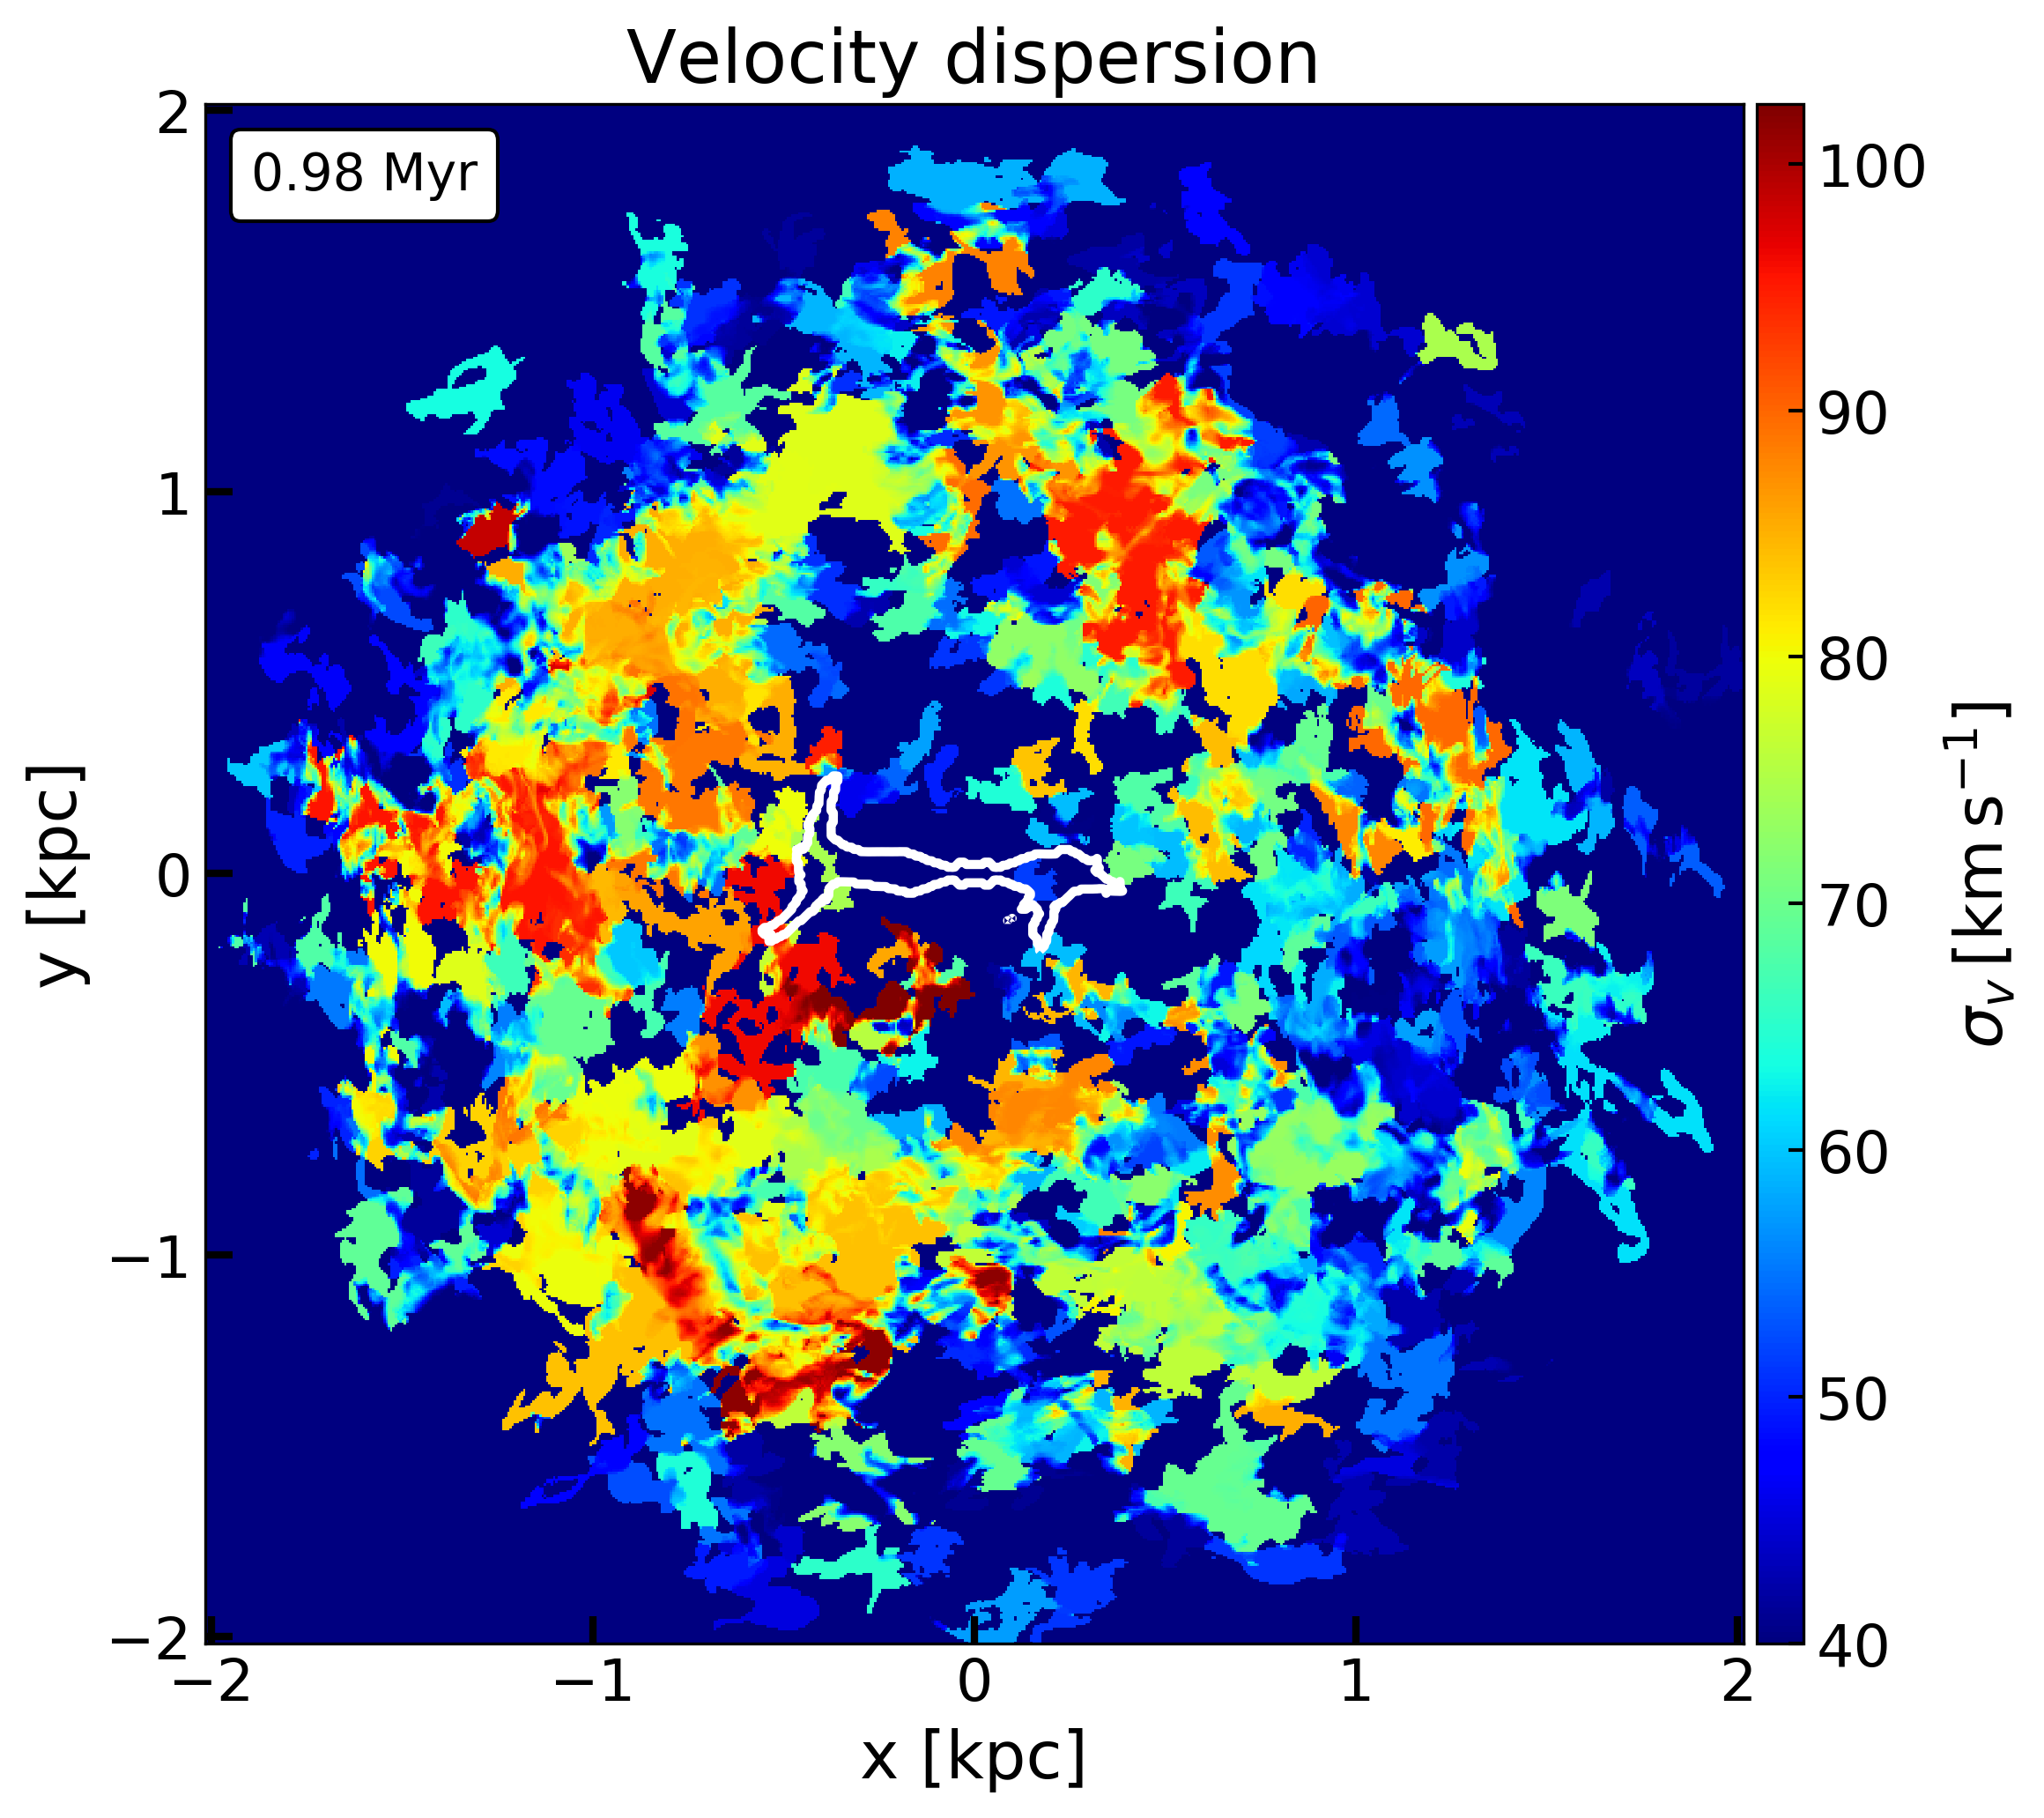
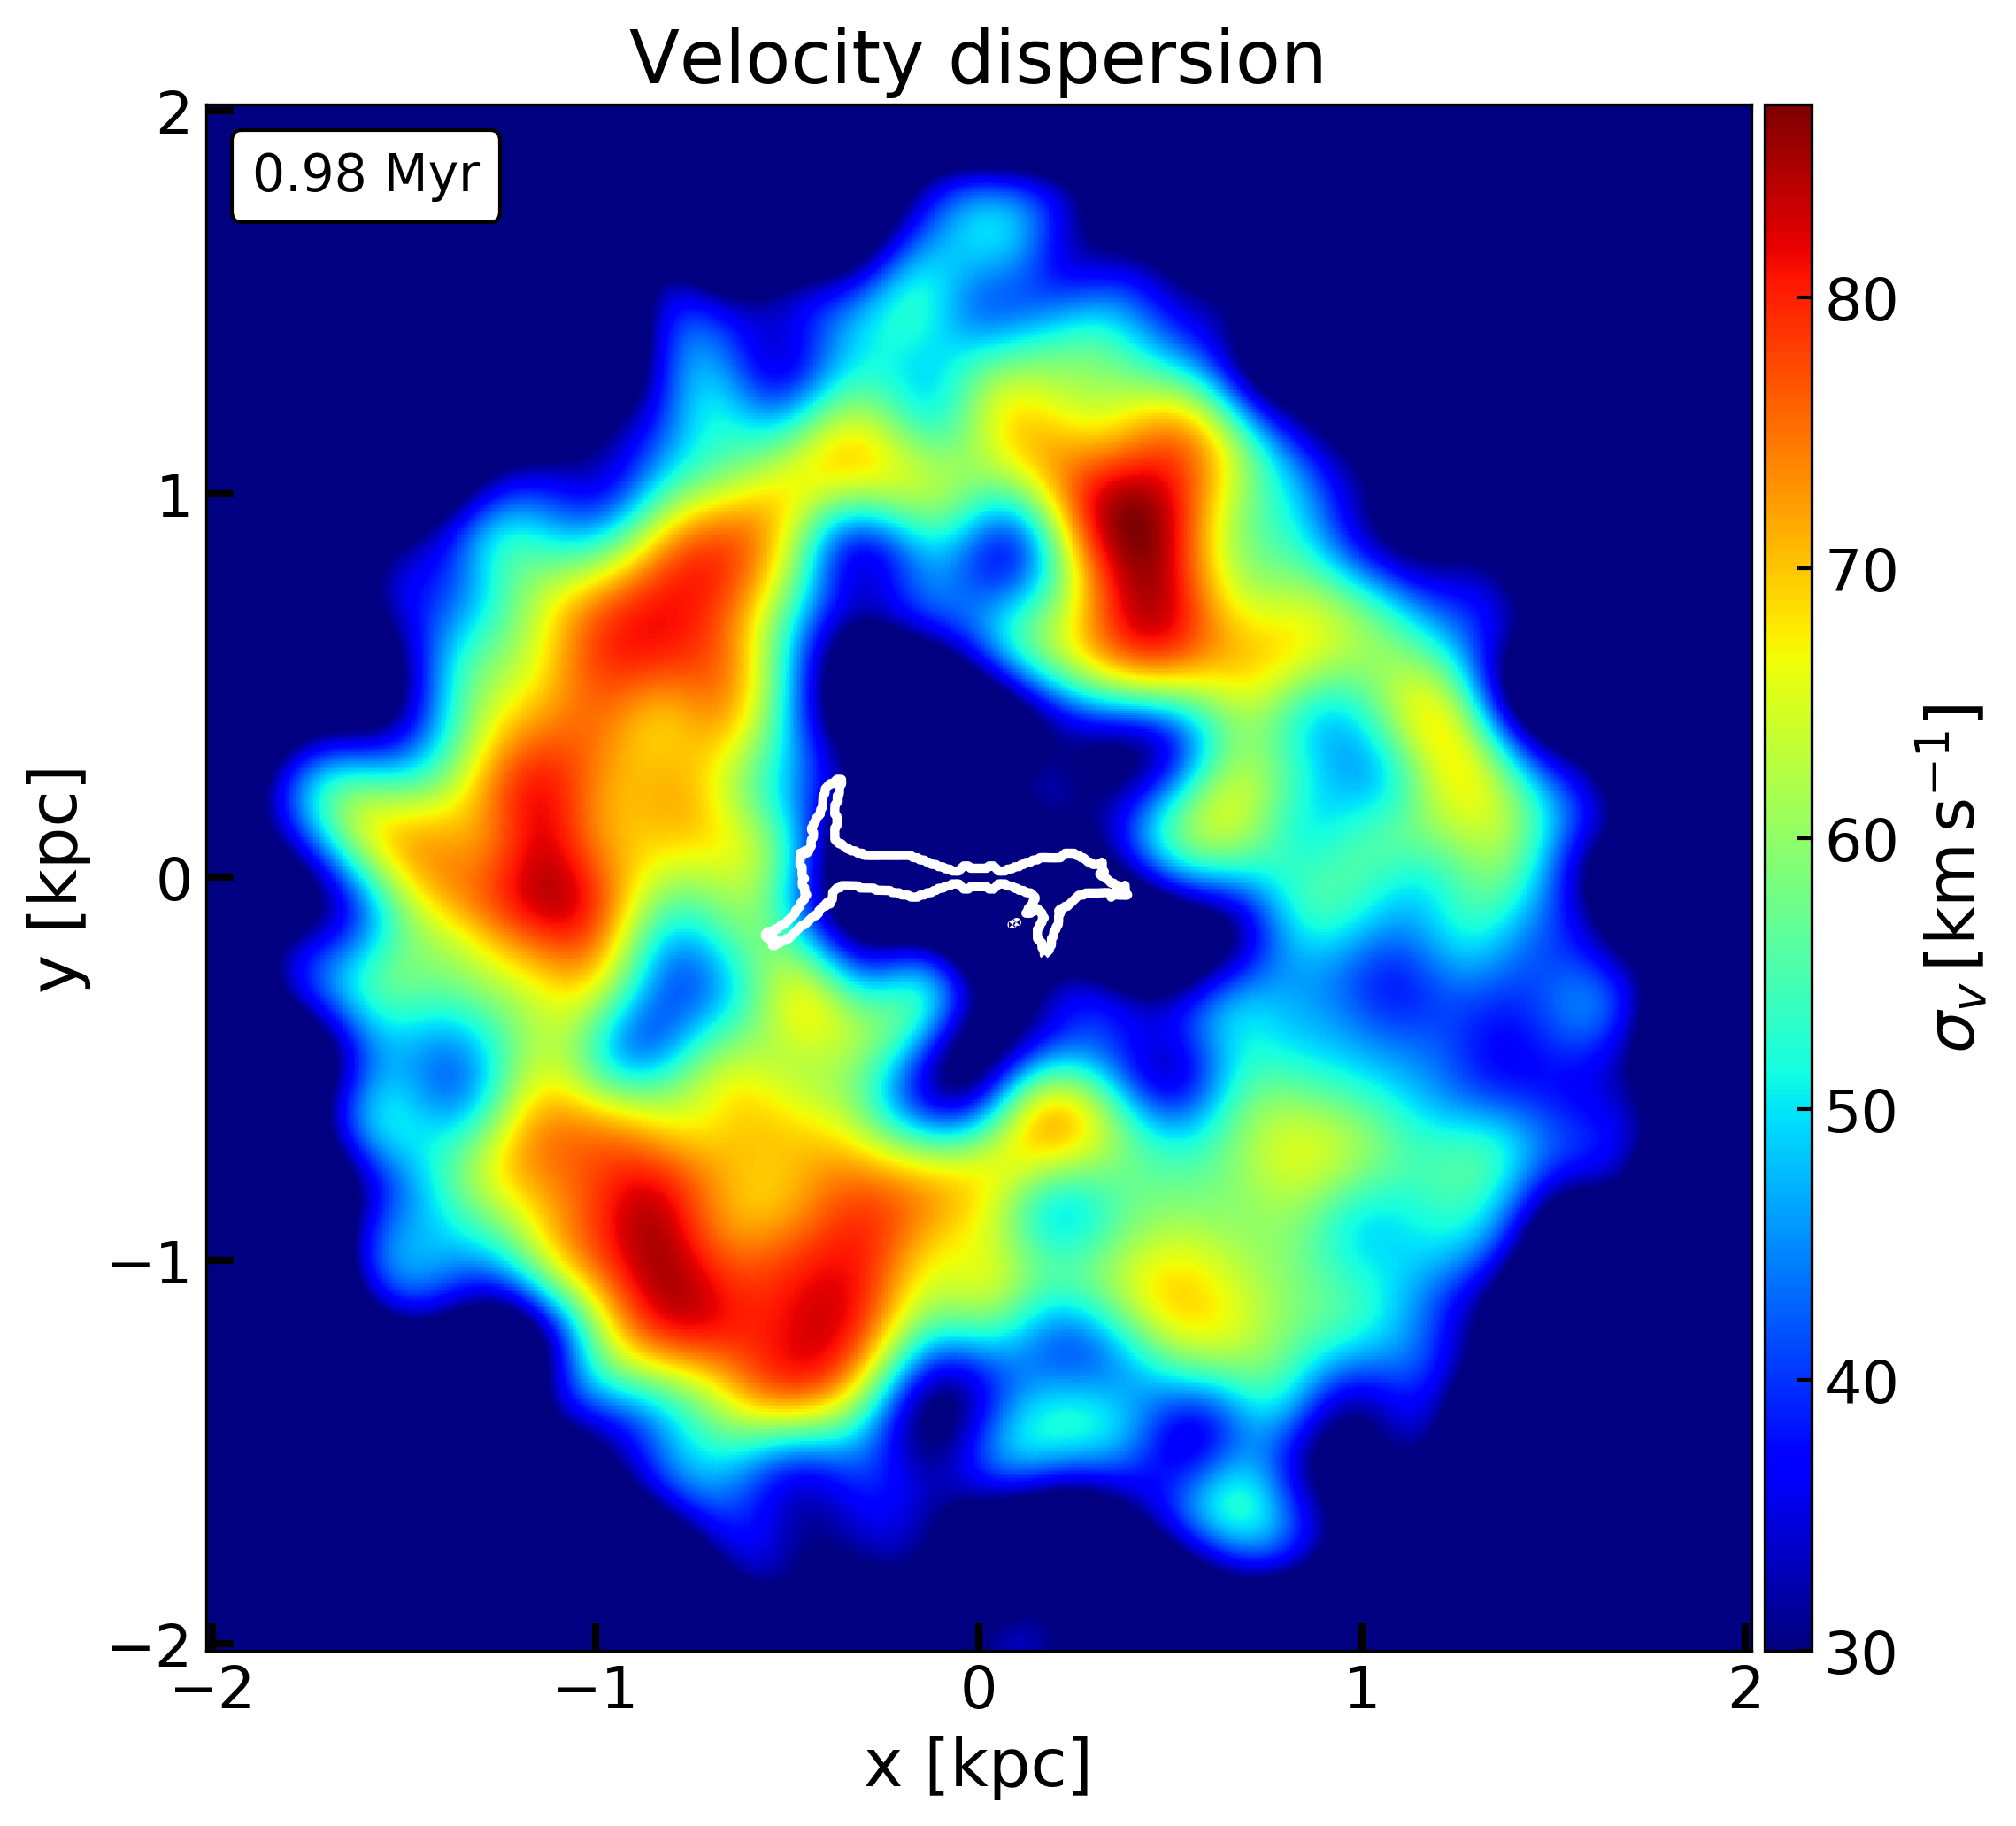
In Fig. 12 we illustrate the impact of jet-ISM interactions on the kinematics of the dense gas in the simulation. In the left panel, we present a top-view of the density map of simulation D at the mid-plane of the disk (Z=0 plane). The location of the jet, projected onto the X-Y plane, is shown in white. The middle panel shows the velocity dispersion of dense clumps with projected onto the X-Y plane by performing a mass-weighted average along the Z axis. Further numerical details will be discussed in a forthcoming publication (Mandal et al. in prep). We also show a smoothed image of the velocity dispersion by convolving the original map at the resolution of the simulation ( pc), with a Gaussian kernel of width pc. The convolved image, representing a velocity dispersion map viewed at a poorer resolution, still shows inhomogeneous structures, with enhanced dispersion at the inner edges of the central cavity. The morphology of the dispersion maps in Fig. 12 obtained from the simulations, bear striking resemblance to the observed distribution of the width of CO(1-0) lines presented in Fig. 4, although on differing spatial scales.
It is evident from Fig. 12 that one of the strongest points of interaction between the jet and the disk is near the jet head (to the left of the image), where sustained head-on collisions between the jet streams and clouds occur. This raises the velocity dispersion of the dense gas in the immediate vicinity to , as a substantial fraction of jet kinetic energy is transformed into cloud motions. Strong thermal pressure gradients and ram pressure gradients are carried away from the head by secondary jet streams and act in all directions, dispersing and heating gas in a large region around the jet head. The velocity dispersion in the entire gas disk increases as a result of the jet-ISM interactions to values larger than , higher than the starting dispersion of the unperturbed disk at the beginning of the simulation.
The qualitative similarity between the simulated gas kinematics discussed above and the observed results in Fig. 4, prompts us to infer that the enhanced turbulent dispersion observed in J23450449 results from active interaction of the jet-driven flows with the gas disk. While the accelerated and dispersed clouds, especially near the head, are strongly compressed and ablated, very little gas reaches escape velocity, as also observed in J23450449. Instead, the gas participates in a fountain-like outflow, that could further contribute to raising the gas turbulence to the high values observed in J23450449 when falling back onto the disk.
In spite of the mass loss through the fountain, after Myr, the central 0.5 kpc region of the disk is still only partially cleared of gas. Judging from the dynamics of the dense gas being pushed away by the jet, which remains confined for the entire Myr of the simulation, we expect that by 5 – 10 Myr a sizeable cylindrical hole devoid of dense gas will be created within the inner 0.5 kpc of the gas disk, as also seen, e.g., in the simulation by Gaibler et al. (2011). Apart from the excavated central region, the structure and rotation of the gas disk outside the central cavity remain largely intact because the jet-ISM interactions do not remove a sufficient amount of angular momentum to disrupt the entire disk. This suggests that the gas morphology in J23450449 can be a result of radio jet feedback, even if the galaxy hosted a gas disk extending all the way to the central regions before the onset of the radio jet activity. The absence of large amounts of dense gas is also consistent with the radio source being fueled by accretion of hot gas onto the central supermassive black hole (e.g., Hardcastle et al. 2007).
Strong jet-ISM interactions also lead to asymmetric radio morphology (Gaibler et al. 2011) as appears to be the case for J23450449. For the duration of the simulation, the main jet stream is deflected toward the cylindrical axis of symmetry of the gas disk and escapes nearly perpendicular to the disk. Thus, while the jet is inclined by 45∘ at the base and within the galactic disk, at larger distances it propagates perpendicular to the disk. In the case of J23450449 the deflection is seen in projection and whether the jet has broken out of the disk and is freely propagating into the galactic halo, or whether it is still being deflected is not immediately discernible without a thorough analysis of the radio data and, possibly, not without new radio data at better sensitivity and higher angular resolution.
A simulation tailored to J23450449 would be required for a more quantitative comparison. However, even a qualitative comparison as presented here already allows us to draw general conclusions about the nature of the interaction between jet and gas in J23450449. The impact that such interactions can have on the star formation in the host galaxy have so far only started to be investigated with simulations (Gaibler et al. 2012; Bieri et al. 2016; Mukherjee et al. 2018a), sometimes with somewhat crude assumptions. We are currently performing a more detailed study of star formation in the presence of radio jet feedback, which shows that such such an interaction can indeed lower the star-formation efficiency of a massive gas disk, as seen in J23450449 (Section 6). Such an analysis is beyond the scope of this paper and will be presented in a separate publication (Mandal et al., in prep.).
7.2 From the current feedback episode to the global suppression of gas cooling and galaxy growth
Extrapolating from in-situ observations of radio jet feedback to the global implications of such episodes for the growth history of massive galaxies is one of the most important aspects of AGN feedback studies, but observational constraints that allow us to directly quantify both in the same galaxy are usually very difficult to come by. Past X-ray observations of J23450449 by Walker et al. (2015) and Mirakhor et al. (2020) revealing a bright X-ray halo surrounding the disk, and the highly unusual presence of a radio jet in this late-type spiral give us the rare opportunity to discuss complementary observational constraints on the on-going feedback episode seen in molecular gas, and on the global suppression of star formation derived from the baryon budget in stars and hot halo gas.
As Mirakhor et al. (2020) recently pointed out, the high baryon fraction of 60% of the cosmic average in the X-ray halo of J23450449 (for a cosmic baryon fraction of 18.8%, Planck Collaboration et al. 2018) suggests that the underlying, massive dark-matter halo of (Mirakhor et al. 2020) must have retained a large fraction of its infalling gas. This is very interesting, because it implies that the baryons in J23450449 must also carry the signatures of the integrated AGN feedback history, if such feedback is to play a major role for regulating the stellar growth of massive galaxies, as is now widely believed. We will now compare the radio and X-ray properties and stellar mass fraction of J23450449 with those of other massive spiral galaxies to constrain the potential global impact of radio jet feedback on its integrated star-formation history.
7.2.1 J23450449 in the context of massive spiral galaxies
As a class, massive spiral galaxies akin to J23450449 have only recently received increased attention in the literature. While it is not uncommon that these galaxies have low specific star-formation rates compared to less massive spiral galaxies, Posti et al. (2019) recently showed that they are also unusually rich in stellar mass for their dark-matter halo mass, compared to expectations from cosmological abundance matching. They present detailed fits of the HI rotation curves and mass-to-light ratios to dark-matter halo profiles of 175 spiral galaxies with stellar masses of few from the SPARCS sample (Lelli et al. 2015). The baryon fraction in their sample increases monotonically with increasing stellar and dark-matter halo mass, up to their most massive galaxies with M⊙, akin to J23450449. This is in contrast to cosmological abundance matching studies, which suggest a maximal efficiency of baryon cooling and star formation in galaxies at stellar masses M⊙ (e.g., Moster et al. 2013; Behroozi et al. 2013). Posti et al. (2019) suggest that the difference between these results could be explained if AGN feedback was the primary reason why the stellar mass growth of these galaxies, mainly early-types, became increasingly inefficient: If black-hole growth and bulge growth are related, they argue, then baryon cooling in massive spirals, which would generally not experience strong AGN feedback, would become increasingly efficient compared to early-type galaxies. In broad support of this statement, Li et al. (2019) did not find evidence for significant offsets from the Kennicutt-Schmidt relationship in massive spiral galaxies with millimeter CO emission-line observations.
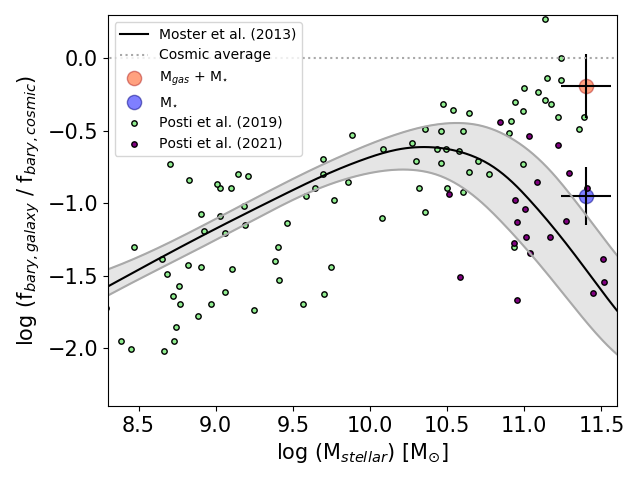
J23450449 has a high baryon fraction of 60%, comparable to the galaxies of Posti et al. (2019). However, with a stellar mass of M⊙ (Section 3.2) and a mass of hot halo gas, , only 30% of the baryonic mass is in stars and cold gas in this case, the remaining 70% is in the hot halo, whereas the high baryon fractions in the massive spirals of the Posti et al. (2019) sample are derived from the stellar mass alone.
In Fig. 13, we reproduce the upper panel of Fig. 2 of Posti et al. (2019) to illustrate where J23450449 falls relative to their sample and to expectations from abundance matching by Moster et al. (2013). If counting only the stellar mass in J23450449, then its baryon fraction falls a factor of short of equally massive galaxies in the Posti et al. (2019) sample, and into the same realm as early-type galaxies, whereas it has a rather typical baryon content akin to other massive spiral galaxies, when including also the hot X-ray gas. The powerful radio source is the most striking difference between J23450449 and the Posti et al. (2019) sample, and is affecting the cold interstellar gas and star formation, as we have shown before, as well as the hot halo gas, as previously demonstrated by Walker et al. (2015). It is therefore reasonable to consider the difference in stellar mass fraction between J23450449 and the Posti et al. (2019) sample the long-term consequence of radio jet feedback. J23450449 seems to have accreted about as much baryonic mass as other spiral galaxies in the same mass range, however, about two thirds of these baryons do not seem to have formed stars, but are still (or again) in the halo.
7.2.2 Is radio jet feedback at the origin of the low stellar mass fraction in J23450449?
Would the current kinetic jet power observed in J23450449 be sufficient to explain the deficit in stellar mass compared to the massive spiral galaxies of Posti et al. (2019)? For simplicity we will assume that the current feedback episode in J23450449 is typical, and that without a supermassive black hole capable of launching radio jets, the galaxy would have transformed all of the M⊙ in hot halo gas into stars. Sabater et al. (2019) suggest that galaxies with at least M⊙ in stellar mass and radio sources at least as powerful as in J23450449, erg s-1, have duty cycles of about 0.1, i.e., they host radio sources at least as powerful as that in J23450449 for about 10% of the time. This would suggest that the jet of J23450449 has released about erg into the interstellar and circumgalactic gas in the last 10 Gyrs. Following Walker et al. (2015), lifting gas out of the galaxy and to radii beyond the bright inner X-ray halo (80 kpc) would require injecting about erg s-1 M of kinetic jet energy into the halo, suggesting that the jet could have heated and even unbound up to about M⊙ in the past 10 Gyrs. This does not take into account, e.g., gas cooling or inefficiencies in the energy transfer from the jet into the gas, however, it does plausibly suggest that energy deposition through the radio jet into the gas alone may explain the relative deficit in stellar mass in J23450449 compared to the Posti et al. (2019) sample. Finding multiple pairs of bright radio jets in J23450449 (Bagchi et al. 2014) gives direct evidence of a long-term jet activity in this source (Section 5.3).
The low star-formation efficiencies found in Section 6 suggest that star formation can be inhibited during AGN episodes, even if not all gas is immediately outflowing in a rapid, instantaneous blowout event, as has initially been suggested by early cosmological models of AGN feedback. The molecular gas mass is comparable to the hot X-ray gas within the inner kpc of the halo (Walker et al. 2015), and corresponds to % of the total hot gas content in the halo as estimated by Mirakhor et al. (2020). Much of the disk gas may have accumulated through partial cooling of the hot gas out of the halo, in analogy with X-ray bright galaxy clusters (Revaz et al. 2008; Voit et al. 2015; Gaspari et al. 2020). Walker et al. (2015) estimated that a large fraction of the jet kinetic energy is likely necessary to inflate X-ray cavities in the hot halo gas; in comparison, the energy injection rates of only a few percent of the jet energy, that are required to keep the cold gas in the host galaxy from forming stars (Section 6), are rather low. This suggests that inhibiting star formation in the molecular gas of the host galaxies of radio-loud AGN may be possible even with a comparably modest energy input compared to the overall feedback cycle in radio-loud AGN host galaxies. Nonetheless, it has major consequences for the overall stellar growth history of these galaxies, independent of the morphological or structural properties of these galaxies themselves.
8 Summary
We have presented an analysis of new ALMA CO(1–0) interferometry of the massive spiral galaxy 2MASS J234543680449256 (J23450449) at , which is exceptional for its multiple pairs of bright radio lobes reaching out to a maximum of 1.6 Mpc, and its bright X-ray halo (Bagchi et al. 2014; Walker et al. 2015). We detect a 24 kpc wide ring associated with the inner stellar disk of the galaxy, which contains M⊙ of cold molecular gas. Line emission in about 3/4 of the ring surface has line widths that are FWHM km s-1, well above typical widths of CO line emission in other, equally massive, spiral galaxies without radio AGN. These regions are also intercepted by the jets, and we therefore interpret the broadening as due to feedback from the radio source. We do not detect any outflow motion at velocities exceeding the circular velocity of the ring, km s-1.
Molecular gas-mass surface densities are between 55 and pc-2. We estimate stellar mass surface densities for the disk and low-mass pseudo-bulge, finding that they are typical for bulges and disks in other spiral galaxies, including spiral galaxies at lower mass. Star-formation rate surface densities derived from spatially resolved GALEX far-UV imaging are M⊙ yr-1 kpc-2, lower than in other spiral galaxies without prominent radio source and similar gas-mass surface densities, assuming that a common CO-to-H2 conversion factor applies to all galaxies. This places J23450449 well below the ordinary Kennicutt-Schmidt law and into the same realm already populated by powerful early-type radio galaxies, which are rich in molecular gas, including warm molecular gas presumably heated by shocks induced by their radio jets. Significant offsets towards lower star-formation rate densities are also found for the Silk-Elmegreen relationship, and the extended Schmidt-law, which takes into account stellar mass surface density.
We use the Toomre stability criterion to show that the molecular gas in J23450449 would be near the critical mass surface densities where rotational support would make the gas marginally stable to forming self-gravitating clouds and stars, if line widths were as low as in the small regions of the ring not affected by the radio source. These regions of quiescent gas in J23450449 have line widths that are comparable to those in other, equally massive spiral galaxies, which fall onto the ordinary star-formation laws.
However, the increase in gas velocity dispersion caused by the radio jet in J23450449, and corresponding to about 1-2% of the kinetic energy carried by the radio jets, enhances the critical densities to values that are significantly higher than those found in most parts of the ring. We find that alternative processes, like heating by the bolometric AGN radiation, star-formation, but also structural properties of the host galaxy as often suggested for the by far more typical early-type host galaxies of powerful radio sources, can be ruled out as causes of the low star formation rates in this galaxy, which has a low-mass pseudo-bulge, no bar, and no rich environment. This suggests that interactions with the radio jet, as observed here, are indeed the cause of the low star formation efficiency in J23450449, and not these other processes, which are commonly co-existent with powerful radio jets in more common bulge-dominated and early-type host galaxies of radio jets.
J23450449 is an outstanding object for detailed studies of the consequences of radio AGN feedback for star formation in galaxies generally. We also argue that this impact may be long-term, as J23450449 seems to have retained large fractions of its baryons in its massive dark-matter halo, like other massive spiral galaxies recently studied, which have no radio jets. However, most of these baryons seem to be in hot halo gas, and not in stellar mass in the host galaxy. This is a central prediction of the AGN feedback theorem in early-type galaxies. Finding the same to be the case in J23450449, a rare spiral galaxy with powerful radio source, but not in other, equally massive spiral galaxies without jets, adds important further credence to this mechanism.
References
- Alatalo et al. (2011) Alatalo, K., Blitz, L., Young, L. M., et al. 2011, ApJ, 735, 88
- Bagchi et al. (2014) Bagchi, J., Vivek, M., Vikram, V., et al. 2014, ApJ, 788, 174
- Becker et al. (1995) Becker, R. H., White, R. L., & Helfand, D. J. 1995, ApJ, 450, 559
- Behroozi et al. (2013) Behroozi, P. S., Wechsler, R. H., & Conroy, C. 2013, ApJ, 770, 57
- Bell et al. (2003) Bell, E. F., McIntosh, D. H., Katz, N., & Weinberg, M. D. 2003, ApJS, 149, 289
- Bieri et al. (2016) Bieri, R., Dubois, Y., Silk, J., Mamon, G. A., & Gaibler, V. 2016, MNRAS, 455, 4166
- Birnboim et al. (2007) Birnboim, Y., Dekel, A., & Neistein, E. 2007, MNRAS, 380, 339
- Bolatto et al. (2013) Bolatto, A. D., Wolfire, M., & Leroy, A. K. 2013, ARA&A, 51, 207
- Borzyszkowski et al. (2017) Borzyszkowski, M., Porciani, C., Romano-Díaz, E., & Garaldi, E. 2017, MNRAS, 469, 594
- Bruzual & Charlot (2003) Bruzual, G. & Charlot, S. 2003, MNRAS, 344, 1000
- Buttiglione et al. (2010) Buttiglione, S., Capetti, A., Celotti, A., et al. 2010, A&A, 509, A6
- Cavagnolo et al. (2010) Cavagnolo, K. W., McNamara, B. R., Nulsen, P. E. J., et al. 2010, ApJ, 720, 1066
- Dabhade et al. (2020) Dabhade, P., Combes, F., Salome, P., Bagchi, J., & Mahato, M. 2020, arXiv e-prints, arXiv:2006.09388
- Dalla Vecchia & Schaye (2008) Dalla Vecchia, C. & Schaye, J. 2008, MNRAS, 387, 1431
- Dasyra et al. (2016) Dasyra, K. M., Combes, F., Oosterloo, T., et al. 2016, A&A, 595, L7
- Dekel & Burkert (2014) Dekel, A. & Burkert, A. 2014, MNRAS, 438, 1870
- Dicken et al. (2014) Dicken, D., Tadhunter, C., Morganti, R., et al. 2014, ApJ, 788, 98
- Donnari et al. (2020) Donnari, M., Pillepich, A., Nelson, D., et al. 2020, arXiv e-prints, arXiv:2008.00004
- Eilers et al. (2017) Eilers, A.-C., Davies, F. B., Hennawi, J. F., et al. 2017, ApJ, 840, 24
- Elbaz et al. (2007) Elbaz, D., Daddi, E., Le Borgne, D., et al. 2007, A&A, 468, 33
- Fang et al. (2013) Fang, J. J., Faber, S. M., Koo, D. C., & Dekel, A. 2013, ApJ, 776, 63
- Fiore et al. (2017) Fiore, F., Feruglio, C., Shankar, F., et al. 2017, A&A, 601, A143
- Fraser-McKelvie et al. (2018) Fraser-McKelvie, A., Brown, M. J. I., Pimbblet, K., Dolley, T., & Bonne, N. J. 2018, MNRAS, 474, 1909
- Gaibler et al. (2011) Gaibler, V., Khochfar, S., & Krause, M. 2011, MNRAS, 411, 155
- Gaibler et al. (2012) Gaibler, V., Khochfar, S., Krause, M., & Silk, J. 2012, MNRAS, 425, 438
- Gaspari et al. (2020) Gaspari, M., Tombesi, F., & Cappi, M. 2020, Nature Astronomy, 4, 10
- Genzel et al. (2014) Genzel, R., Förster Schreiber, N. M., Lang, P., et al. 2014, ApJ, 785, 75
- Gildas Team (2013) Gildas Team. 2013, GILDAS: Grenoble Image and Line Data Analysis Software
- González Delgado et al. (2015) González Delgado, R. M., García-Benito, R., Pérez, E., et al. 2015, A&A, 581, A103
- Hardcastle et al. (2007) Hardcastle, M. J., Evans, D. A., & Croston, J. H. 2007, MNRAS, 376, 1849
- Hardcastle et al. (2012) Hardcastle, M. J., Massaro, F., Harris, D. E., et al. 2012, MNRAS, 424, 1774
- Harrison et al. (2014) Harrison, C. M., Alexander, D. M., Mullaney, J. R., & Swinbank, A. M. 2014, MNRAS, 441, 3306
- Harrison et al. (2016) Harrison, C. M., Simpson, J. M., Stanley, F., et al. 2016, MNRAS, 457, L122
- Heckman et al. (2004) Heckman, T. M., Kauffmann, G., Brinchmann, J., et al. 2004, ApJ, 613, 109
- Jackson et al. (2020) Jackson, R. A., Martin, G., Kaviraj, S., et al. 2020, MNRAS, 494, 5568
- Jamrozy et al. (2005) Jamrozy, M., Machalski, J., Mack, K. H., & Klein, U. 2005, A&A, 433, 467
- Jedrzejewski (1987) Jedrzejewski, R. I. 1987, MNRAS, 226, 747
- Karouzos et al. (2016) Karouzos, M., Woo, J.-H., & Bae, H.-J. 2016, ApJ, 819, 148
- Kauffmann et al. (2003) Kauffmann, G., Heckman, T. M., White, S. D. M., et al. 2003, MNRAS, 341, 54
- Kennicutt (1989) Kennicutt, Robert C., J. 1989, ApJ, 344, 685
- Kennicutt (1998a) Kennicutt, Robert C., J. 1998a, ARA&A, 36, 189
- Kennicutt (1998b) Kennicutt, Robert C., J. 1998b, ApJ, 498, 541
- Kereš et al. (2005) Kereš, D., Katz, N., Weinberg, D. H., & Davé, R. 2005, MNRAS, 363, 2
- Komossa et al. (2018) Komossa, S., Xu, D. W., & Wagner, A. Y. 2018, MNRAS, 477, 5115
- Kormendy & Kennicutt (2004) Kormendy, J. & Kennicutt, Robert C., J. 2004, ARA&A, 42, 603
- Krajnović et al. (2006) Krajnović, D., Cappellari, M., de Zeeuw, P. T., & Copin, Y. 2006, MNRAS, 366, 787
- Kroupa (2001) Kroupa, P. 2001, MNRAS, 322, 231
- Lanz et al. (2016) Lanz, L., Ogle, P. M., Alatalo, K., & Appleton, P. N. 2016, ApJ, 826, 29
- Lelli et al. (2015) Lelli, F., Duc, P.-A., Brinks, E., et al. 2015, A&A, 584, A113
- Leroy et al. (2008) Leroy, A. K., Walter, F., Brinks, E., et al. 2008, AJ, 136, 2782
- Li et al. (2018) Li, J.-T., Bregman, J. N., Wang, Q. D., Crain, R. A., & Anderson, M. E. 2018, ApJ, 855, L24
- Li et al. (2019) Li, J.-T., Zhou, P., Jiang, X., Bregman, J. N., & Gao, Y. 2019, ApJ, 877, 3
- Machalski et al. (2007) Machalski, J., Koziel-Wierzbowska, D., & Jamrozy, M. 2007, Acta Astron., 57, 227
- Mahony et al. (2013) Mahony, E. K., Morganti, R., Emonts, B. H. C., Oosterloo, T. A., & Tadhunter, C. 2013, MNRAS, 435, L58
- Markwardt (2012) Markwardt, C. 2012, MPFIT: Robust non-linear least squares curve fitting
- Martig et al. (2009) Martig, M., Bournaud, F., Teyssier, R., & Dekel, A. 2009, ApJ, 707, 250
- Martig et al. (2013) Martig, M., Crocker, A. F., Bournaud, F., et al. 2013, MNRAS, 432, 1914
- Martin & Kennicutt (2001) Martin, C. L. & Kennicutt, Robert C., J. 2001, ApJ, 555, 301
- Menci et al. (2019) Menci, N., Fiore, F., Feruglio, C., et al. 2019, ApJ, 877, 74
- Mirakhor et al. (2020) Mirakhor, M. S., Walker, S. A., Bagchi, J., et al. 2020, arXiv e-prints, arXiv:2010.15131
- Molina et al. (2021) Molina, J., Wang, et al. 2021, arXiv e-prints, arXiv:2101.00764
- Morganti et al. (2005) Morganti, R., Tadhunter, C. N., & Oosterloo, T. A. 2005, A&A, 444, L9
- Moster et al. (2013) Moster, B. P., Naab, T., & White, S. D. M. 2013, MNRAS, 428, 3121
- Mukherjee et al. (2016) Mukherjee, D., Bicknell, G. V., Sutherland, R., & Wagner, A. 2016, MNRAS, 461, 967
- Mukherjee et al. (2017) Mukherjee, D., Bicknell, G. V., Sutherland, R., & Wagner, A. 2017, MNRAS, 471, 2790
- Mukherjee et al. (2018a) Mukherjee, D., Wagner, A. Y., Bicknell, G. V., et al. 2018a, MNRAS, 476, 80
- Mukherjee et al. (2018b) Mukherjee, D., Wagner, A. Y., Bicknell, G. V., et al. 2018b, MNRAS, 476, 80
- Nesvadba et al. (2011) Nesvadba, N. P. H., Boulanger, F., Lehnert, M. D., Guillard, P., & Salome, P. 2011, A&A, 536, L5
- Nesvadba et al. (2010) Nesvadba, N. P. H., Boulanger, F., Salomé, P., et al. 2010, A&A, 521, A65
- Nesvadba et al. (2017) Nesvadba, N. P. H., De Breuck, C., Lehnert, M. D., Best, P. N., & Collet, C. 2017, A&A, 599, A123
- Nesvadba et al. (2008) Nesvadba, N. P. H., Lehnert, M. D., De Breuck, C., Gilbert, A. M., & van Breugel, W. 2008, A&A, 491, 407
- Nesvadba et al. (2006) Nesvadba, N. P. H., Lehnert, M. D., Eisenhauer, F., et al. 2006, ApJ, 650, 693
- Nyland et al. (2013) Nyland, K., Alatalo, K., Wrobel, J. M., et al. 2013, ApJ, 779, 173
- Ocaña Flaquer et al. (2010) Ocaña Flaquer, B., Leon, S., Combes, F., & Lim, J. 2010, A&A, 518, A9
- Ogle et al. (2007) Ogle, P., Antonucci, R., Appleton, P. N., & Whysong, D. 2007, ApJ, 668, 699
- Ogle et al. (2010) Ogle, P., Boulanger, F., Guillard, P., et al. 2010, ApJ, 724, 1193
- Ogle et al. (2019) Ogle, P. M., Jarrett, T., Lanz, L., et al. 2019, ApJ, 884, L11
- Peng & Renzini (2020) Peng, Y.-j. & Renzini, A. 2020, MNRAS, 491, L51
- Planck Collaboration et al. (2018) Planck Collaboration, Aghanim, N., Akrami, Y., et al. 2018, ArXiv e-prints
- Posti & Fall (2021) Posti, L. & Fall, S. M. 2021, arXiv e-prints, arXiv:2102.11282
- Posti et al. (2019) Posti, L., Fraternali, F., & Marasco, A. 2019, A&A, 626, A56
- Renzini (2020) Renzini, A. 2020, MNRAS, 495, L42
- Revaz et al. (2008) Revaz, Y., Combes, F., & Salomé, P. 2008, A&A, 477, L33
- Rupke et al. (2005) Rupke, D. S., Veilleux, S., & Sanders, D. B. 2005, ApJ, 632, 751
- Sabater et al. (2019) Sabater, J., Best, P. N., Hardcastle, M. J., et al. 2019, A&A, 622, A17
- Saintonge et al. (2012) Saintonge, A., Tacconi, L. J., Fabello, S., et al. 2012, ApJ, 758, 73
- Salpeter (1959) Salpeter, E. E. 1959, ApJ, 129, 608
- Santoro et al. (2020) Santoro, F., Tadhunter, C., Baron, D., Morganti, R., & Holt, J. 2020, A&A, 644, A54
- Schmidt (1959) Schmidt, M. 1959, ApJ, 129, 243
- Shi et al. (2011) Shi, Y., Helou, G., Yan, L., et al. 2011, ApJ, 733, 87
- Shi et al. (2018) Shi, Y., Yan, L., Armus, L., et al. 2018, ApJ, 853, 149
- Singh et al. (2015) Singh, V., Ishwara-Chandra, C. H., Sievers, J., et al. 2015, MNRAS, 454, 1556
- Solomon et al. (1997) Solomon, P. M., Downes, D., Radford, S. J. E., & Barrett, J. W. 1997, ApJ, 478, 144
- Tacchella et al. (2016) Tacchella, S., Dekel, A., Carollo, C. M., et al. 2016, MNRAS, 458, 242
- Tadhunter (2016) Tadhunter, C. 2016, A&A Rev., 24, 10
- Tadhunter et al. (1998) Tadhunter, C. N., Morganti, R., Robinson, A., et al. 1998, MNRAS, 298, 1035
- Tamburro et al. (2009) Tamburro, D., Rix, H. W., Leroy, A. K., et al. 2009, AJ, 137, 4424
- Toomre (1964) Toomre, A. 1964, ApJ, 139, 1217
- Voit et al. (2015) Voit, G. M., Bryan, G. L., O’Shea, B. W., & Donahue, M. 2015, ApJ, 808, L30
- Walker et al. (2015) Walker, S. A., Bagchi, J., & Fabian, A. C. 2015, MNRAS, 449, 3527
- White & Rees (1978) White, S. D. M. & Rees, M. J. 1978, MNRAS, 183, 341
- Woo et al. (2016) Woo, J.-H., Bae, H.-J., Son, D., & Karouzos, M. 2016, ApJ, 817, 108
- Zhou et al. (2020) Zhou, S., Li, C., Hao, C.-N., et al. 2020, arXiv e-prints, arXiv:2011.13749
- Zovaro et al. (2019) Zovaro, H. R. M., Sharp, R., Nesvadba, N. P. H., et al. 2019, MNRAS, 484, 3393