11email: rdokara@mpifr-bonn.mpg.de 22institutetext: National Radio Astronomy Observatory, 520 Edgemont Road, Charlottesville, VA 22903, USA 33institutetext: South African Radio Astronomy Observatory, 2 Fir St, Black River Park, Observatory 7925, South Africa 44institutetext: Department of Physics and Astronomy, West Virginia University, Morgantown WV 26506, USA 55institutetext: Centre for Astrophysics and Planetary Science, University of Kent, Canterbury, CT2 7NH, UK 66institutetext: Max Planck Institute for Astronomy, Königstuhl 17, 69117, Heidelberg, Germany 77institutetext: Laboratoire d’astrophysique de Bordeaux, Univ. Bordeaux, CNRS, B18N, allée Geoffroy Saint-Hilaire, 33615, Pessac, France 88institutetext: Instituto de Radioastronomía y Astrofísica (IRyA), Universidad Nacional Autónoma de México Morelia, 58089, Mexico 99institutetext: Department of Physics, Indian Institute of Science, Bengaluru, India 560012
A global view on star formation: The GLOSTAR Galactic plane survey
Abstract
Context. The properties of the population of Galactic supernova remnants (SNRs) are essential to our understanding of the dynamics of the interstellar medium (ISM) in the Milky Way. However, the completeness of the catalog of Galactic SNRs is expected to be only , with on order 700 SNRs yet to be detected. Deep interferometric radio continuum surveys of the Galactic plane help in rectifying this apparent deficiency by identifying low surface brightness SNRs and compact SNRs that have not been detected in previous surveys. However, SNRs are routinely confused with H ii regions, which can have similar radio morphologies. Radio spectral index, polarization, and emission at mid-infrared (MIR) wavelengths can help distinguish between SNRs and H ii regions.
Aims. We aim to identify SNR candidates using continuum images from the Karl G. Jansky Very Large Array GLObal view of the STAR formation in the Milky Way (GLOSTAR) survey.
Methods. GLOSTAR is a C-band (4–8 GHz) radio wavelength survey of the Galactic plane covering . The continuum images from this survey, which resulted from observations with the most compact configuration of the array, have an angular resolution of . We searched for SNRs in these images to identify known SNRs, previously identified SNR candidates, and new SNR candidates. We study these objects in MIR surveys and the GLOSTAR polarization data to classify their emission as thermal or nonthermal.
Results. We identify 157 SNR candidates, of which 80 are new. Polarization measurements provide evidence of nonthermal emission from 9 of these candidates. We find that two previously identified candidates are filaments. We also detect emission from 91 of the 94 known SNRs in the survey region. Four of these are reclassified as H ii regions following detection in MIR surveys.
Conclusions. The better sensitivity and resolution of the GLOSTAR data have led to the identification of 157 SNR candidates, along with the reclassification of several misidentified objects. We show that the polarization measurements can identify nonthermal emission, despite the diffuse Galactic synchrotron emission. These results underscore the importance of higher resolution and higher sensitivity radio continuum data in identifying and confirming SNRs.
Key Words.:
ISM: supernova remnants – Radio continuum: ISM – polarization – ISM: H ii regions – surveys1 Introduction
Supernova remnants (SNRs) inject energy and material into the interstellar medium (ISM) of the Galaxy; they produce and accelerate cosmic rays, drive turbulence within molecular clouds, and impact the dynamics of the ISM (Iffrig & Hennebelle, 2017; Brose et al., 2020). Based on the statistics of massive stars, pulsars, supernova rates, and iron abundances, it was estimated that the Milky Way should contain SNRs (Li et al., 1991; Tammann et al., 1994). However, the most recent version of the catalog of Galactic SNRs (Green, 2019) contains fewer than objects, pointing to a large inconsistency. This is thought to be the result of observational bias that hinders the detection of low surface brightness SNRs in the one extreme, and the small angular size of many SNRs in the other (Brogan et al., 2006; Anderson et al., 2017).
Radio surveys covering the Galactic plane have proved to be highly effective in the identification of SNR candidates en masse (see Dubner & Giacani, 2015, for a review including a historical perspective). While single-dish telescopes have repeatedly been used to study Galactic SNRs (see Clark & Caswell, 1976; Sun et al., 2011, for instance), more recent efforts using interferometer arrays have identified more than candidates in data from the following projects: a 330 MHz survey conducted with the Very Large Array (VLA) by Brogan et al. (2006), the 1.4 GHz Multi-Array Galactic Plane Imaging Survey (MAGPIS; Helfand et al., 2006), the 843 MHz Molonglo Galactic Plane Survey (MGPS; Green et al., 2014), the 1–2 GHz H i, OH, Recombination line survey of the Milky Way (THOR; Anderson et al., 2017), and the 80–300 MHz GaLactic and Extragalactic All-sky Murchison Widefield Array survey (GLEAM; Hurley-Walker et al., 2019a).
Generally, objects are labeled as SNR candidates when there is an indication of nonthermal emission from only one or two studies, and they may be ”confirmed” when more evidence is demonstrated. Of the SNR candidates identified so far, only a fraction have been confirmed as SNRs (see Hurley-Walker et al., 2019b).
H ii regions, like SNRs, are routinely observed at radio wavelengths, and also have a morphology similar to that of SNRs in the radio continuum. This represents a major obstacle in the confirmation of more candidates as SNRs. In the earlier versions of the catalog of Galactic SNRs by Green (2019), several objects that were thought to be SNRs were subsequently reclassified as H ii regions (Anderson et al., 2017; Hurley-Walker et al., 2019b; Gao et al., 2019). In addition, pulsar wind nebulae (PWNe), also referred to as plerion or Crab-like remnants, are another source of confusion. Their emission is driven by the winds from the central pulsar and they may have a spectral index111The spectral index, , is defined as the slope of the linear fit to the log-log plot of flux density, , versus frequency, : similar to that of H ii regions (Gaensler & Slane, 2006), although some exceptions are known (see Kothes et al., 2008). An extended radio object in the Galaxy may be classified as a SNR or an H ii region based on whether its emission is thermal or nonthermal. H ii regions emit thermal Bremsstrahlung radiation, which is unpolarized and has a spectral index of depending on the optical thickness (Wilson et al., 2013). These regions also show strong mid-infrared (MIR) radiation emitted by warm dust and polycyclic aromatic hydrocarbons (Cox et al., 1986; Churchwell et al., 2009). On the other hand, the emission from SNRs is primarily nonthermal synchrotron radiation emitted by relativistic electrons gyrating around magnetic field lines in a magneto-ionic medium. Synchrotron emission has a characteristic falling spectral index (), and is generally linearly polarized (Wilson et al., 2013). PWNe may have a thermal-like spectral index (), but their emission is nevertheless linearly polarized. SNRs are also generally quite faint or even not detected at MIR wavelengths (Fürst et al., 1987). Whiteoak & Green (1996) measured the ratio of m MIR to 36 cm radio flux densities of SNRs and H ii regions to be typically 50 and respectively.
The above characteristics help to distinguish SNRs from H ii regions. In particular, the presence or absence of MIR wavelength emission has been widely used as a criterion by many of the aforementioned surveys. In this paper, we identify SNR candidates using radio continuum data from the D-array data of the GLObal view of STAR formation in the Milky Way survey that we conducted with the Karl G. Jansky VLA (GLOSTAR-VLA, Brunthaler et al., 2020; Medina et al., 2019). For these objects, along with already confirmed SNRs and previously identified candidates, we have examined MIR surveys and the polarization data of GLOSTAR-VLA in order to classify their emission as thermal or nonthermal.
This paper has the following structure: In §2, we discuss the GLOSTAR-VLA radio and the GLIMPSE and MIPSGAL MIR surveys, as well as the catalogs of H ii regions and known and candidate SNRs. In §3, we describe the method we use to identify new SNR candidates and the process of measuring the linearly polarized and total flux densities of extended objects. In §4, we present the results, consider their implications, and discuss several individual objects. §5 summarizes our work and concludes with remarks on future efforts.
2 Data
2.1 GLOSTAR survey
The GLOSTAR survey, with a – GHz frequency band, covers the Galactic center region and the first quadrant of the Galactic plane up to a Galactic longitude of in a wide band in latitude, . In addition, the Cygnus X region was covered, but is not considered in the present study. It was performed with the Jansky VLA in the compact D-configuration, and in the more extended B-configuration with the wideband receivers observing in full polarization in a mixed setup of continuum and spectral lines. For this paper, we used only the D-array continuum data covering the region . Calibration and imaging of the continuum data are done using standard VLA procedures and calibrators. Details of the data reduction of a part of the survey () are described by Medina et al. (2019) and a full presentation will be given by Brunthaler et al. (2020) and Medina et al. (in prep.).
The products of the continuum data-reduction process are mosaic FITS cubes of Stokes , and , with each mosaic covering about 16 square degrees. Each cube has 11 planes containing the images for 9 frequency intervals across the 4–8 GHz band with sections affected by man-made radio frequency interference (RFI) discarded, an averaged image, and the in-band spectral index map computed from the 9 frequency planes. The averaged image is obtained by taking a mean of each pixel across the 9 planes weighted by the inverse of the square of the RMS noise. This averaged image has an effective frequency of 5.8 GHz. The images were smoothed to a common resolution of after the CLEAN process. The RMS noise of the averaged Stokes images typically ranges from to Jy (Medina et al., 2019).
Although the largest scale that can be observed () is about , mosaicking the pointings helped recover several larger angular scale structures (see Medina et al., 2019). However, there still exists a significant fraction of undetected flux density in objects larger than , especially in the higher frequency images. This “missing” flux density causes a systematic reduction of spectral index. Measuring the spectral index of an extended structure is only logical if the angular scales being probed are roughly the same at all of the frequencies employed for its determination. Within the 4–8 GHz band of GLOSTAR, the highest frequency images are only sensitive to structures smaller than , and the lowest frequency images to . There is also no added single-dish data, making the interpretation of spectral index of an extended object quite uncertain. Almost all the objects that we discuss in this paper have sizes larger than , and we typically recover only a fraction of the flux density of extended objects (further discussed in §4.2.1). Therefore, the GLOSTAR-VLA flux densities we report are only used as lower limits, and we measure spectral index only in two cases: (i) if the size of the object is comparable to the beam, in which case the spectral index derived would be reliable, and (ii) for deriving a lower limit of the spectral index by comparing the GLOSTAR-VLA flux density with lower frequency data that have comparatively reliable flux density estimates, such as the 1.4 GHz THOR+VGPS. In the second case, a lower limit on the spectral index close to zero is useful in identifying thermal emission and PWNe, because SNRs (other than PWNe) do not have a spectral index .
2.2 Other surveys covering the Galactic plane
The Galactic Legacy Infrared Mid-Plane Survey Extraordinaire (GLIMPSE) is a four-band (–m) survey of the Galactic plane by the Spitzer Space Telescope covering and to , with a resolution (Churchwell et al., 2009). The MIPS Galactic plane survey (MIPSGAL) is a complementary m and m survey by Spitzer with coverage overlapping with that of the GLIMPSE survey (Carey et al., 2009). The resolutions of the m and m bands are and , respectively. Anderson et al. (2014) report that the sensitivity of these MIR surveys is good enough to detect all the H ii regions present in the Milky Way.
We also studied the mosaics of recent radio surveys such as the NRAO VLA Sky Survey (NVSS; Condon et al., 1998)222https://www.cv.nrao.edu/nvss/postage.shtml and the TIFR GMRT Sky Survey (TGSS; Intema et al., 2017)333https://vo.astron.nl/tgssadr/q_fits/cutout/form. The Galactic plane surveys MAGPIS (Helfand et al., 2006)444https://third.ucllnl.org/cgi-bin/gpscutout and THOR+VGPS (Beuther et al., 2016)555https://www2.mpia-hd.mpg.de/thor/Overview.html are particularly useful because they are at lower frequencies, but with surface brightness sensitivity comparable to that of the GLOSTAR-VLA data. As the 1.4 GHz MAGPIS has a resolution of , we convolved these data to the beam size of GLOSTAR-VLA () for our analysis.
2.3 Lists of objects
We search the literature for previously identified SNRs and H ii regions. We find the catalogs by Green (2019) and Anderson et al. (2014) to be the most authoritative compilations of SNRs and H ii regions respectively. A brief description of these catalogs, along with some recent SNR candidate lists, is given below.
2.3.1 The catalog of Galactic SNRs
The D. Green catalog of Galactic SNRs is updated every few years with additions of new SNRs and removals of misidentified objects (see Green, 2019, and references therein). The most recent version contains SNRs, with 94 of these being found in the region covered by the GLOSTAR survey. Hereafter, we refer to these objects as G19 SNRs.
2.3.2 WISE catalog of H II regions
Anderson et al. (2014) produced the most complete catalog of H ii regions in the Milky Way using data from the Wide-Field Infrared Survey Explorer (WISE) satellite. It contains about 6000 candidate H ii regions (identified using their characteristic MIR morphology) and about confirmed H ii regions (with radio recombination line or H emission) spanning the entire Galaxy. The GLOSTAR survey region contains the positions of approximately confirmed H ii regions in this catalog. We hereafter refer to these objects as A14 H ii regions.
2.3.3 Previously discovered SNR candidates
We compiled a list of SNR candidates from the literature, especially focusing on large-area surveys that have a significant overlap with the GLOSTAR survey region. These are summarized below.
-
•
Using data from the THOR survey with the VGPS data added, Anderson et al. (2017) identified 76 SNR candidates. The GLOSTAR survey region covers 74 of these candidates.
-
•
Helfand et al. (2006) discovered 49 “high-probability” SNR candidates in the MAGPIS data, all of which are located in the GLOSTAR survey region.
-
•
The inner Galactic plane was observed at 330 MHz using the VLA by Brogan et al. (2006) and 35 SNR candidates were discovered, all of which are covered in the GLOSTAR survey region.
-
•
Hurley-Walker et al. (2019a) identified 27 SNR candidates using data from the GLEAM survey. The GLOSTAR survey region covers 10 of these candidates.
-
•
An internet-accessible version666http://www.mrao.cam.ac.uk/surveys/snrs/snrs.info.html of the catalog of Galactic SNRs by Green (2019) discusses several candidates identified across the electromagnetic spectrum. A machine-readable list of 70 SNR candidates in the GLOSTAR survey region was provided by D. Green in a private communication.
From these previously reported SNR candidates, we removed the objects that have already been included in either the G19 SNR or the A14 H ii region catalogs, and those that were noted as misidentifications, such as the candidates discussed by Anderson et al. (2017, Section 4.3). The GLOSTAR-VLA data were then searched by eye at the positions of the remaining objects. From this search, we identify 77 previously reported SNR candidates (presented in Table LABEL:tab:prevcandSNRs). The process that was followed to discover new SNR candidates is explained below in §3.1.
3 Methods
3.1 Identification of new candidate SNRs
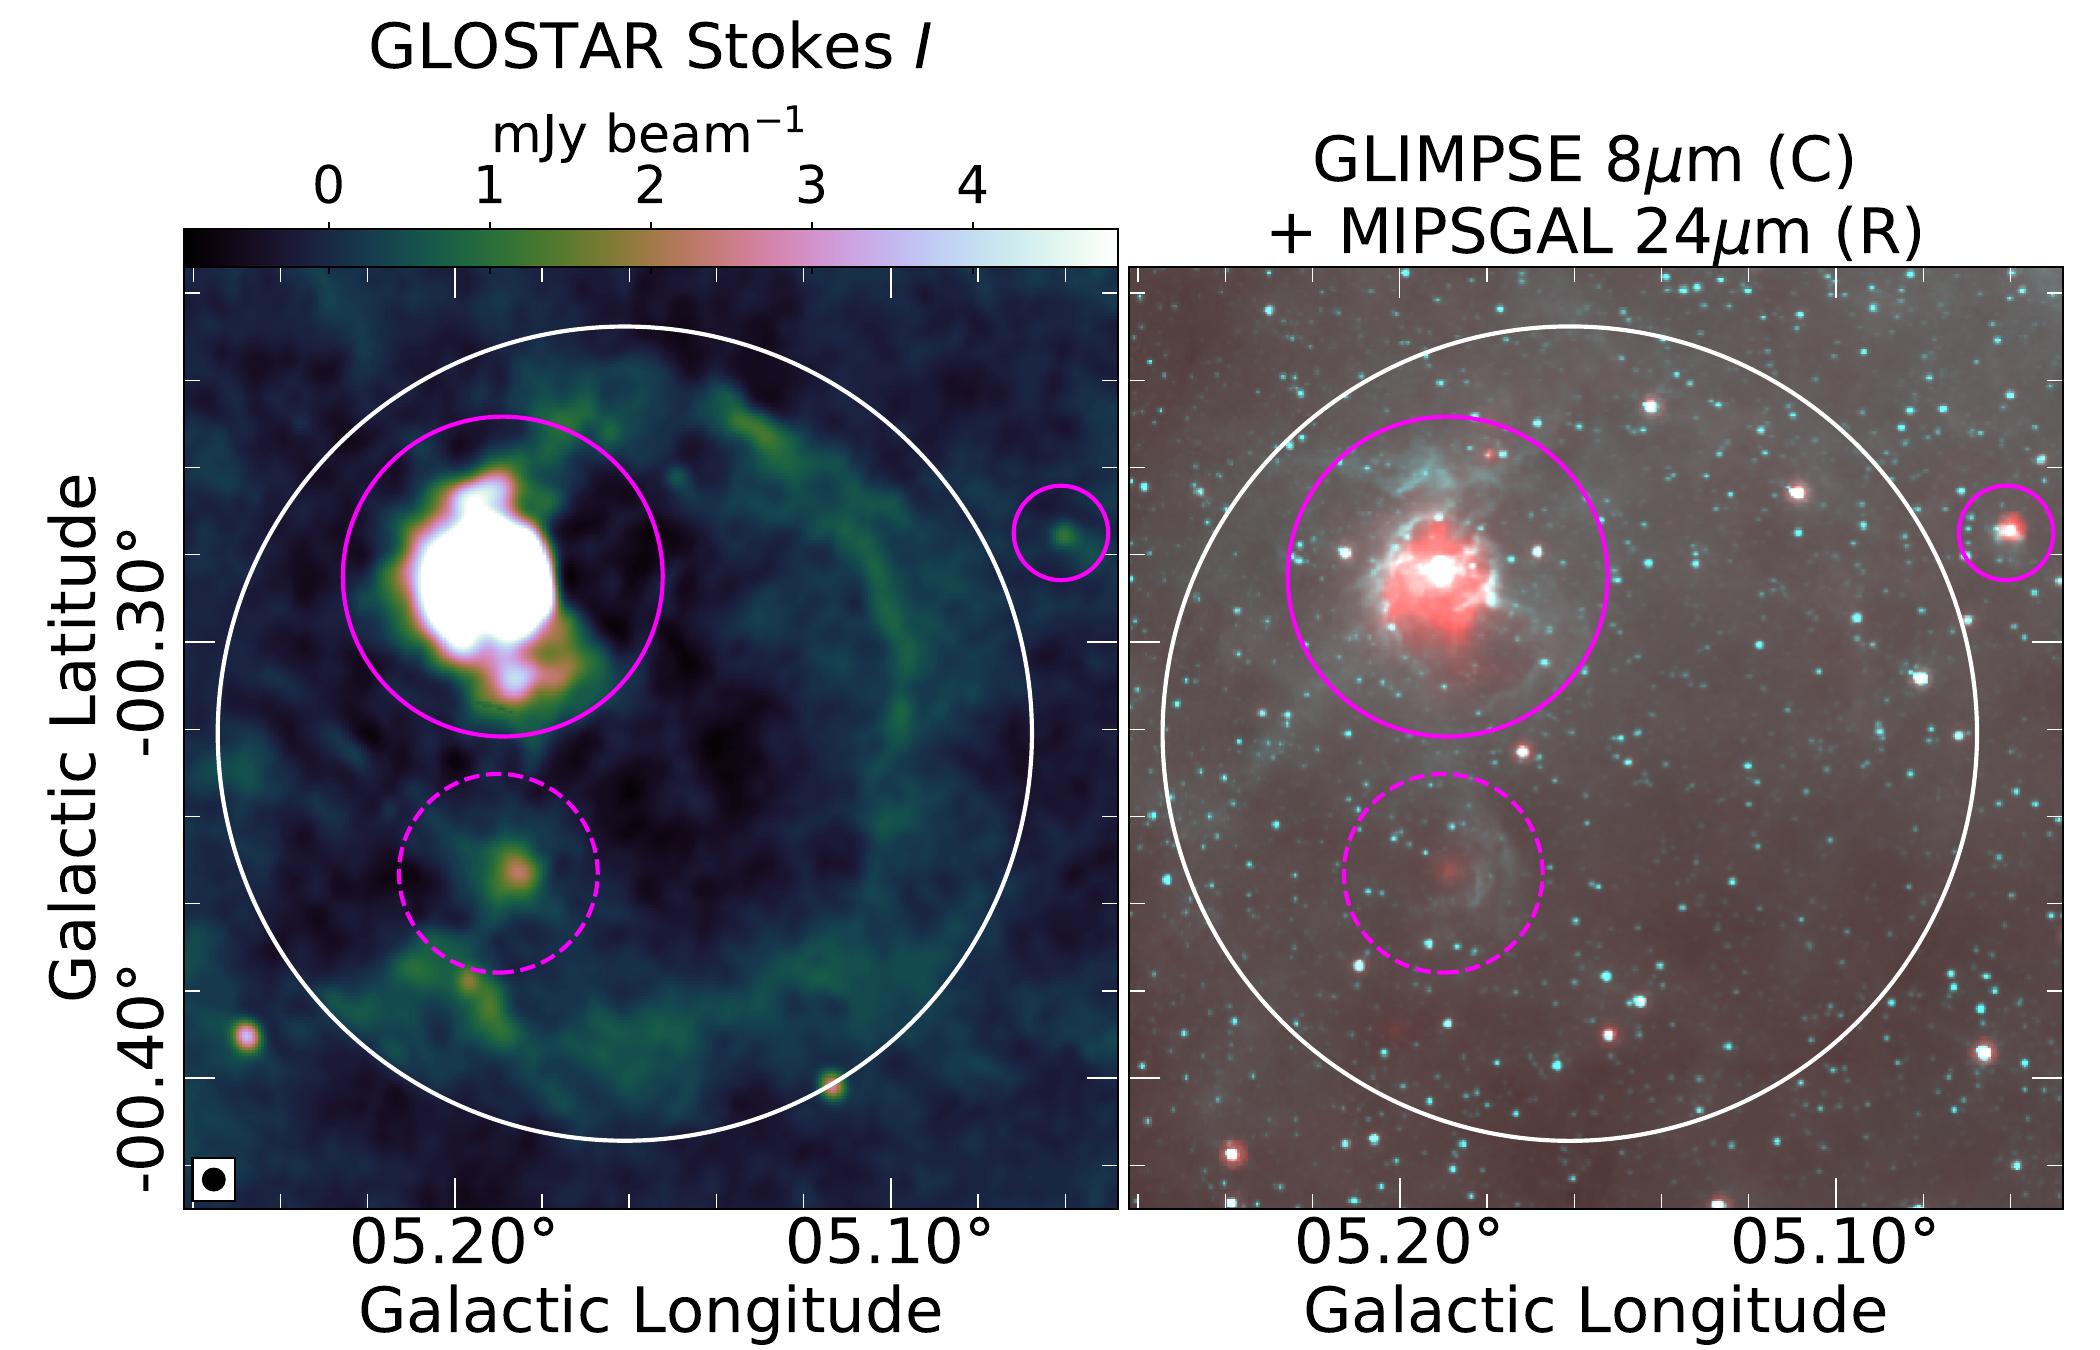
In order to identify new SNR candidates, we follow an approach that is not biased toward any particular morphology and is similar to the process followed by Anderson et al. (2017). First, we searched the GLOSTAR-VLA Stokes 5.8 GHz integrated mosaics by eye for extended emission regions that are absent from the list of previously identified objects (including previously discovered SNR candidates; see §2.3). We ignored regions where the negative side lobes are as strong as the emission. These radio emissions are then searched for in the images of GLIMPSE m and MIPSGAL m MIR surveys, again visually. At MIR wavelengths, SNRs usually emit little or no radiation. In some cases, such as SNR W49B, they may have significant MIR emission, but the MIR-to-radio flux density ratio is still low (Whiteoak & Green, 1996; Pinheiro Gonçalves et al., 2011). Conversely, H ii regions have strong MIR emission and generally have a characteristic radio-MIR morphology: coincident radio and m emissions, which are surrounded by m emission (see Churchwell et al., 2009, for instance). Therefore, the objects that are associated with strong MIR emission in either of the GLIMPSE m or MIPSGAL m images are removed from our list. What remains is a group of previously unclassified extended objects that emit at radio wavelengths and have no associated MIR emission. A circular region is defined for each object such that it encompasses its radio emission, and if only an arc or a partial shell is observed, then the curvature is followed. Figure 1 shows the GLOSTAR-VLA and MIR images of an example GLOSTAR SNR candidate G005.1610.321. Although there is MIR emission from this region, it is confined to the H ii regions G005.1890.285 and G005.1890.354, but absent from the shell of the SNR candidate G005.1610.321.
We do not make use of the GLOSTAR-VLA source catalogs by Medina et al. (in prep) and Medina et al. (2019) because their method is optimized to identify compact sources with high reliability. These latter authors use SExtractor (Bertin & Arnouts, 1996) to create the background noise map, and then BLOBCAT (Hales et al., 2012) to perform the automated source extraction. A mesh size of 8080 pixels2 and a detection threshold of were used. In addition, during the visual inspection stage, these latter authors exclude the sources with low signal-to-noise ratio if no counterparts are found in MIR surveys (see Medina et al., 2019, for details). This process imparts a two-fold systematic bias against identifying SNR candidates. Firstly, the constant mesh size is not suitable for identifying extended emission as noise levels are overestimated777A mesh size of 8080 pixels2 ( beam2) is too small for SExtractor’s sigma-clipping algorithm to converge on a robust background in a region with extended emission., and as we aim to identify candidates that have not been detected before, we expect these objects to be quite faint and possibly be judged by the software as background noise. Secondly, as the counterparts for these sources are searched only in MIR surveys during the visual inspection, SNRs are again excluded because they typically have no MIR emission. For these reasons, we search the images visually. An assessment of our confidence level that an object is not an interferometric artefact can be made by comparing the flux density with its uncertainty, whose measurements are explained in the following section.
3.2 Measuring flux densities
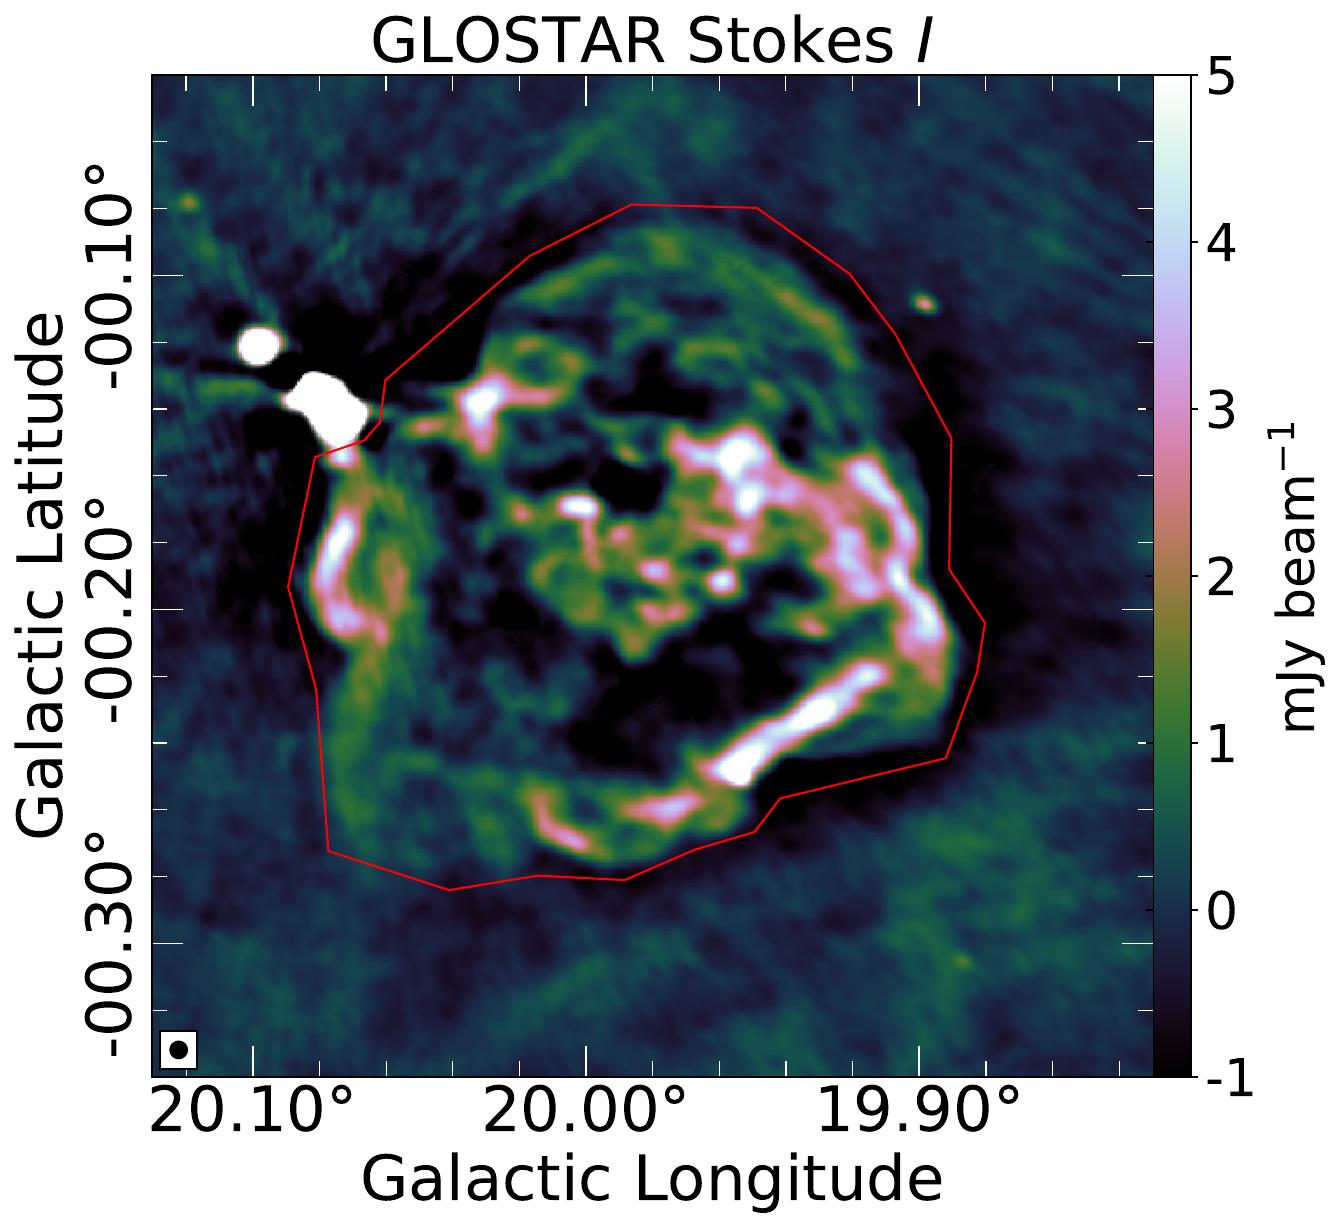
Because of confusion in the crowded Galactic plane, measuring the integrated flux densities of extended objects is not straightforward. The lack of short-spacing data and the poor -coverage of snapshot observations cause strong negative side lobes near bright sources, further complicating the issue. For these reasons, we decided to manually measure the flux densities by drawing a polygon aperture around the emission that is clearly associated with the object being analyzed. An example illustrating this procedure is shown in Fig. 2.
The total flux density is measured using the integrated mosaic at an effective frequency of GHz. In order to solve the negative side lobe problem, we masked all pixels below , where is the background RMS in the surrounding regions determined using an iterative sigma-clipping algorithm. The integrated flux density, , of an object and the error in this measurement, , are given by
| (1) |
where is the value of the pixel, is the area of the beam in number of pixels, is the number of pixels in the aperture defined for the source, and is the summation index that runs over the pixels with values greater than the threshold ().
We do not attempt to measure the flux densities of partially observed or severely confused objects, and of those that overlap with clear artefacts that arise from imperfect CLEANing. We note that the Stokes flux densities are generally only lower limits due to missing short spacing data. Nevertheless, we report these values because they can be used to derive useful information such as the degree of polarization and spectral index limits.
We measure linearly polarized flux densities, , in each frequency plane first and then use the weighted mean and variance of these values to obtain the source integrated linearly polarized flux density and its uncertainty. This is done in order to take care of any bandwidth de-polarization effects, which may cause significant de-polarization in the GHz wide bandwidth of our survey. To include only the statistically significant pixels, we applied two masks to each plane of the Stokes and mosaics: one based on the Stokes () and the other on the Stokes or (, where is the local RMS noise888 generally varies from to Jy.). This masking also somewhat helps in the removal of low-level noise, and spurious polarization from artefacts.
Apart from artefacts due to bright, compact sources, we also observe spurious polarization in regions without Stokes counterparts (see e.g., §4.6.3), and also from a few H ii regions. This may be caused by diffuse Galactic synchrotron emission, or a foreground intervening ionized medium with a strong magnetic field generally known as a Faraday screen (see Sun et al., 2007, for instance). Unlike Stokes , which has mostly smooth structure, Stokes and have fine-scale structure that is not filtered out by the interferometer. As we limit the polarization measurement to only the pixels above a level in the Stokes , the effects of differential filtering and diffuse emissions are minimized. However, we note that the degree of polarization, , is an overestimate because the filtering in Stokes is much more severe compared to Stokes and due to the small-scale structure mentioned above (also see Section 4.1 of Gaensler et al., 2001).
There exists a bias in the measured polarization because the uncertainties in Stokes and are added, which results in a positive polarization measurement even if the true polarization is null. We corrected for this polarization bias in each pixel using
| (2) |
where is the noise in Stokes and maps (Wardle & Kronberg, 1974). Above , all bias estimators converge (see Fig. 2 of Simmons & Stewart, 1985), and we masked all pixels below . Hence, we do not expect the choice of method of bias estimation to influence the measurement significantly.
3.3 Rotation measures and electric field vectors
When electromagnetic radiation passes through a plasma with a nonzero magnetic field along the direction of propagation, the birefringence property of the medium causes the polarization vector to rotate. This is known as the Faraday effect. The rotation of the electric vector position angle (EVPA; ) can be measured using the relation
| (3) |
where is the wavelength and RM is the rotation measure. The RM is the strength of the magnetic field component parallel to the line of sight (l.o.s.), , weighted by the electron density, , in the foreground medium integrated along the l.o.s.:
| (4) |
Although Faraday rotation measure synthesis is necessary to fully disentangle the contribution of different ionized sources along the l.o.s. to the RM (Brentjens & de Bruyn, 2005), the reduced GLOSTAR-VLA data are not suited for such an analysis because of the large width ( rad m-2) of the RM transfer function (see equation 61 of Brentjens & de Bruyn, 2005). Therefore, we estimate the RM from the slope of a simple linear fit of EVPA versus wavelength-squared, where such a fit is possible. The EVPA at is then estimated by extrapolating the linear fit, which is plotted on the polarization maps such as Fig. 13. This fitting and estimation of EVPAs at are handled by the function RMFit.Cube of the software Obit (Cotton, 2008). Given an input of Stokes and cubes, RMFit.Cube produces maps of the RM and the EVPAs at .
4 Results
4.1 Degree of linear polarization as a measure of nonthermal emission
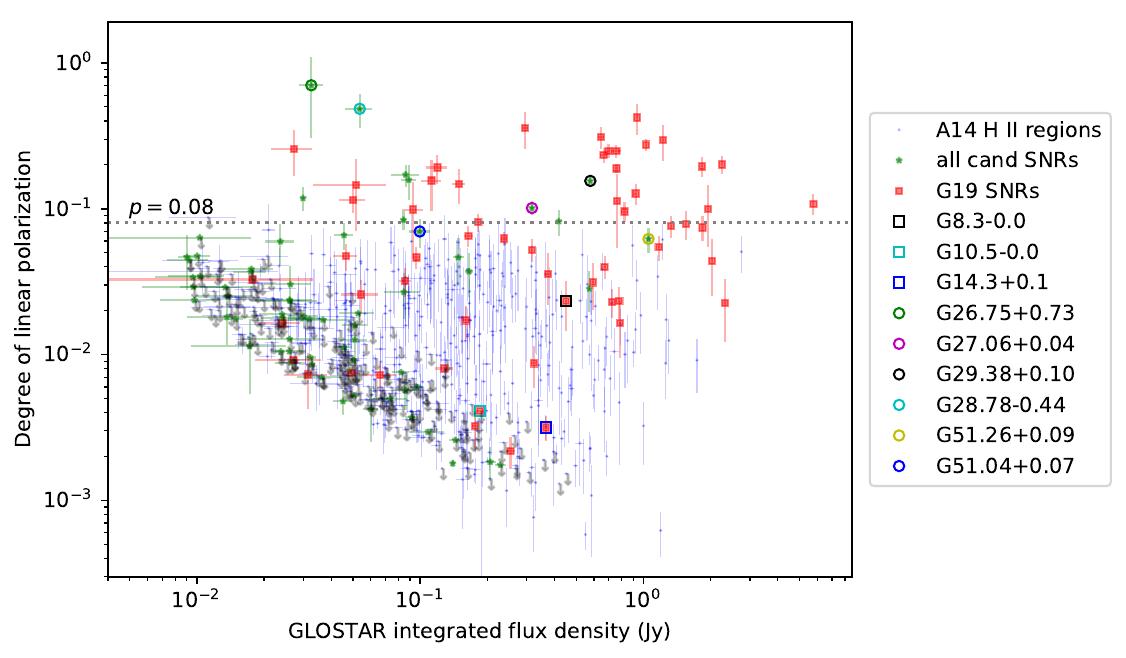
Synchrotron radiation, which is emitted by SNRs, is linearly polarized with a degree of linear polarization () that can be as high as 0.7 (Wilson et al., 2013), although only a few SNRs have been reported to have a degree polarization larger than 0.5 (Kothes et al., 2017). Thermal emission from H ii regions on the other hand is inherently unpolarized. However, because of the diffuse Galactic synchrotron emission, H ii regions may also show an apparent polarized emission. To confirm that the SNRs have higher degrees of polarization than the H ii regions, we plotted the degree of linear polarization against the source integrated total flux density for the three samples of A14 H ii regions, G19 SNRs, and SNR candidates (Fig. 3). The method used to measure the flux densities is discussed in §3.2.
We measure significant polarized emission from most SNRs, and also some H ii regions. The polarized emission from H ii regions is probably from the diffuse Galactic synchrotron emission. Some SNRs have a low degree of polarization, which is not uncommon (see Sun et al., 2011). However, the majority of SNRs have a higher degree of polarization than H ii regions. As no H ii region brighter than 9 mJy has , we use this as the threshold to separate SNRs from H ii regions and the diffuse Galactic synchrotron emission. Confirming the candidates with a lower degree of polarization will require further observations at different wavelengths.
4.2 G19 SNRs
We identify 91 out of 94 objects in the catalog of Galactic SNRs (G19 SNRs, Green, 2019) covered in the GLOSTAR survey region. The SNRs G0.00.0 and G0.30.0 near the Galactic center are in a heavily confused region, and the radio emission from the SNR G32.10.9 still remains undetected. The positions of these objects along with their measured flux densities are given in Table LABEL:table:G19SNRs. Studying the GLOSTAR-VLA images, we find that four G19 SNRs are actually H ii regions, and four have ambiguous radio emission. We briefly discuss these objects in §4.2.2 and §4.2.3. Below, we discuss the flux densities of G19 SNRs as measured in the GLOSTAR-VLA data.
4.2.1 Flux densities of G19 SNRs
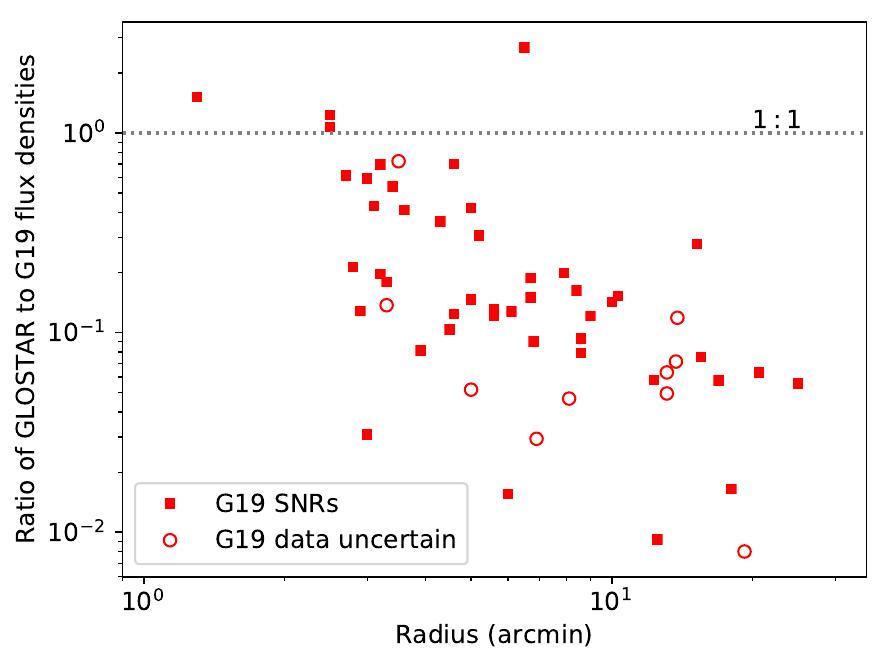
Because of the missing short-spacing information, there is a significant amount of undetected flux density in the GLOSTAR-VLA data. The amount of flux density recovered depends on the scale and structure of the emission, although spectral index also plays a role because of the wide bandwidth of the survey. While it is true that a single power-law model may not suffice for extrapolating over a wide range of frequencies, one can still get a rough estimation of the undetected flux density by measuring the flux densities of known extended objects. Green (2019) report a flux density and spectral index for most objects in their catalog (albeit without uncertainties in the measurements). In Fig. 4, we plot the ratio of the GLOSTAR-VLA flux density to the G19 flux density, scaled to 5.8 GHz using their individual spectral indices, against the radius of each object in the G19 catalog. The median ratio is . As expected, most objects fall below the 1:1 line, and the amount of flux density not recovered increases with the size of the object. There are four G19 SNRs with ratios , with the largest ratio being . This is probably because of uncertainties in the G19 flux density, and the fact that SNRs need not follow a single power-law model.
4.2.2 H II regions mistaken for SNRs
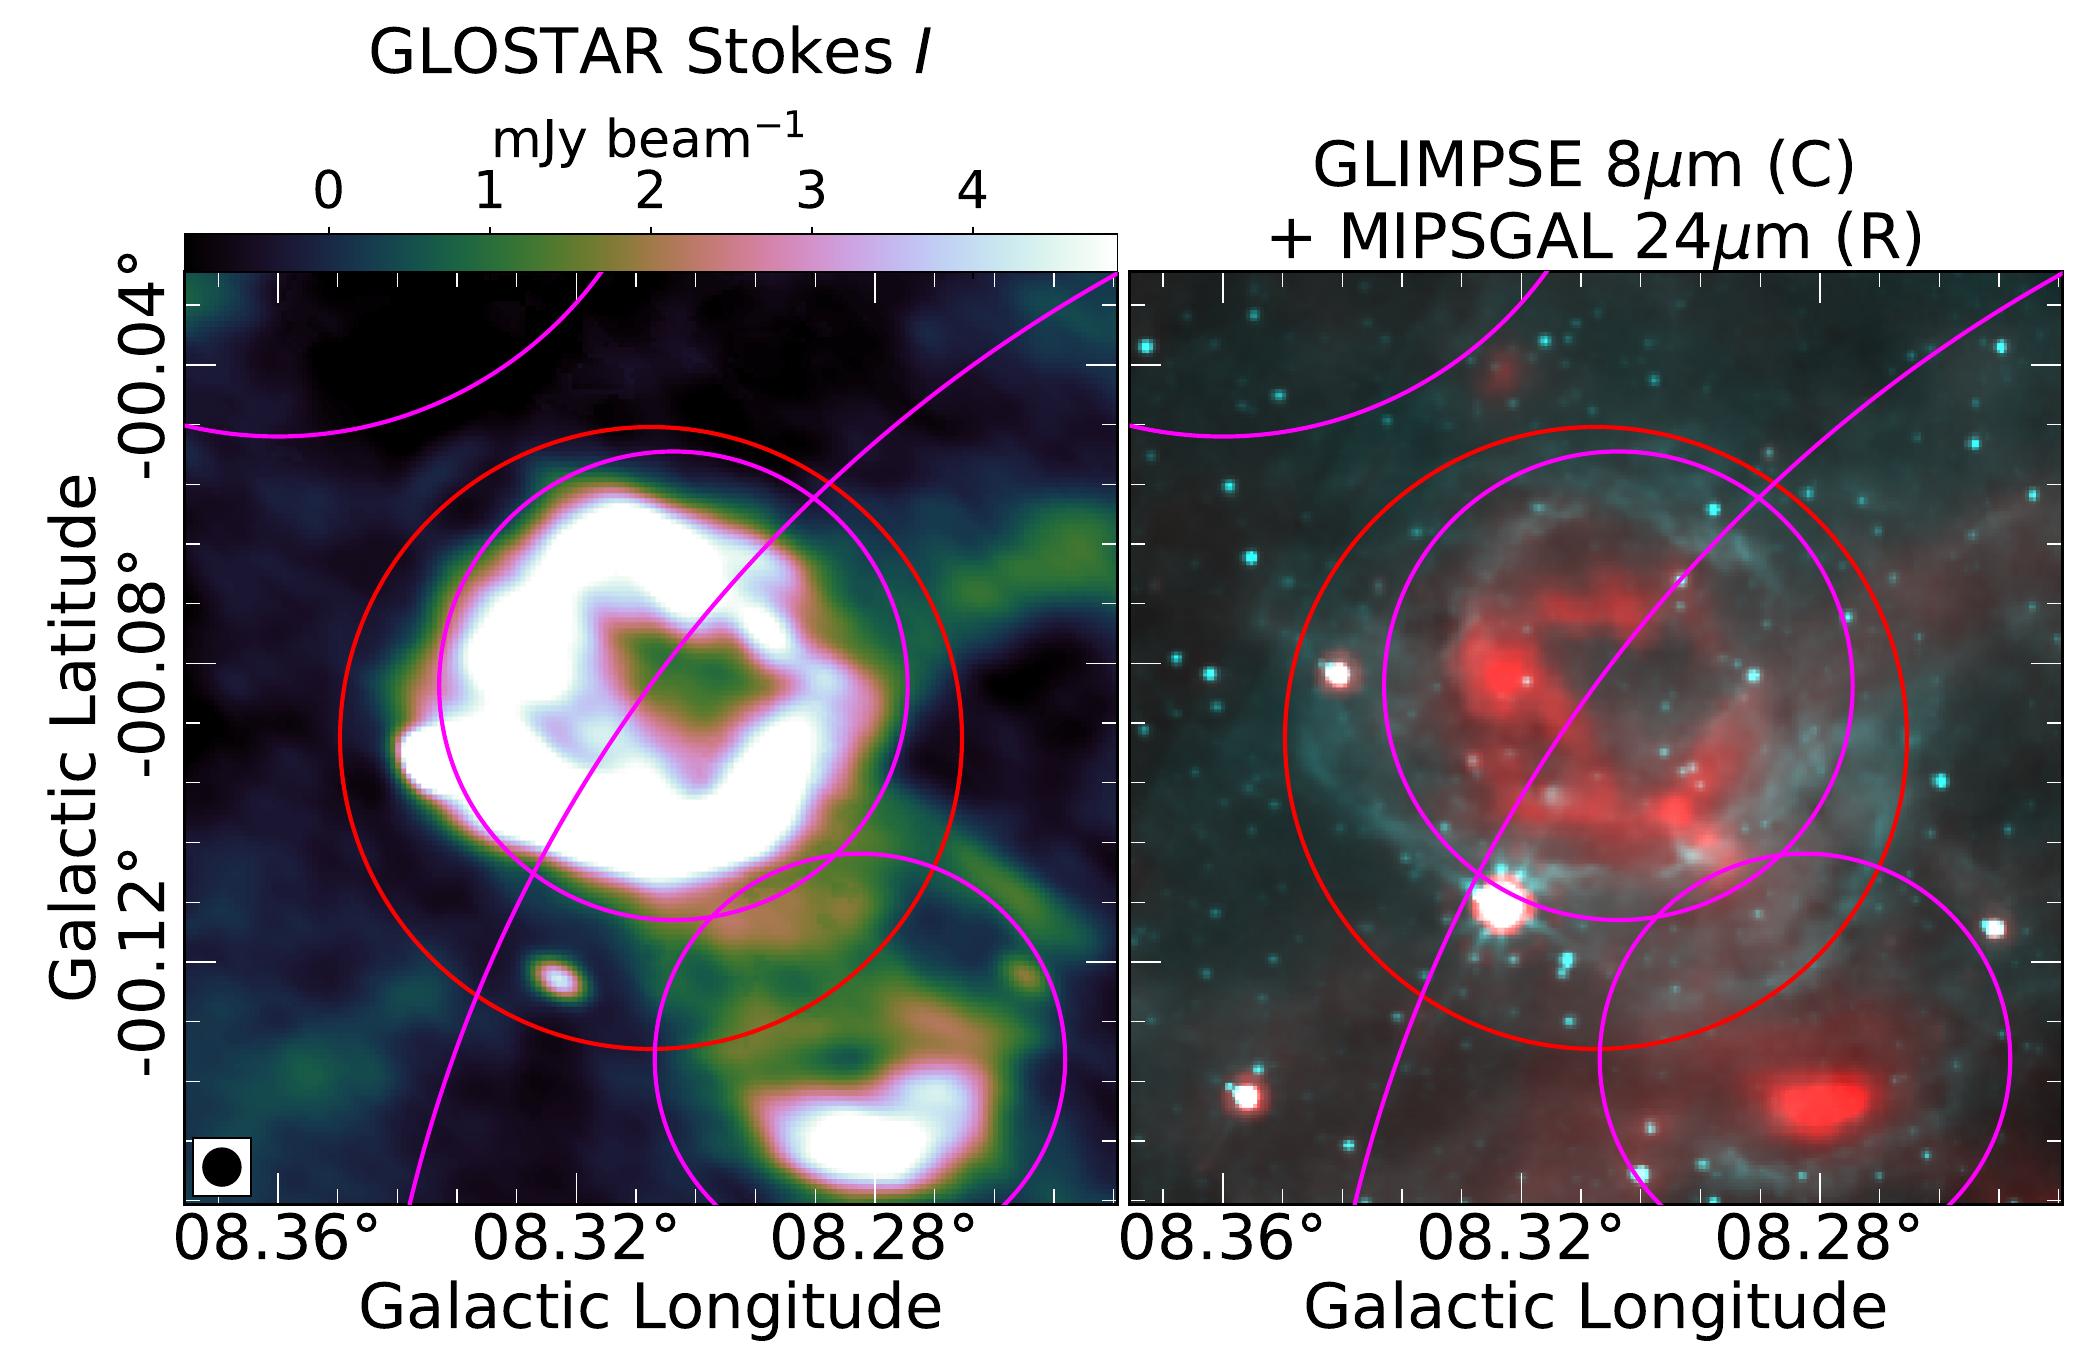
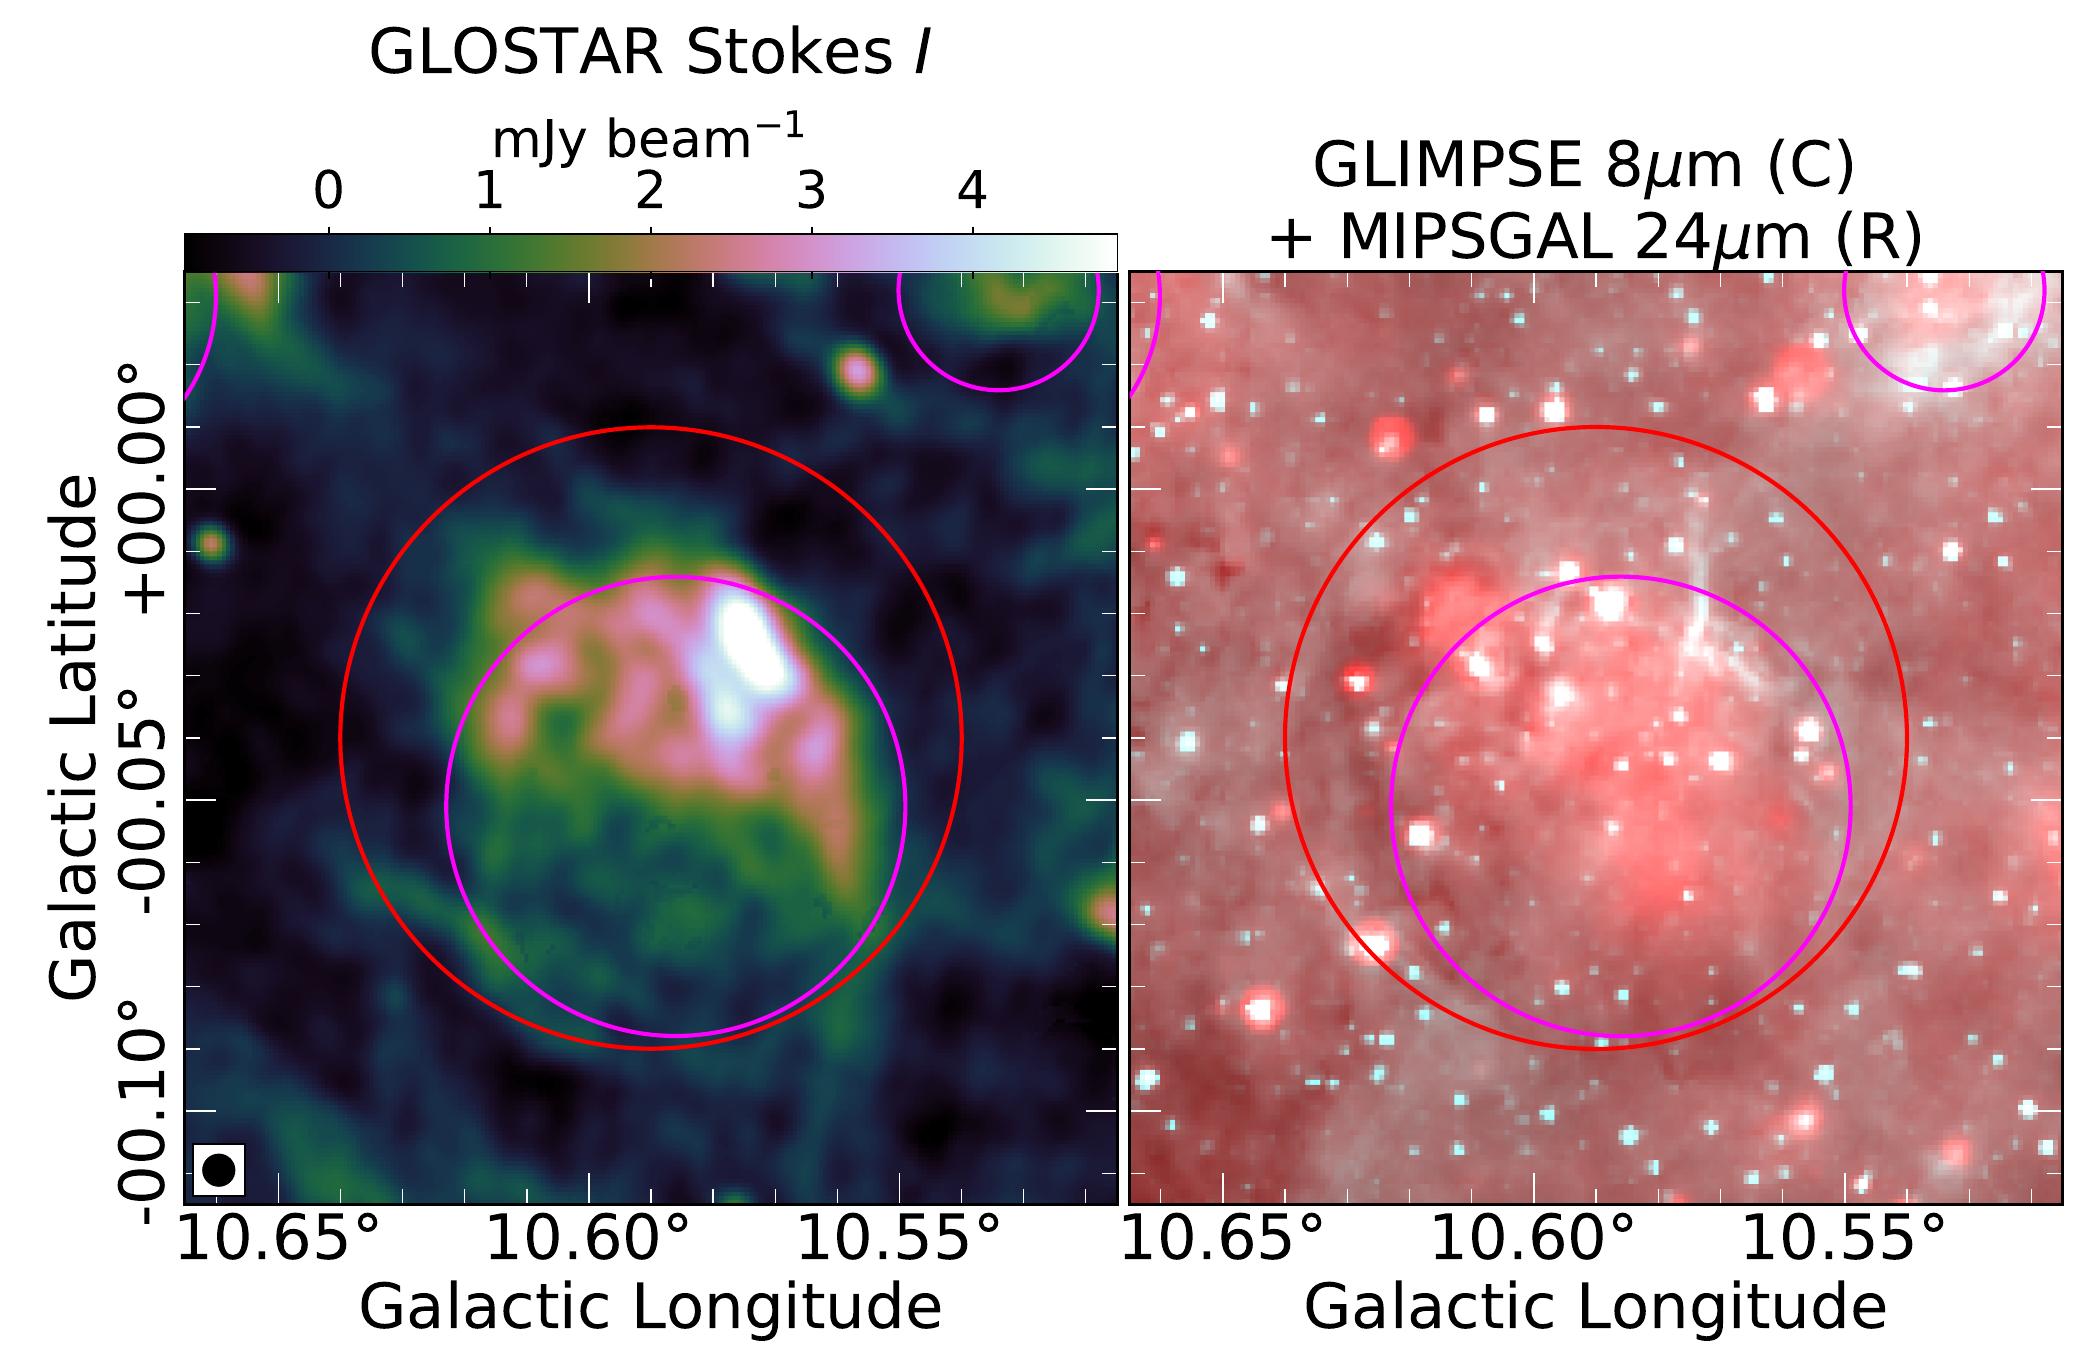
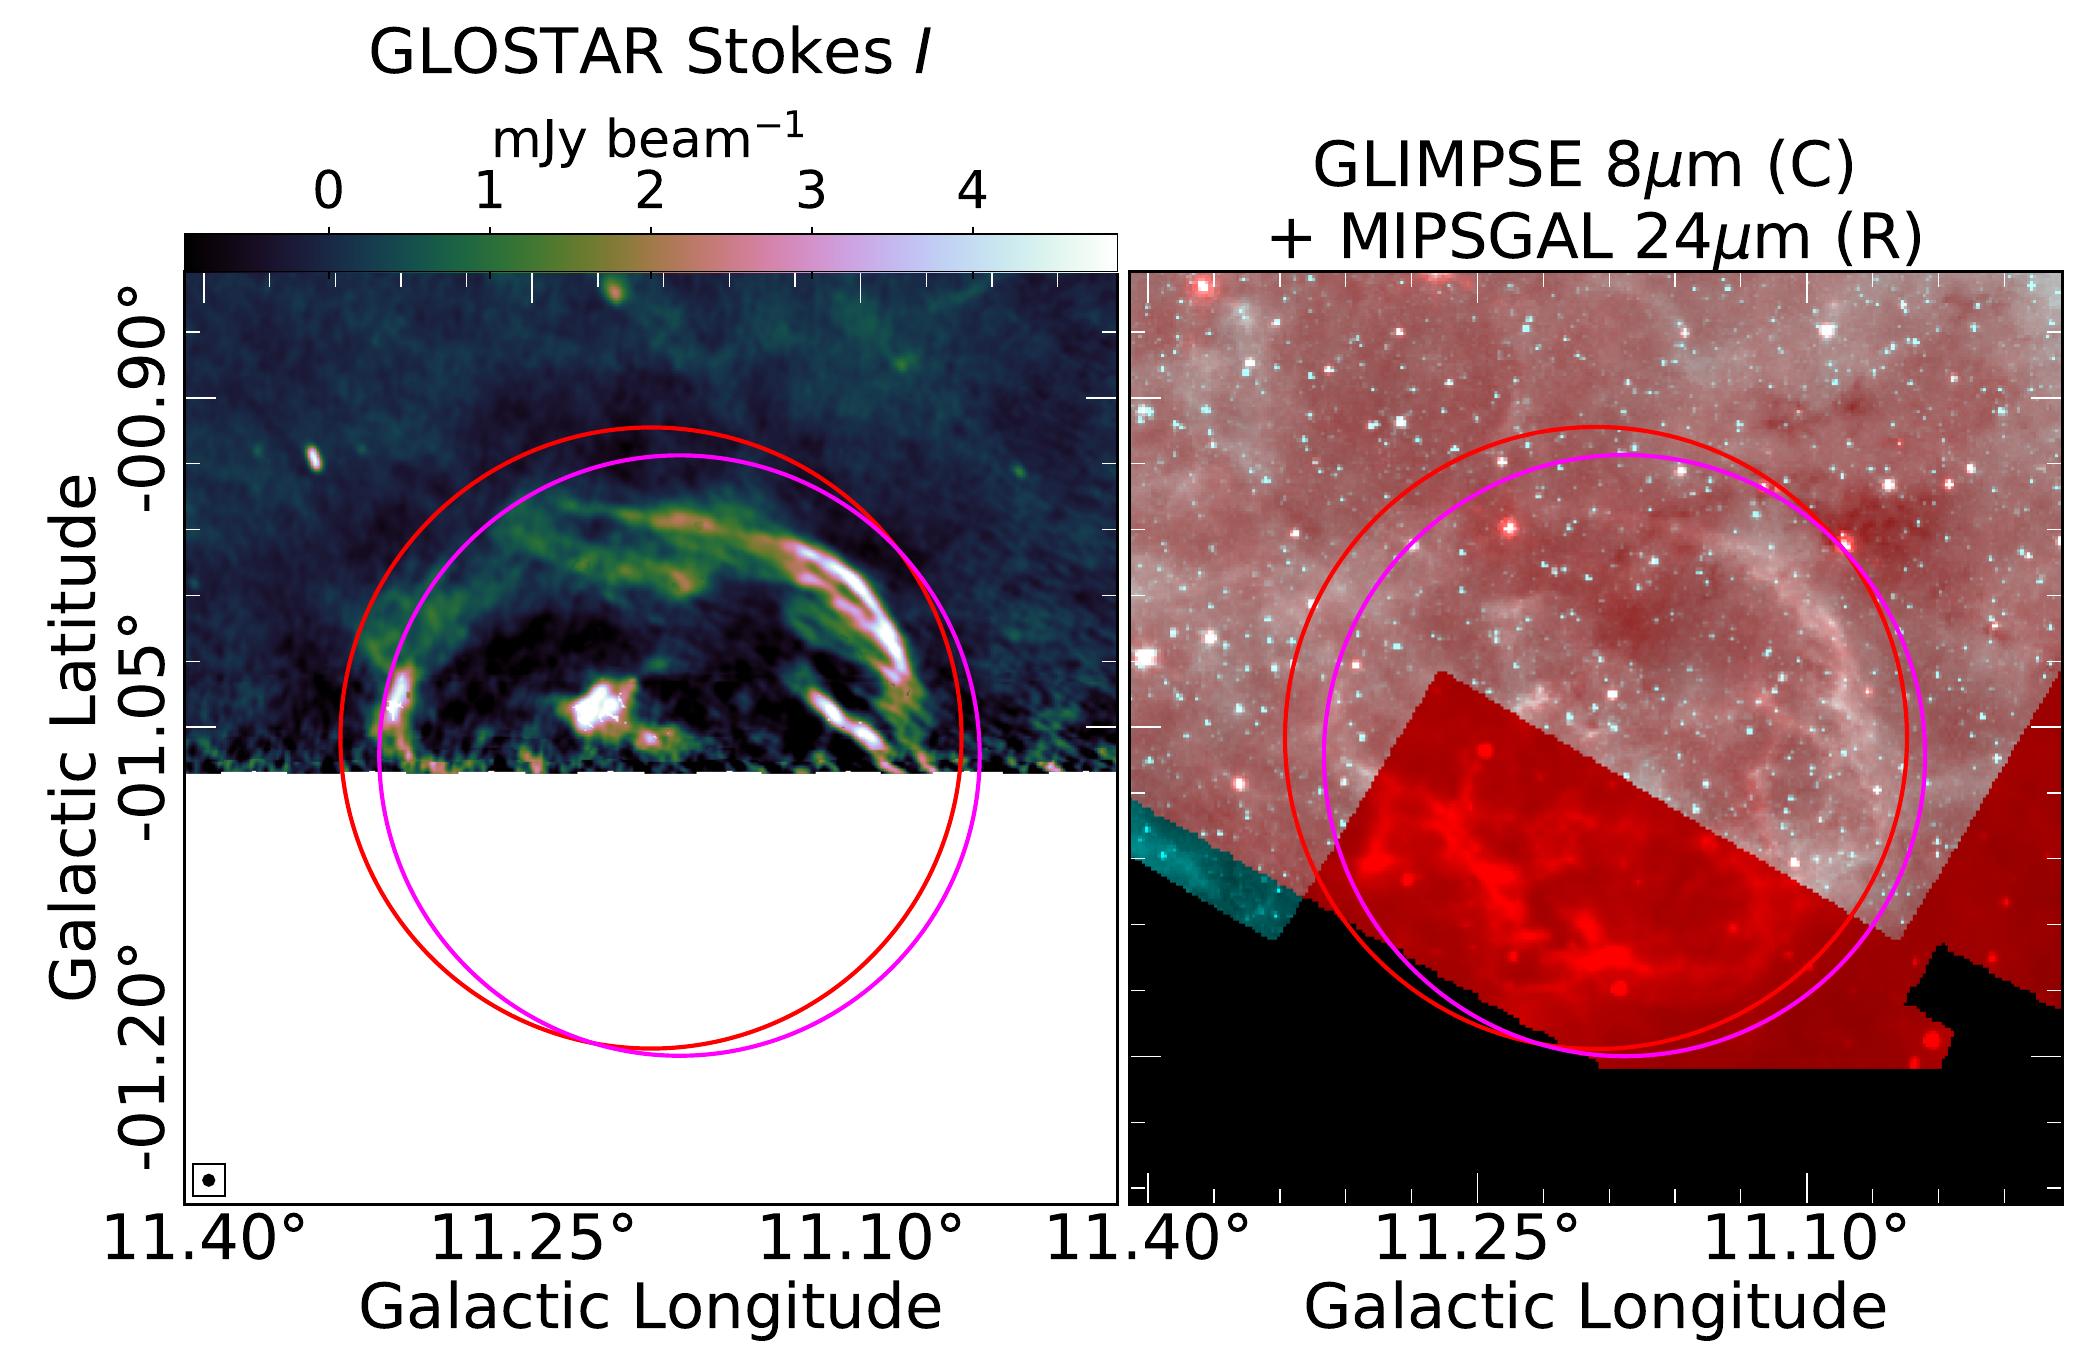
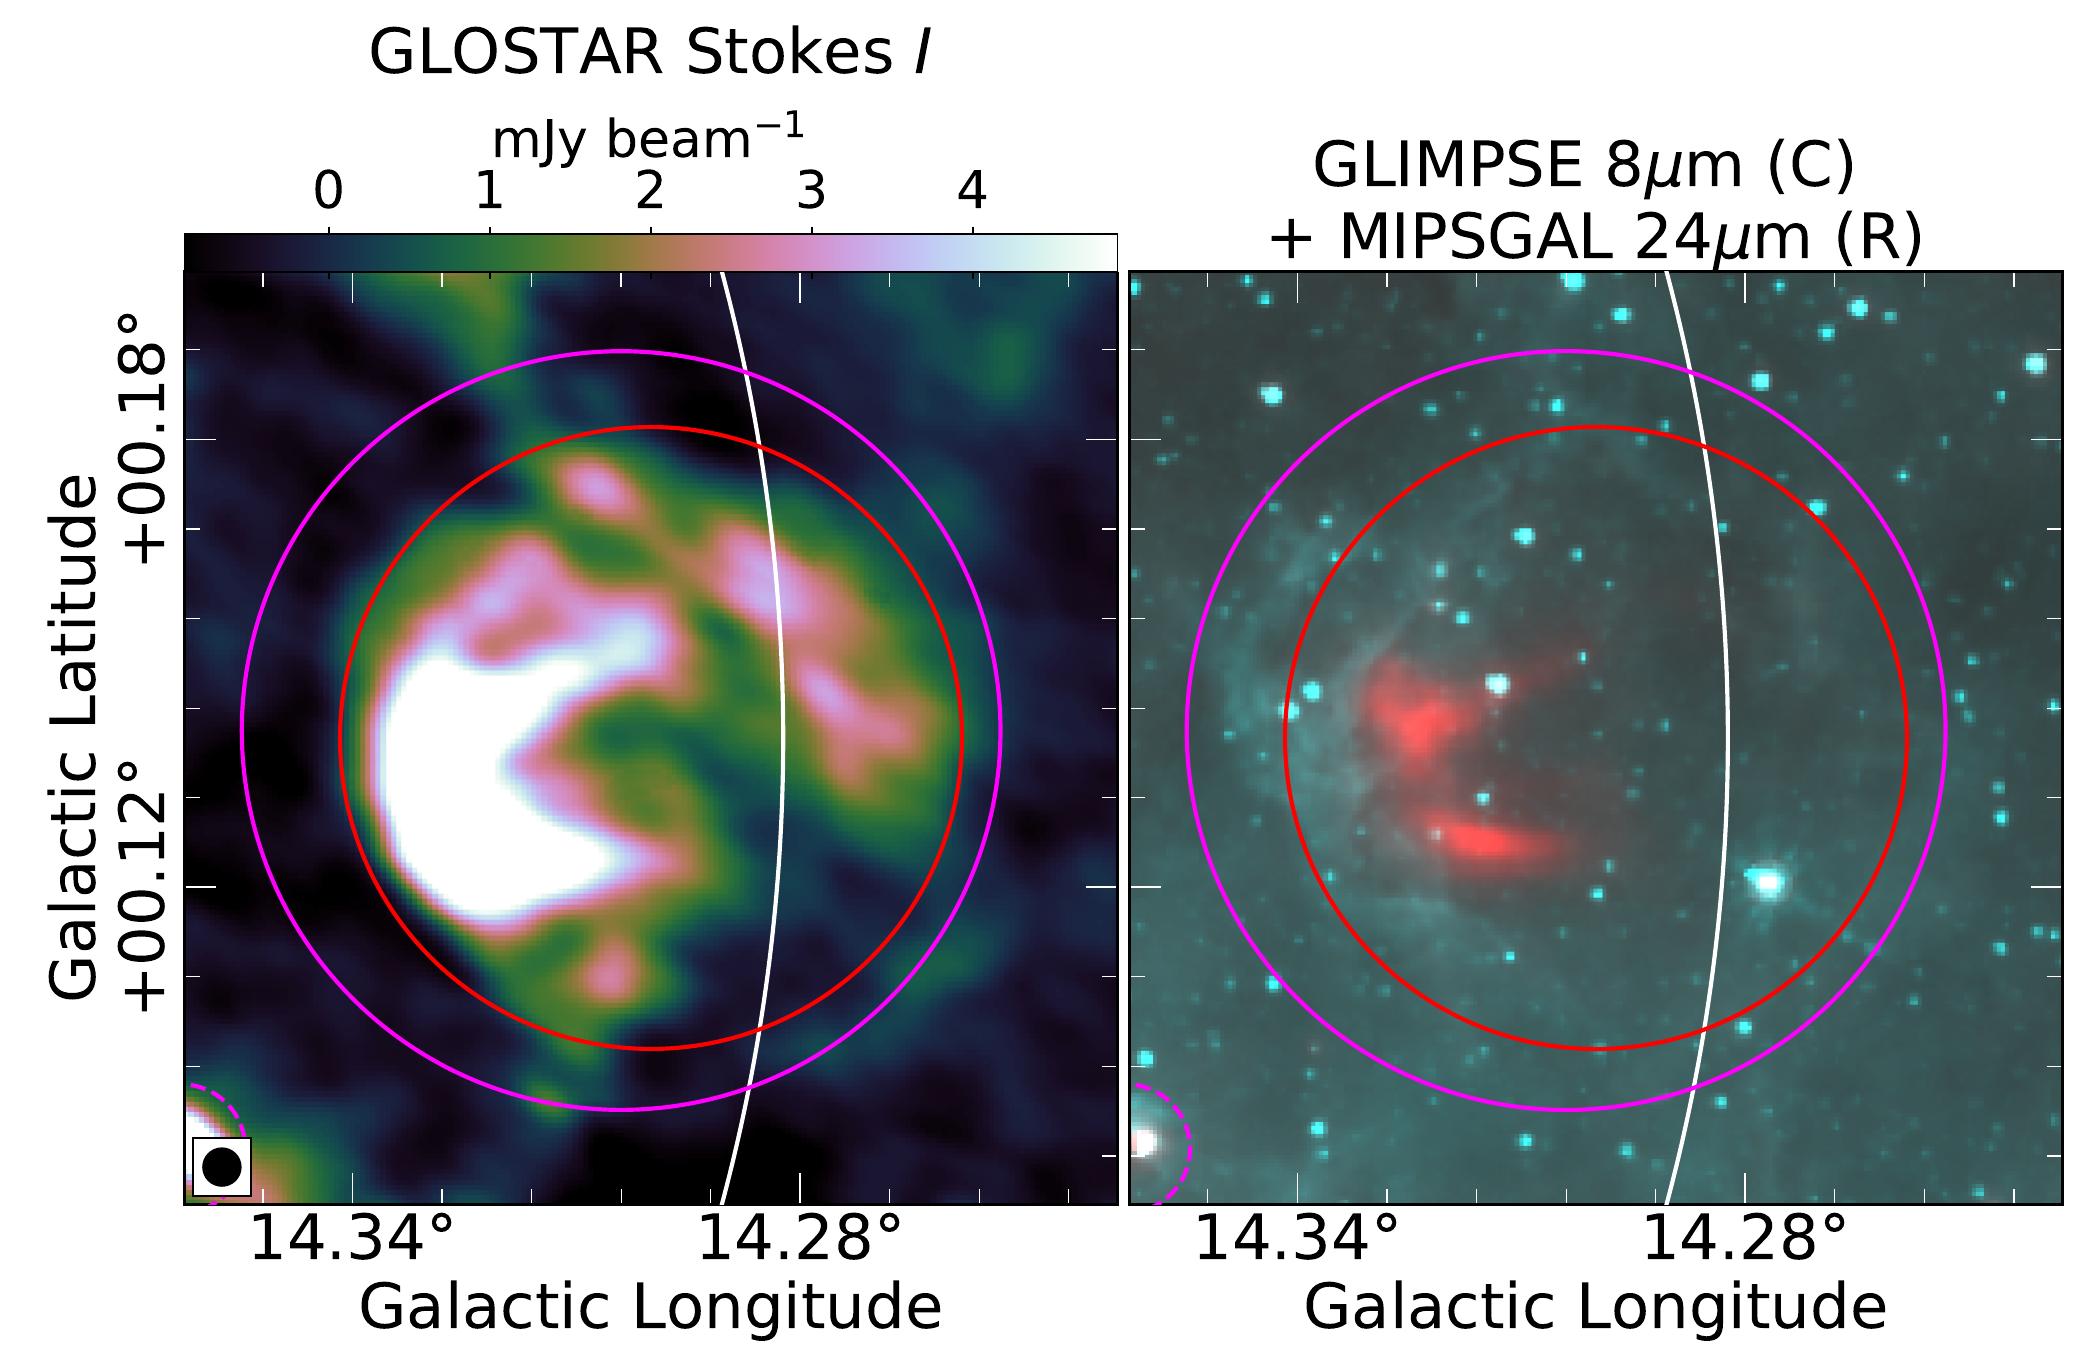
Four G19 SNRs, G8.30.0, G10.50.0, G11.11.0, and G14.30.1, have coincident MIR emission (Fig. 5) and are present in the A14 H ii region catalog. They were also noted as H ii regions in earlier studies (Lockman, 1989; Lockman et al., 1996; Gao et al., 2019). We detect no significant polarization from these objects, agreeing with their identifications as H ii regions.
4.2.3 G19 SNRs with ambiguous radio emission
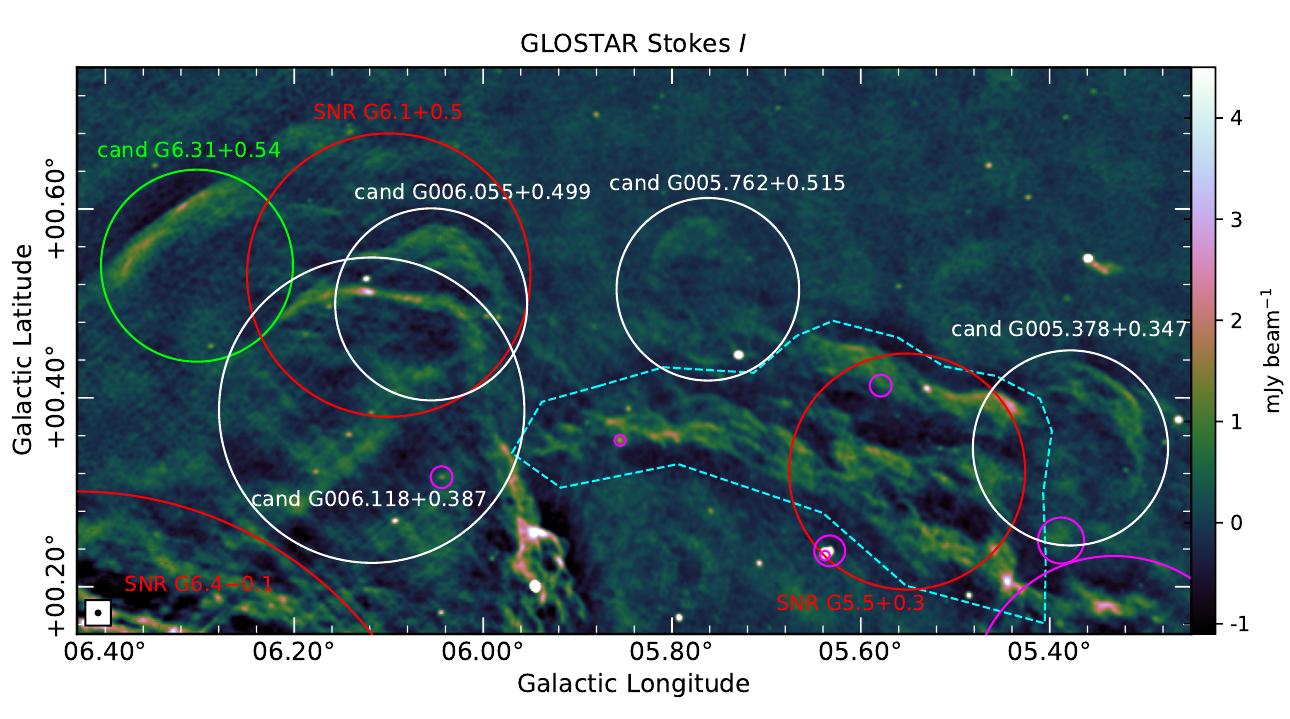
G5.50.3 was identified by Brogan et al. (2006) as a class II SNR candidate (class I being very likely to be a SNR, and class III being least likely). Liszt (2009) report strong CO emission from the periphery of this SNR at ; this is probably associated with the presence of A14 H ii regions G005.63300.238 and G005.63700.232. Stupar & Parker (2011) studied G5.5+0.3 at optical wavelengths, but could not confidently associate optical and radio emission. Green (2019) reports a spectral index of , a 1 GHz flux density of Jy, and a size . These values translate to an expected average surface brightness of over mJy beam-1 in the GLOSTAR-VLA data, which is well above the local noise ( mJy beam-1). Emission from this region is indeed detected in the GLOSTAR-VLA data (Fig. 6), but it is part of a much larger structure (marked with a dashed cyan polygon in Fig. 6) that is in angular extent. We also observe no significant polarization. Considering the fact that we recover only a small fraction of the flux density (see §2.1 and §4.2.1), it is likely that the nonthermal emission from the SNR is actually undetected.
G6.10.5: This appears to be a superposition of two objects in the GLOSTAR-VLA data (Fig. 6). One object centered at has a bright arc-shaped emission on its northern edge, whereas the rest of its shell is faint. This arc-shaped emission passes through another object, centered at which has a clear shell morphology. These newly resolved shells from G6.10.5 are included in the list of GLOSTAR SNR candidates (see Table LABEL:table:newcandSNRs).
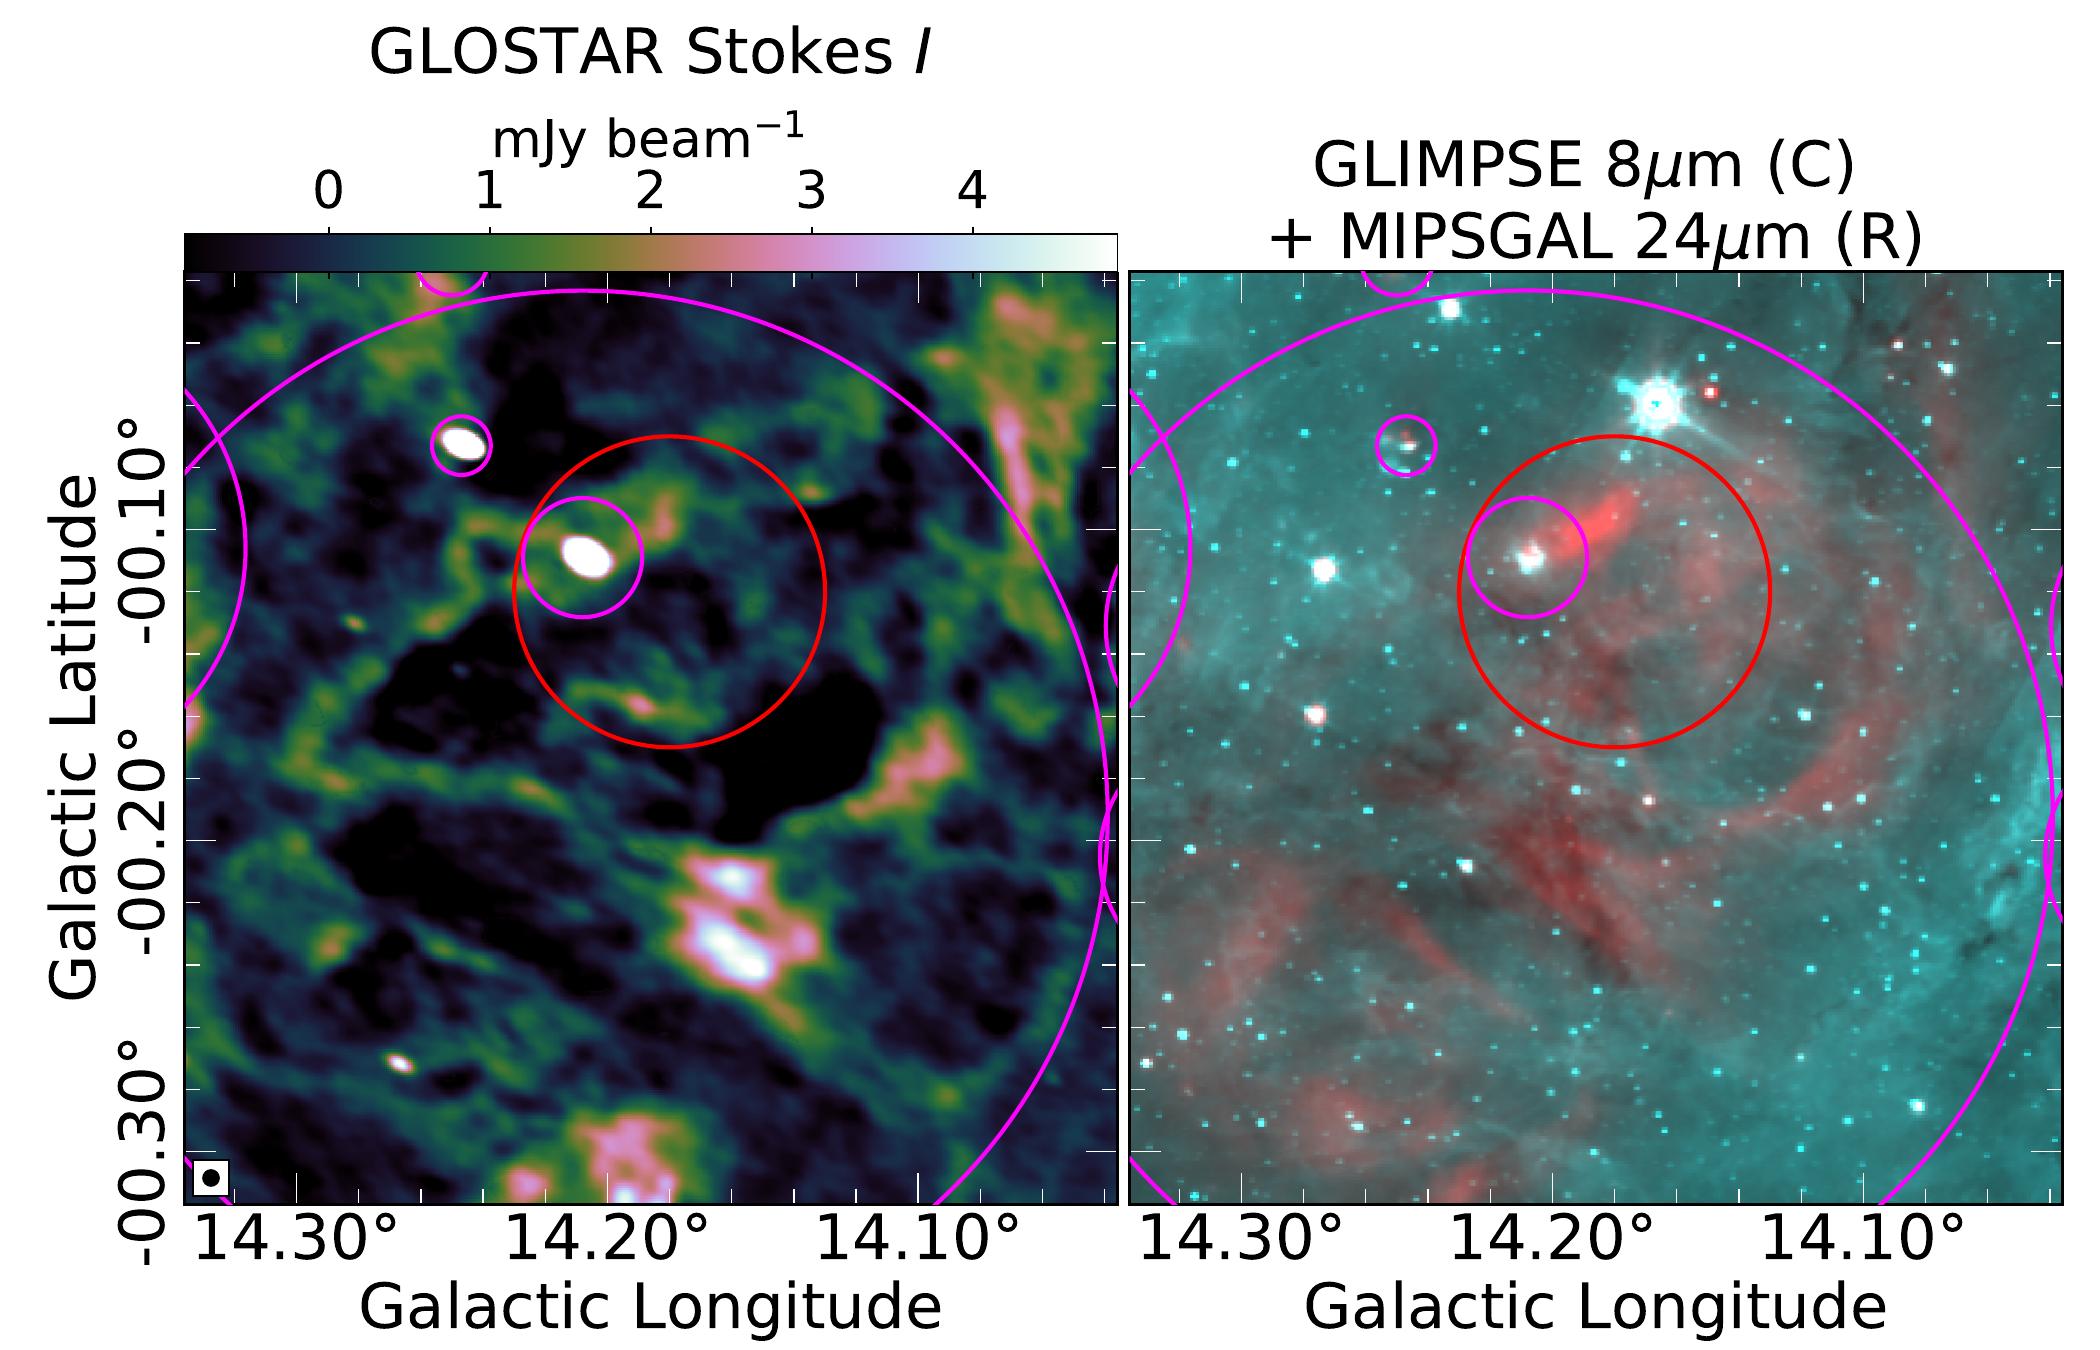
G14.10.1: The emission from this object as seen in the GLOSTAR-VLA data (Fig. 7) is dominated by the bright A14 H ii region G014.20700.110 in the northeast, and these objects lie inside the large A14 H ii region G014.20700.193. Given the flux density of 0.5 Jy, spectral index of and a size of reported by Green (2019), the nonthermal emission from G14.10.1 should have an average surface brightness of mJy beam-1 in the GLOSTAR-VLA data. However, we cannot positively identify an object distinct from the surrounding emission. In addition, the northern part of G14.10.1 is detected in MIPSGAL. These facts indicate that the emission we observe in the GLOSTAR-VLA data may just be from the large H ii region G014.20700.193, and not the SNR G14.10.1. Similar to G5.50.3, the nonthermal emission from this SNR is also probably undetected.
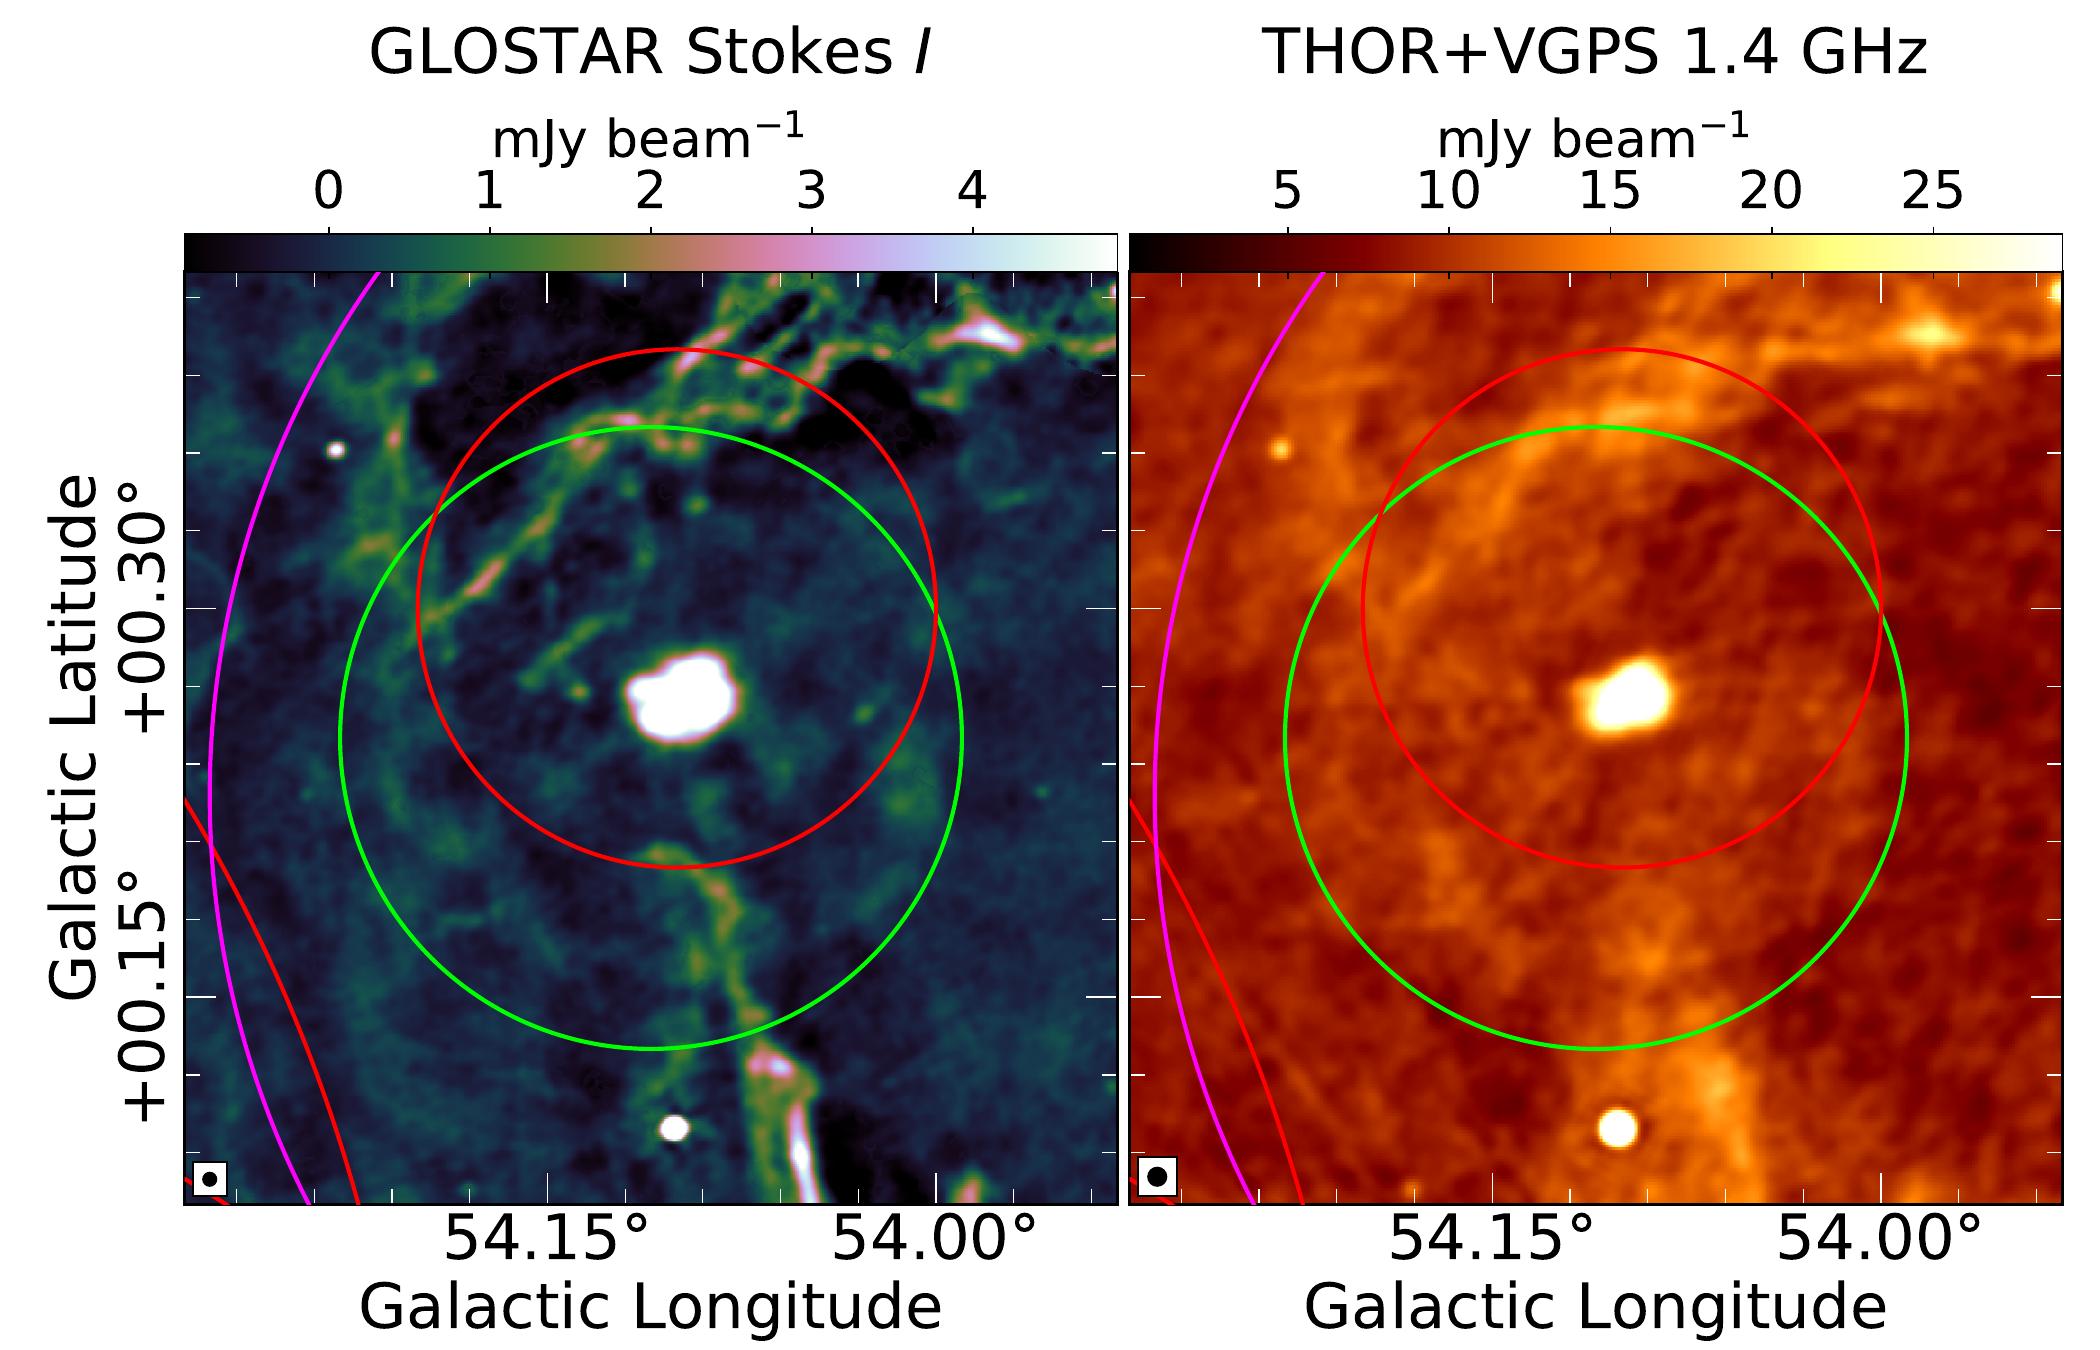
G54.10.3: The pulsar wind nebula (PWN) G54.10.3 is identified as a bright source in the GLOSTAR-VLA data, with a faint shell surrounding this emission (Fig. 8). Lang et al. (2010) and Anderson et al. (2017) also identify a shell with similar morphology, but it is not yet known if it is associated with the PWN. Anderson et al. (2017) included this shell in the list of THOR SNR candidates, named G54.110.25. Distance measurements to the PWN have yielded inconsistent results (Ranasinghe & Leahy, 2018; Kim et al., 2013; Lee et al., 2012), and a multiwavelength study by Driessen et al. (2018) suggests that the shell is unlikely to be a SNR, indicating that further observational studies are required to fully disentangle the emission from this region.
4.3 SNR candidates
We identify 80 new candidate SNRs using the methodology described in §3.1. We visually identify counterparts of 50 of these objects in either of the 20 cm (1400 MHz) THOR+VGPS, the 20/90 cm (1400/325 MHz) MAGPIS, or the 150 cm (200 MHz) GLEAM data. As SNRs are brighter at lower frequencies, the detection of the SNR candidates in these lower frequency surveys data can be used as an assessment of our confidence level in these candidates. The positions of these objects, their sizes, and their flux densities are listed in Table LABEL:table:newcandSNRs. The images of all these candidates are presented in Appendix A.
In addition, we also identify 77 SNR candidates in the GLOSTAR-VLA data that were discovered in earlier studies (see §2.3.3). The details of these candidates, along with references to the studies that identified them, are presented in Table LABEL:tab:prevcandSNRs; if they are found to have MIR emission in the MIPSGAL 24 m and GLIMPSE 8 m images, they are marked as thermal in the remarks column.
4.3.1 Comparing the properties of SNR candidates with G19 SNRs and H II regions
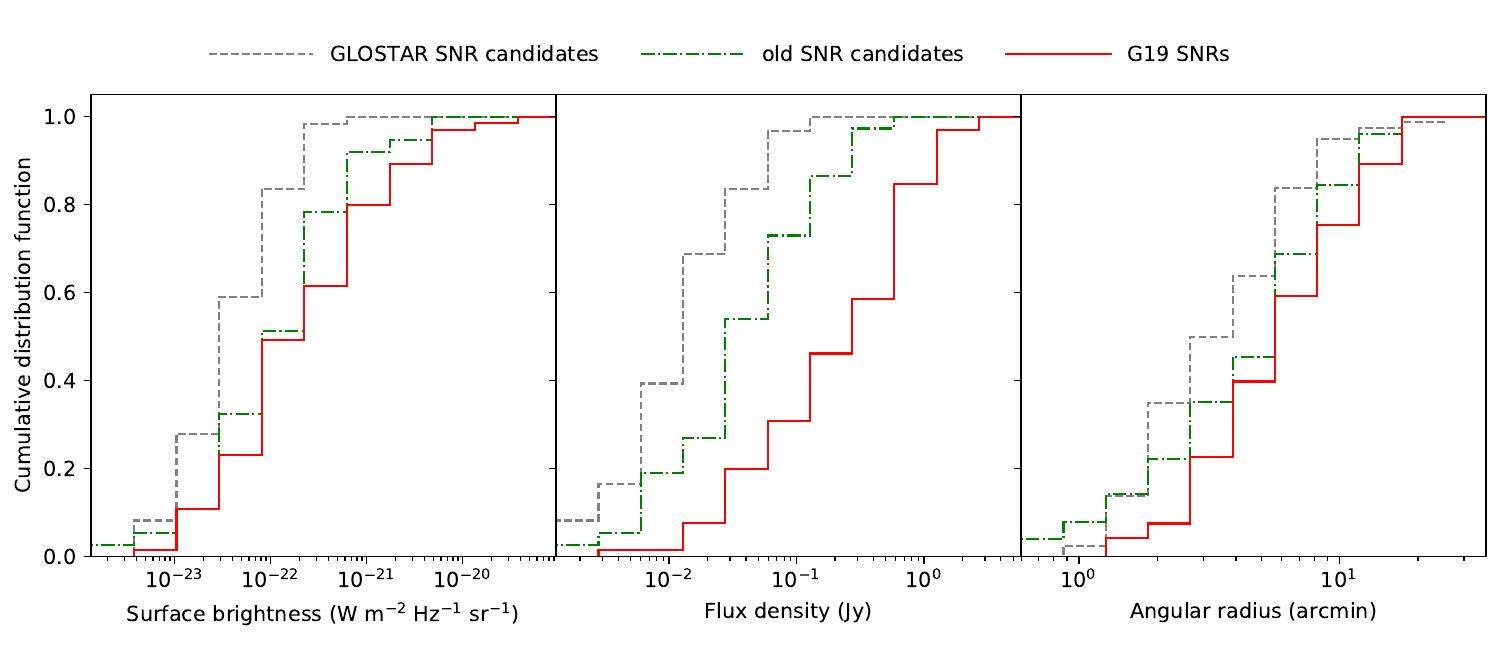
In Fig. 9, we present the cumulative distribution functions (CDFs) of 5.8 GHz surface brightness (defined as the ratio of flux density to the area subtended), GLOSTAR-VLA flux density, and radius of the three samples of G19 SNRs, the previously identified SNR candidates detected in the GLOSTAR-VLA data, and the newly discovered GLOSTAR-VLA SNR candidates. The CDFs show that the new SNR candidates discovered in the GLOSTAR-VLA data are in general smaller and fainter than the other two samples; this is expected because of the survey’s better surface brightness sensitivity and better resolution than many previous large-scale studies. The sample of G19 SNRs consists of objects that were easily detected and well studied, and hence they are brighter and larger than the other two samples. We note that the observed differences across the three samples in the 5.8 GHz surface brightness and flux density are not artefacts of the problem of flux density resolved out by the interferometer. All the measurements presented in Fig. 9 are from the GLOSTAR-VLA data, and the “missing flux density” problem affects all the measurements. As G19 SNRs are in general larger than the two samples of SNR candidates, more flux density is resolved out from G19 SNRs than the other two. Future addition of single-dish data (currently being collected with the Effelsberg 100 m telescope) is only expected to widen the differences in flux density and surface brightness of these samples.
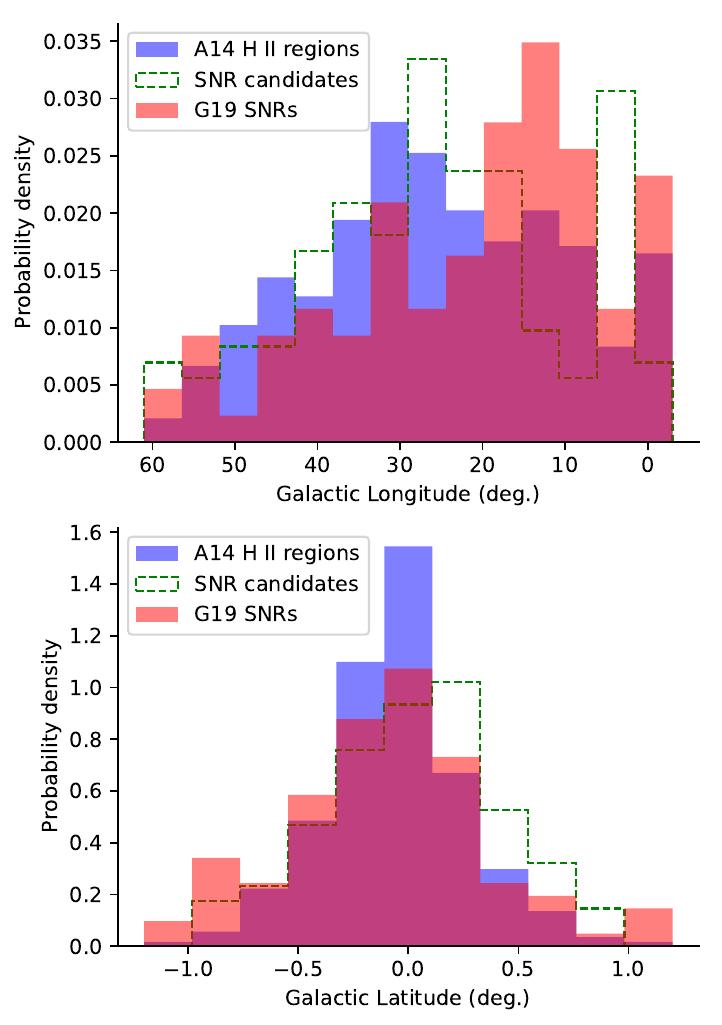
The histograms of Galactic longitudes and latitudes of A14 H ii regions, G19 SNRs, and SNR candidates (both newly discovered and previously identified ones together) detected in the GLOSTAR-VLA survey are shown in Fig. 10. H ii regions and SNRs trace recent massive star formation activity, and are generally expected to have similar distributions, although local discrepancies are common. Anderson et al. (2017) note that there could be physical reasons for the apparent differences, such as the progenitors of supernovae being both O- and B-stars, and H ii regions generally tracing only O-stars. The survey by Brogan et al. (2006), which covered the longitude range , nearly doubled the number of confirmed SNRs in their survey region. The number of SNR candidates in this region is also relatively small, and so the observed differences in Galactic longitude among the three samples (top panel, Fig. 10) seem to be a result of previous surveys focusing on selected regions. We also observe a difference in the Galactic latitudes of SNR candidates compared with the other two samples. Both G19 SNRs and A14 H ii regions peak at and populate the latitudes slightly more than , but the distribution of SNR candidates is quite asymmetric and skewed toward with its peak at . Anderson et al. (2017) also report a similar shift toward positive latitudes for the THOR SNR candidates, although less apparent. The reason for this unexpected shift seems unclear. The current sample of G19 SNRs and SNR candidates may still not be representative of the overall Galactic SNR population.
4.3.2 The number of SNRs in the Galaxy
Helfand et al. (1989) estimated that the Galaxy should contain SNRs by studying the distribution of approximately SNRs known at that time. They arrived at this number by assuming that the surface density of Galactic SNRs in the longitude range provides a stringent lower limit to the actual surface density of SNRs across the Milky Way, and they used a linear gradient of SNR number density. These latter authors also provide the total expected number of SNRs in different regions of the Galaxy which they named from A–M. Li et al. (1991) further analyzed the distribution of SNRs in a similar statistical manner, but they assumed a “selection-free” zone of 3 kpc around the Sun and used exponential disk and spiral arm scales to model the SNR number surface density. These authors estimate that there must be SNRs and also predict the number of SNRs in various regions of the Milky Way defined by Helfand et al. (1989). The estimates given by Li et al. (1991) outnumber the estimates of Helfand et al. (1989) in most regions (see Table 4 of Li et al., 1991). The total number of SNRs given by Li et al. (1991), about , is in agreement with other studies (Tammann et al., 1994; Mertsch & Sarkar, 2013). A simple calculation involving the lifetimes of SNRs ( years; Frail et al., 1994) and a supernova rate of two per century (Cappellaro et al., 1993; Adams et al., 2013) also gives a number upwards of 1000 SNRs. With this context, below we discuss the distributions of SNRs observed in the GLOSTAR-VLA data.
| Li et al. (1991) | |||
|---|---|---|---|
| Helfand et al. (1989) | |||
| SNRs in GLOSTAR |
The expected number of SNRs in the longitude range is obtained by assuming that SNRs in account for of the SNRs in the range (regions F+G+H+I as defined by Helfand et al. 1989; see their figure 8). Similarly for ( of SNRs in , i.e., regions B+C).
In Table 1, we compare the results of our search with the expected numbers of SNRs given by Helfand et al. (1989) and Li et al. (1991), assuming that all the SNR candidates are positive identifications. Our results are a surprisingly good match with the predictions by Helfand et al. (1989), but fall well short of the numbers given by Li et al. (1991). We believe that the agreement between our results and the predictions of Helfand et al. (1989) is a coincidence. Our survey is unlikely to be sensitive enough to detect all the SNRs in the survey region. A simple way to test this would be to conduct deeper searches for SNRs in the longitude range . Comparing our results with the numbers estimated by Li et al. (1991), we find that over 150 SNRs remain to be detected in this region (see Table 1). Therefore, if deeper surveys reveal more SNRs, then the good agreement with the expected number given by Helfand et al. (1989) is purely a coincidence. However, if no new SNR candidates were to be discovered in future deeper surveys—which we believe is unlikely—then we may need to rethink the distributions of SNRs and also possibly the total number of SNRs in the Milky Way.
4.4 New SNR candidates with polarized emission
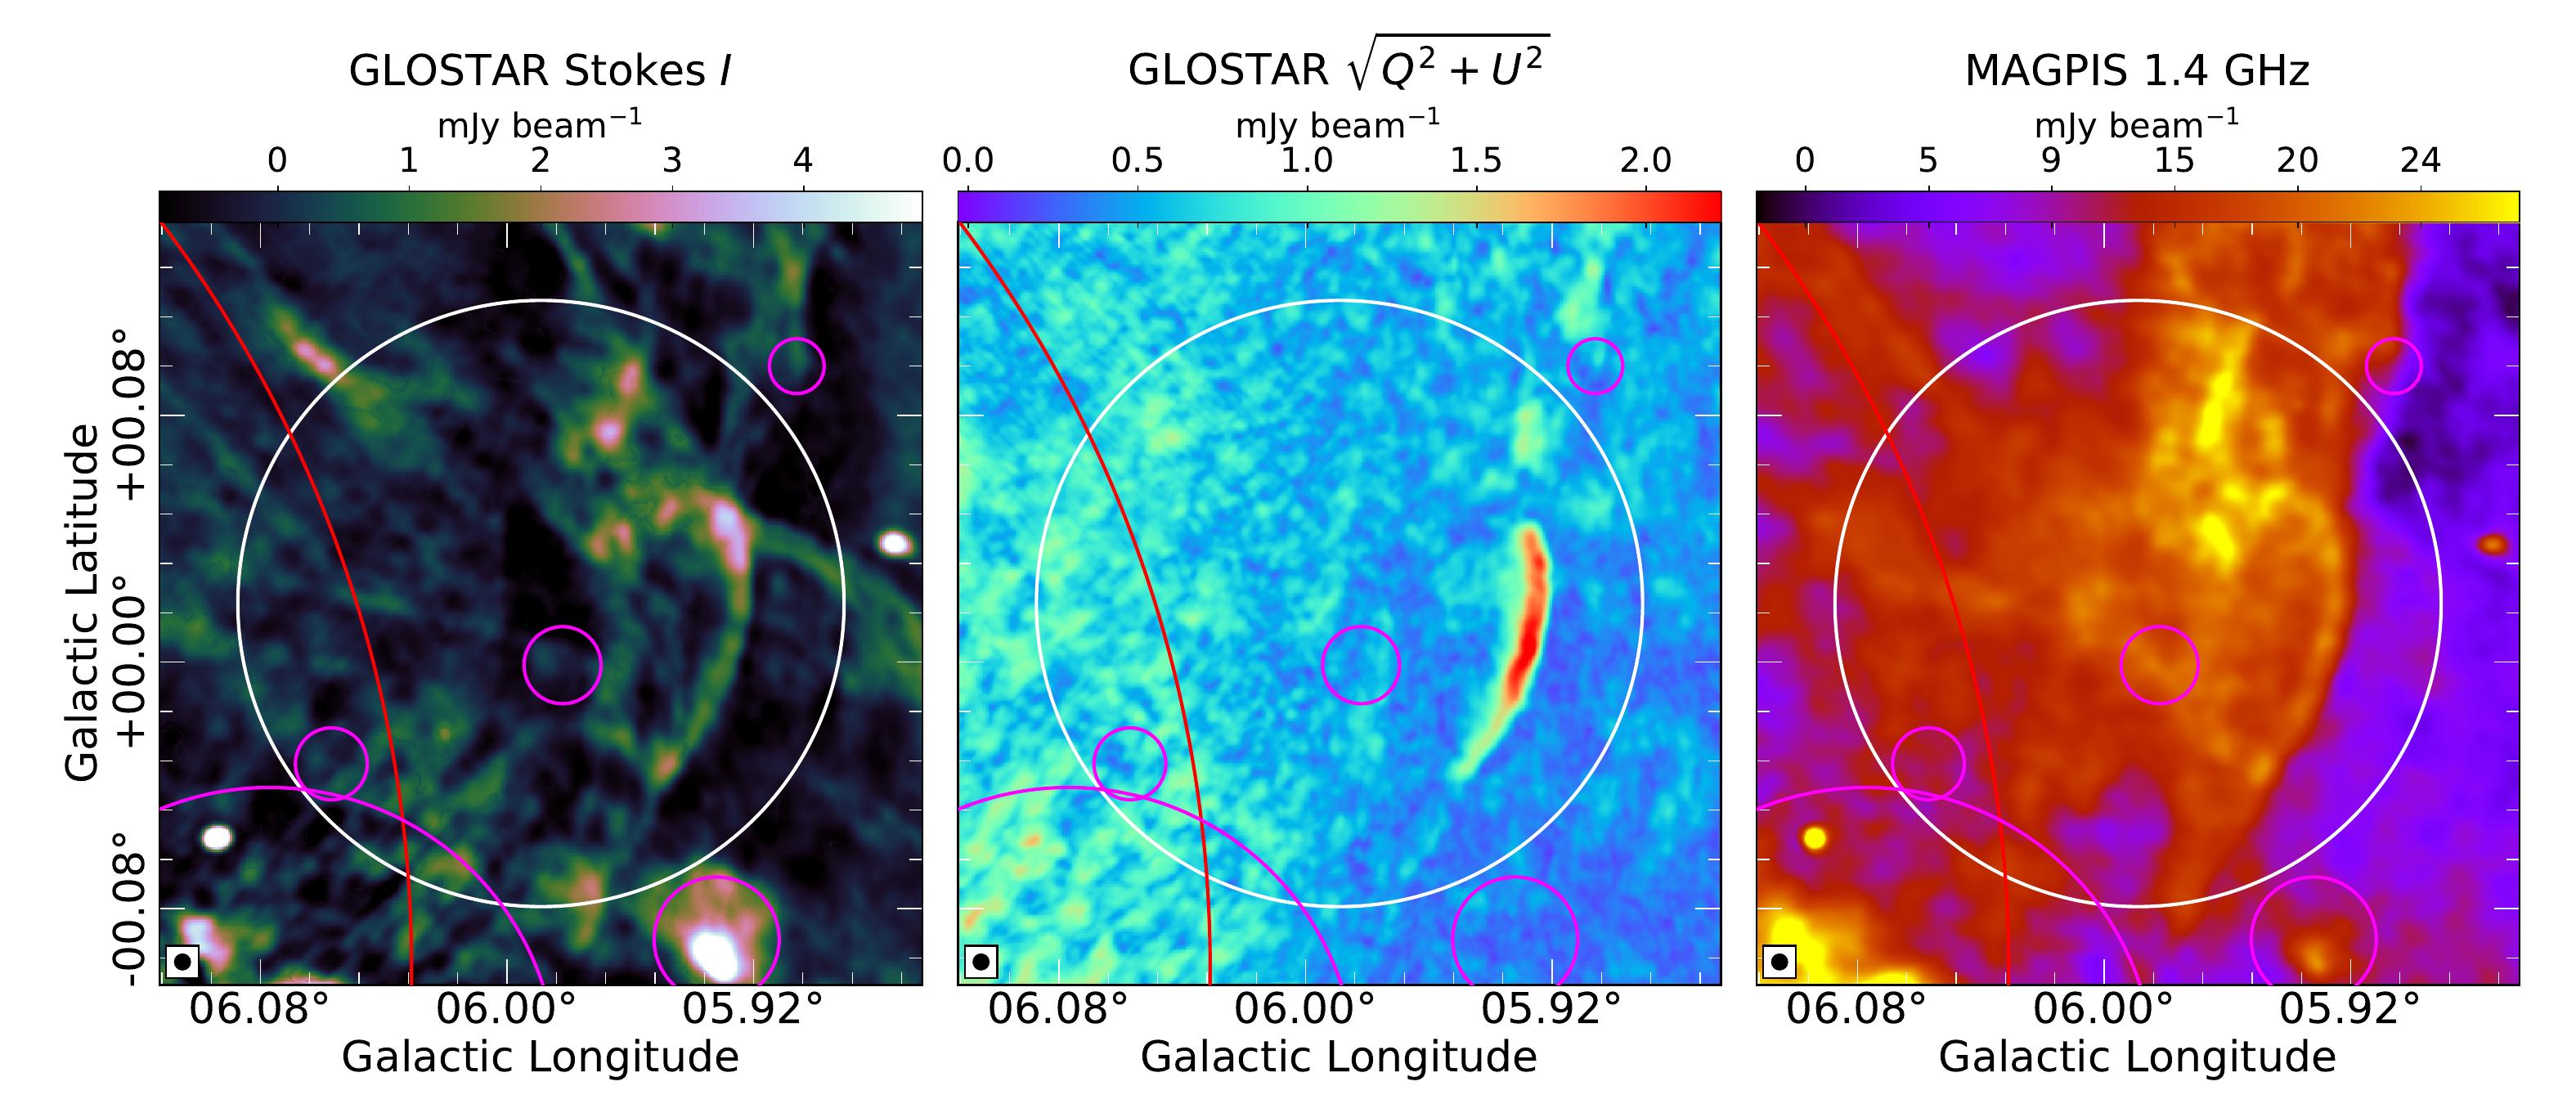
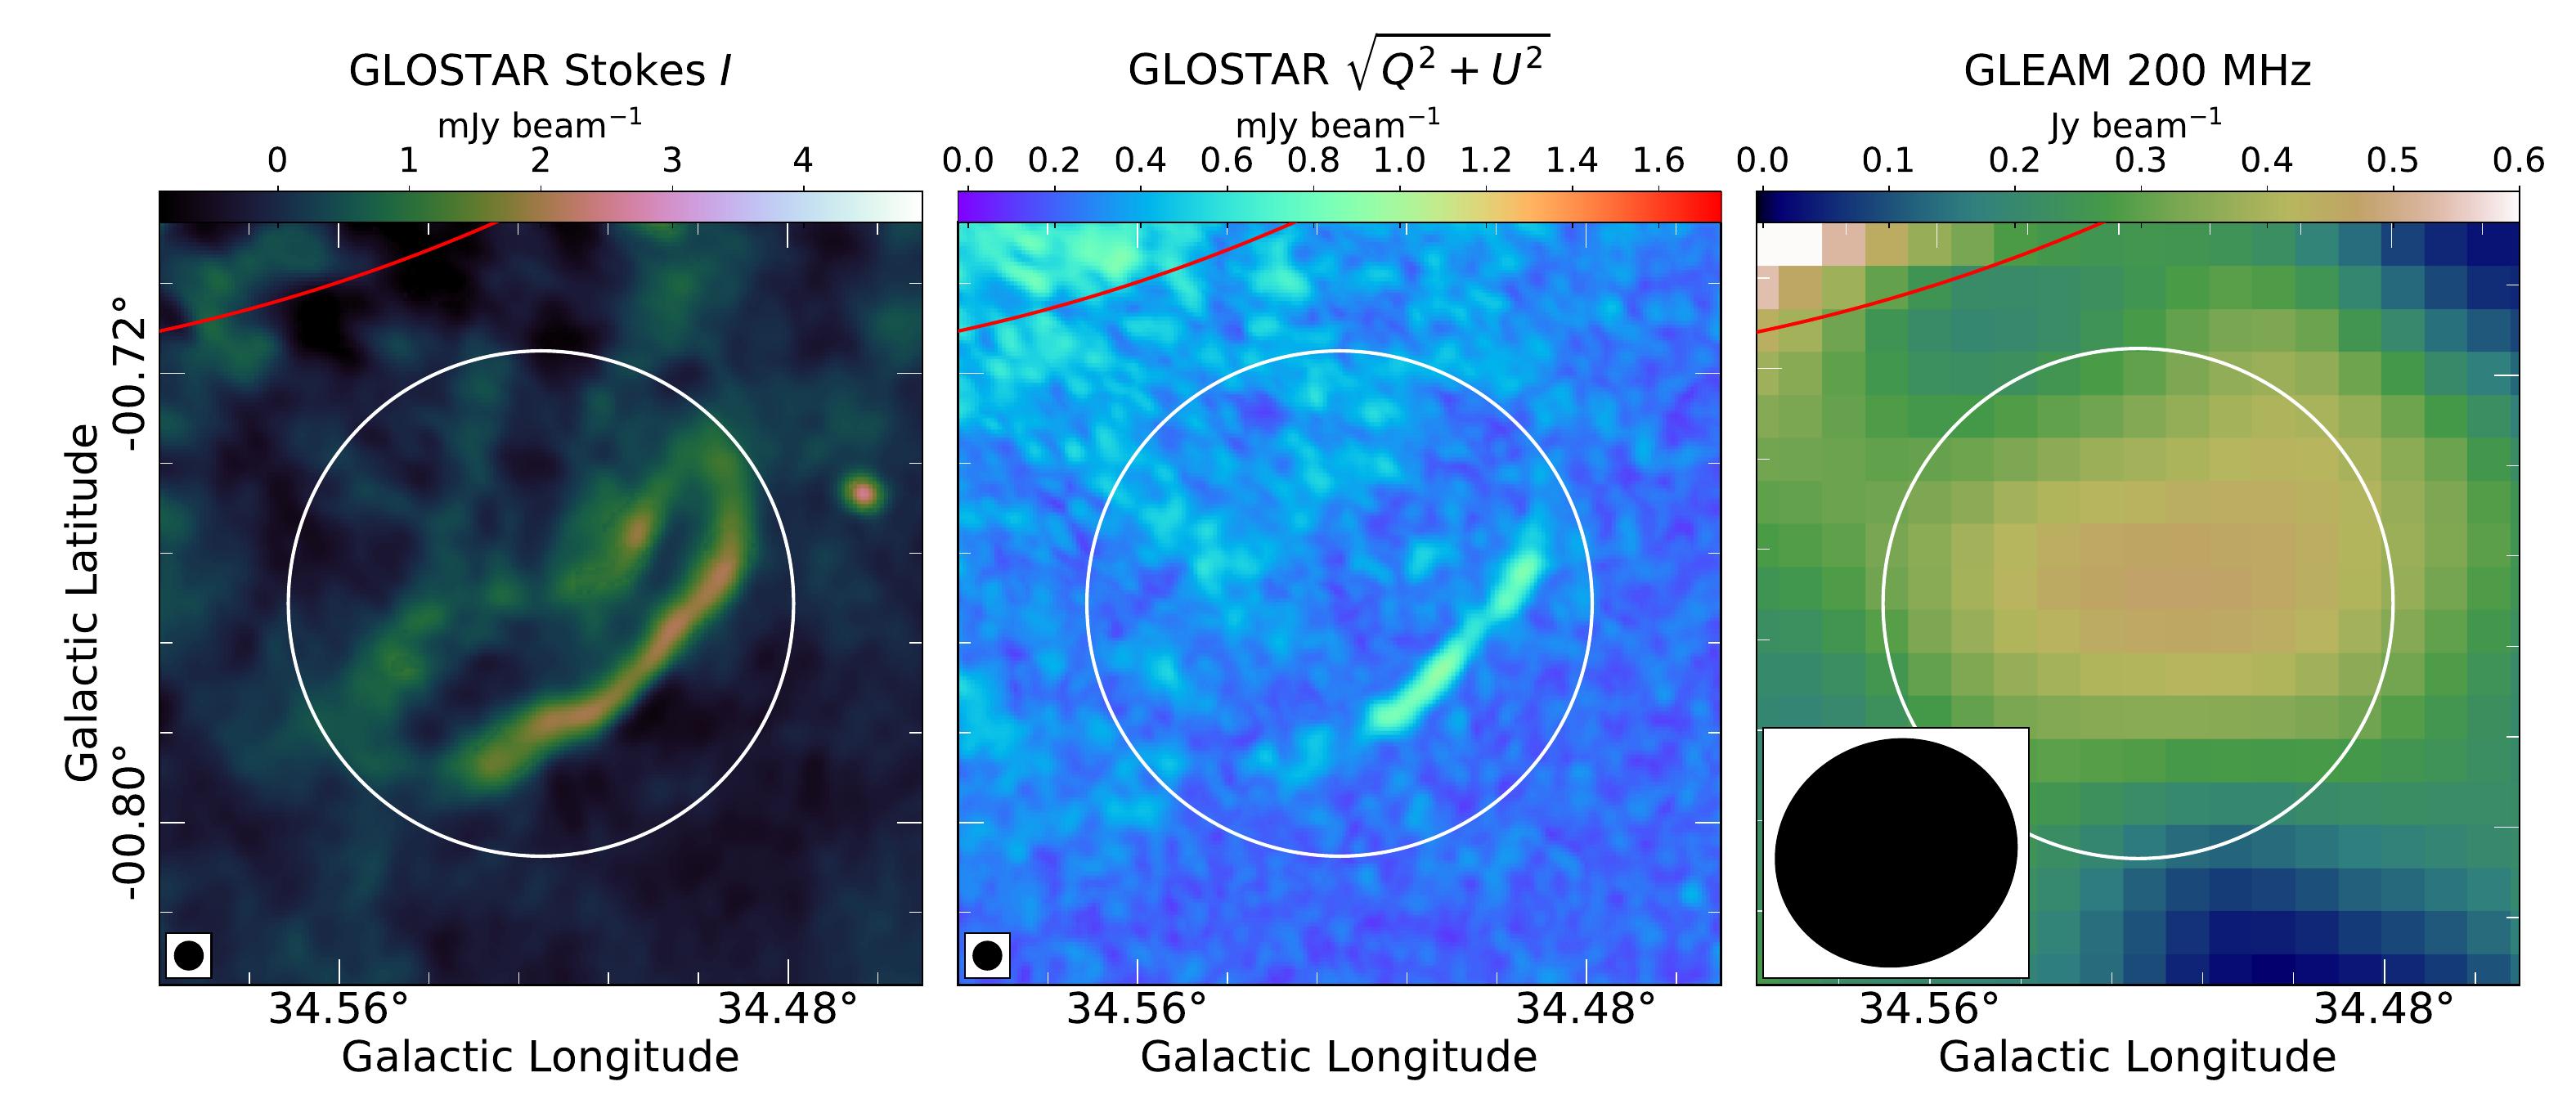
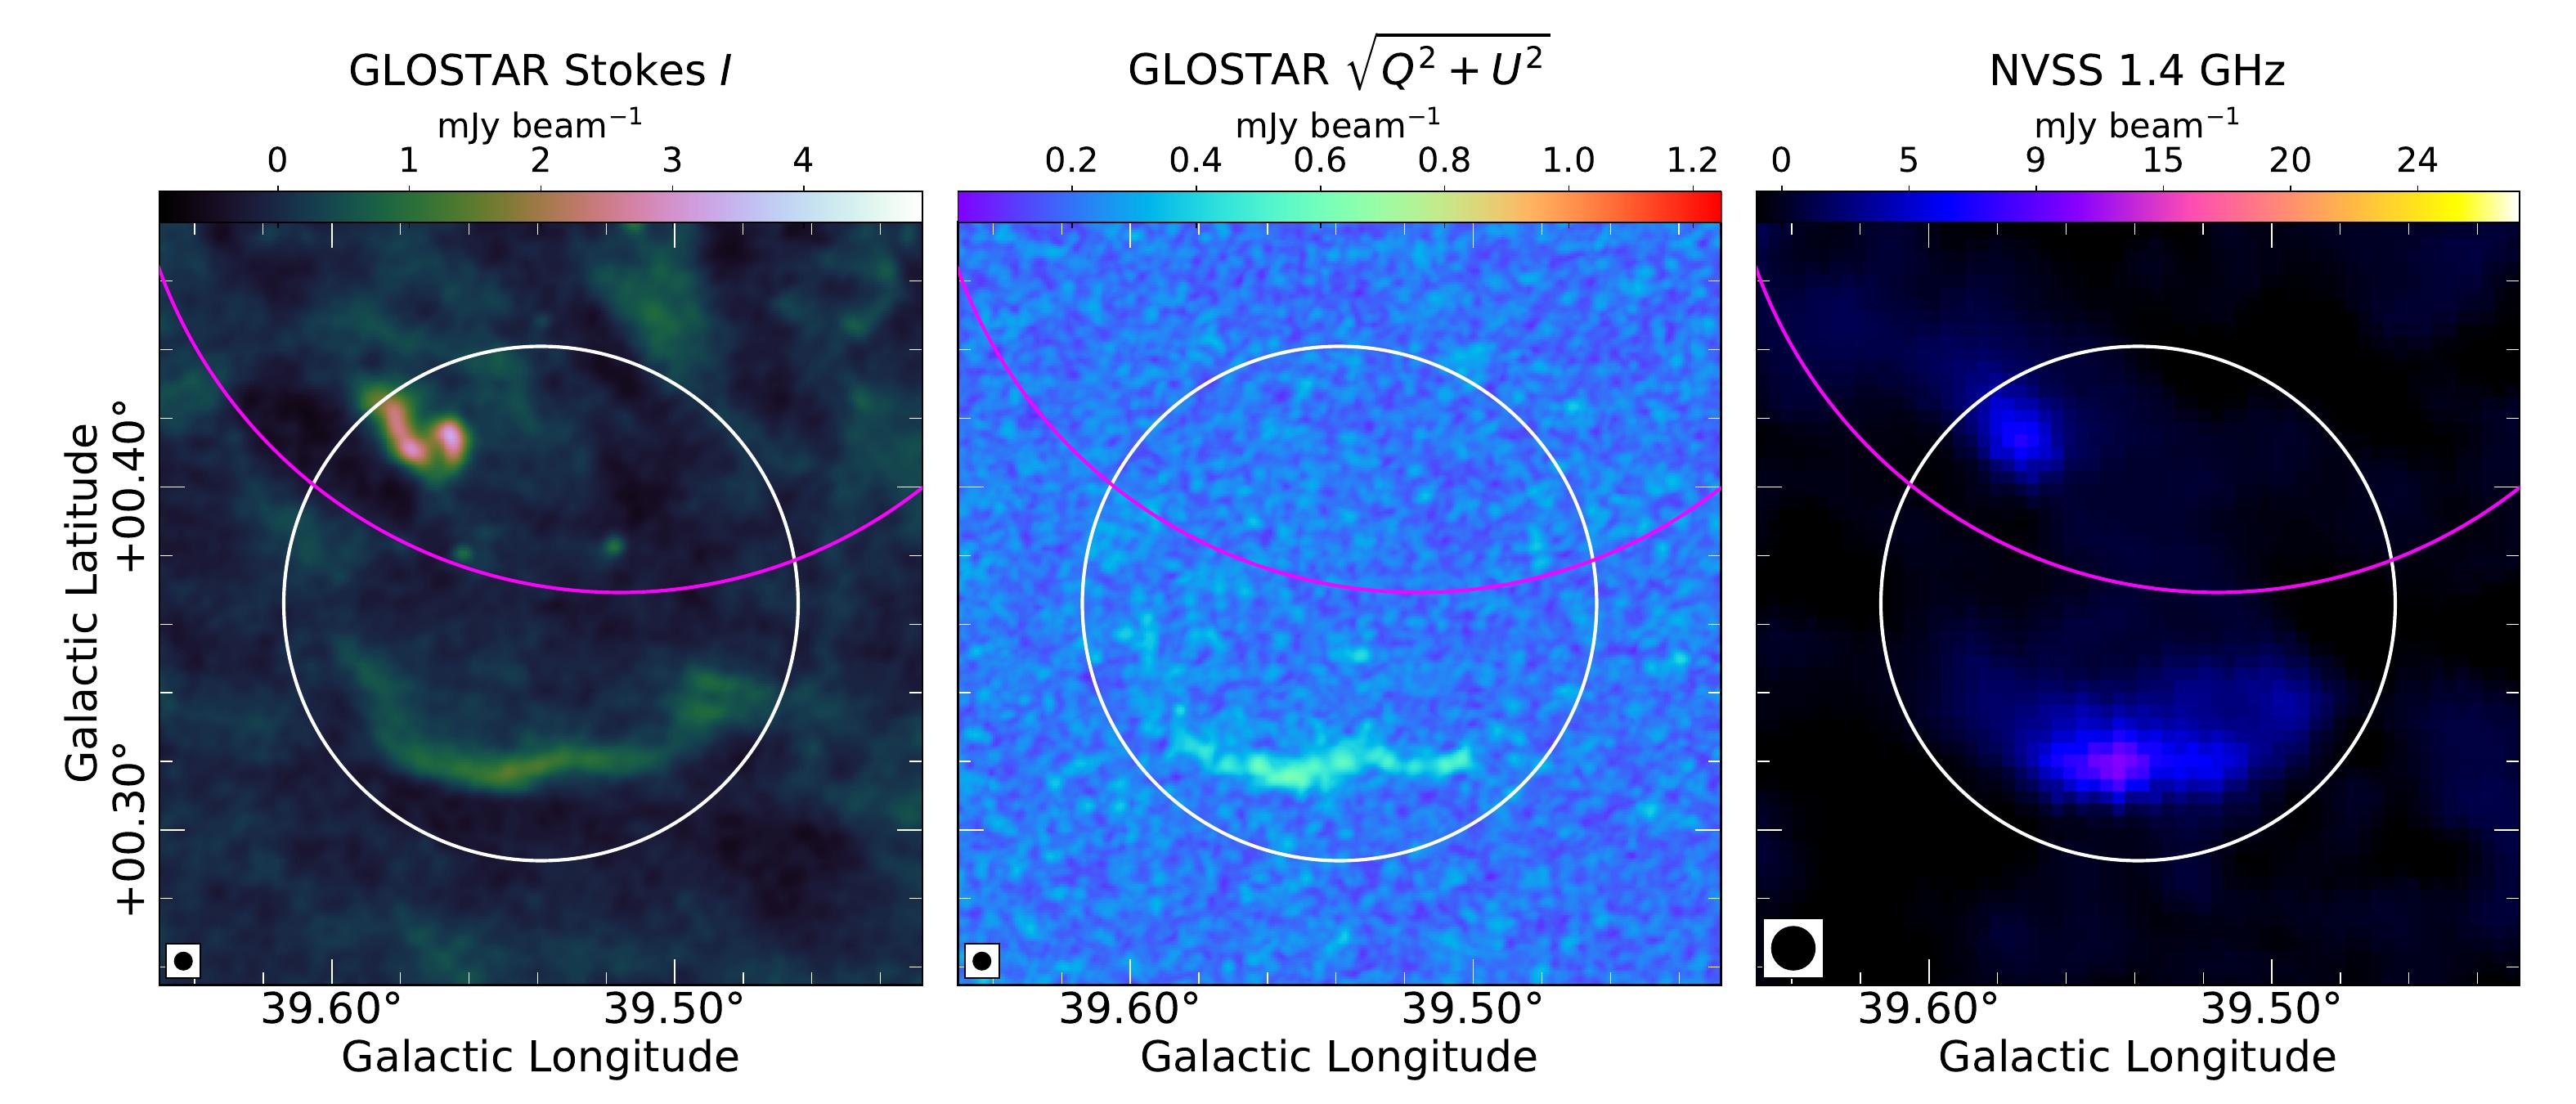
Three new SNR candidates have significant linearly polarized emission clearly coming from their Stokes counterparts, namely G005.9890.019, G034.5240.761, and G039.5390.366, with degrees of polarization , and , respectively. All three have a lone arc morphology that is reminiscent of a shell (see Fig. 11). These three candidates are also detected in lower frequency surveys (shown in the right panels of Fig. 11). The other newly discovered candidates with counterparts in lower frequency surveys are marked in Table LABEL:table:newcandSNRs. The low number of detections in polarization may imply that a large portion of our new candidates may in fact be H ii regions that are too faint to be detected by the GLIMPSE and MIPSGAL surveys, although this is unlikely (Anderson et al., 2014). Spectral index measurements can ascertain the nature of these new candidates.
4.5 Previously identified SNR candidates with polarized emission
4.5.1 G26.750.73
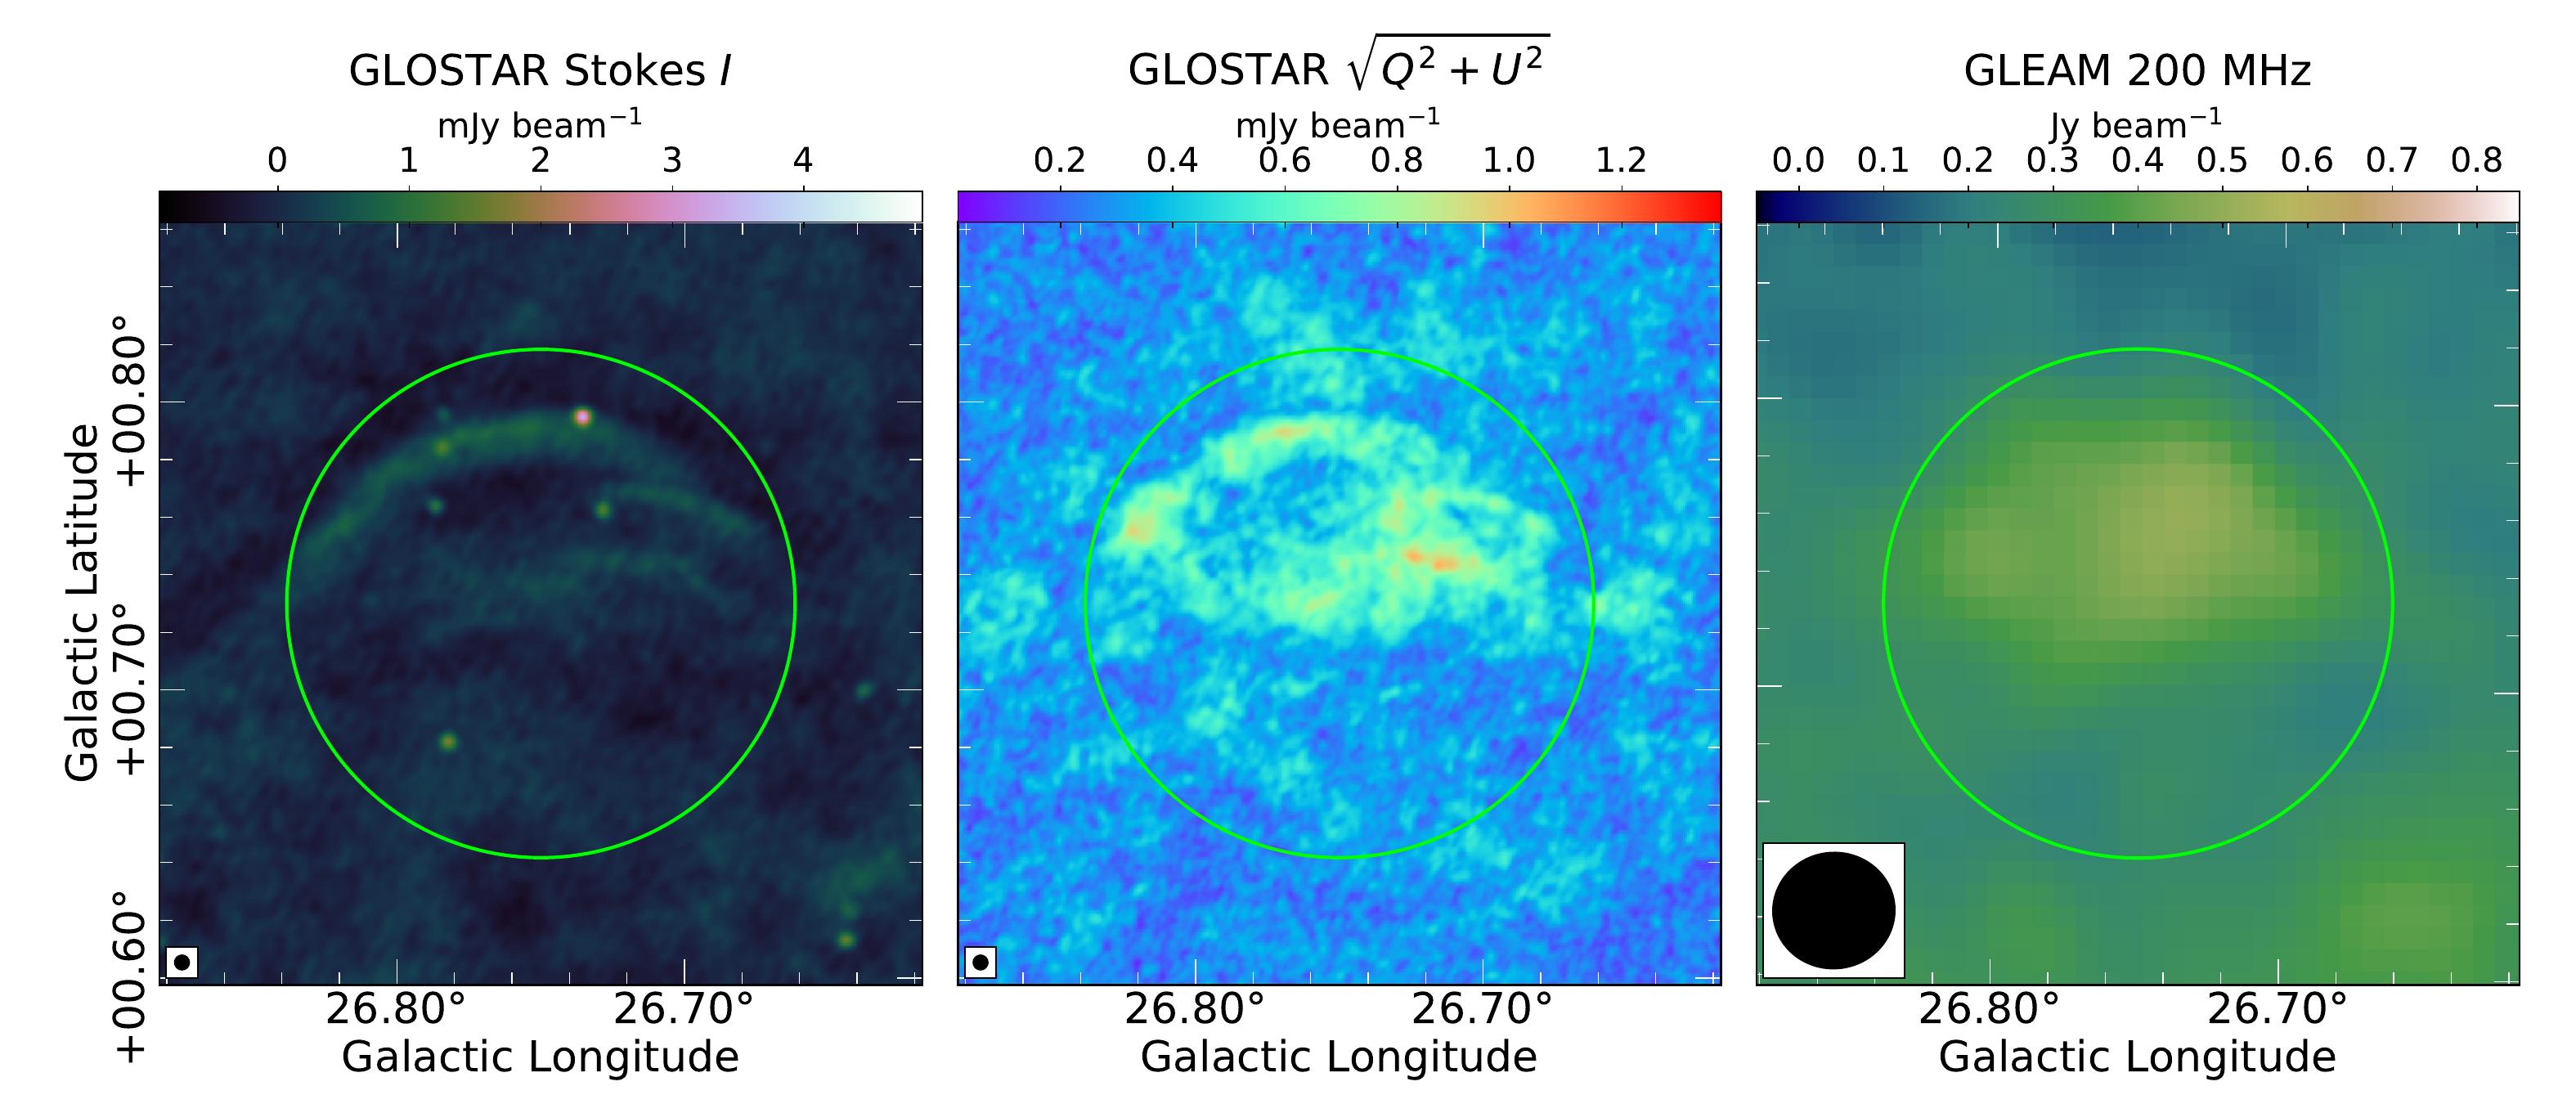
.
Candidate SNR G26.750.73 was identified by Anderson et al. (2017) using data from the THOR survey. We observe a partial shell morphology in the GLOSTAR-VLA data similar to the THOR+VGPS data (Fig. 12). We find that it has a high degree of polarization, , suggesting that this shell-shaped object is a SNR. We note that the degree of polarization observed in the GLOSTAR-VLA data is an over-estimation (see §3.2). In addition, we also find faint emission from this object in the 200 MHz GLEAM data101010http://gleam-vo.icrar.org/gleam_postage/q/form (Hurley-Walker et al., 2019c). We measure its flux density as Jy in the GLEAM data after subtracting the local background. Comparing this to its THOR+VGPS flux density of Jy (Anderson et al., 2017), we measure a nonthermal spectral index of , agreeing with its identification as a SNR.
4.5.2 G27.060.04
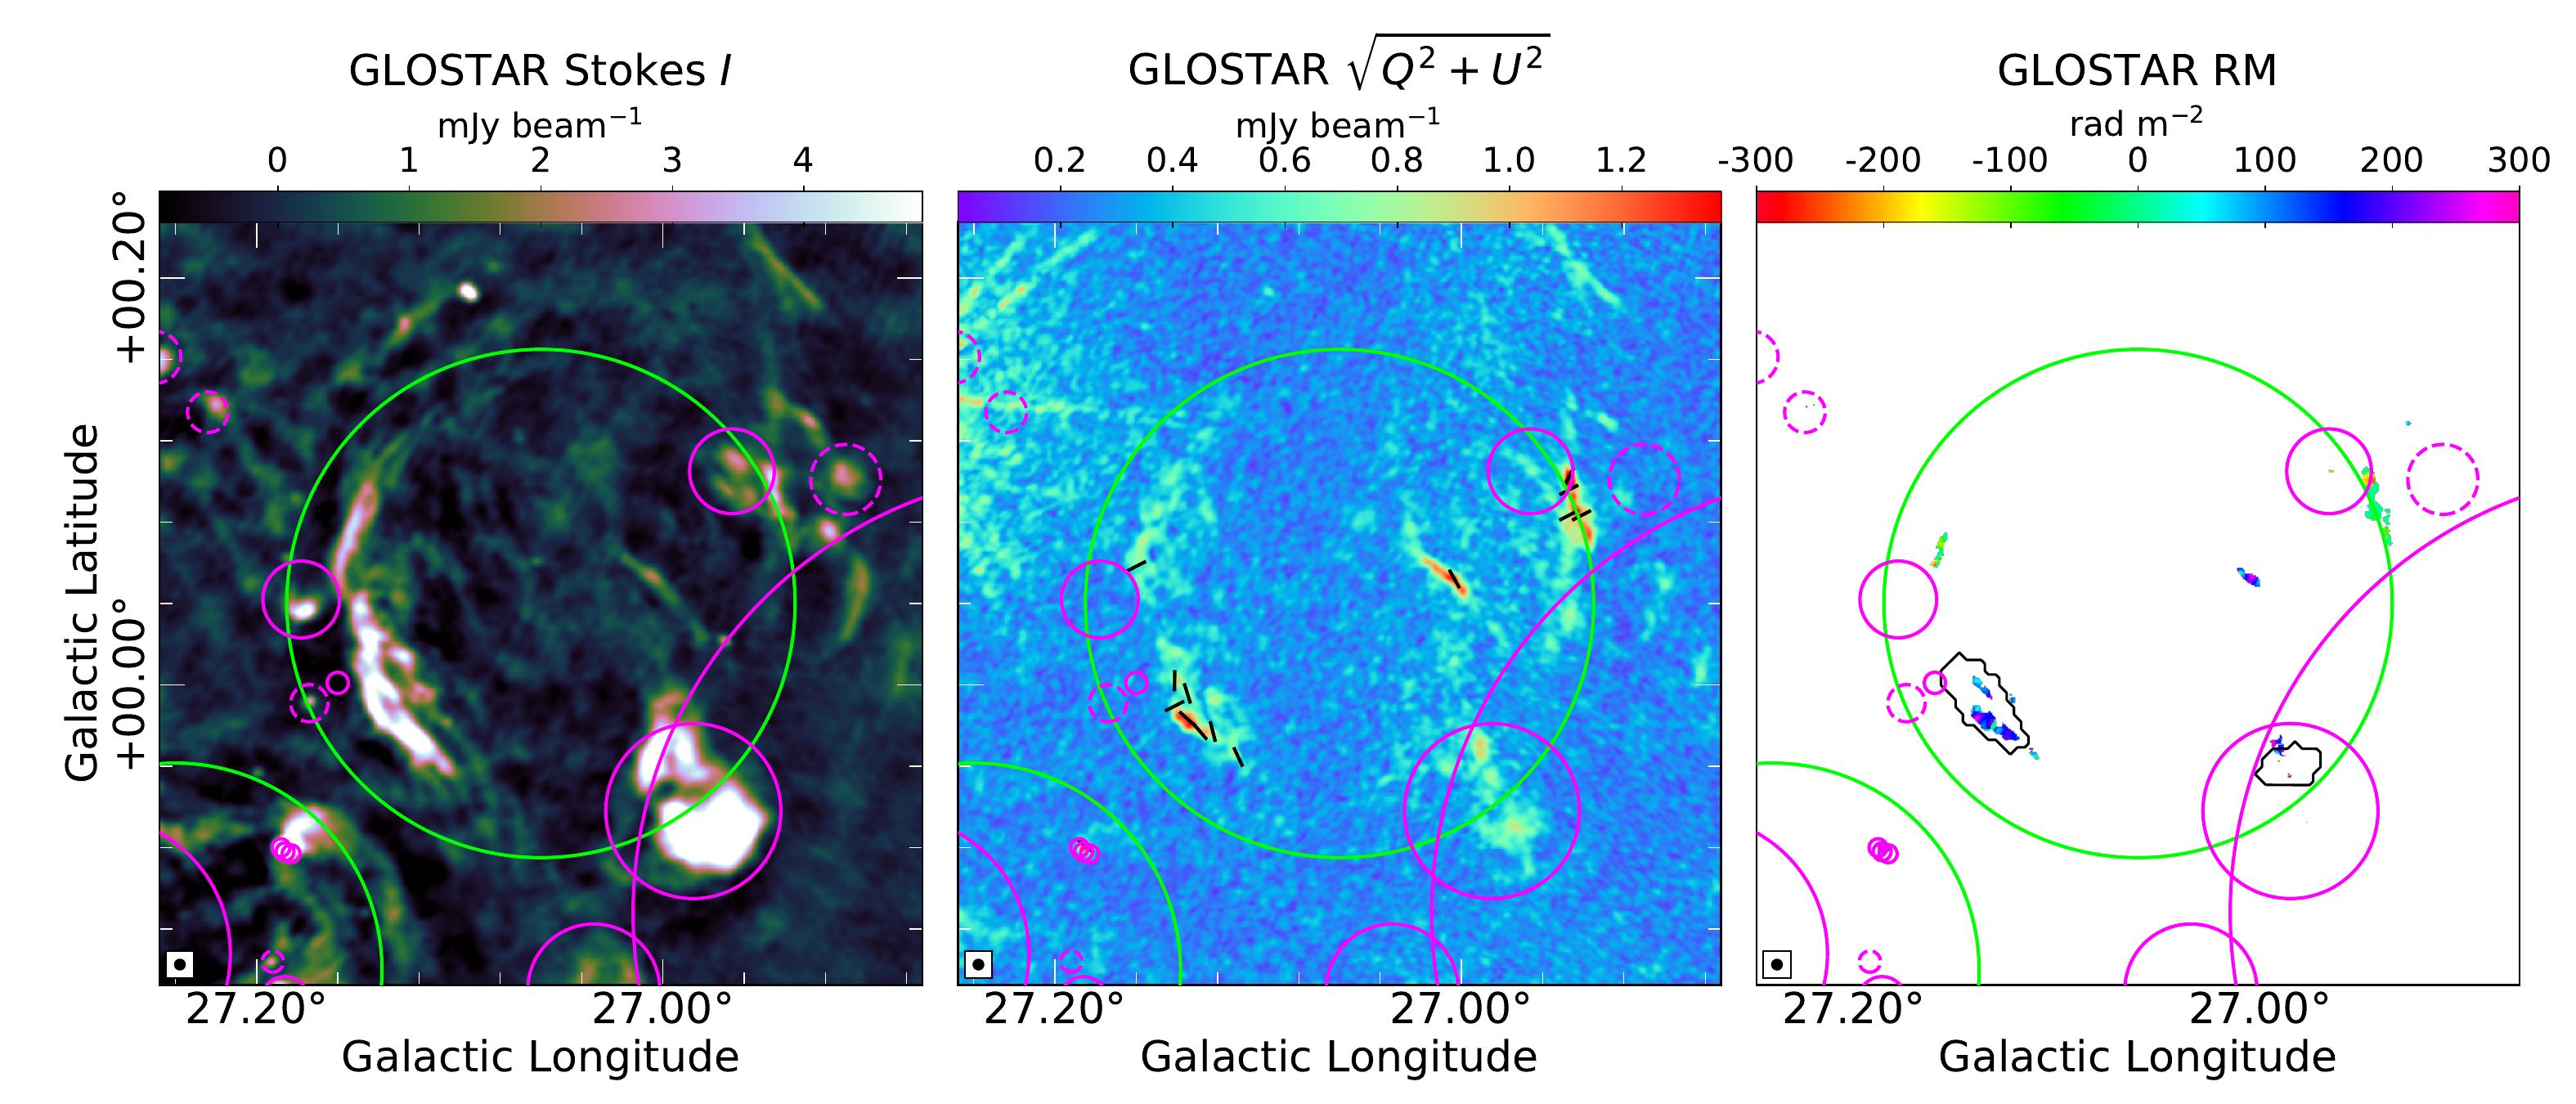
G27.060.04 is an arc-shaped SNR candidate detected in MAGPIS, THOR, and GLEAM surveys (Helfand et al., 2006; Anderson et al., 2017; Hurley-Walker et al., 2019b). We observe the same morphology in the GLOSTAR-VLA data (Fig. 13). For the arc, Hurley-Walker et al. (2019b) report a flux density of Jy at 200 MHz, while we measure its flux density to be Jy in the THOR+VGPS data (Beuther et al., 2016). This implies that this arc has a spectral index of , consistent with the value of from the TGSS-NVSS spectral index map111111http://tgssadr.strw.leidenuniv.nl/doku.php?id=spidx#spectral_index_map (de Gasperin et al., 2018). In the GLOSTAR-VLA data, we measure a degree of polarization of for the arc. We observe different RMs for the northern ( rad m-2) and southern ( rad m-2) parts of the arc. This is likely due to a change in the magnetic field direction, or local Faraday screens. Such large RMs and changes in RMs are not uncommon in SNRs (e.g., Milne & Dickel, 1974a, b; Gaensler et al., 2000; Harvey-Smith et al., 2010). Further studies are necessary to fully analyze the emission from this region. Nonetheless, the polarization and spectral index measurements provide sufficient evidence of the nonthermal nature of this object.
4.5.3 G28.780.44
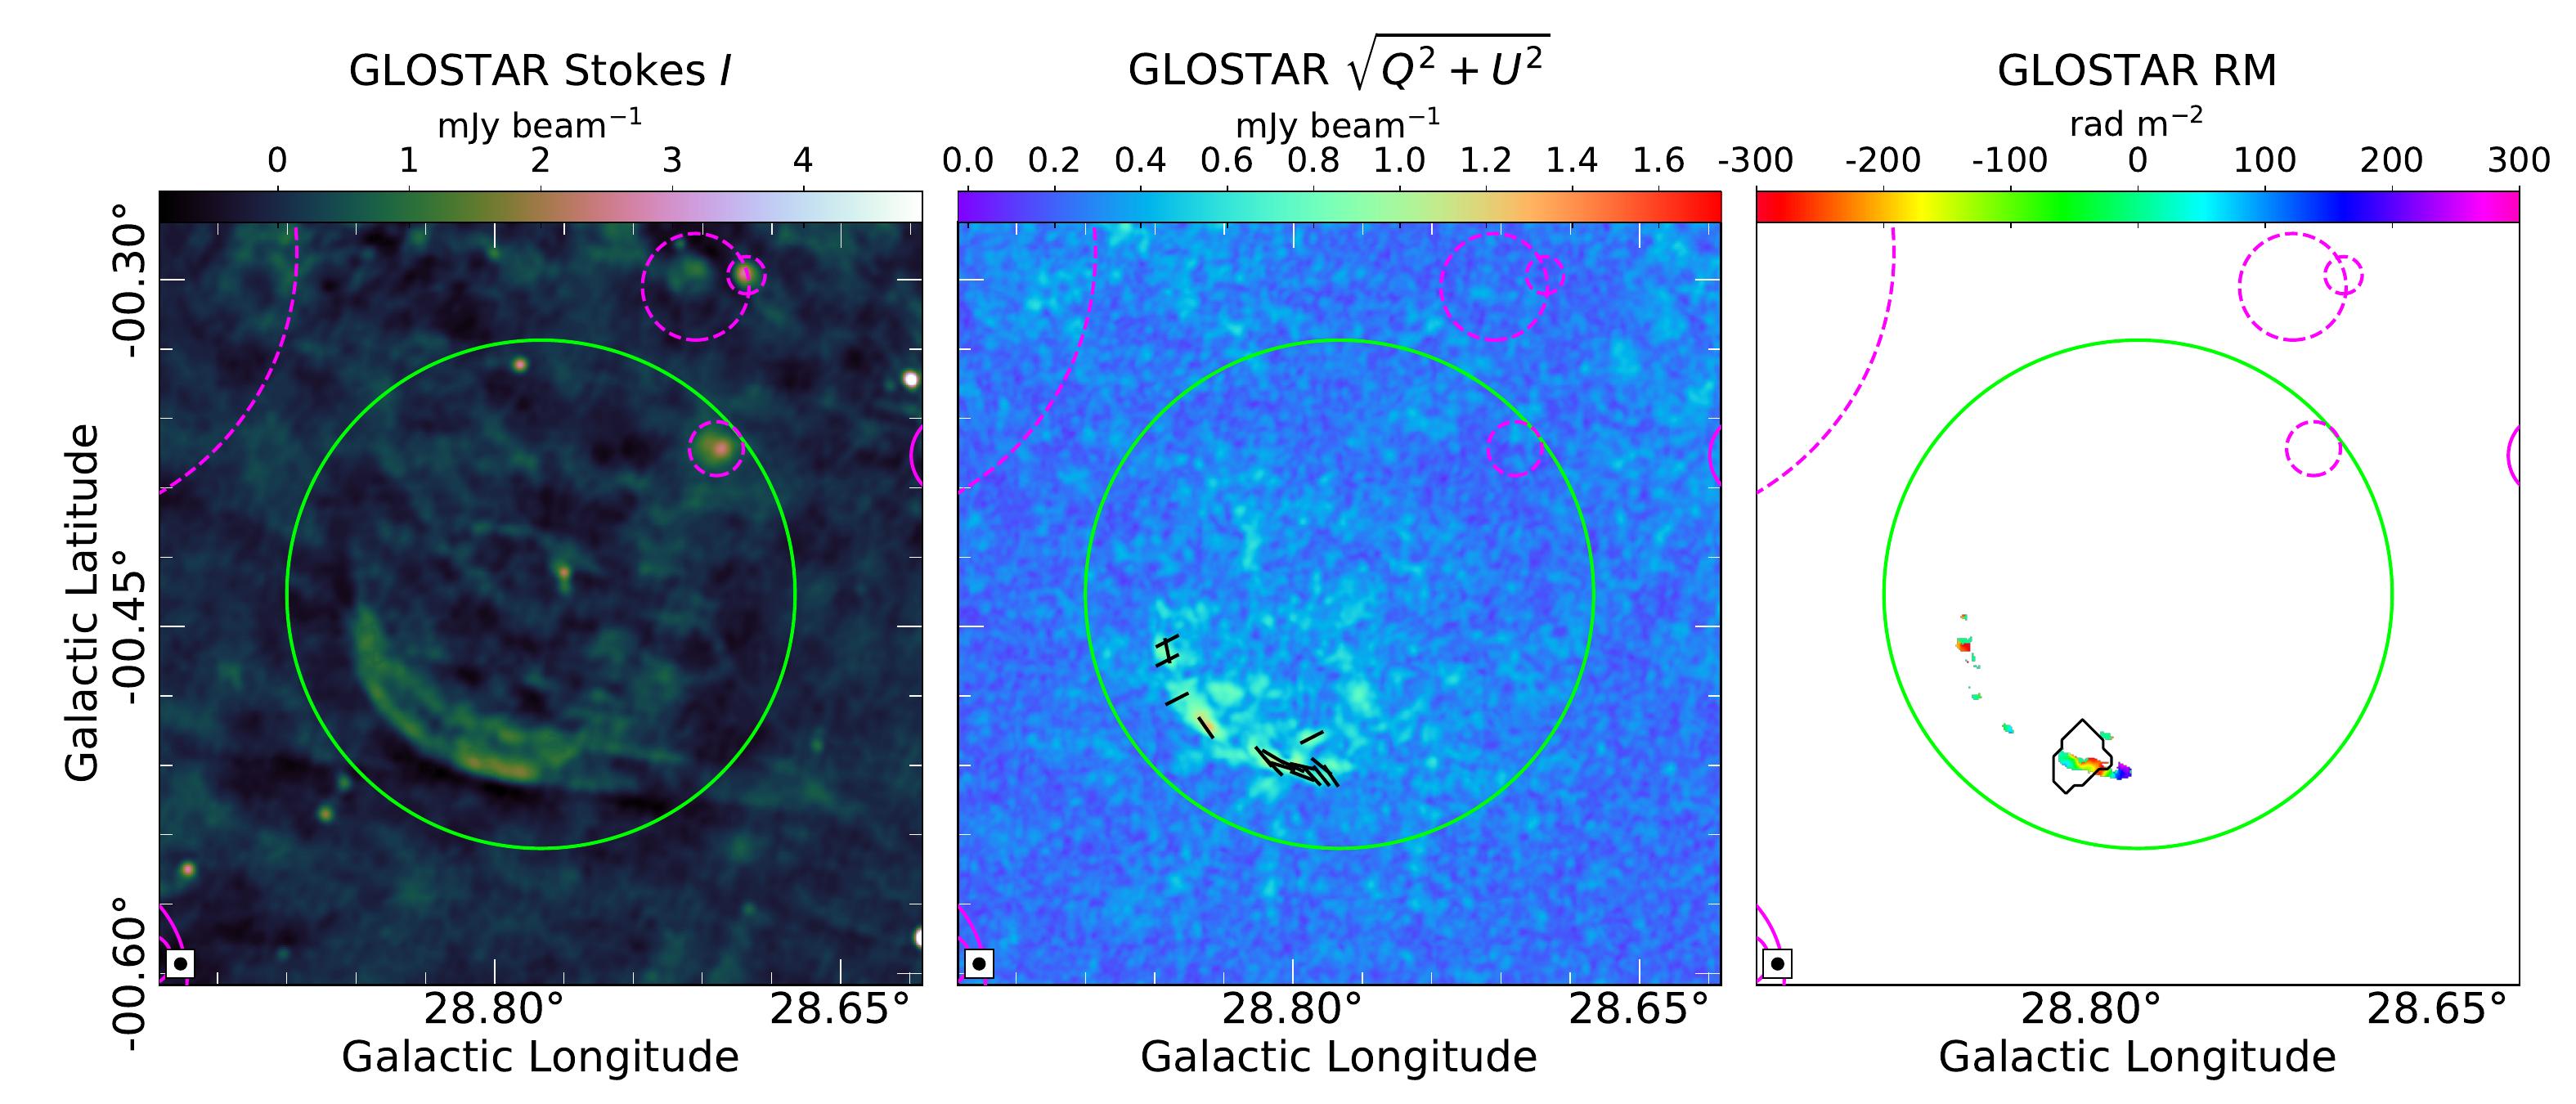
G28.780.44 was first identified in the MAGPIS survey (Helfand et al., 2006) and subsequently in the THOR and GLEAM surveys (Anderson et al., 2017; Hurley-Walker et al., 2019b) as a near-complete shell. A spectral index of was derived by Hurley-Walker et al. (2019b), which is consistent with the value of for a part of the shell measured from the TGSS-NVSS spectral index data (de Gasperin et al., 2018). In the GLOSTAR-VLA data, we find the object to have a partial shell morphology along with clear polarized emission (, Fig. 14). The polarized emission from this object is further evidence that this object is a SNR. We find that the electric field vectors are generally tangential to the shell, implying that the ambient magnetic field is either radial or nearly parallel to the line of sight. Radial magnetic fields are seen in young shell-type SNRs, likely because of Rayleigh–Taylor instability (Milne, 1987; Jun & Norman, 1996; Fürst & Reich, 2004).
4.5.4 G29.380.10
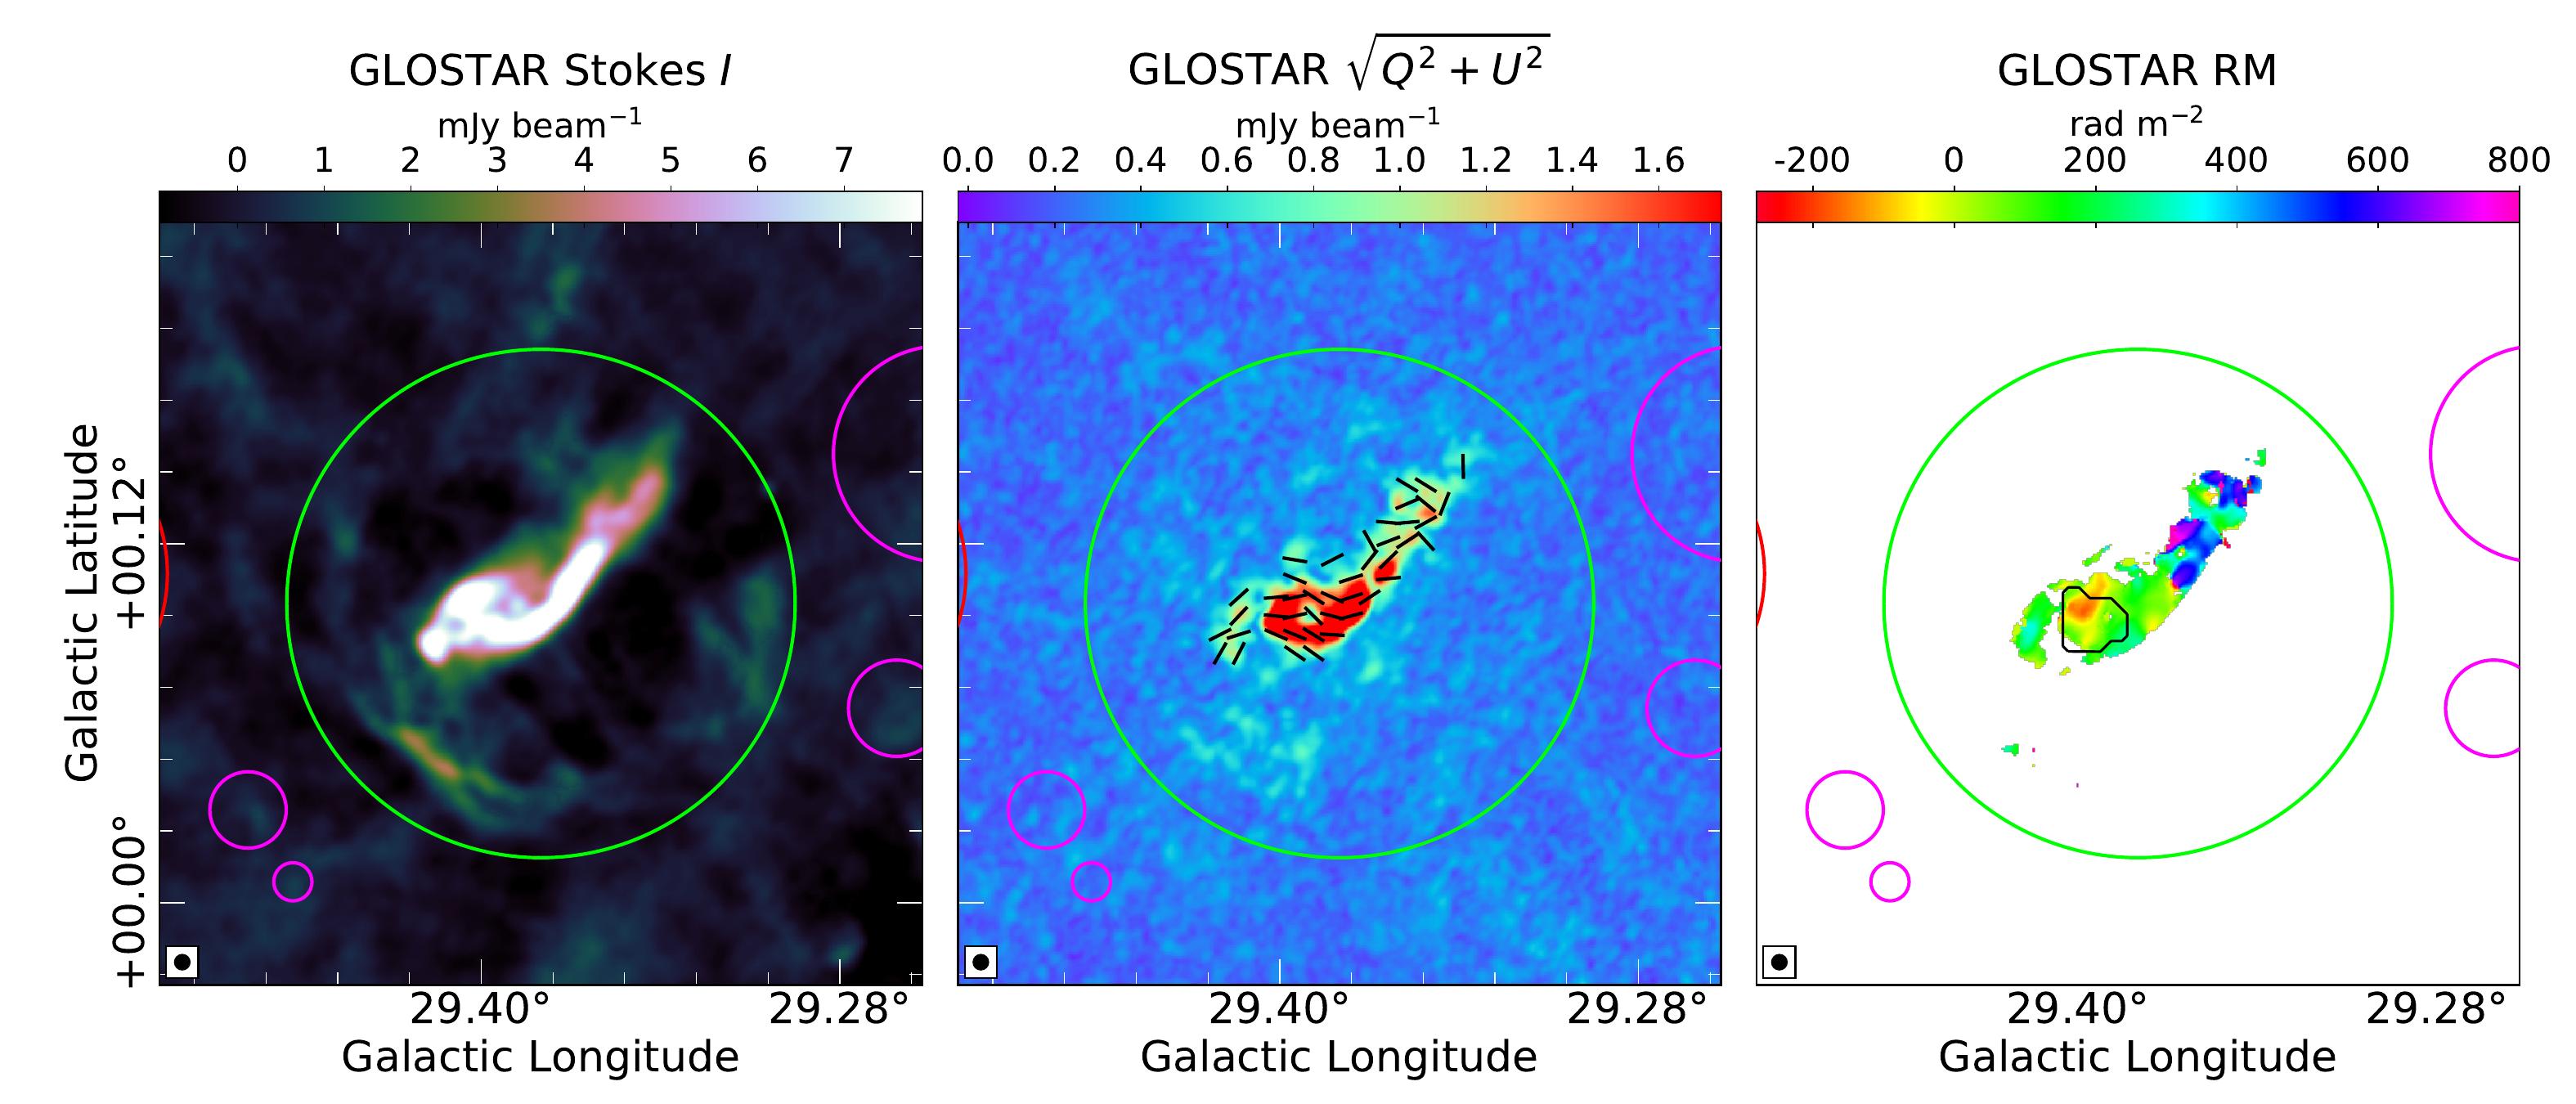
G29.380.10 was observed in the MAGPIS and THOR surveys as a source with bright central compact emission inside a weakly emitting shell (Helfand et al., 2006; Anderson et al., 2017). Hurley-Walker et al. (2019b) measured a spectral index of , noting it as a potential PWN. A similar spectral index is obtained from the TGSS-NVSS spectral index map ( de Gasperin et al., 2018). We observe the central emission at higher resolution in the GLOSTAR-VLA data; it shows a faint unresolved central object inside the bright elongated nebula, which itself is surrounded by a weak shell, the remnant of the SN that had the pulsar as its end product (Fig. 15). An ordered magnetic field can be inferred from the electric field vectors. The derived RMs range from to rad m-2. Such a large spread is not typically seen in objects in the Milky Way, and may be due to Faraday thick structures or a superposition with sources unrelated to the PWN. The PWN and its shell have measured degrees of polarization of and respectively.
This region was analyzed across several spectral bands by Castelletti et al. (2017) and Petriella (2019), searching for evidence for an association of the radio detection with the TeV source HESS J1844-030 (H. E. S. S. Collaboration et al., 2018). No evidence for pulsations was found in any band and the S-shaped feature is suggested to be a radio galaxy. It is argued that the radio galaxy is responsible for only a part of the observed emission and that this source most likely represents a chance superposition of the radio galaxy, and a PWN and its remnant shell. This may explain the large variation in our RM measurements near the tail. The polarization and spectral index measurements, combined with the analysis by Castelletti et al. (2017) and Petriella (2019), confirm the status of this candidate as a SNR.
4.5.5 G51.210.11 complex: G51.040.07 and G51.260.11
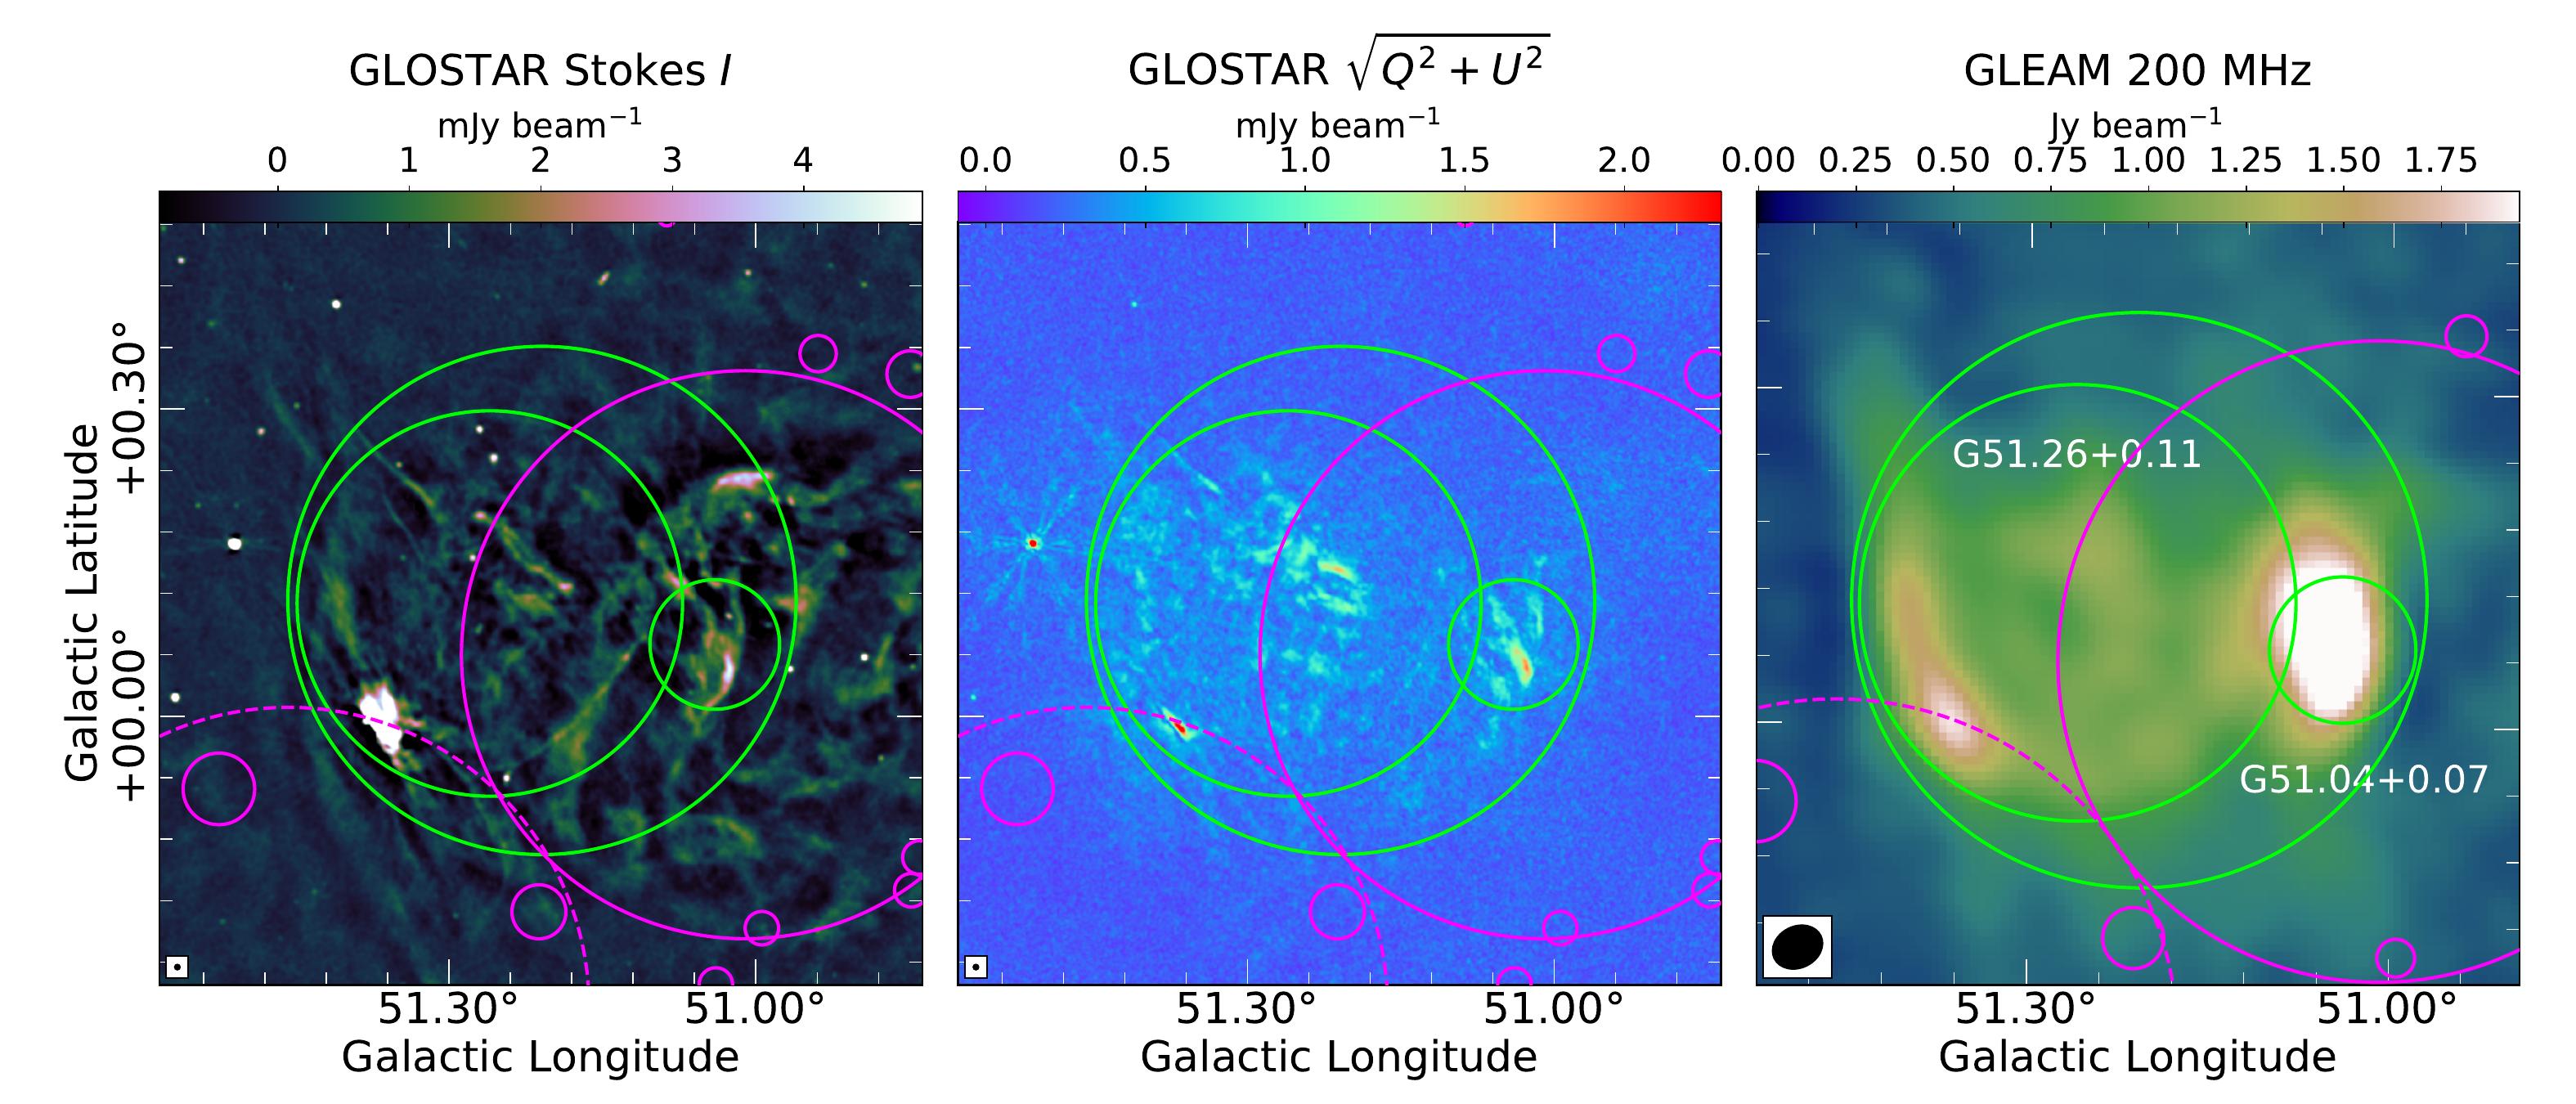
The candidate G51.210.11 was identified by Anderson et al. (2017) in the THOR survey. Further studies by Supan et al. (2018) and Dokara et al. (2018) have shown evidence of nonthermal emission arising from two distinct regions in this complex. Dokara et al. (2018) classify it as two separate SNRs, G51.040.07 and G51.260.11. Recently, Araya (2021) identified GeV emission from this region. They rule out nearby star-forming regions and Bremsstrahlung radiation as the origin of this GeV emission and support the hypothesis that this emission is from at least one SNR. In the GLOSTAR-VLA data, a morphology similar to the one in THOR+VGPS data is observed (Fig. 16). We measure a degree of polarization of for G51.040.07 and for G51.260.11. In the 1.4 GHz THOR+VGPS data and the 200 MHz GLEAM data, we subtracted the local background and measured the flux densities of these objects. The 200 MHz and 1.4 GHz flux densities of G51.040.07 are Jy and Jy respectively, whereas G51.260.11 has Jy and Jy, respectively. These values imply spectral indices of for G51.040.07 and for G51.260.11. The above polarization and spectral index measurements further strengthen the case of these two objects as SNRs.
4.6 Other observed SNR candidates
4.6.1 G15.510.15
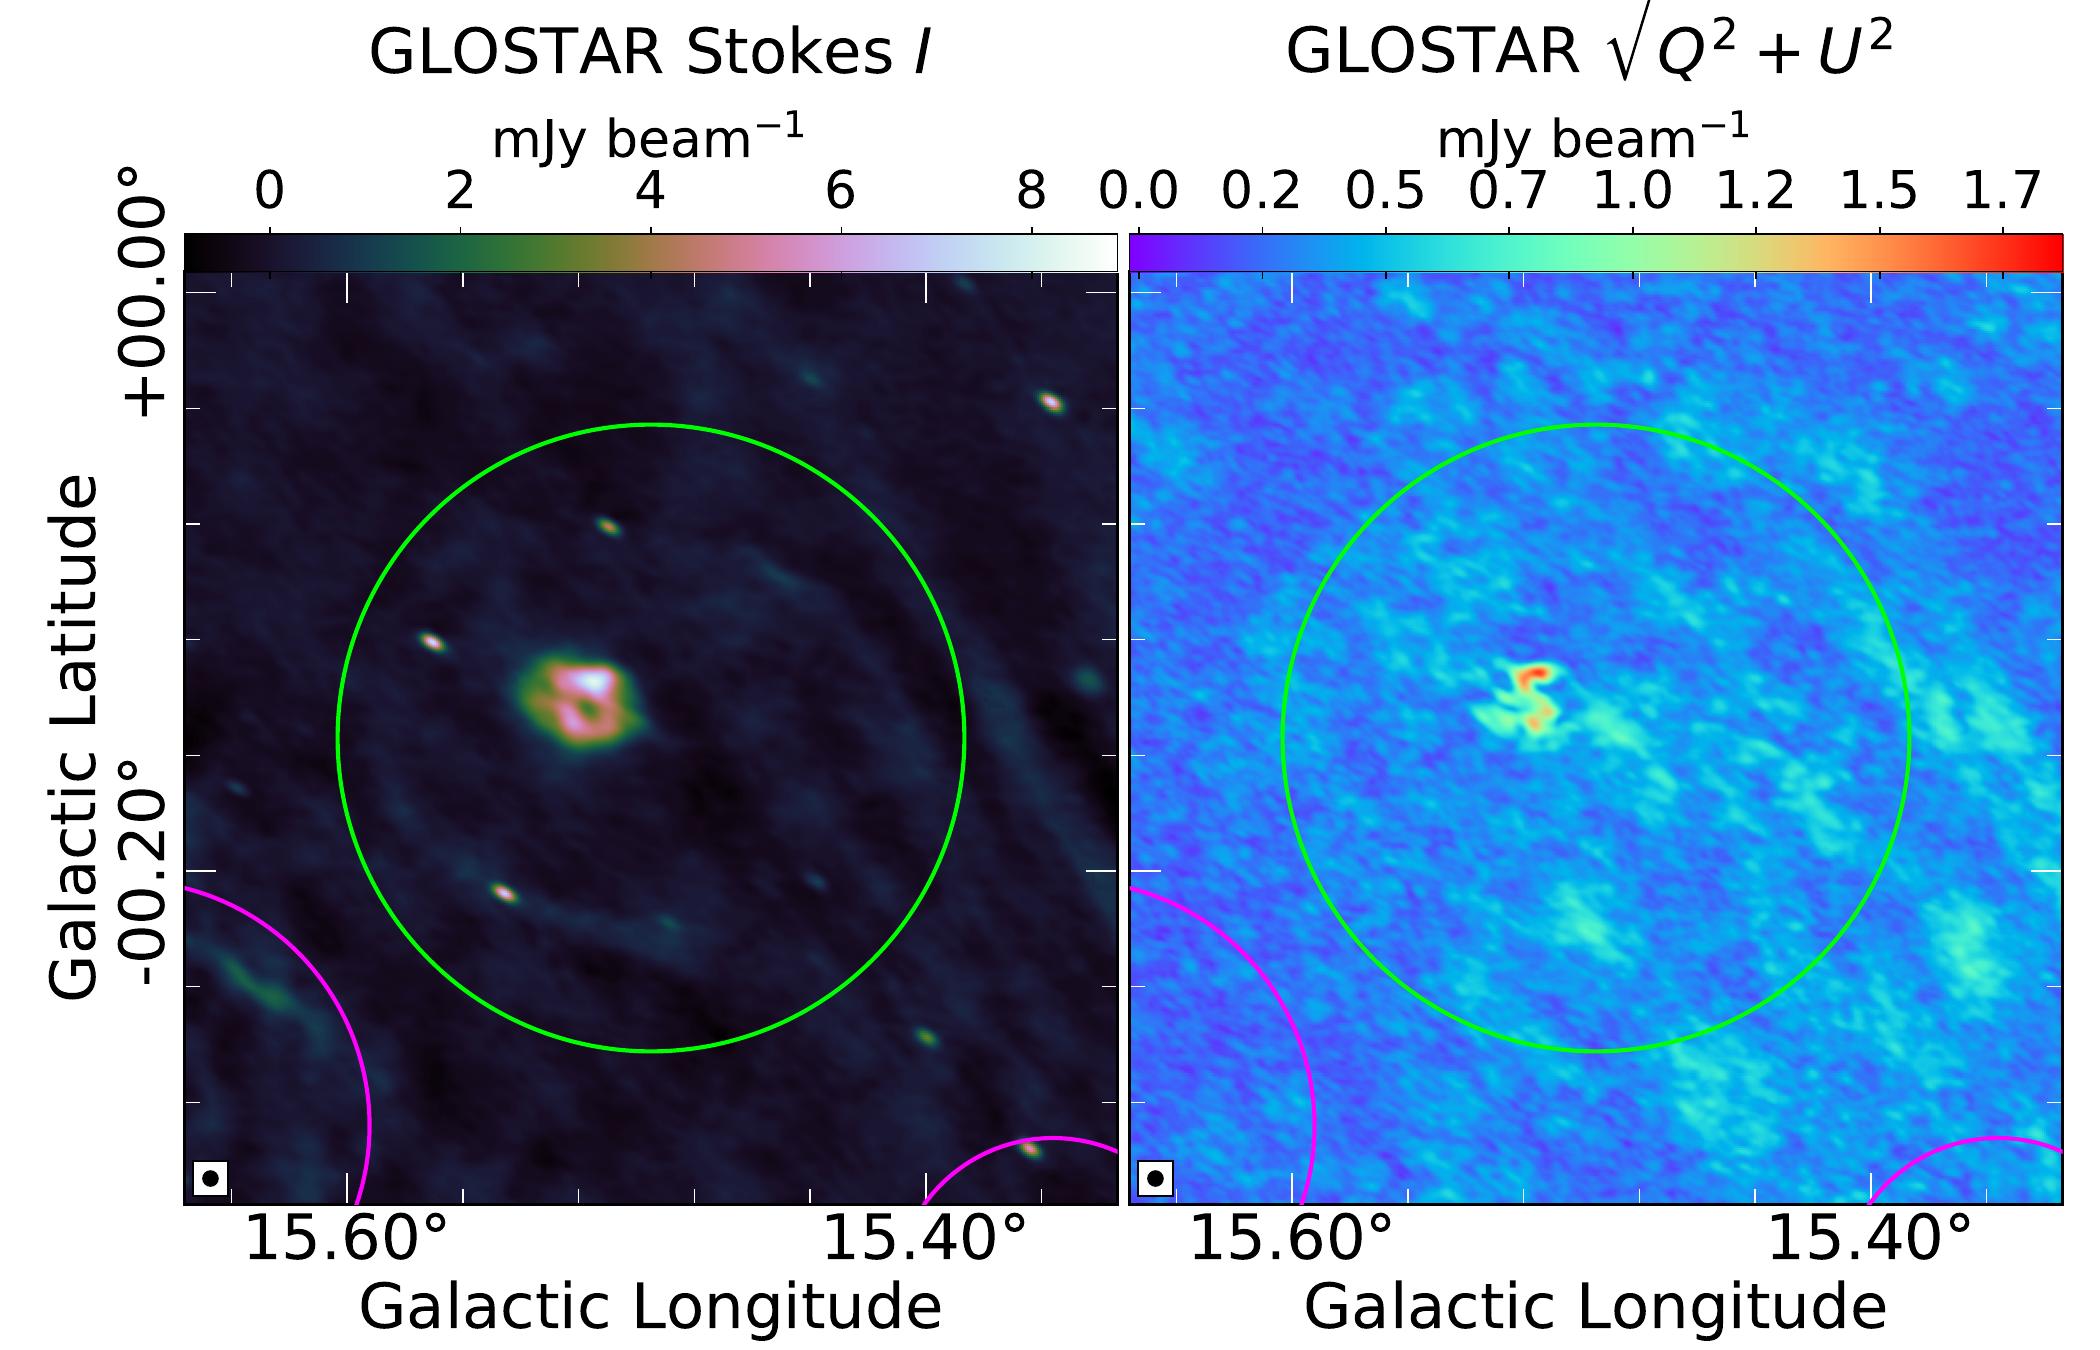
Brogan et al. (2006) identified G15.510.15 as a potential shell-type remnant that is less likely to be a SNR121212Brogan et al. (2006) classified the candidate G15.510.15 as a class III-type shell in their Table 1 and have not discussed this candidate further in the text. However, the image of this candidate they showed in their Plate 1 has a bright central object and only a weak partial shell.. Hurley-Walker et al. (2019b) studied this object in GLEAM and the archival NRAO VLA Sky Survey data (NVSS; Condon et al., 1998). They derive a spectral index of for both the central object and the surrounding emission and speculate a common origin for both.
In the GLOSTAR-VLA data (Fig. 17), we clearly resolve this candidate into a shell that surrounds off-center compact emission. This morphology is indicative of a PWN. However, PWNe generally have a spectral index of , although known exceptions exist (see Kothes et al., 2008). We note that the spectral index calculations for the shell by Hurley-Walker et al. (2019b) are unlikely to be influenced significantly by the three point sources on the shell. In the GLOSTAR-VLA data, these point sources have flux densities of 4–8 mJy and spectral indices close to zero, implying that they would have similarly small flux densities in the GLEAM band as well. Comparing with the flux density of Jy derived by Hurley-Walker et al. (2019b), it can be seen that the contribution of these three point sources to the flux density at 200 MHz, and hence to their 200–1400 MHz spectral index calculation, would be negligible. It is possible that the shell and the central object are two separate SNRs, or it may be a composite-type remnant. Distance measurements are required to study whether the shell and the central object are related.
In order to measure the polarization of the shell, we excluded the three compact objects on the shell that are likely unrelated sources. The remaining part of the shell is faint and we could only derive an upper limit on the degree of linear polarization, . We measure a low degree of polarization of from the central object.
4.6.2 G18.760.07
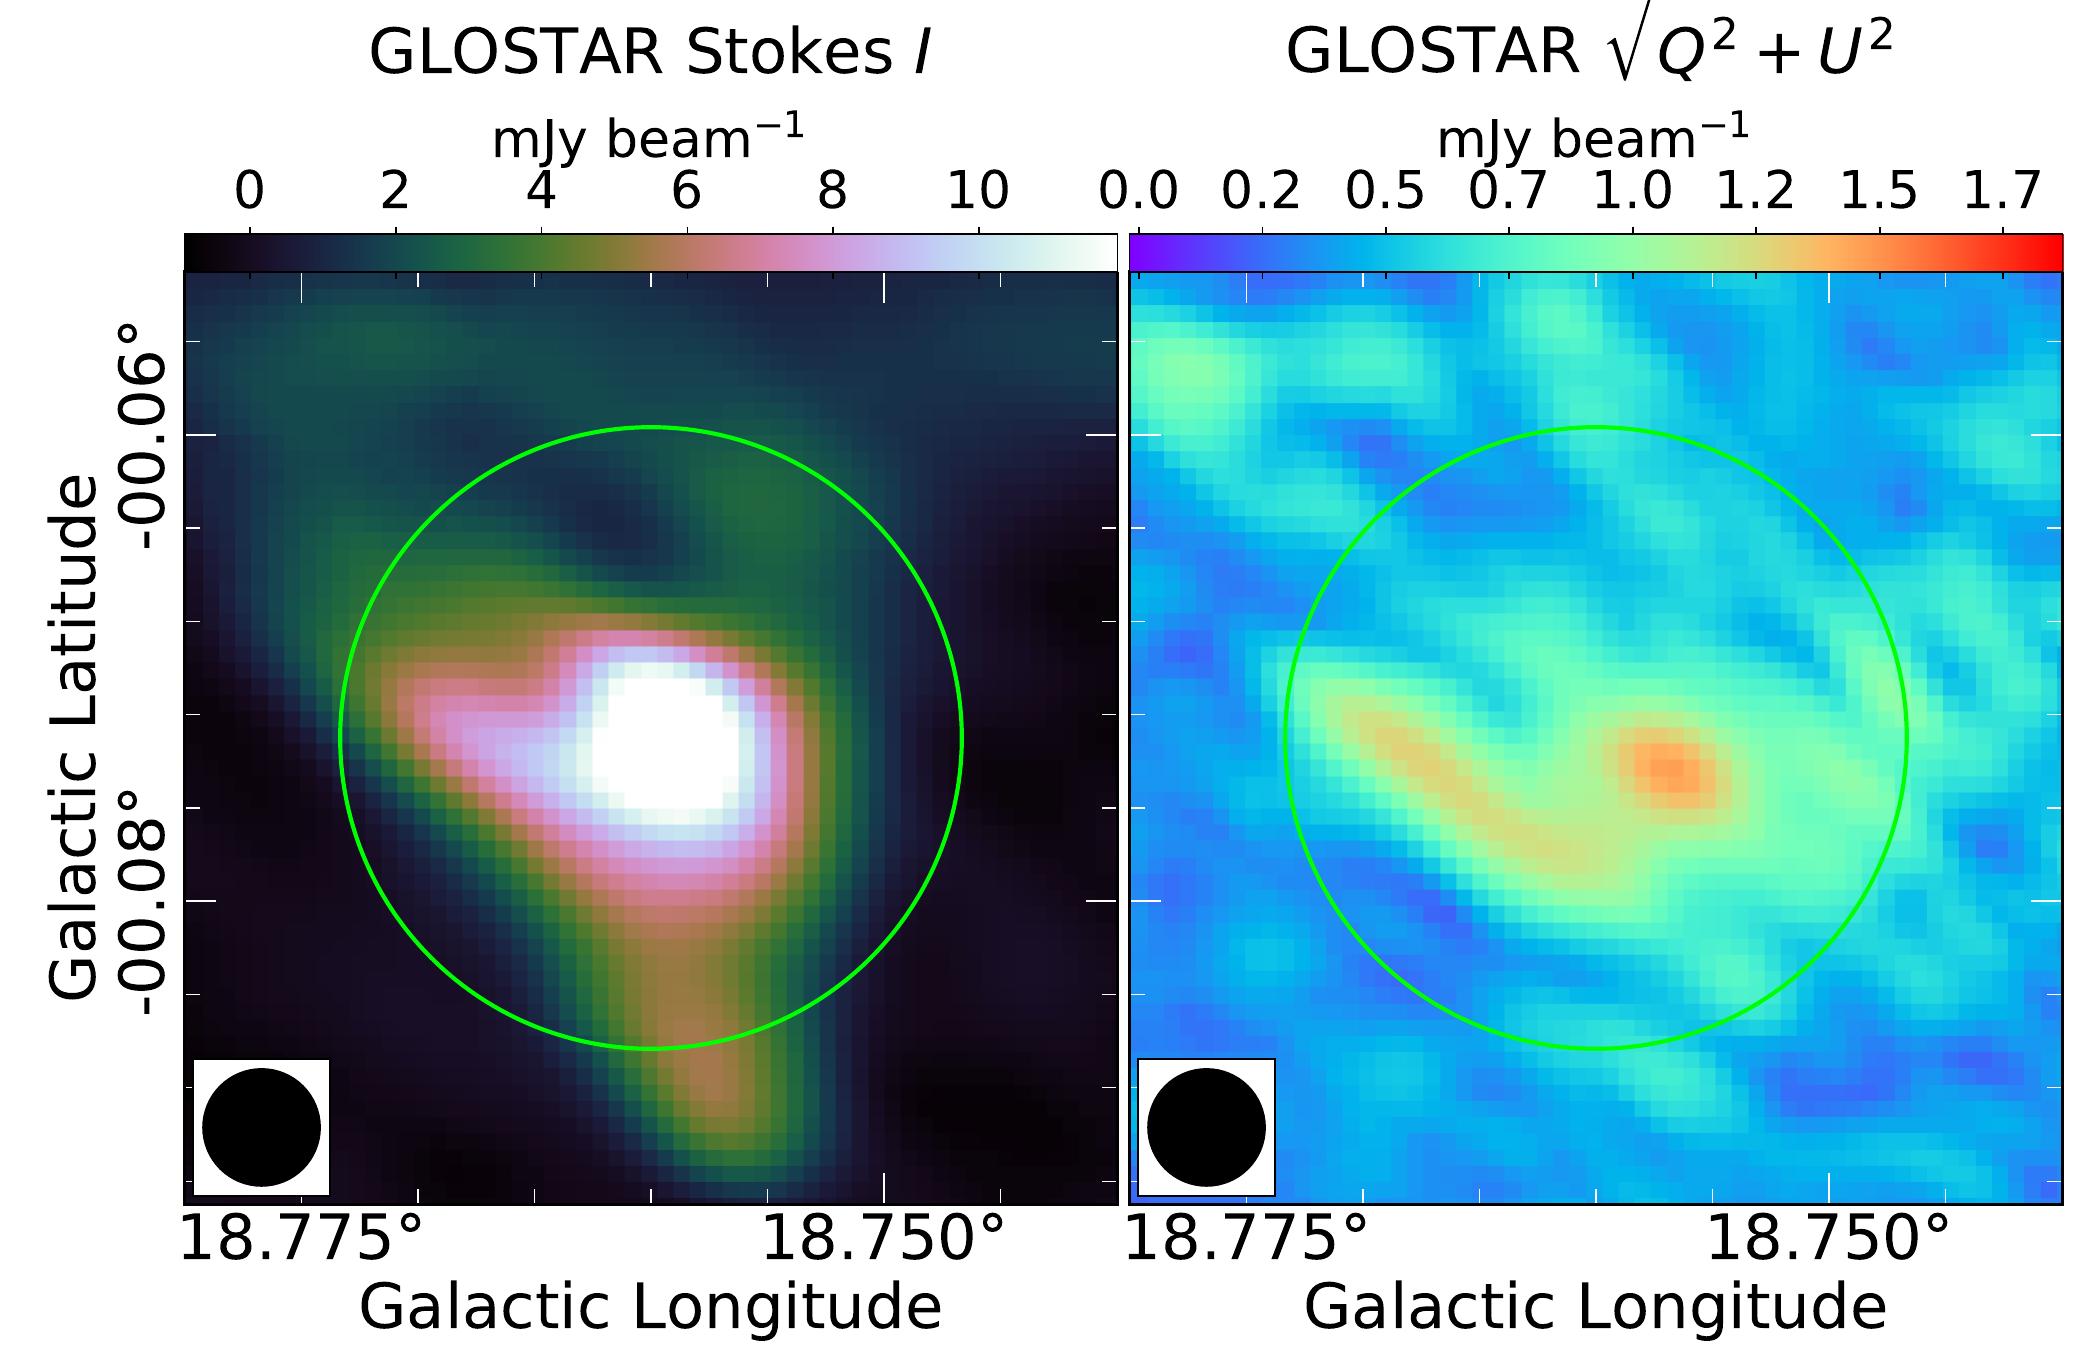
With a diameter of , G18.760.07 is one of the SNR candidates of the smallest angular size. It was first discovered in the MAGPIS survey (Helfand et al., 2006) and then in the THOR survey (Anderson et al., 2017). We measure in the GLOSTAR-VLA data a degree of polarization of . The polarization map (Fig. 18) shows a point source and an elongated source in this region. A large negative spectral index of was measured from the GLEAM ( MHz) and the NVSS data (1400 MHz) by Hurley-Walker et al. (2019b), and the TGSS-NVSS spectral index map (150-1400 MHz; de Gasperin et al., 2018) also shows a similar value (). Such values for SNRs have been reported only at higher frequencies after a “spectral break” (see Kothes et al., 2020, for instance). As such a spectral index below L-band frequencies is generally seen only in extragalactic objects, and because of the morphology of the linearly polarized emission, we infer that at least one extragalactic object is located within the angular extent of this candidate.
4.6.3 G22.000.00/G022.0450.028
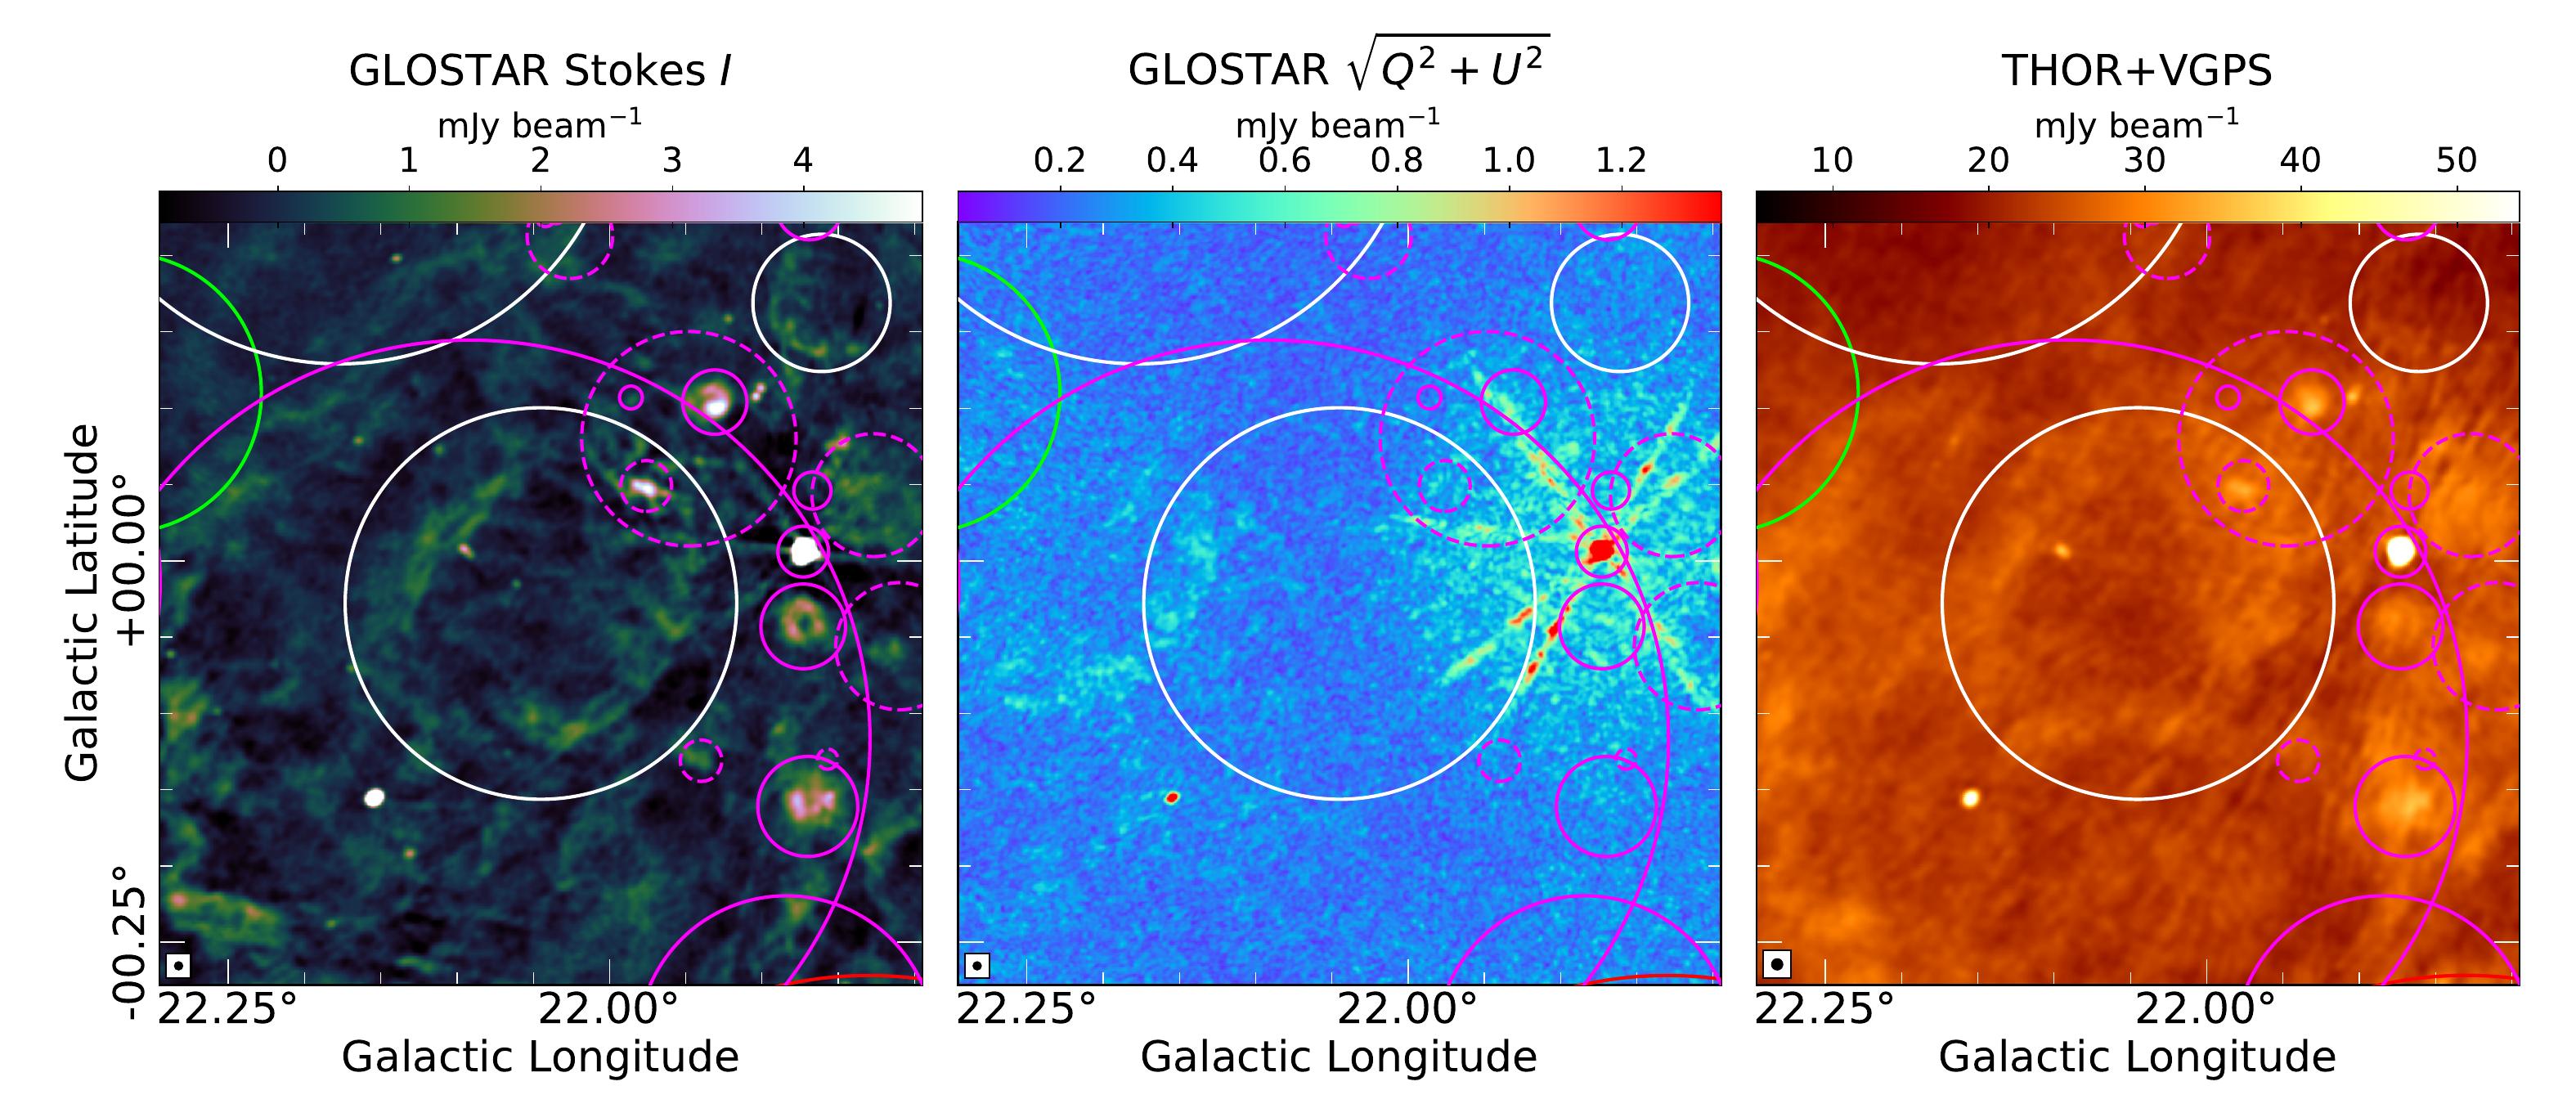
Ueno et al. (2006) discovered G22.000.00 at X-ray energies, noting that synchrotron X-ray emitting SNRs have low radio surface brightness. Yamauchi et al. (2016) hint that this candidate may be a PWN. We do not find any PWN-like object, but we do identify a shell-like object in the GLOSTAR-VLA and the THOR+VGPS data (Fig. 19), overlapping with the diffuse X-ray emission detected by Ueno et al. (2006) and Yamauchi et al. (2016) at , . We name this a GLOSTAR SNR candidate G022.0450.028. The spatial overlap indicates that this may be the shell corresponding to the PWN suggested by Yamauchi et al. (2016). We observe polarization in the GLOSTAR-VLA data from the eastern part of the shell, but it appears to be from unrelated shell-shaped emission extending further east without a Stokes counterpart in either of the THOR+VGPS and GLOSTAR-VLA data (Fig. 19). It is as yet unclear whether the radio shell is associated with the X-ray detection.
4.6.4 G27.180.30
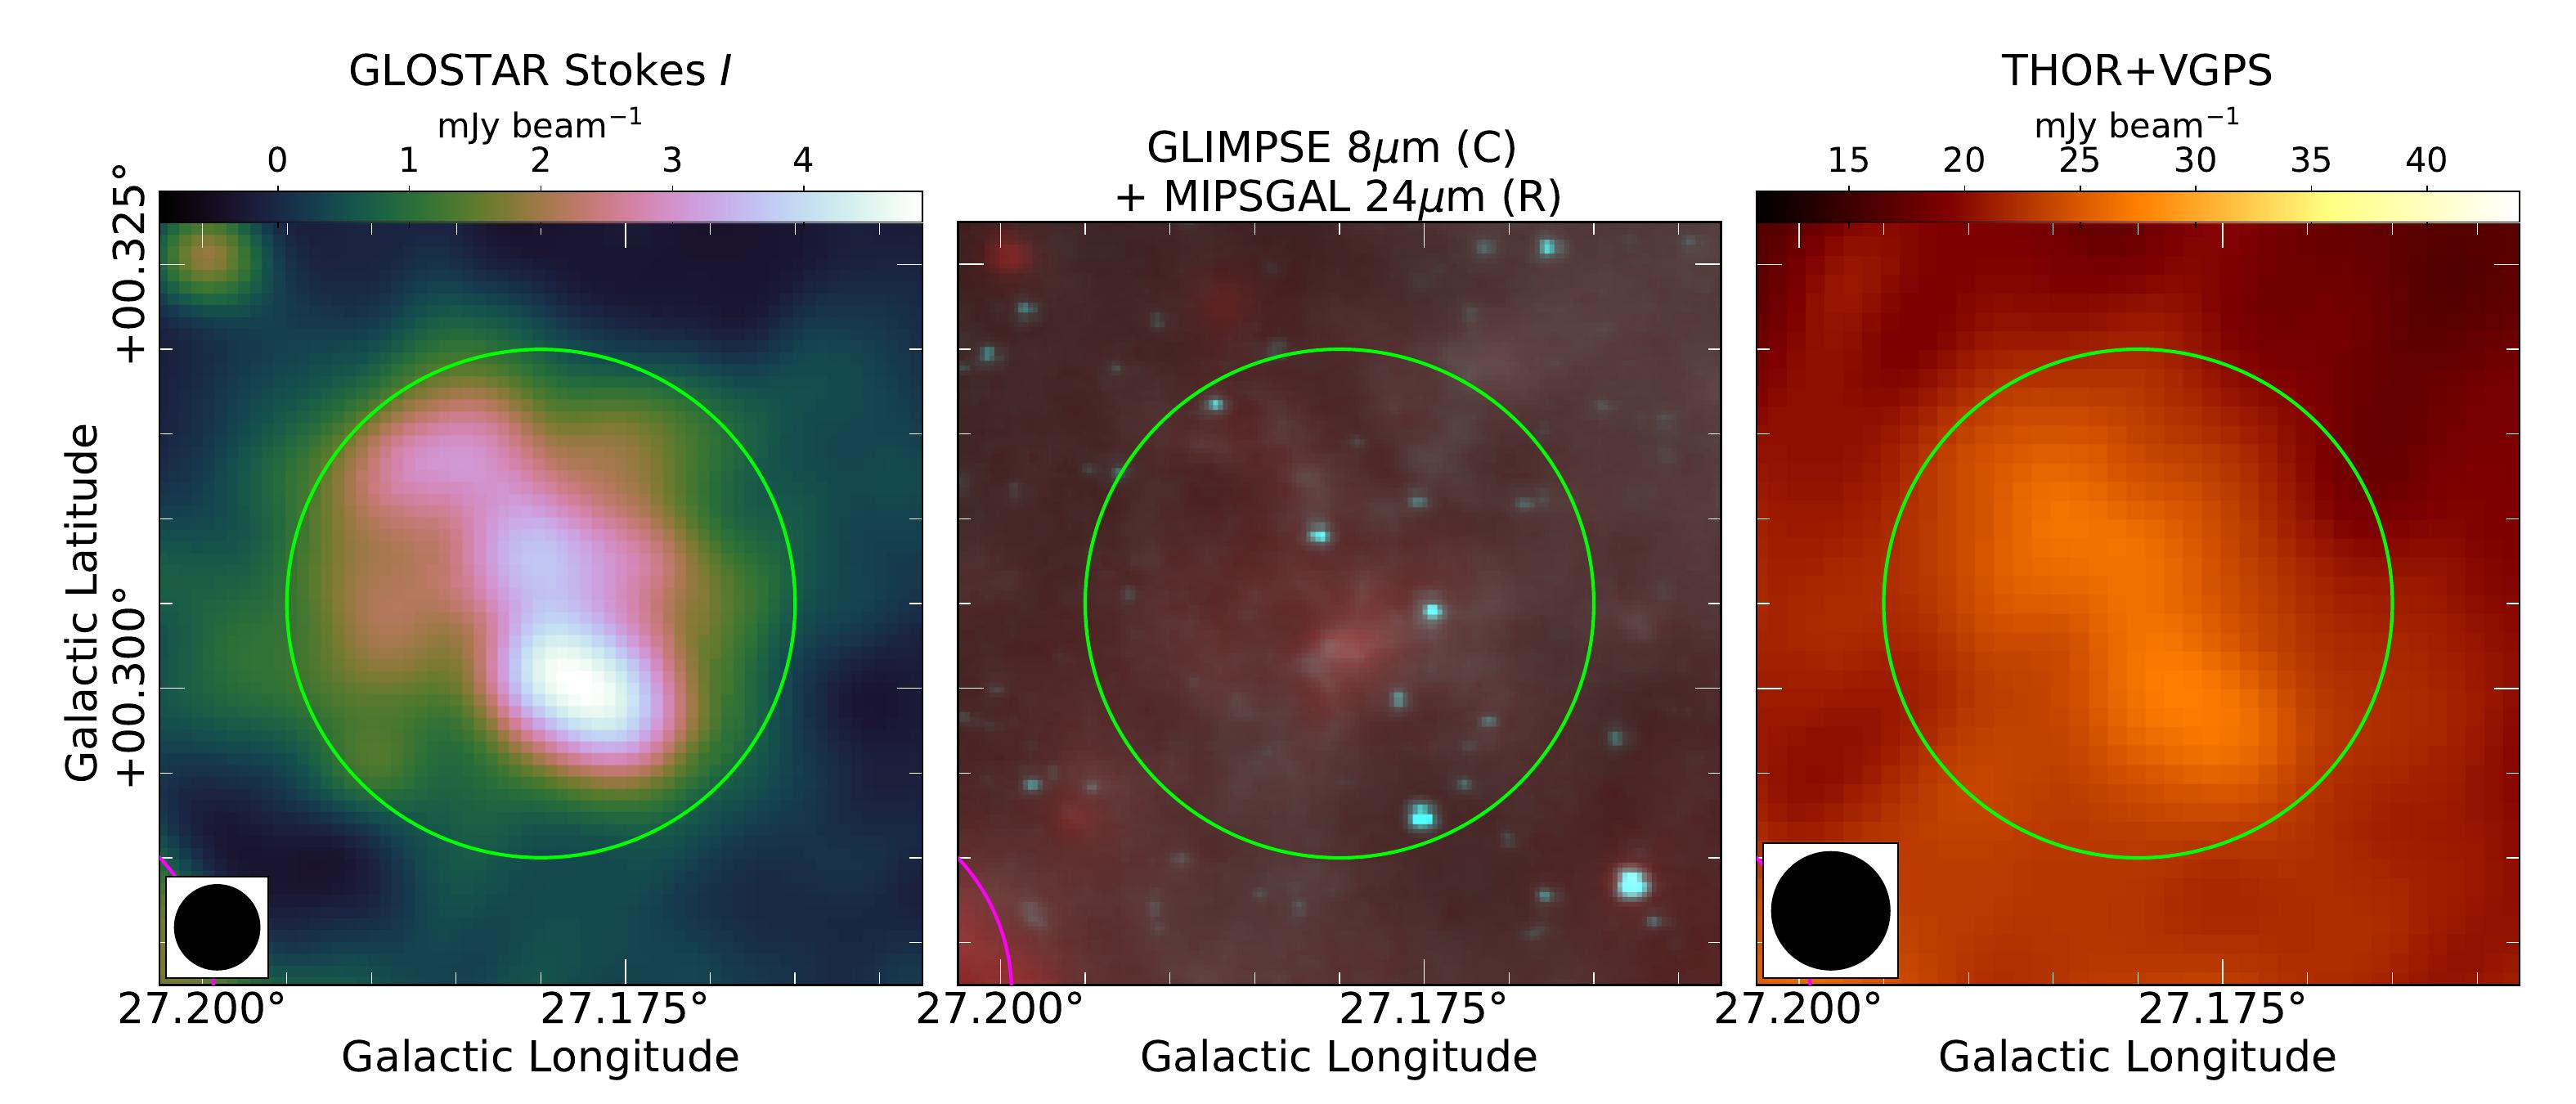
The THOR SNR candidate G27.180.30 is clearly seen in the GLOSTAR-VLA data (Fig. 20). It seems to have faint counterparts in MIPSGAL 24 m and GLIMPSE 8 m images, but this may be just the diffuse MIR background unrelated to the radio emission. Anderson et al. (2017) report a flux density of 0.050.03 Jy in the THOR+VGPS data, similar to the GLOSTAR-VLA data flux density of 0.0480.001 Jy. The object has a size of , and so we take the GLOSTAR-VLA flux density as a lower limit and estimate the lower limit of the spectral index of this candidate:
| (5) | ||||
The lower limit of the spectral index implies that G27.180.30 may be a PWN, although the morphology is atypical.
4.6.5 G53.070.49
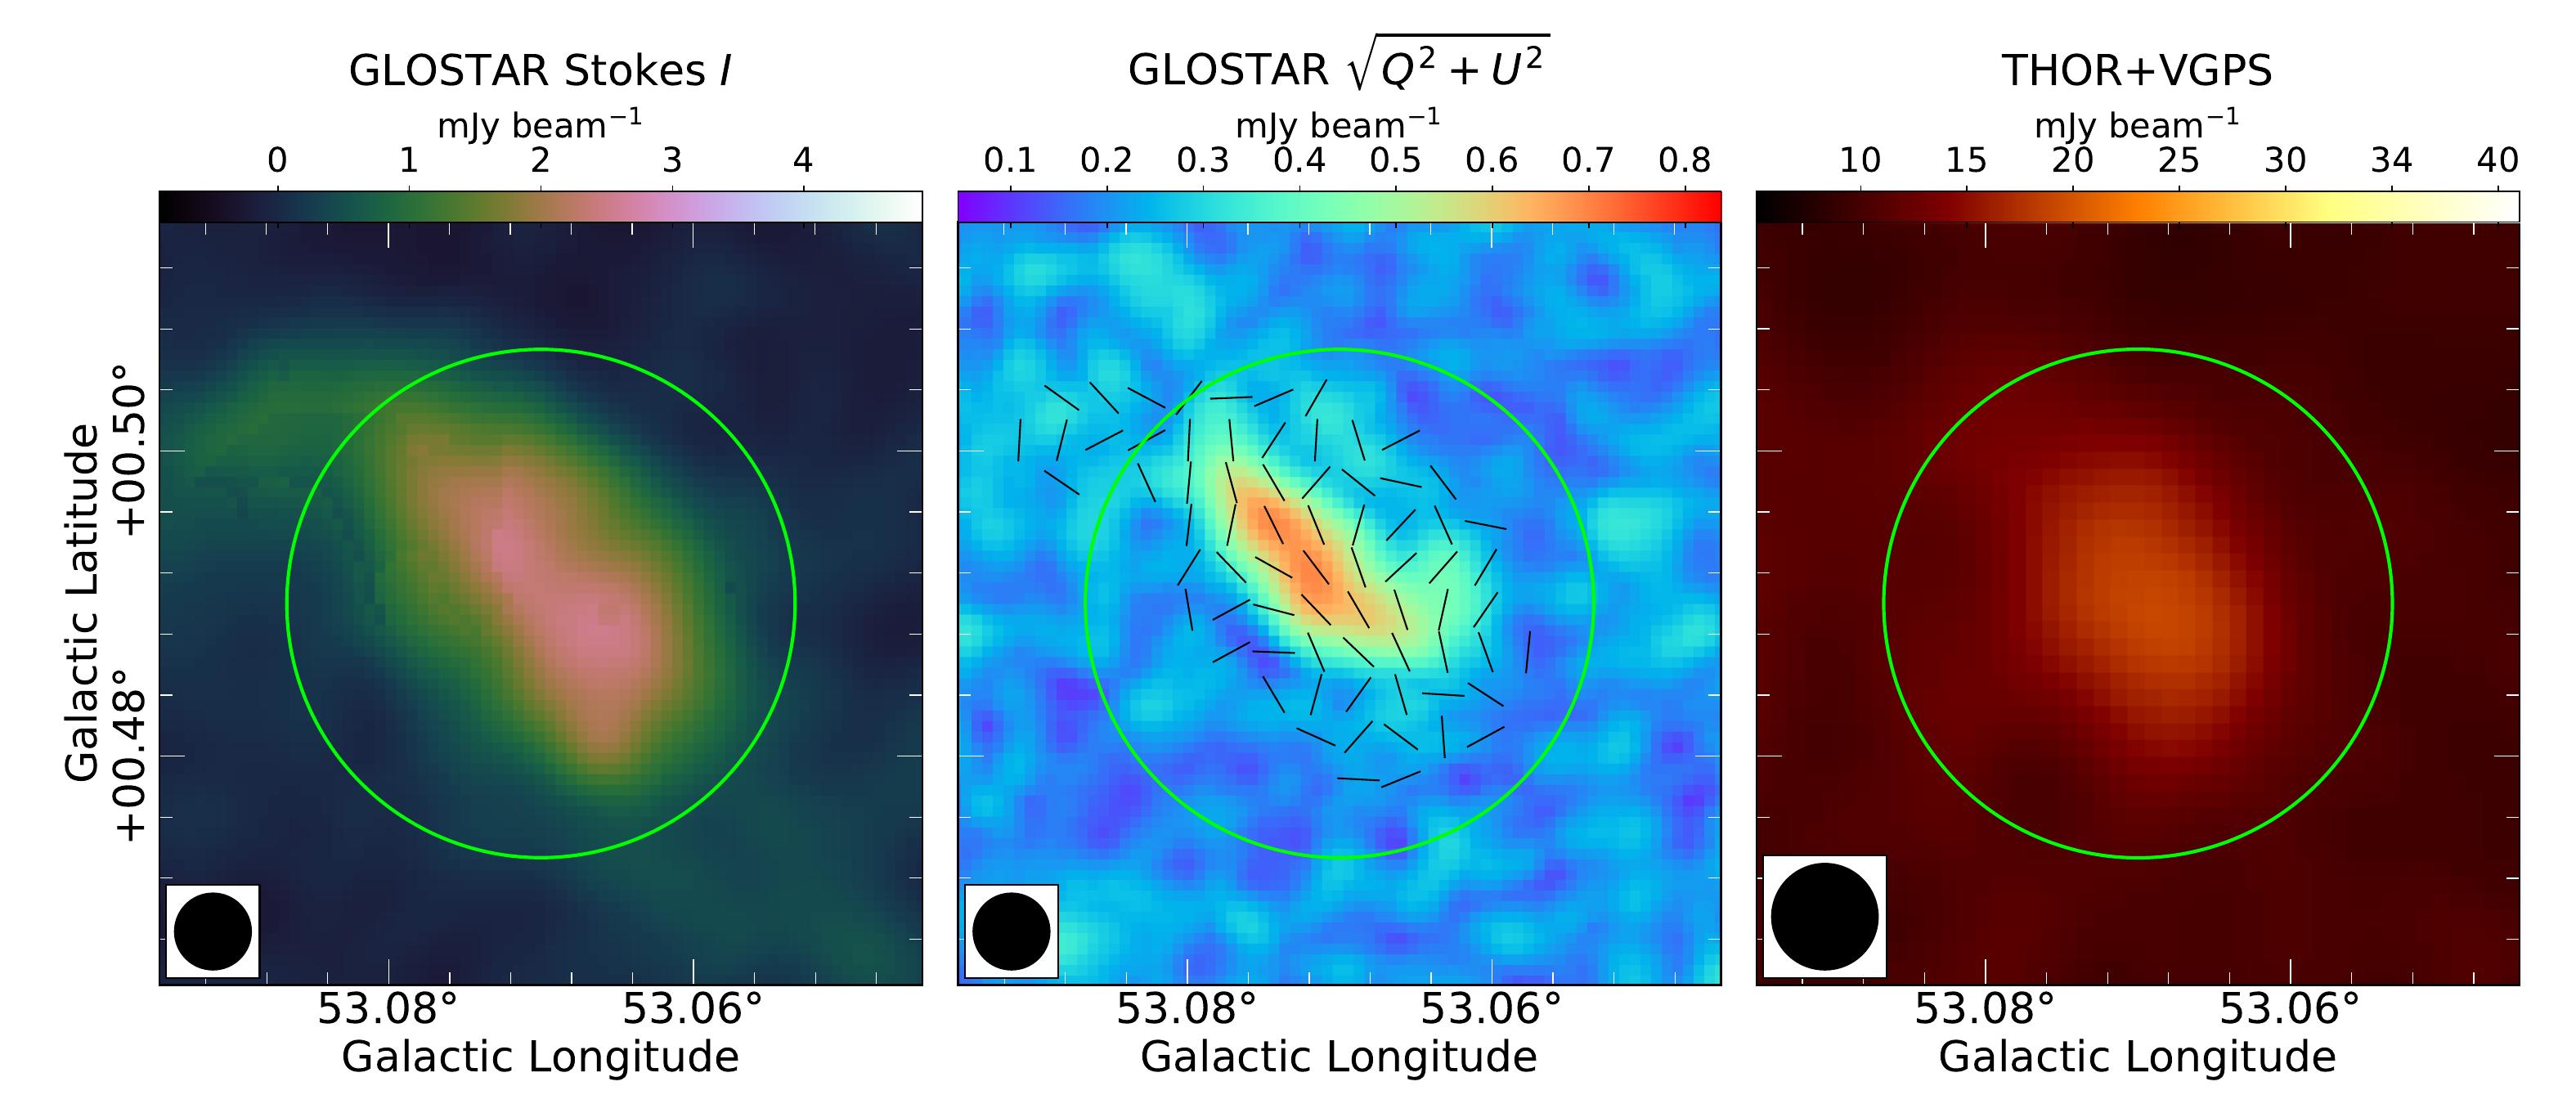
Anderson et al. (2017) identified this object as a SNR candidate in the THOR survey. In the GLOSTAR-VLA data, we find a slightly elongated structure (Fig. 21). The polarization data show that the electric field vectors near the center roughly line up along the long axis of this candidate. It has a degree of polarization of . We note that this small angular size candidate is quite asymmetric. If it were indeed a SNR, it must be quite young or far and/or be expanding into a region of the ISM with a large density gradient. While we find that the emission in the GLOSTAR-VLA data arises from the same position reported by Anderson et al. (2017), Driessen et al. (2018) report that the peaks of flux density in low-frequency data obtained with the Westerbork Synthesis Radio Telescope (WSRT) and the Low Frequency Array (LOFAR) have a large offset ( to ) from the VLA data, but this could be the result of confusion with nearby sources due to the elongated beam at lower frequencies (see Fig. 3 of Driessen et al., 2018). Further observational campaigns at multiple frequencies sensitive to various angular scales are needed to shed light on the nature of this candidate.
4.6.6 Resolved SNR candidates
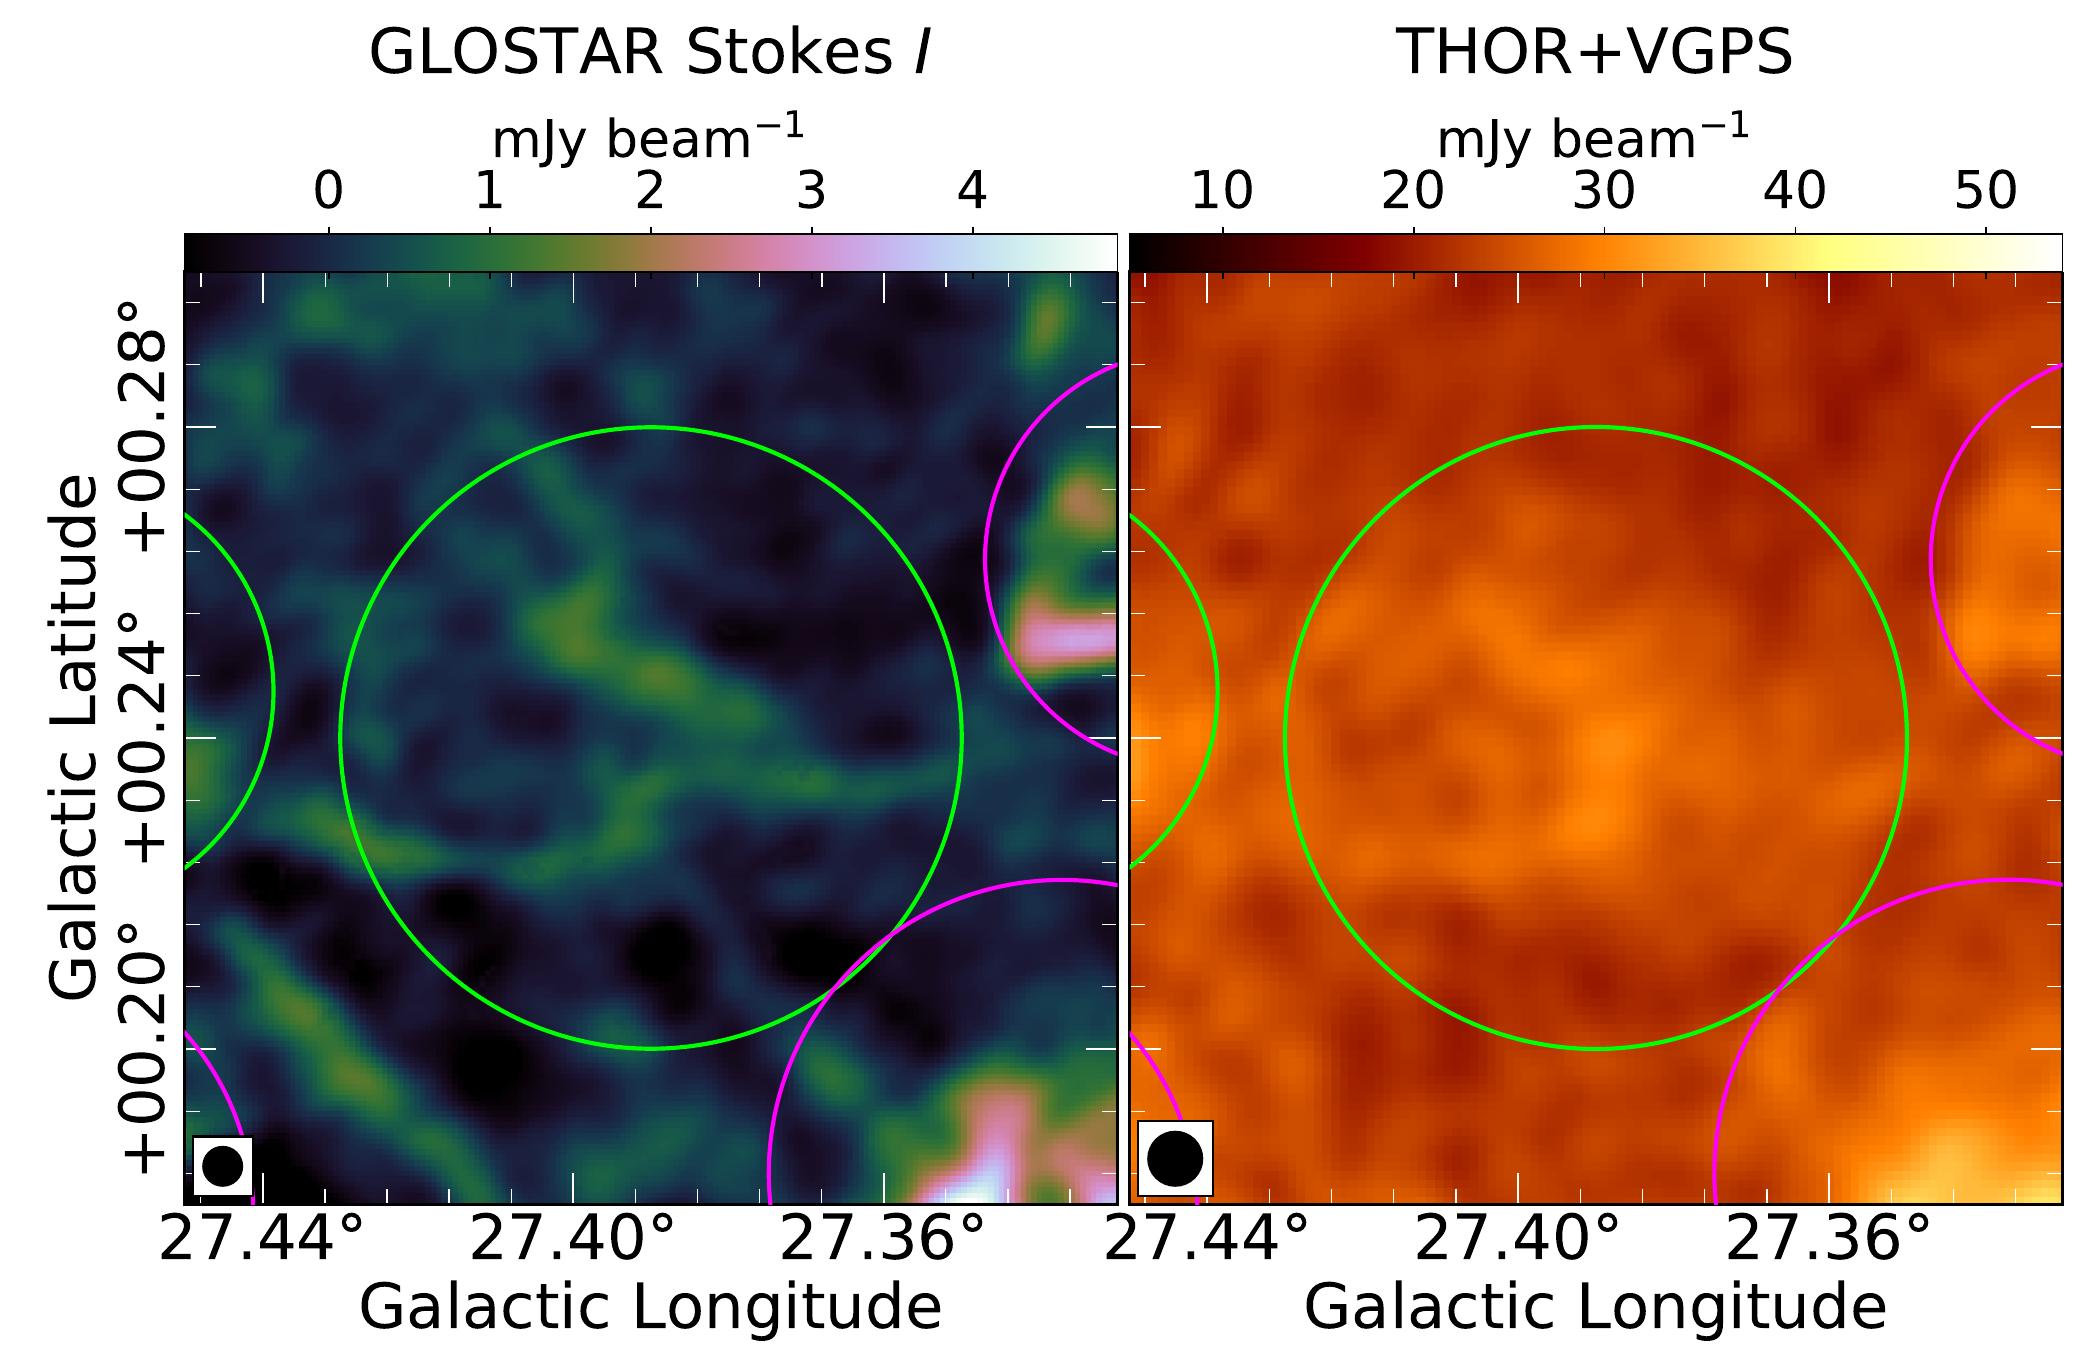
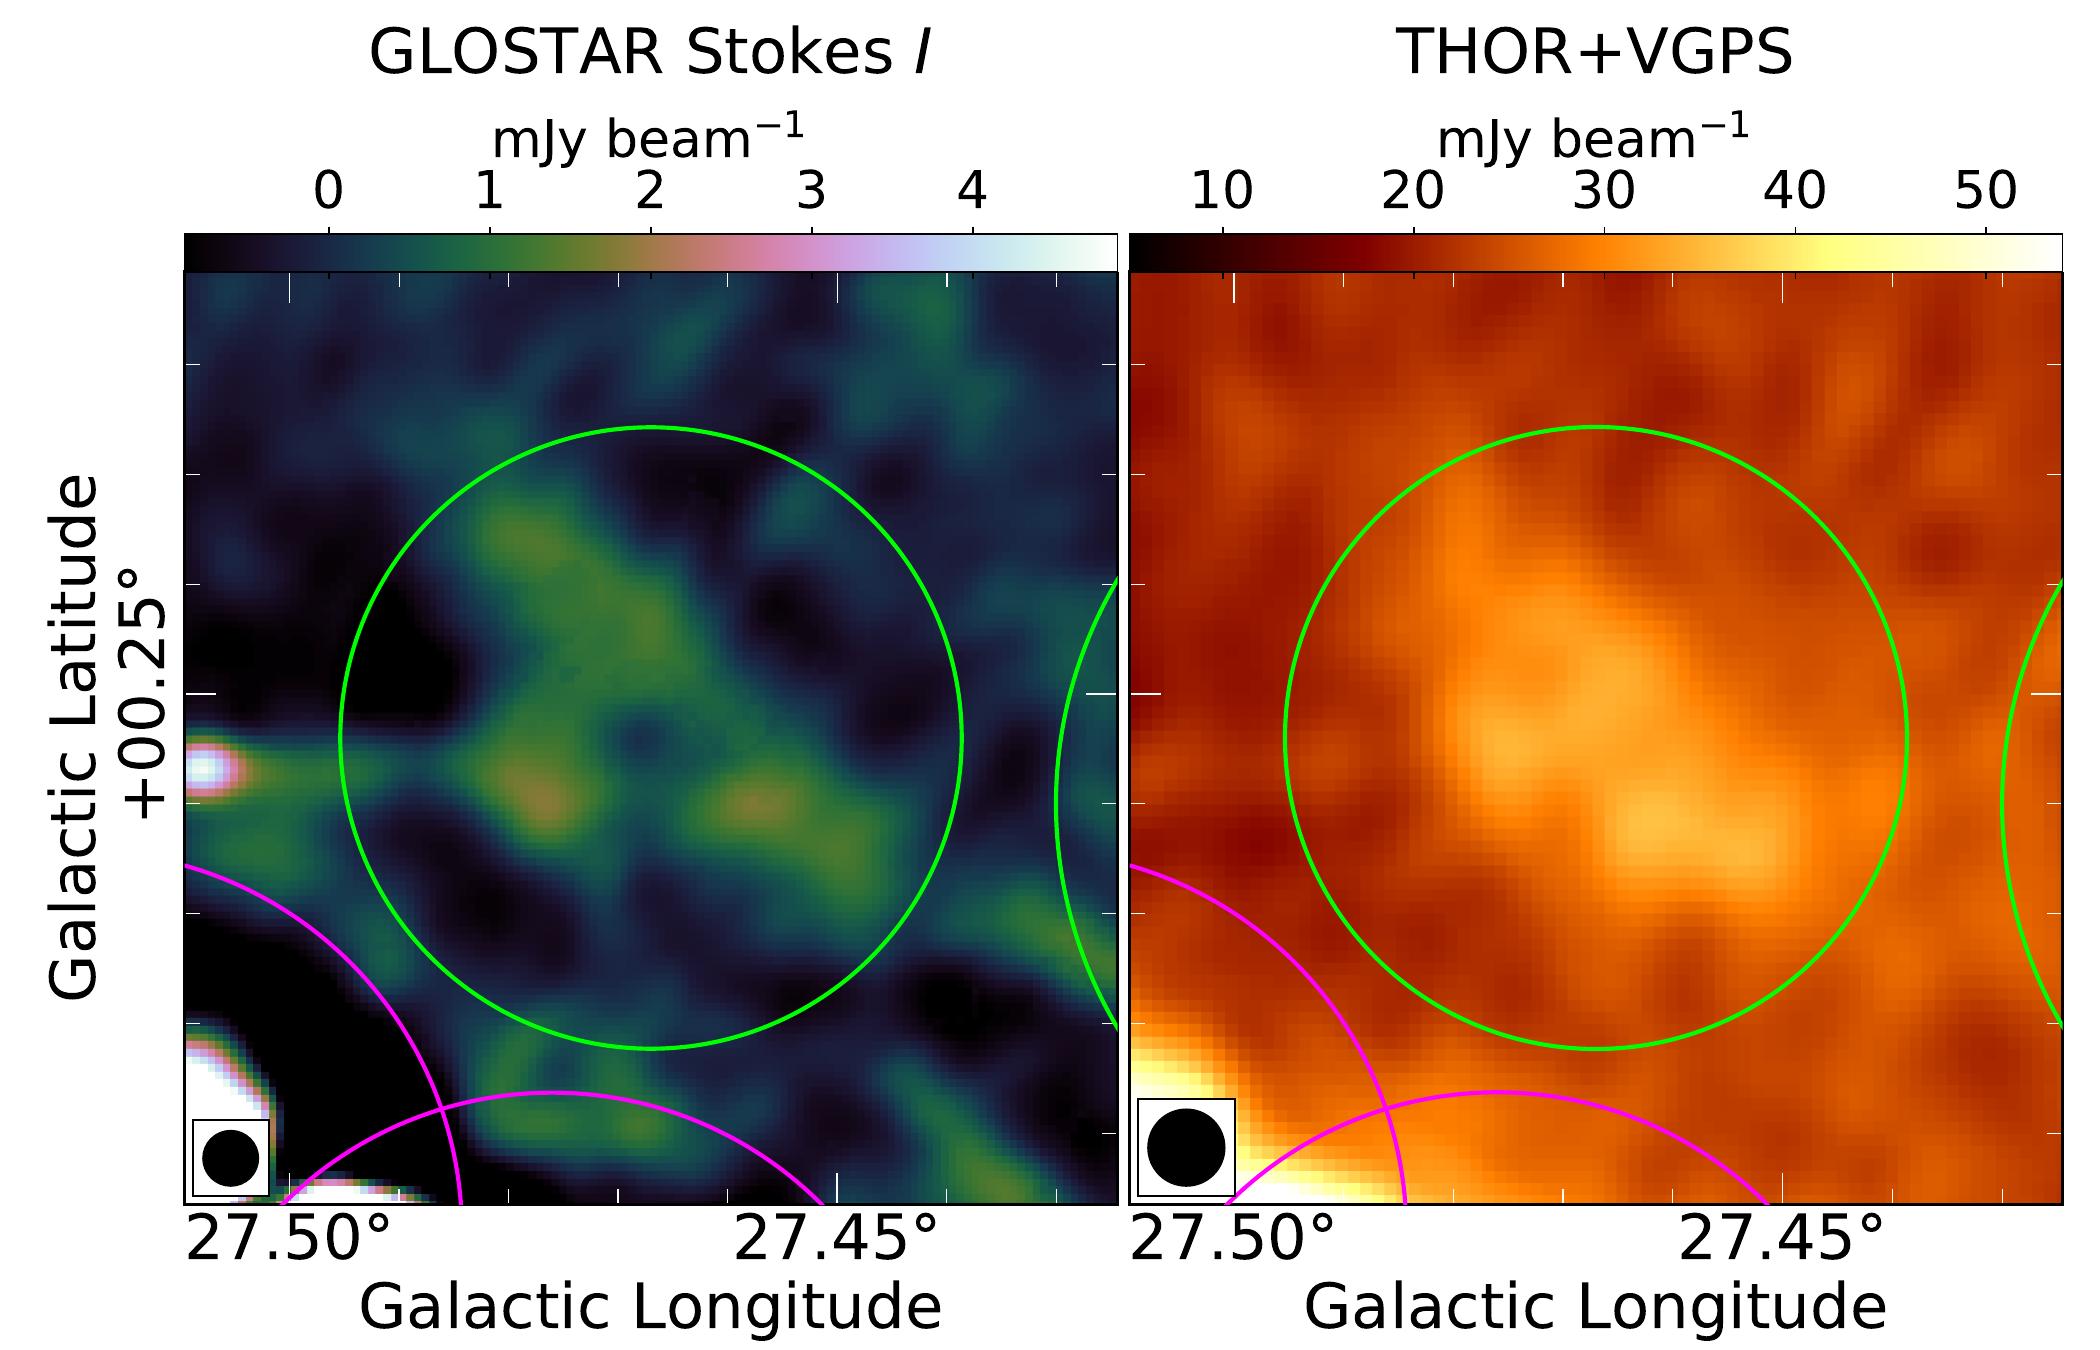
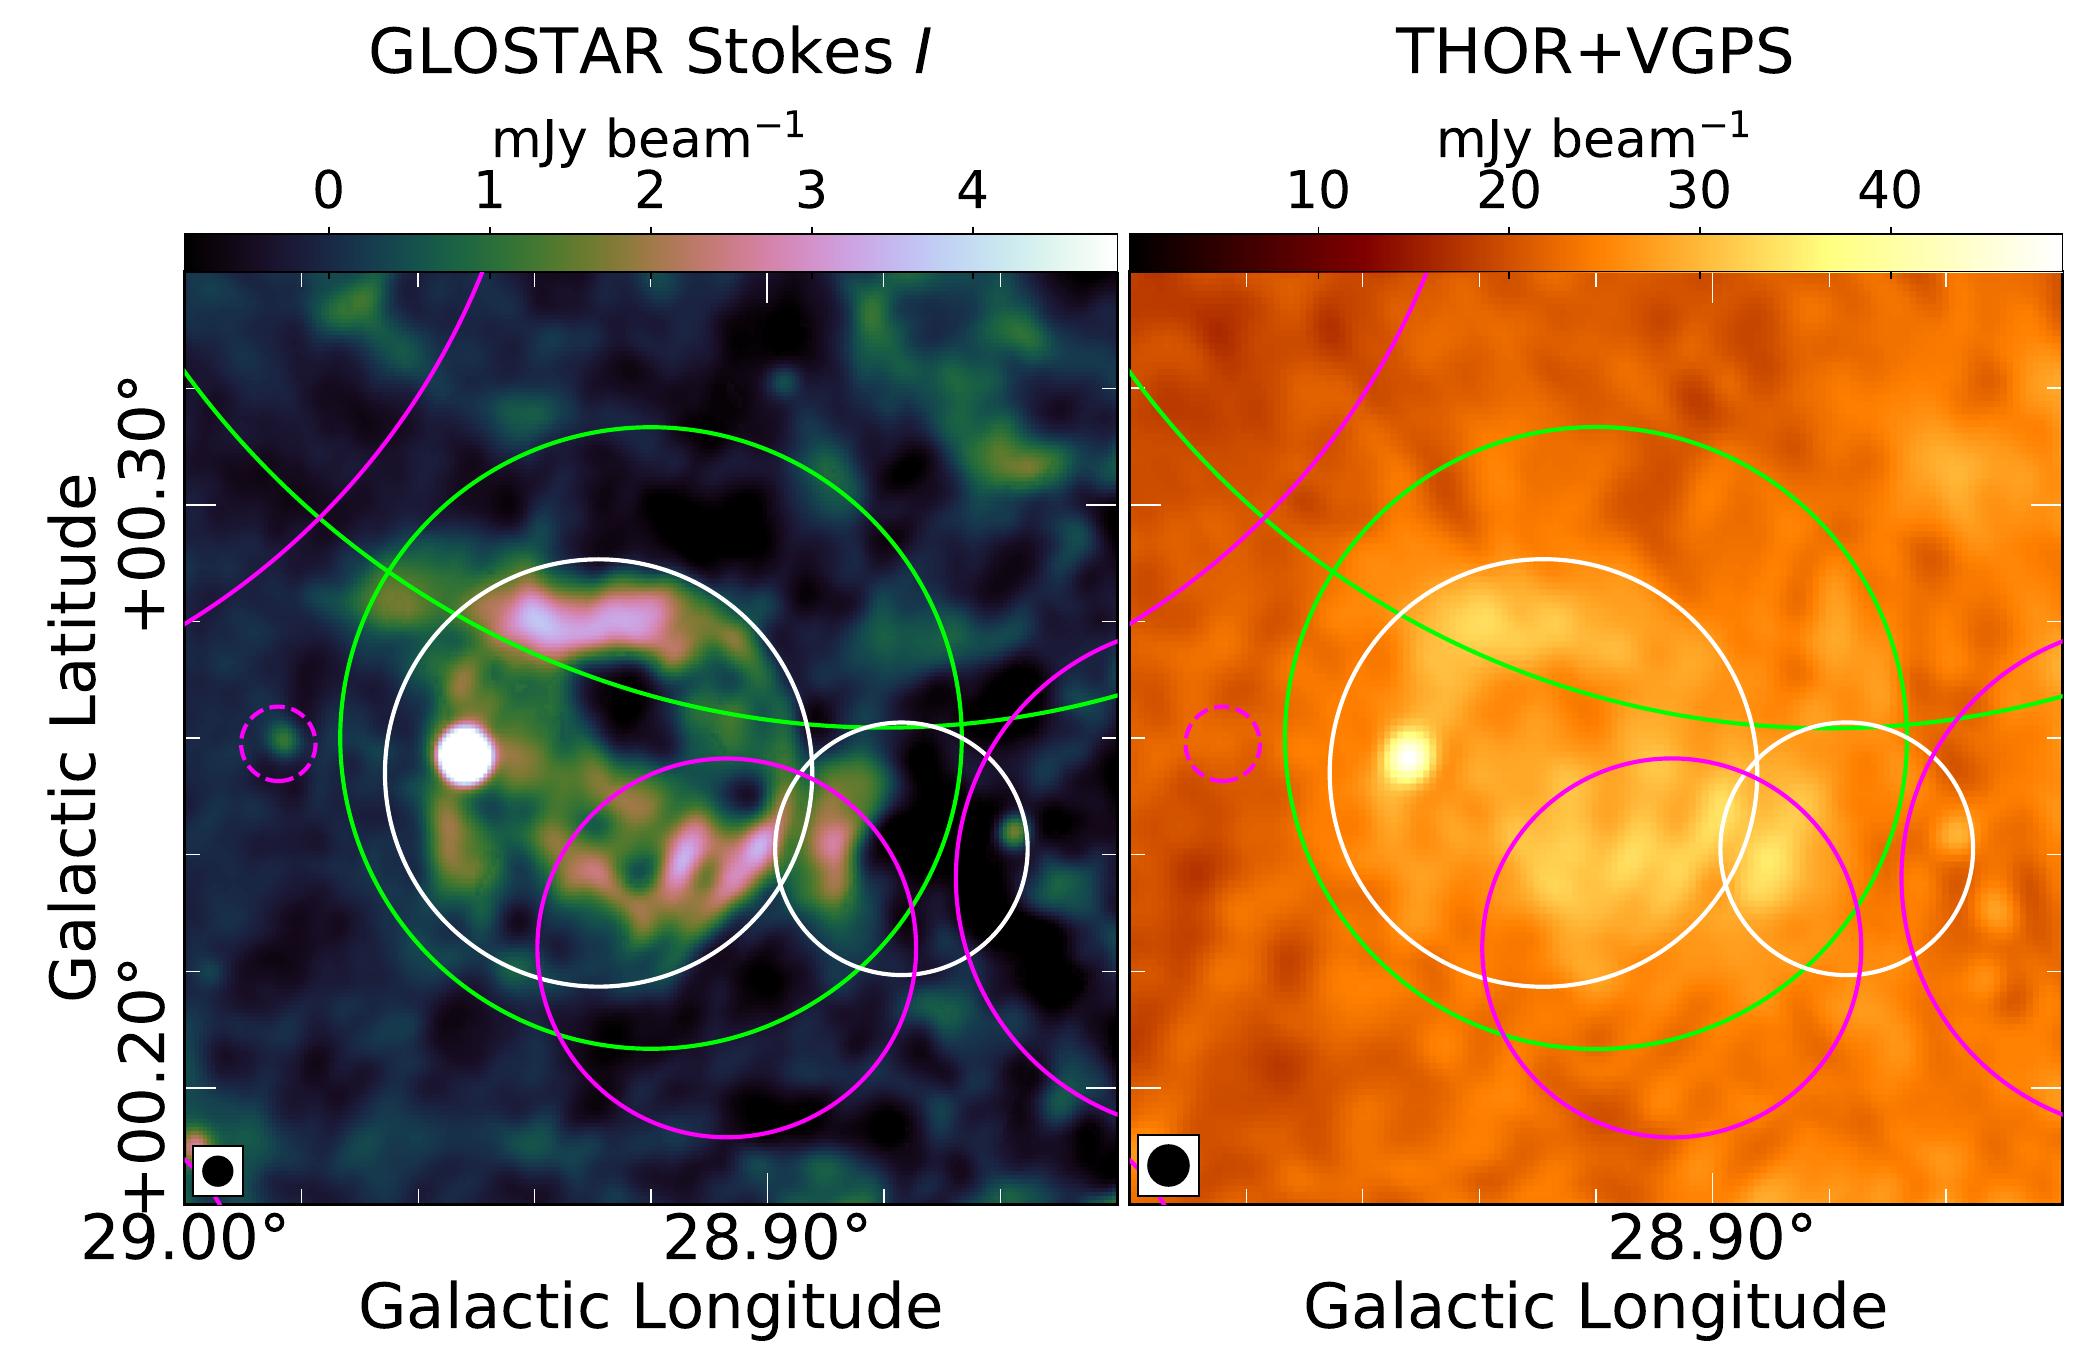
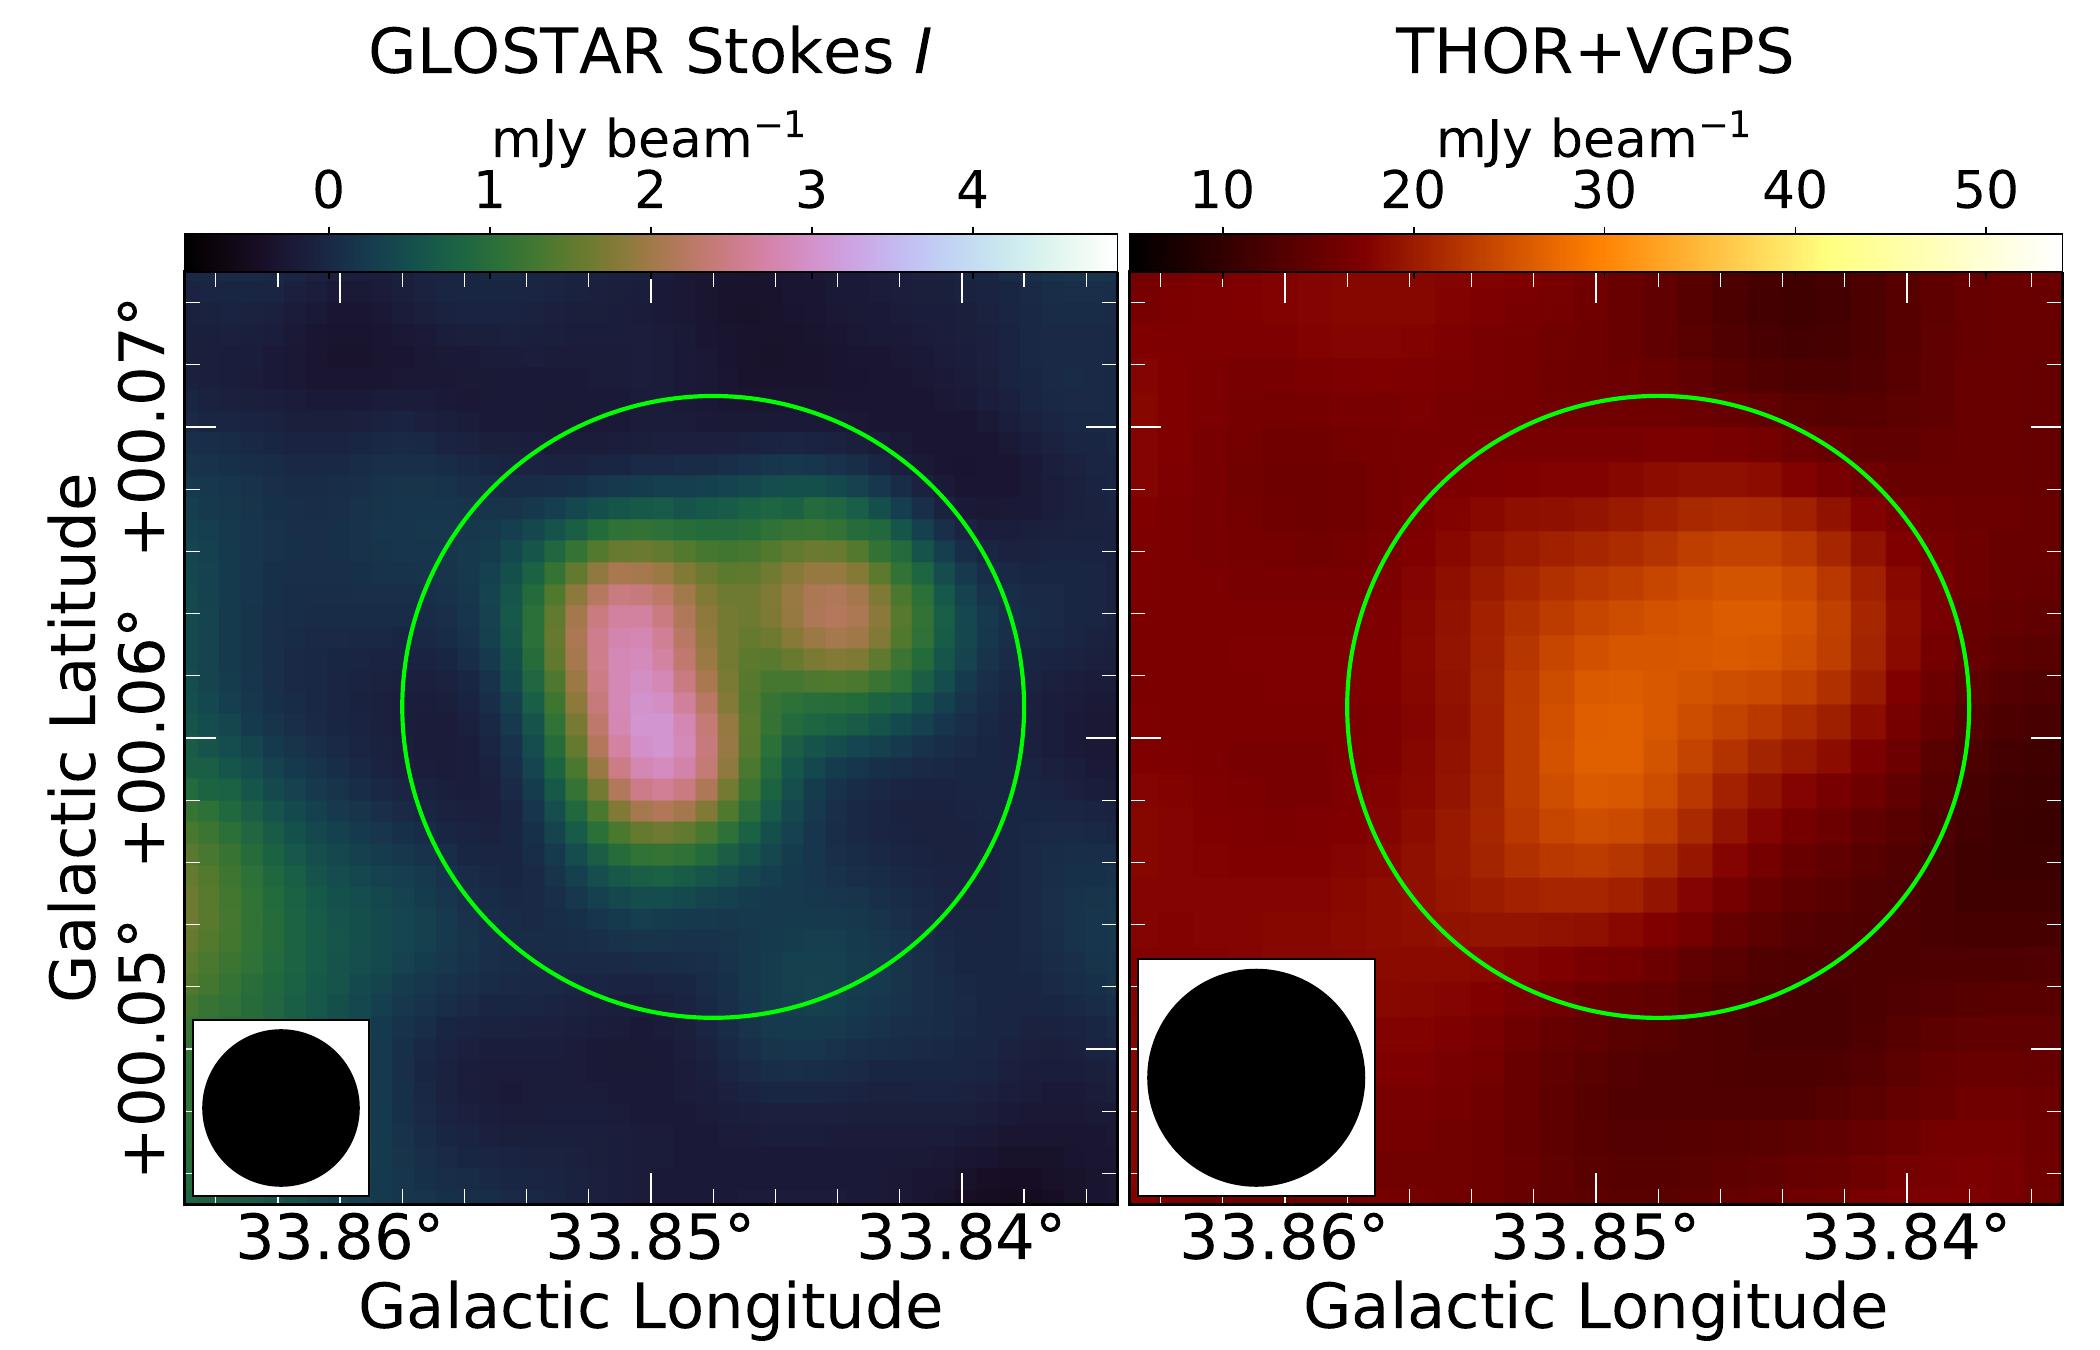
The THOR candidates G27.390.24, G27.470.25, G28.920.26, and G33.850.06 are better resolved in the GLOSTAR-VLA data (Fig. 22). The filamentary structures of G27.390.24 and G27.470.25 that we observe in the GLOSTAR-VLA data suggest that these may be nearby filaments that were unresolved by THOR+VGPS data, rather than SNRs. There seem to be two objects—possibly unrelated—in the extent of G33.850.06. Their sizes are comparable to the beam size; they are more likely to be radio galaxies than SNRs.
In the region of the candidate G28.920.26, we observe a larger shell-shaped object centered at , and to its west, a smaller object that resembles a partial shell (marked with two white circles in Fig. 22). The bright compact object near has a thermal spectral index in the GLOSTAR-VLA data () and was detected in MIPSGAL, implying thermal emission. The other two shell-shaped objects are included in the list of GLOSTAR SNR candidates (G028.8770.241 and G028.9290.254).
5 Conclusions
In the GLOSTAR-VLA data, we discover 80 new SNR candidates using the radio-MIR anti-correlation property of SNRs. In addition, 77 previously identified candidates have also been detected. We show that the degree of polarization measured using the GLOSTAR-VLA data can reliably distinguish thermal and nonthermal emission in many cases, in spite of the diffuse synchrotron emission that permeates the ISM. Following the positive polarization measurements from the GLOSTAR-VLA data and favorable spectral index measurements using data from lower frequency surveys, we are able to confirm six previously identified candidates as SNRs (G26.750.73, G27.060.04, G28.780.44, G29.38+0.10, G51.040.07 and G51.260.11). We were also able to measure significant polarization from three newly discovered GLOSTAR SNR candidates, G005.9890.019, G034.5240.761, and G039.5390.366. Comparing our results with the predictions by Li et al. (1991), we find that over of SNRs in our survey region are yet to be discovered (§4.3.2).
The G19 SNR catalog contains 94 objects in the survey region of GLOSTAR, and we detect all the objects previously identified in radio continuum data, except G0.00.0 and G0.30.0, which lie in a very confused region. We find that four of these objects (G8.30.0, G10.50.0, G11.11.0 and G14.30.1) are actually H ii regions mistaken for SNRs by cross-matching with the A14 catalog of Galactic H ii regions.
The GLOSTAR-VLA data highlight the importance of resolution and sensitivity in large-scale surveys: we were able to detect almost all radio SNRs in the survey due to the remarkable sensitivity, and the higher resolution made it possible to reclassify several objects. The SNR candidates G27.390.24 and G27.470.25 are filaments, and multiple objects were identified in the candidates G18.760.07, G28.920.26, G33.850.06, and in the G19 SNR G6.10.5.
The future addition of single dish data —which are presently collected with the Effelsberg 100 meter radio telescope— to the GLOSTAR-VLA images will make reliable spectral index measurements possible for extended objects. This should prove useful in confirming the SNR candidates. If all the detected candidates were confirmed as SNRs, it would nearly triple the number of SNRs in the first quadrant of the Galaxy, bringing us closer to the predicted number of SNRs in the Milky Way (; Li et al., 1991). Further deeper large-scale surveys covering the entire Galactic plane should be able to rectify the apparent deficiency of SNRs in the Galaxy.
Acknowledgements.
We thank the referee David Helfand for his valuable comments on the draft which helped improve the discussion and presentation of our work. We thank Miguel Araya for pointing out a naming inconsistency. HB acknowledges support from the European Research Council under the Horizon 2020 Framework Program via the ERC Consolidator Grant CSF-648505. HB also acknowledges support from the Deutsche Forschungsgemeinschaft in the Collaborative Research Center (SFB 881) ”The Milky Way System” (subproject B1). NR acknowledges Max-Planck-Gesellschaft for funding support through the Max Planck India Partner Group grant. This research has made use of NASA’s Astrophysics Data System and the SIMBAD database. We have used the softwares Astropy (Astropy Collaboration et al., 2013), APLpy (Robitaille & Bressert, 2012), DS9 (Joye & Mandel, 2003) and Aladin (Bonnarel et al., 2000) at various stages of this research.References
- Adams et al. (2013) Adams, S. M., Kochanek, C. S., Beacom, J. F., Vagins, M. R., & Stanek, K. Z. 2013, ApJ, 778, 164
- Anderson et al. (2014) Anderson, L. D., Bania, T. M., Balser, D. S., et al. 2014, ApJS, 212, 1
- Anderson et al. (2017) Anderson, L. D., Wang, Y., Bihr, S., et al. 2017, A&A, 605, A58
- Araya (2021) Araya, M. 2021, arXiv e-prints, arXiv:2102.08851
- Astropy Collaboration et al. (2013) Astropy Collaboration, Robitaille, T. P., Tollerud, E. J., et al. 2013, A&A, 558, A33
- Bertin & Arnouts (1996) Bertin, E. & Arnouts, S. 1996, A&AS, 117, 393
- Beuther et al. (2016) Beuther, H., Bihr, S., Rugel, M., et al. 2016, A&A, 595, A32
- Bonnarel et al. (2000) Bonnarel, F., Fernique, P., Bienaymé, O., et al. 2000, A&AS, 143, 33
- Brentjens & de Bruyn (2005) Brentjens, M. A. & de Bruyn, A. G. 2005, A&A, 441, 1217
- Brogan et al. (2006) Brogan, C. L., Gelfand, J. D., Gaensler, B. M., Kassim, N. E., & Lazio, T. J. W. 2006, ApJ, 639, L25
- Brose et al. (2020) Brose, R., Pohl, M., Sushch, I., Petruk, O., & Kuzyo, T. 2020, A&A, 634, A59
- Brunthaler et al. (2020) Brunthaler, A., Menten, K. M., Dzib, S. A., et al. 2021, arXiv e-prints, arXiv:2106.00377
- Cappellaro et al. (1993) Cappellaro, E., Turatto, M., Benetti, S., et al. 1993, A&A, 273, 383
- Carey et al. (2009) Carey, S. J., Noriega-Crespo, A., Mizuno, D. R., et al. 2009, PASP, 121, 76
- Castelletti et al. (2017) Castelletti, G., Supan, L., Petriella, A., Giacani, E., & Joshi, B. C. 2017, A&A, 602, A31
- Churchwell et al. (2009) Churchwell, E., Babler, B. L., Meade, M. R., et al. 2009, PASP, 121, 213
- Clark & Caswell (1976) Clark, D. H. & Caswell, J. L. 1976, MNRAS, 174, 267
- Condon et al. (1998) Condon, J. J., Cotton, W. D., Greisen, E. W., et al. 1998, AJ, 115, 1693
- Cotton (2008) Cotton, W. D. 2008, PASP, 120, 439
- Cox et al. (1986) Cox, P., Kruegel, E., & Mezger, P. G. 1986, A&A, 155, 380
- de Gasperin et al. (2018) de Gasperin, F., Intema, H. T., & Frail, D. A. 2018, MNRAS, 474, 5008
- Dokara et al. (2018) Dokara, R., Roy, N., Beuther, H., et al. 2018, ApJ, 866, 61
- Driessen et al. (2018) Driessen, L. N., Domček, V., Vink, J., et al. 2018, ApJ, 860, 133
- Dubner & Giacani (2015) Dubner, G. & Giacani, E. 2015, A&A Rev., 23, 3
- Frail et al. (1994) Frail, D. A., Goss, W. M., & Whiteoak, J. B. Z. 1994, ApJ, 437, 781
- Fürst & Reich (2004) Fürst, E. & Reich, W. 2004, in The Magnetized Interstellar Medium, ed. B. Uyaniker, W. Reich, & R. Wielebinski, 141–146
- Fürst et al. (1987) Fürst, E., Reich, W., & Sofue, Y. 1987, A&AS, 71, 63
- Gaensler et al. (2000) Gaensler, B. M., Dickel, J. R., & Green, A. J. 2000, ApJ, 542, 380
- Gaensler et al. (2001) Gaensler, B. M., Dickey, J. M., McClure-Griffiths, N. M., et al. 2001, ApJ, 549, 959
- Gaensler & Slane (2006) Gaensler, B. M. & Slane, P. O. 2006, ARA&A, 44, 17
- Gao et al. (2019) Gao, X. Y., Reich, P., Hou, L. G., Reich, W., & Han, J. L. 2019, A&A, 623, A105
- Green et al. (2014) Green, A. J., Reeves, S. N., & Murphy, T. 2014, PASA, 31, e042
- Green (2019) Green, D. A. 2019, Journal of Astrophysics and Astronomy, 40, 36
- H. E. S. S. Collaboration et al. (2018) H. E. S. S. Collaboration, Abdalla, H., Abramowski, A., et al. 2018, A&A, 612, A2
- Hales et al. (2012) Hales, C. A., Murphy, T., Curran, J. R., et al. 2012, MNRAS, 425, 979
- Harvey-Smith et al. (2010) Harvey-Smith, L., Gaensler, B. M., Kothes, R., et al. 2010, ApJ, 712, 1157
- Helfand et al. (2006) Helfand, D. J., Becker, R. H., White, R. L., Fallon, A., & Tuttle, S. 2006, AJ, 131, 2525
- Helfand et al. (1989) Helfand, D. J., Velusamy, T., Becker, R. H., & Lockman, F. J. 1989, ApJ, 341, 151
- Hurley-Walker et al. (2019a) Hurley-Walker, N., Filipović, M. D., Gaensler, B. M., et al. 2019a, PASA, 36, e045
- Hurley-Walker et al. (2019b) Hurley-Walker, N., Gaensler, B. M., Leahy, D. A., et al. 2019b, PASA, 36, e048
- Hurley-Walker et al. (2019c) Hurley-Walker, N., Hancock, P. J., Franzen, T. M. O., et al. 2019c, PASA, 36, e047
- Iffrig & Hennebelle (2017) Iffrig, O. & Hennebelle, P. 2017, A&A, 604, A70
- Intema et al. (2017) Intema, H. T., Jagannathan, P., Mooley, K. P., & Frail, D. A. 2017, A&A, 598, A78
- Joye & Mandel (2003) Joye, W. A. & Mandel, E. 2003, Astronomical Society of the Pacific Conference Series, Vol. 295, New Features of SAOImage DS9, ed. H. E. Payne, R. I. Jedrzejewski, & R. N. Hook, 489
- Jun & Norman (1996) Jun, B.-I. & Norman, M. L. 1996, ApJ, 472, 245
- Kim et al. (2013) Kim, H.-J., Koo, B.-C., & Moon, D.-S. 2013, ApJ, 774, 5
- Kothes et al. (2008) Kothes, R., Landecker, T. L., Reich, W., Safi-Harb, S., & Arzoumanian, Z. 2008, ApJ, 687, 516
- Kothes et al. (2017) Kothes, R., Reich, P., Foster, T. J., & Reich, W. 2017, A&A, 597, A116
- Kothes et al. (2020) Kothes, R., Reich, W., Safi-Harb, S., et al. 2020, MNRAS, 496, 723
- Lang et al. (2010) Lang, C. C., Wang, Q. D., Lu, F., & Clubb, K. I. 2010, ApJ, 709, 1125
- Lee et al. (2012) Lee, J.-W., Koo, B.-C., & Lee, J.-E. 2012, Journal of Korean Astronomical Society, 45, 117
- Li et al. (1991) Li, Z., Wheeler, J. C., Bash, F. N., & Jefferys, W. H. 1991, ApJ, 378, 93
- Liszt (2009) Liszt, H. S. 2009, A&A, 508, 1331
- Lockman (1989) Lockman, F. J. 1989, ApJS, 71, 469
- Lockman et al. (1996) Lockman, F. J., Pisano, D. J., & Howard, G. J. 1996, ApJ, 472, 173
- Medina et al. (2019) Medina, S. N. X., Urquhart, J. S., Dzib, S. A., et al. 2019, A&A, 627, A175
- Mertsch & Sarkar (2013) Mertsch, P. & Sarkar, S. 2013, J. Cosmology Astropart. Phys., 2013, 041
- Milne (1987) Milne, D. K. 1987, Australian Journal of Physics, 40, 771
- Milne & Dickel (1974a) Milne, D. K. & Dickel, J. R. 1974a, Australian Journal of Physics, 27, 549
- Milne & Dickel (1974b) Milne, D. K. & Dickel, J. R. 1974b, in Galactic Radio Astronomy, ed. F. J. Kerr & S. C. Simonson, Vol. 60, 335
- Petriella (2019) Petriella, A. 2019, A&A, 626, A65
- Pinheiro Gonçalves et al. (2011) Pinheiro Gonçalves, D., Noriega-Crespo, A., Paladini, R., Martin, P. G., & Carey, S. J. 2011, AJ, 142, 47
- Ranasinghe & Leahy (2018) Ranasinghe, S. & Leahy, D. A. 2018, AJ, 155, 204
- Robitaille & Bressert (2012) Robitaille, T. & Bressert, E. 2012, APLpy: Astronomical Plotting Library in Python
- Simmons & Stewart (1985) Simmons, J. F. L. & Stewart, B. G. 1985, A&A, 142, 100
- Stupar & Parker (2011) Stupar, M. & Parker, Q. A. 2011, MNRAS, 414, 2282
- Sun et al. (2007) Sun, X. H., Han, J. L., Reich, W., et al. 2007, A&A, 463, 993
- Sun et al. (2011) Sun, X. H., Reich, P., Reich, W., et al. 2011, A&A, 536, A83
- Supan et al. (2018) Supan, L., Castelletti, G., Peters, W. M., & Kassim, N. E. 2018, A&A, 616, A98
- Tammann et al. (1994) Tammann, G. A., Loeffler, W., & Schroeder, A. 1994, ApJS, 92, 487
- Ueno et al. (2006) Ueno, M., Yamauchi, S., Bamba, A., et al. 2006, in IAU Symposium, Vol. 230, Populations of High Energy Sources in Galaxies, ed. E. J. A. Meurs & G. Fabbiano, 333–337
- Wardle & Kronberg (1974) Wardle, J. F. C. & Kronberg, P. P. 1974, ApJ, 194, 249
- Whiteoak & Green (1996) Whiteoak, J. B. Z. & Green, A. J. 1996, A&AS, 118, 329
- Wilson et al. (2013) Wilson, T. L., Rohlfs, K., & Hüttemeister, S. 2013, Tools of Radio Astronomy
- Yamauchi et al. (2016) Yamauchi, S., Sumita, M., & Bamba, A. 2016, PASJ, 68, S6
Appendix A GLOSTAR-VLA and GLIMPSE images of newly identified SNR candidates
The images of newly identified SNR candidates from the GLOSTAR-VLA data are shown here. The marking scheme is the same as in the text: red circles mark G19 SNRs, solid and dashed magenta circles mark confirmed and candidate H ii regions from A14 catalog, green circles mark previously identified SNR candidates, and white circles mark new GLOSTAR SNR candidates. The beam of GLOSTAR-VLA data is shown in the bottom left corner in black.
![[Uncaptioned image]](/html/2103.06267/assets/figs/cands/G001949-0100.jpg)
![[Uncaptioned image]](/html/2103.06267/assets/figs/cands/G001975-0460.jpg)
![[Uncaptioned image]](/html/2103.06267/assets/figs/cands/G002228+0058.jpg)
![[Uncaptioned image]](/html/2103.06267/assets/figs/cands/G002276+0399.jpg)
![[Uncaptioned image]](/html/2103.06267/assets/figs/cands/G002910-0183.jpg)
![[Uncaptioned image]](/html/2103.06267/assets/figs/cands/G003101-0093.jpg)
![[Uncaptioned image]](/html/2103.06267/assets/figs/cands/G003103+0110.jpg)
![[Uncaptioned image]](/html/2103.06267/assets/figs/cands/G004493-0391.jpg)
![[Uncaptioned image]](/html/2103.06267/assets/figs/cands/G004571-0244.jpg)
![[Uncaptioned image]](/html/2103.06267/assets/figs/cands/G005106+0332.jpg)
![[Uncaptioned image]](/html/2103.06267/assets/figs/cands/G005161-0321.jpg)
![[Uncaptioned image]](/html/2103.06267/assets/figs/cands/G005364-0705.jpg)
![[Uncaptioned image]](/html/2103.06267/assets/figs/cands/G005378-0280.jpg)
![[Uncaptioned image]](/html/2103.06267/assets/figs/cands/G005378+0347.jpg)
![[Uncaptioned image]](/html/2103.06267/assets/figs/cands/G005673-0118.jpg)
![[Uncaptioned image]](/html/2103.06267/assets/figs/cands/G005762+0515.jpg)
![[Uncaptioned image]](/html/2103.06267/assets/figs/cands/G005989+0019.jpg)
![[Uncaptioned image]](/html/2103.06267/assets/figs/cands/G006055+0499.jpg)
![[Uncaptioned image]](/html/2103.06267/assets/figs/cands/G006118+0387.jpg)
![[Uncaptioned image]](/html/2103.06267/assets/figs/cands/G008040+0566.jpg)
![[Uncaptioned image]](/html/2103.06267/assets/figs/cands/G013500+0074.jpg)
![[Uncaptioned image]](/html/2103.06267/assets/figs/cands/G013549+0352.jpg)
![[Uncaptioned image]](/html/2103.06267/assets/figs/cands/G013626+0299.jpg)
![[Uncaptioned image]](/html/2103.06267/assets/figs/cands/G013652+0259.jpg)
![[Uncaptioned image]](/html/2103.06267/assets/figs/cands/G013658-0241.jpg)
![[Uncaptioned image]](/html/2103.06267/assets/figs/cands/G014524+0140.jpg)
![[Uncaptioned image]](/html/2103.06267/assets/figs/cands/G015862+0522.jpg)
![[Uncaptioned image]](/html/2103.06267/assets/figs/cands/G016021+0746.jpg)
![[Uncaptioned image]](/html/2103.06267/assets/figs/cands/G016126+0690.jpg)
![[Uncaptioned image]](/html/2103.06267/assets/figs/cands/G016956-0933.jpg)
![[Uncaptioned image]](/html/2103.06267/assets/figs/cands/G017434+0273.jpg)
![[Uncaptioned image]](/html/2103.06267/assets/figs/cands/G017593+0237.jpg)
![[Uncaptioned image]](/html/2103.06267/assets/figs/cands/G017620+0086.jpg)
![[Uncaptioned image]](/html/2103.06267/assets/figs/cands/G018393-0816.jpg)
![[Uncaptioned image]](/html/2103.06267/assets/figs/cands/G019481-0108.jpg)
![[Uncaptioned image]](/html/2103.06267/assets/figs/cands/G019751+0202.jpg)
![[Uncaptioned image]](/html/2103.06267/assets/figs/cands/G020195+0028.jpg)
![[Uncaptioned image]](/html/2103.06267/assets/figs/cands/G021492-0010.jpg)
![[Uncaptioned image]](/html/2103.06267/assets/figs/cands/G021596-0179.jpg)
![[Uncaptioned image]](/html/2103.06267/assets/figs/cands/G021684+0129.jpg)
![[Uncaptioned image]](/html/2103.06267/assets/figs/cands/G021861+0169.jpg)
![[Uncaptioned image]](/html/2103.06267/assets/figs/cands/G022045-0028.jpg)
![[Uncaptioned image]](/html/2103.06267/assets/figs/cands/G022177+0314.jpg)
![[Uncaptioned image]](/html/2103.06267/assets/figs/cands/G022951-0311.jpg)
![[Uncaptioned image]](/html/2103.06267/assets/figs/cands/G023973+0510.jpg)
![[Uncaptioned image]](/html/2103.06267/assets/figs/cands/G024062-0808.jpg)
![[Uncaptioned image]](/html/2103.06267/assets/figs/cands/G024193+0284.jpg)
![[Uncaptioned image]](/html/2103.06267/assets/figs/cands/G028524+0268.jpg)
![[Uncaptioned image]](/html/2103.06267/assets/figs/cands/G028870+0616.jpg)
![[Uncaptioned image]](/html/2103.06267/assets/figs/cands/G028877+0241.jpg)
![[Uncaptioned image]](/html/2103.06267/assets/figs/cands/G028929+0254.jpg)
![[Uncaptioned image]](/html/2103.06267/assets/figs/cands/G029329+0280.jpg)
![[Uncaptioned image]](/html/2103.06267/assets/figs/cands/G030303+0128.jpg)
![[Uncaptioned image]](/html/2103.06267/assets/figs/cands/G030362+0623.jpg)
![[Uncaptioned image]](/html/2103.06267/assets/figs/cands/G030375+0424.jpg)
![[Uncaptioned image]](/html/2103.06267/assets/figs/cands/G030508+0574.jpg)
![[Uncaptioned image]](/html/2103.06267/assets/figs/cands/G031256-0041.jpg)
![[Uncaptioned image]](/html/2103.06267/assets/figs/cands/G032458-0112.jpg)
![[Uncaptioned image]](/html/2103.06267/assets/figs/cands/G034524-0761.jpg)
![[Uncaptioned image]](/html/2103.06267/assets/figs/cands/G034619+0240.jpg)
![[Uncaptioned image]](/html/2103.06267/assets/figs/cands/G035129-0343.jpg)
![[Uncaptioned image]](/html/2103.06267/assets/figs/cands/G036839-0433.jpg)
![[Uncaptioned image]](/html/2103.06267/assets/figs/cands/G036851-0246.jpg)
![[Uncaptioned image]](/html/2103.06267/assets/figs/cands/G037337+0422.jpg)
![[Uncaptioned image]](/html/2103.06267/assets/figs/cands/G037506+0777.jpg)
![[Uncaptioned image]](/html/2103.06267/assets/figs/cands/G037672-0501.jpg)
![[Uncaptioned image]](/html/2103.06267/assets/figs/cands/G039203+0811.jpg)
![[Uncaptioned image]](/html/2103.06267/assets/figs/cands/G039539+0366.jpg)
![[Uncaptioned image]](/html/2103.06267/assets/figs/cands/G041510-0534.jpg)
![[Uncaptioned image]](/html/2103.06267/assets/figs/cands/G041625+0261.jpg)
![[Uncaptioned image]](/html/2103.06267/assets/figs/cands/G042711-0272.jpg)
![[Uncaptioned image]](/html/2103.06267/assets/figs/cands/G043023+0726.jpg)
![[Uncaptioned image]](/html/2103.06267/assets/figs/cands/G043070+0558.jpg)
![[Uncaptioned image]](/html/2103.06267/assets/figs/cands/G044076+0127.jpg)
![[Uncaptioned image]](/html/2103.06267/assets/figs/cands/G047741-0971.jpg)
![[Uncaptioned image]](/html/2103.06267/assets/figs/cands/G048875+0174.jpg)
![[Uncaptioned image]](/html/2103.06267/assets/figs/cands/G051061+0563.jpg)
![[Uncaptioned image]](/html/2103.06267/assets/figs/cands/G059834-0405.jpg)
![[Uncaptioned image]](/html/2103.06267/assets/figs/cands/G358711-0380.jpg)
![[Uncaptioned image]](/html/2103.06267/assets/figs/cands/G359172+0264.jpg)
| Name | GLonga𝑎aa𝑎aTypical uncertainties in the coordinates of the positions are . | GLata𝑎aa𝑎aTypical uncertainties in the coordinates of the positions are . | Radius | Typeb𝑏bb𝑏bS—shell, C—composite, F—filled, ?—uncertain (taken from Green 2019). | Remarks | |||
|---|---|---|---|---|---|---|---|---|
| () | () | () | (Jy) | (Jy) | ||||
| G0.00.0 | S | Not detected | - | - | - | |||
| G0.30.0 | S | Not detected | - | - | - | |||
| G0.90.1 | C | 2.320 0.019 | 0.0525 0.0243 | 0.023 0.010 | ||||
| G1.00.1 | S | - | - | - | ||||
| G1.40.1 | S | 0.093 0.010 | 0.0092 0.0049 | 0.099 0.054 | ||||
| G1.90.3 | S | 0.316 0.001 | 0.0165 0.0029 | 0.052 0.009 | ||||
| G3.70.2 | S | 0.120 0.013 | 0.0229 0.0045 | 0.192 0.043 | ||||
| G3.80.3 | S? | 0.066 0.012 | 0.0005 0.0001 | 0.007 0.002 | ||||
| G5.50.3 | S | - | - | - | ||||
| G6.10.5 | S | Multiple objects131313GLOSTAR SNR candidates G006.0550.499, G006.1180.387 | 0.112 0.011 | 0.0175 0.0064 | 0.156 0.059 | |||
| G6.40.1 | C | - | - | - | ||||
| G6.50.4 | S | - | - | - | ||||
| G7.00.1 | S | - | - | - | ||||
| G7.20.2 | S | 0.128 0.011 | 0.0010 | 0.008 | ||||
| G8.30.0 | S | H II region | 0.449 0.005 | 0.0105 0.0039 | 0.023 0.009 | |||
| G8.70.1 | S? | - | - | - | ||||
| G8.90.4 | S | 0.051 0.018 | 0.0075 0.0028 | 0.145 0.075 | ||||
| G9.70.0 | S | 0.164 0.008 | 0.0108 0.0017 | 0.065 0.011 | ||||
| G9.80.6 | S | 0.323 0.008 | 0.0028 0.0009 | 0.009 0.003 | ||||
| G9.90.8 | S | - | - | - | ||||
| G10.50.0 | S | H II region | 0.185 0.007 | 0.0008 | 0.004 | |||
| G11.00.0 | S | 0.318 0.011 | - | - | ||||
| G11.11.0 | S | H II region | - | - | - | |||
| G11.10.7 | S | 0.783 0.007 | 0.0129 0.0055 | 0.016 0.007 | ||||
| G11.10.1 | S | 0.018 0.015 | 0.0006 | 0.033 | ||||
| G11.20.3 | C | 1.942 0.005 | 0.1943 0.0873 | 0.100 0.045 | ||||
| G11.40.1 | S? | 0.762 0.009 | 0.0863 0.0454 | 0.113 0.060 | ||||
| G11.80.2 | S | - | - | - | ||||
| G12.00.1 | ? | 0.150 0.009 | - | - | ||||
| G12.20.3 | S | 0.096 0.003 | 0.0045 0.0007 | 0.046 0.008 | ||||
| G12.50.2 | C? | 0.024 0.005 | 0.0004 | 0.016 | ||||
| G12.70.0 | S | 0.035 0.008 | - | - | ||||
| G12.80.0 | C? | - | - | - | ||||
| G13.50.2 | S? | 0.436 0.009 | - | - | ||||
| G14.10.1 | S | 0.005 0.010 | 0.0004 | 0.075 | ||||
| G14.30.1 | S | H II region | 0.367 0.008 | 0.0012 0.0002 | 0.003 0.001 | |||
| G15.40.1 | C? | 0.176 0.006 | 0.0006 0.0002 | 0.003 0.001 | ||||
| G15.90.2 | S? | 0.595 0.004 | 0.0186 0.0066 | 0.031 0.011 | ||||
| G16.00.5 | S | 0.054 0.010 | 0.0014 0.0002 | 0.026 0.006 | ||||
| G16.40.5 | S | - | - | - | ||||
| G16.70.1 | C | 0.725 0.003 | 0.0167 0.0037 | 0.023 0.005 | ||||
| G17.00.0 | S | - | - | - | ||||
| G17.40.1 | S | 0.049 0.004 | 0.0004 | 0.007 | ||||
| G18.10.1 | S | 0.237 0.007 | 0.0148 0.0016 | 0.063 0.007 | ||||
| G18.60.2 | S | 0.374 0.010 | 0.0134 0.0052 | 0.036 0.014 | ||||
| G18.80.3 | S | 2.245 0.013 | 0.4520 0.0627 | 0.201 0.028 | ||||
| G18.91.1 | C? | - | - | - | ||||
| G19.10.2 | S | - | - | - | ||||
| G20.00.2 | F | 0.758 0.010 | 0.1434 0.0102 | 0.189 0.014 | ||||
| G21.00.4 | S | 0.046 0.006 | 0.0022 0.0004 | 0.048 0.010 | ||||
| G21.50.9 | C | 5.775 0.002 | 0.6240 0.1007 | 0.108 0.017 | ||||
| G21.60.8 | S | 0.027 0.006 | 0.0070 0.0019 | 0.256 0.089 | ||||
| G21.80.6 | S | 1.834 0.018 | 0.3581 0.0550 | 0.195 0.030 | ||||
| G22.70.2 | S? | 0.663 0.025 | 0.1555 0.0169 | 0.235 0.027 | ||||
| G23.30.3 | S | 1.838 0.016 | 0.1367 0.0267 | 0.074 0.015 | ||||
| G24.70.6 | C? | 0.922 0.018 | 0.1173 0.0195 | 0.127 0.021 | ||||
| G24.70.6 | S? | 0.698 0.014 | 0.1744 0.0191 | 0.250 0.028 | ||||
| G27.40.0 | S | 0.780 0.008 | 0.0181 0.0044 | 0.023 0.006 | ||||
| G27.80.6 | F | - | - | - | ||||
| G28.60.1 | S | 1.170 0.012 | 0.0637 0.0126 | 0.054 0.011 | ||||
| G29.60.1 | S | 0.085 0.005 | 0.0027 0.0006 | 0.032 0.007 | ||||
| G29.70.3 | C | 2.027 0.006 | 0.0887 0.0376 | 0.044 0.019 | ||||
| G30.71.0 | S? | - | - | - | ||||
| G31.50.6 | S? | 0.254 0.011 | 0.0006 0.0001 | 0.002 0.001 | ||||
| G31.90.0 | S | 1.546 0.009 | 0.1218 0.0280 | 0.079 0.018 | ||||
| G32.10.9 | C? | Not detected | - | - | - | |||
| G32.40.1 | S | - | - | - | ||||
| G32.80.1 | S? | - | - | - | ||||
| G33.20.6 | S | 0.160 0.008 | 0.0027 0.0007 | 0.017 0.004 | ||||
| G33.60.1 | S | 1.222 0.013 | 0.3606 0.0987 | 0.295 0.081 | ||||
| G34.70.4 | C | - | - | - | ||||
| G35.60.4 | S? | 0.296 0.009 | 0.1060 0.0299 | 0.359 0.102 | ||||
| G36.60.7 | S? | - | - | - | ||||
| G39.20.3 | C | 1.029 0.006 | 0.2832 0.0279 | 0.275 0.027 | ||||
| G40.50.5 | S | 0.050 0.007 | 0.0058 0.0007 | 0.115 0.022 | ||||
| G41.10.3 | S | 1.330 0.004 | 0.1016 0.0176 | 0.076 0.013 | ||||
| G41.50.4 | S? | 0.670 0.007 | 0.0268 0.0049 | 0.040 0.007 | ||||
| G42.00.1 | S? | - | - | - | ||||
| G42.80.6 | S | 0.037 0.005 | - | - | ||||
| G43.30.2 | S | 3.335 0.009 | - | - | ||||
| G45.70.4 | S | 0.149 0.011 | 0.0221 0.0058 | 0.148 0.040 | ||||
| G46.80.3 | S | 0.935 0.009 | 0.3954 0.0936 | 0.423 0.100 | ||||
| G49.20.7 | S? | 0.757 0.037 | 0.1887 0.0165 | 0.249 0.025 | ||||
| G53.40.0 | S | 0.027 0.009 | 0.0002 | 0.009 | ||||
| G54.10.3 | C? | - | - | - | ||||
| G54.40.3 | S | 0.646 0.022 | 0.2005 0.0342 | 0.310 0.054 | ||||
| G55.00.3 | S | - | - | - | ||||
| G57.20.8 | S? | 0.182 0.004 | 0.0147 0.0021 | 0.081 0.012 | ||||
| G59.50.1 | S | 0.031 0.007 | 0.0002 0.0001 | 0.007 0.003 | ||||
| G358.11.0 | S | - | - | - | ||||
| G358.50.9 | S | - | - | - | ||||
| G359.00.9 | S | - | - | - | ||||
| G359.10.9 | S | 0.070 0.005 | - | - | ||||
| G359.10.5 | S | 0.823 0.030 | 0.0787 0.0118 | 0.096 0.015 |
| Namea𝑎aa𝑎aTypical uncertainties in the coordinates of the positions are . | Radius | Typeb𝑏bb𝑏bS—shell, C—composite, F—filled, ?—uncertain. | Detected inc𝑐cc𝑐cThe candidates that have at least a faint counterpart in lower frequency surveys have been marked: 20 cm THOR+VGPS—TV, 150 cm GLEAM—G150, 90 cm MAGPIS—M90, 20 cm MAGPIS—M20. | |||
|---|---|---|---|---|---|---|
| () | () | (Jy) | (Jy) | |||
| G001.9490.100 | S | G150 | 0.010 0.007 | 0.0007 | 0.063 | |
| G001.9750.460 | S | 0.002 0.004 | 0.0008 | 0.476 | ||
| G002.2280.058 | F | 0.026 0.007 | 0.0006 | 0.024 | ||
| G002.2760.399 | S | G150 | 0.051 0.007 | 0.0006 0.0002 | 0.013 0.004 | |
| G002.9100.183 | S | - | - | - | ||
| G003.1010.093 | S | 0.051 0.006 | 0.0008 | 0.016 | ||
| G003.1030.110 | F | 0.017 0.003 | 0.0006 | 0.037 | ||
| G004.4930.391 | S | G150 | 0.026 0.008 | 0.0006 | 0.023 | |
| G004.5710.244 | S | G150 | 0.097 0.007 | 0.0006 | 0.006 | |
| G005.1060.332 | S | M20,M90,G150 | 0.024 0.005 | 0.0005 | 0.019 | |
| G005.1610.321 | S | 0.030 0.005 | 0.0006 0.0000 | 0.018 0.003 | ||
| G005.3640.705 | S | 0.082 0.007 | 0.0006 | 0.008 | ||
| G005.3780.280 | F | 0.017 0.002 | - | - | ||
| G005.3780.347 | S | M20,M90,G150 | 0.007 0.006 | 0.0017 0.0003 | 0.237 0.208 | |
| G005.6730.118 | S | M20,M90,G150 | 0.037 0.014 | 0.0006 | 0.017 | |
| G005.7620.515 | S | - | - | - | ||
| G005.9890.019 | S | M20,M90,G150 | 0.086 0.012 | 0.0147 0.0014 | 0.171 0.029 | |
| G006.0550.499 | S | M20,M90,G150 151515From G19 SNR G6.10.5 | - | - | - | |
| G006.1180.387 | S? | M20,M90,G150 161616From G19 SNR G6.10.5 | - | - | - | |
| G008.0400.566 | S | M20,M90,G150 | 0.032 0.006 | 0.0006 | 0.017 | |
| G013.5000.074 | F | M20,M90,G150 | 0.026 0.005 | - | - | |
| G013.5490.352 | S | 0.008 0.005 | 0.0004 | 0.047 | ||
| G013.6260.299 | S | - | - | - | ||
| G013.6520.259 | S | M20,M90,G150 | 0.046 0.004 | 0.0005 | 0.011 | |
| G013.6580.241 | S | 0.013 0.005 | 0.0004 | 0.029 | ||
| G014.5240.140 | S? | M20,M90,G150 | - | - | - | |
| G015.8620.522 | S | M20 | 0.005 0.002 | 0.0003 | 0.063 | |
| G016.0210.746 | S | TV,M20,M90,G150 | 0.014 0.005 | 0.0002 0.0000 | 0.018 0.006 | |
| G016.1260.690 | S | - | - | - | ||
| G016.9560.933 | S | 0.153 0.006 | - | - | ||
| G017.4340.273 | F? | M20,G150 | 0.050 0.002 | 0.0005 | 0.009 | |
| G017.5930.237 | S | M20 | 0.010 0.001 | 0.0005 | 0.048 | |
| G017.6200.086 | C | M20,M90,G150 | - | - | - | |
| G018.3930.816 | S | M20,M90,G150 | 0.009 0.002 | 0.0004 | 0.044 | |
| G019.4810.108 | S | M20,M90,G150 | - | - | - | |
| G019.7510.202 | S | TV,M20 | - | - | - | |
| G020.1950.028 | F? | TV,G150 | 0.004 0.004 | 0.0004 | 0.109 | |
| G021.4920.010 | C? | 0.004 0.004 | 0.0003 | 0.097 | ||
| G021.5960.179 | S | TV,M20 | 0.228 0.013 | 0.0004 | 0.002 | |
| G021.6840.129 | S | TV,M20 | 0.060 0.005 | 0.0003 0.0001 | 0.004 0.002 | |
| G021.8610.169 | S | TV,M20 | 0.014 0.004 | 0.0003 | 0.025 | |
| G022.0450.028 | S | TV,M20,G150 171717possibly related to X-ray SNR candidate G22.00+0.00 (Ueno et al., 2006; Yamauchi et al., 2016) | 0.073 0.014 | 0.0004 | 0.005 | |
| G022.1770.314 | S | TV,M20 | - | - | - | |
| G022.9510.311 | S | TV,M20,G150 | - | - | - | |
| G023.9730.510 | S | TV | 0.002 0.007 | 0.0003 | 0.151 | |
| G024.0620.808 | F | M20 | 0.015 0.001 | 0.0003 | 0.018 | |
| G024.1930.284 | S | M20 | 0.008 0.003 | 0.0004 | 0.044 | |
| G028.5240.268 | S | TV,M20,G150 | - | - | - | |
| G028.8700.616 | S | TV | 0.008 0.003 | 0.0003 | 0.036 | |
| G028.8770.241 | S | TV,M20 181818From THOR SNR candidate G28.920.26 | 0.010 0.003 | 0.0004 | 0.034 | |
| G028.9290.254 | S | TV,M20,G150 191919From THOR SNR candidate G28.920.26 | 0.092 0.006 | 0.0003 | 0.004 | |
| G029.3290.280 | S | TV,M20 | - | - | - | |
| G030.3030.128 | F | 0.002 0.003 | 0.0003 | 0.199 | ||
| G030.3620.623 | S | 0.017 0.008 | 0.0002 0.0001 | 0.011 0.006 | ||
| G030.3750.424 | S | TV,M20 | 0.010 0.004 | 0.0003 | 0.029 | |
| G030.5080.574 | S | 0.001 0.008 | 0.0003 | 0.204 | ||
| G031.2560.041 | C | TV,M20,M90 | 0.086 0.013 | - | - | |
| G032.4580.112 | S | 0.002 0.003 | 0.0003 | 0.194 | ||
| G034.5240.761 | S | TV,G150 | 0.046 0.005 | 0.0030 0.0006 | 0.066 0.014 | |
| G034.6190.240 | F | TV | - | - | - | |
| G035.1290.343 | S | 0.007 0.002 | 0.0003 | 0.049 | ||
| G036.8390.433 | F | 0.010 0.003 | 0.0003 | 0.034 | ||
| G036.8510.246 | S | 0.002 0.002 | 0.0003 | 0.160 | ||
| G037.3370.422 | S | TV,M20 | 0.026 0.004 | 0.0002 | 0.009 | |
| G037.5060.777 | F | TV | 0.024 0.001 | 0.0002 | 0.010 | |
| G037.6720.501 | S | TV | 0.024 0.005 | 0.0004 | 0.018 | |
| G039.2030.811 | S | 0.009 0.001 | 0.0004 0.0002 | 0.047 0.019 | ||
| G039.5390.366 | S | TV,M20,G150 | 0.024 0.003 | 0.0014 0.0004 | 0.060 0.019 | |
| G041.5100.534 | S | TV,G150 | - | - | - | |
| G041.6250.261 | S | 0.003 0.005 | 0.0003 | 0.082 | ||
| G042.7110.272 | S | G150 | 0.026 0.010 | 0.0003 | 0.013 | |
| G043.0230.726 | S | 0.007 0.004 | - | - | ||
| G043.0700.558 | S | TV | 0.032 0.002 | 0.0003 | 0.010 | |
| G044.0760.127 | S | 0.086 0.010 | 0.0005 0.0001 | 0.006 0.002 | ||
| G047.7410.971 | S | - | - | - | ||
| G048.8750.174 | S | G150 | 0.026 0.004 | 0.0003 | 0.011 | |
| G051.0610.563 | S | TV,G150 | 0.010 0.003 | 0.0002 | 0.024 | |
| G059.8340.405 | S | - | - | - | ||
| G358.7110.380 | S | 0.003 0.004 | 0.0005 | 0.151 | ||
| G359.1720.264 | F | 0.018 0.004 | 0.0007 | 0.039 |
| Name | GLonga𝑎aa𝑎aTypical uncertainties in the coordinates of the positions are . | GLata𝑎aa𝑎aTypical uncertainties in the coordinates of the positions are . | Radius | Typeb𝑏bb𝑏bS—shell, C—composite, F—filled, ?—uncertain. | Remarks | References | |||
|---|---|---|---|---|---|---|---|---|---|
| () | ) | () | (Jy) | (Jy) | |||||
| G3.100.60 | F | 1 | - | - | - | ||||
| G4.200.30 | F | 2 | - | - | - | ||||
| G5.710.08 | F | Related to G005.6730.084? | 3 | - | - | - | |||
| G6.310.54 | S? | 3 | 0.089 0.007 | 0.0140 0.0036 | 0.158 0.042 | ||||
| G6.45000.5583 | S | Part of SNR G6.50.4? | 3, 4 | 0.053 0.009 | 0.0010 | 0.019 | |||
| G8.85830.2583 | S | Part of SNR G8.70.1? | 4 | - | - | - | |||
| G11.55000.3333 | - | A14 H II region | 4 | - | - | - | |||
| G15.510.15 | C | PWN? | 3, | 0.166 0.008 | 0.0062 0.0020 | 0.037 0.012 | |||
| G17.800.02 | S | 5 | - | - | - | ||||
| G18.450.42 | S | 5 | - | - | - | ||||
| G18.530.86 | ? | 5, 6 | - | - | - | ||||
| G18.760.07 | ? | 4, 5, | 0.084 0.002 | 0.0071 0.0011 | 0.084 0.013 | ||||
| G19.130.90 | ? | 3 | 0.148 0.008 | 0.0069 0.0025 | 0.046 0.017 | ||||
| G19.750.69 | F | 5, 6 | - | - | - | ||||
| G19.960.33 | C? | 5 | 0.002 0.008 | 0.0004 | 0.198 | ||||
| G20.260.86 | F? | 5 | 0.144 0.009 | 0.0004 | 0.003 | ||||
| G21.660.21 | F? | Larger structure212121GLOSTAR SNR candidate G021.5960.179 | 5, 6 | - | - | - | |||
| G22.320.11 | S | 4, 5 | - | - | - | ||||
| G23.110.19 | S | SNR | 5, 6, 7 | - | - | - | |||
| G23.850.18 | S | 5 | 0.062 0.006 | - | - | ||||
| G25.490.01 | S | 5, 8 | - | - | - | ||||
| G26.040.42 | F? | 5 | - | - | - | ||||
| G26.130.13 | S | 5 | - | - | - | ||||
| G26.530.07 | C? | 5 | - | - | - | ||||
| G26.750.73 | S | SNR | 5, | 0.033 0.004 | 0.0229 0.0127 | 0.702 0.398 | |||
| G27.060.04 | S | SNR222222Flux densities measured only for the arc | 4, 5, 9, | 0.317 0.008 | 0.0320 0.0034 | 0.101 0.011 | |||
| G27.180.30 | F | PWN? | 5, | 0.048 0.001 | 0.0004 | 0.008 | |||
| G27.240.14 | S | Likely thermal | 5 | - | - | - | |||
| G27.390.24 | x | Filaments | 5, | 0.005 0.005 | - | - | |||
| G27.470.25 | x | Filaments | 5, | 0.018 0.003 | - | - | |||
| G27.780.33 | S | 5 | 0.051 0.002 | 0.0003 | 0.005 | ||||
| G28.210.02 | F | 5 | - | - | - | ||||
| G28.220.09 | F | 5 | 0.035 0.003 | - | - | ||||
| G28.330.06 | F | 5 | - | - | - | ||||
| G28.360.21 | S | 4, 5, 6 | 0.084 0.016 | 0.0023 0.0007 | 0.027 0.009 | ||||
| G28.560.00 | S | 4, 5, 9 | 0.573 0.005 | 0.0162 0.0051 | 0.028 0.009 | ||||
| G28.640.20 | S | 4, 5 | - | - | - | ||||
| G28.780.44 | S | SNR | 4, 5, 6, | 0.054 0.007 | 0.0260 0.0057 | 0.485 0.125 | |||
| G28.880.41 | F | 5 | 0.108 0.020 | 0.0003 | 0.003 | ||||
| G28.920.26 | S | Multiple objects232323GLOSTAR SNR candidates G028.9290.254, G028.8770.241 | 5 | - | - | - | |||
| G29.380.10 | C | PWN + radio galaxy | 4, 5, 9, 10, 11, 12, | 0.578 0.012 | 0.0898 0.0085 | 0.155 0.015 | |||
| G29.410.18 | S | 5 | 0.007 0.014 | 0.0004 | 0.054 | ||||
| G31.220.02 | C | 5 | - | - | - | ||||
| G31.930.16 | ? | Filaments? | 5 | 0.014 0.003 | - | - | |||
| G32.220.21 | F | 5 | 0.115 0.005 | - | - | ||||
| G32.370.51 | S? | 5 | - | - | - | ||||
| G33.850.06 | F? | Unlikely to be a SNR | 5, | 0.006 0.001 | - | - | |||
| G34.930.24 | S | 5 | - | - | - | ||||
| G36.660.50 | F? | 5 | - | - | - | ||||
| G36.680.14 | S | 5 | 0.206 0.012 | 0.0004 0.0001 | 0.002 0.000 | ||||
| G36.900.49 | F? | 5 | - | - | - | ||||
| G37.620.22 | S | 5 | 0.026 0.006 | 0.0008 0.0002 | 0.030 0.010 | ||||
| G37.880.32 | S | 5 | - | - | - | ||||
| G38.170.09 | F? | 5 | - | - | - | ||||
| G38.620.24 | F? | 5 | - | - | - | ||||
| G38.680.43 | S? | 5 | - | - | - | ||||
| G38.830.01 | S? | 5 | 0.033 0.001 | 0.0003 | 0.009 | ||||
| G39.560.32 | F? | 5 | - | - | - | ||||
| G41.950.18 | S | 5 | - | - | - | ||||
| G42.620.14 | S? | 5 | 0.140 0.003 | 0.0003 0.0000 | 0.002 0.000 | ||||
| G46.180.02 | F | 5 | 0.045 0.004 | 0.0002 0.0000 | 0.005 0.001 | ||||
| G46.540.03 | S | 5 | 0.036 0.008 | 0.0003 | 0.007 | ||||
| G47.150.73 | C? | 5 | 0.009 0.000 | 0.0002 | 0.024 | ||||
| G51.040.07 | F | SNR | 5, 9, 13, 14, 15, | 0.100 0.011 | 0.0070 0.0014 | 0.070 0.016 | |||
| G51.210.11 | S | Multiple objects242424complex of SNRs G51.040.07 and G51.260.11 | 5, 9, 13, 14, 15, | - | - | - | |||
| G51.260.11 | S | SNR | 5, 9, 13, 14, 15, | 1.054 0.015 | 0.0655 0.0128 | 0.062 0.012 | |||
| G52.370.70 | F? | Likely thermal | 5, 14 | - | - | - | |||
| G53.070.49 | F | 5, 14, | 0.030 0.001 | 0.0035 0.0007 | 0.118 0.022 | ||||
| G53.840.75 | F | 5, 14 | - | - | - | ||||
| G54.110.25 | C | 5, 14, | 0.418 0.013 | 0.0343 0.0069 | 0.082 0.017 | ||||
| G56.560.75 | F | 5 | - | - | - | ||||
| G57.120.35 | S | 5 | - | - | - | ||||
| G58.700.31 | F | 5 | 0.008 0.002 | 0.0002 0.0000 | 0.025 0.006 | ||||
| G59.460.83 | F | 5 | 0.006 0.002 | 0.0002 | 0.039 | ||||
| G358.700.70 | S | 1 | - | - | - | ||||
| G359.070.02 | S? | 16, 17, 18 | - | - | - | ||||
| G359.560.08 | S? | 19 | - | - | - |
\tablebib (1) 1994MNRAS.270..847G; (2) 2001ESASP.459..109T; (3) Brogan et al. (2006); (4) Helfand et al. (2006); (5) Anderson et al. (2017); (6) Hurley-Walker et al. (2019a); (7) 2019ApJ...885..129M; (8) 2003ApJ...589..253B; (9) Dokara et al. (2018); (10) Hurley-Walker et al. (2019b); (11) Castelletti et al. (2017); (12) Petriella (2019); (13) 2014A&A...565A...6S; (14) Driessen et al. (2018); (15) Supan et al. (2018); (16) 2000AJ....119..207L; (17) 2010PASJ...62..971N; (18) 2015MNRAS.453..172P; (19) 2007A&A...462.1065M; () Discussed in the text of this paper.