First multi-redshift limits on post-Epoch of Reionization (post-EoR) 21 cm signal from using uGMRT
Abstract
Measurement of fluctuations in diffuse Hi 21 cm background radiation from the post-reionization epoch () is a promising avenue to probe the large scale structure of the Universe and understand the evolution of galaxies. We observe the European Large-Area ISO Survey-North 1 (ELAIS-N1) field at 300-500 MHz using the upgraded Giant Meterwave Radio Telescope (uGMRT) and employ the ‘foreground avoidance’ technique to estimate the Hi 21 cm power spectrum in the redshift range . Given the possible systematics that may remain in the data, we find the most stringent upper limits on the spherically averaged 21 cm power spectra at are (58.87 , (61.49 , (60.89 , (105.85 at and , respectively. We use this to constrain the product of neutral Hi mass density () and Hi bias () to the underlying dark matter density field, [], as 0.09,0.11,0.12,0.24 at , respectively. To the best of our knowledge these are the first limits on the Hi 21 cm power spectra at the redshift range and would play a significant role to constrain the models of galaxy formation and evolution.
1 Introduction
The redshifted 21 cm line emission from neutral hydrogen (Hi) provides a rich tool to map the Universe in 3D. The majority of Hi is ionized by ultra violet radiation emanating from early galaxies during a period (Epoch of Reionization; EoR) (Madau et al. 1997). However, below (post-EoR epoch) Hi is contained within dense clumps, which are self-shielded from the ionizing radiation. These dense clumps are strongly correlated with over density of matter where abundant of Hi are being self-shielded. The distribution of Hi is intimately connected to matter distribution of the Universe and hence help to understand the large-scale structures at intermediate redshifts in the post-EoR era () (Bull et al. 2015). Along with that measurement of post-EoR Hi 21 cm power spectrum can be used to study Baryon Acoustic Oscillations (BAO) and the equation of state of the dark energy (Chang et al. 2008; Bharadwaj et al. 2009; Bull et al. 2015).
There are several methods exist to measure the neutral Hi mass density () from = 0 to 6, starting from Lyman-alpha line absorption feature in a distant quasar spectra by intervening Hi region at (Prochaska & Wolfe 2009) to detecting 21 cm line emission from individual Galaxies at (Zwaan et al. 2005; Martin et al. 2010). It is extremely difficult to detect individual galaxies at , which requires very deep integration time (Kanekar et al. 2016). Nonetheless, one can obtain information about average properties of neutral by co-adding the Hi 21 cm signal from large number of galaxies with known redshifts (‘stacking’) to boost the signal-to-noise ratio (Lah et al. 2007; Kanekar et al. 2016; Bera et al. 2019). However, this method has so far been applied to low redshifts, . Another unique technique is 3D ‘intensity mapping’, which measure the fluctuations in the diffuse 21 cm background radiation (Bharadwaj et al. 2001; Loeb & Wyithe 2008; Chang et al. 2010; Bull et al. 2015). Previous studies use cross-correlation of the single-dish Hi 21 cm intensity map with deep galaxy survey and put constraint on [] [ at (Masui et al. 2013; Switzer et al. 2013). Ghosh et al. (2011a) measure the fluctuations in the faint Hi 21 cm background using GMRT for the first time and put upper limit on [] 2.9 ([] 0.11) at , where is the mean neutral fraction.
The major challenge in detecting Hi power spectrum is the presence of the bright synchrotron radiation from galactic and extragalactic sources. Several novel techniques have been developed to remove foregrounds (Ghosh et al. 2011b; Liu & Tegmark 2012; Masui et al. 2013; Wolz et al. 2017; Anderson et al. 2018). Also foregrounds can be avoided in Fourier space (), where the smooth foregrounds coupled with instrument response are localized in a ‘wedge’ shape region (Datta et al. 2010; Parsons et al. 2012b). This method is being widely used to detect the Hi 21 cm signal from EoR (Kolopanis et al. 2019; Trott et al. 2020). We follow the ‘foreground avoidance’ method to estimate the Hi power spectrum at redshifts with uGMRT. We also put the upper limits on the product of and at each redshift. The quantity, [], contains information about the host dark matter haloes of Hi gas and determines the amplitude of the expected Hi power spectrum. It is essential to put tight constraint on these parameters using observations to predict the uncertainties in measuring Hi power spectrum for current and future telescops (Bharadwaj & Ali 2005; Battye et al. 2012; Padmanabhan et al. 2015).
2 Observation and analysis
We observed the ELAIS-N1 field ( ) using uGMRT in GTAC cycle-32 during May-June 2017 at 300 - 500 MHz for a total time of 25 hours (including calibrators) over four nights. ELAIS-N1 is a well known field in the northern sky at high galactic latitude () and previously studied at different frequencies (see Chakraborty et al. 2019a and references therein). The data was taken with a time resolution of sec and frequency resolution of KHz using upgraded digital backend correlator (Gupta et al. 2017). The detail analysis of editing bad data, calibration and imaging are mentioned in Chakraborty et al. (2019b). However, here we did not average the data across frequency to get the maximum modes, which is inversely proportional to the frequency resolution (Morales & Hewitt 2004). We have used a mask during imaging, generated via PYBDSF 111https://www.astron.nl/citt/pybdsf/, to ensure that imaging artifacts do not propagate into the model during direction-independent (DI) self-calibration. This results into building more accurate sky model consisting of bright compact sources and allows for the mitigation of calibration errors in self-calibration. Also, during the self-calibration, we have excluded the shorter baselines (1.5k), where the diffuse emission is most sensitive. Hence, there will not be any significant suppression of the diffuse emission and the 21 cm signal during self-calibration and subsequent sky-model subtraction (Patil et al. 2016). After getting the final image we found that there are 3728 components (compact sources) present in the model. Then we have subtracted this point-source model from the calibrated visibility data, using UVSUB in CASA. This residual data is being used for power spectrum analysis. We do not attempt to model and subtract the diffuse foreground emissions in this analysis to avoid any suppression or loss of the diffuse 21 cm signal.
3 Power spectrum estimation
The Fourier transformation of a visibility along the frequency direction to the -domain is given as (Morales & Hewitt 2004)
| (1) |
where, is the measured visibility of a baseline as a function of frequency () and is the Blackman-Harris (BH) window function used to control the visibility spectrum in the -domain, contains frequency dependent sample weights that result from flagging of frequency channels due to radio frequency intereference (RFI). We use one-dimensional ‘’ (Högbom 1974) to deconvolve the kernel that results from the Fourier conjugate of the product of [] and obtain the final spectra (Parsons & Backer 2009).
The cylindrically averaged power spectrum can be estimated with the use of proper scaling factor as (Morales & Hewitt 2004; Parsons et al. 2012b) :
| (2) |
with,
| (3) |
where is the wavelength corresponding to the band-center, is the Boltzmann constant, is the rest-frame frequency of the 21 cm spin flip transition of Hi, is the redshift to the observed frequency, is sky-integral of the squared antenna primary beam response, B is the bandwidth and is a redshift dependent scalar to convert angle and frequency to cosmological length scales (Morales & Hewitt 2004). Here, is the transverse comoving distance at redshit , is the Hubble parameter and . and are matter and dark energy densities, respectively. In this work, we use the best fitted cosmological parameters of the Planck 2018 analysis (Planck Collaboration et al. 2018). The power spectrum is in units of . We spherically averaged in -bins and estimate the dimensionless power spectrum as (Datta et al. 2010):
| (4) |
where .
However, correlating a visibility with itself, as in Eqn. 2, will result in a positive bias due to the noise present in the data (Bharadwaj & Pandey 2003). To avoid the positive noise bias, we cross correlate all the visibilites among each other within a -cell, whose dimension is inverse of the half-power beam width of the primary beam (). The off-diagonal terms of the correlation matrix for each -cell are expected to be free of noise bias and the average of those terms is being quoted as the estimated power corresponding to that cell. The method of correlating visibilites within a -cell to measure the post-EoR 21 cm power spectrum was first proposed by Bharadwaj & Sethi (2001) and further discussed in Bharadwaj & Pandey (2003); Bharadwaj & Ali (2005).
The power spectrum uncertainties are estimated by dividing the noise power by the square-root of the number of modes averaged together in estimating the power spectrum (Tegmark 1997). We calculate the noise power by subtracting the average of the off-diagonal from the diagonal (self-correlation of visibilities) components for each -cells. The estimated noise at the highest modes (above the horizon limit) is expected to be dominated by thermal variance (Kolopanis et al. 2019).
4 Results
The whole 200 MHz bandwidth data are divided into 8 MHz sub-bands and we only use projected baselines upto 2 km to estimate the Hi 21 cm power spectrum for each of these sub-bands. This choice allow us to restrict to minimal baseline migration over the sub-band. Also, the analysis using these sub-bands ensures the signal ergodicity within the volume, i.e, the cosmological signal does not evolve significantly over the bandwidth (Datta et al. 2014; Trott et al. 2020; Mondal et al. 2020).
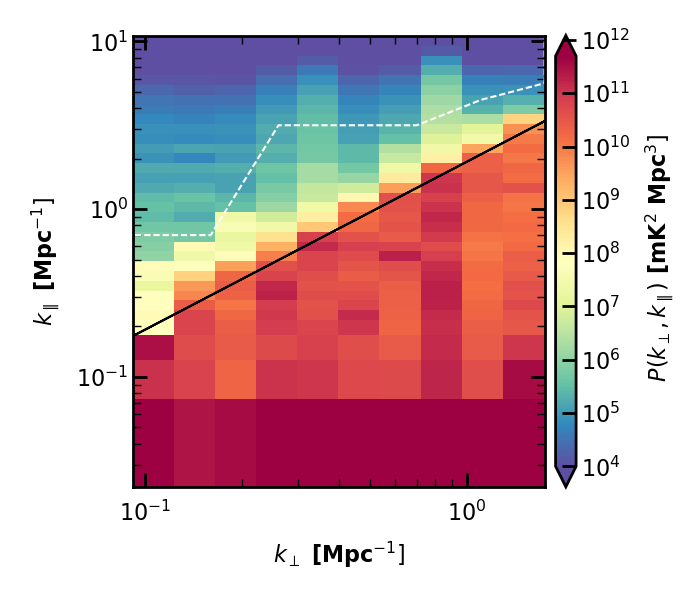
We choose four 8 MHz sub-bands from the the entire observed bandwidth which are relatively less contaminated by RFI and estimate the cylindrically and spherically averaged power spectrum. In Fig. 1, we show the cylindrically averaged power spectrum estimated from a 8 MHz sub-band around 310 MHz corresponding to redshift . Note that, the first and last 4 MHz of the 200 MHz bandwidth have been flagged. Hence, this is the power spectrum of the highest redshift () probed in this analysis. We find that the spectrally smooth foregrounds coupled with chromatic instrument response are confined in a ‘wedge’ shape region in this 2D space. This cylindrical averaged power spectrum is useful to identify the -modes devoid of foreground contamination. The black line in Fig. 1 shows the upper bound of foreground contaminated modes within the horizon () limit.
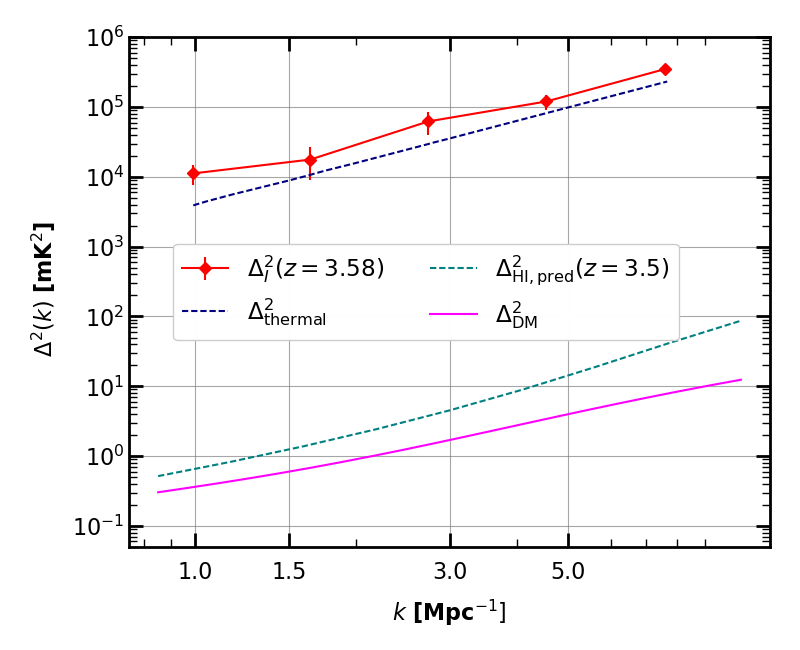
Above the horizon line we find a region in -space where the power is 2-3 orders of magnitude less than the power inside the horizon limit. We choose the modes bounded by the white dashed curve (see Fig. 1) by visually inspecting the less foreground contaminated region and estimate the spherically averaged power spectrum using those modes. The dimensionless spherically averaged stokes- power spectrum () in along with error bars at are being shown in Fig. 2. We also estimate the theoretical thermal noise power (), including the flagging, using the uGMRT baseline distribution, bandwidth, integration time and system temperature () (McQuinn et al. 2006; Parsons et al. 2012a). The quantity as a function of frequency for uGMRT is given as a polynomial 222http://www.ncra.tifr.res.in:8081/~secr-ops/etc/etc_help.pdf, where is the antenna gain (Gupta et al. 2017). We estimate the at the central frequency of the sub-band using the polynomial and also correct for the sky-temperature at the corresponding frequency. The bottom green dash line shows the theoretical prediction of Hi 21 cm power spectrum at redshift taken from (Sarkar et al. 2016). We find that estimated is close to at the modes probed here. However, the measured is nearly four orders of magnitude higher than the theoretical expectation of Hi 21 cm power spectrum close to redshift . Hence, this analysis with 13 hours of on source data (before flagging) put an upper limit on the post-EoR Hi power spectrum and limited by thermal noise.
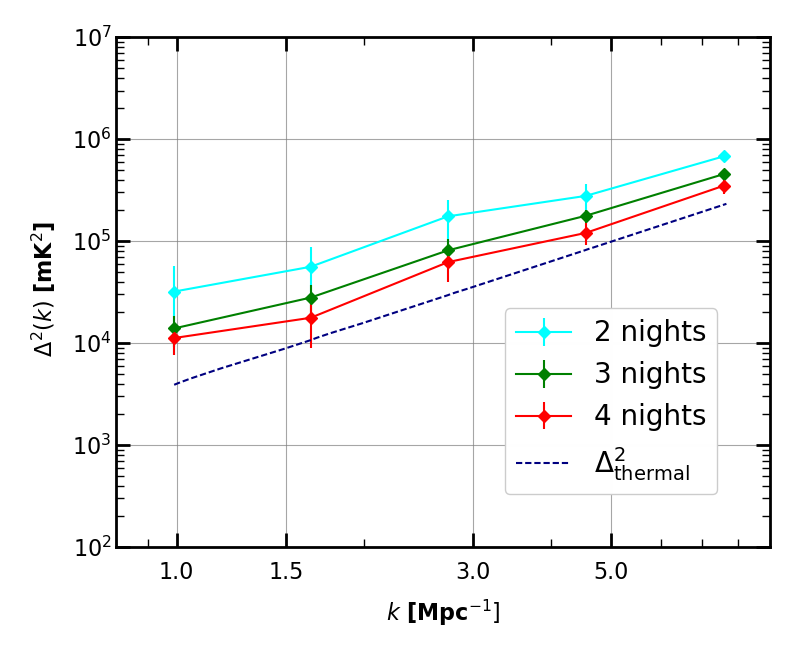
The data was observed over 4 nights and coherently added in the -domain within -cells. We show in Fig. 3 the spherically averaged power spectrum after combining different night’s data set successively. We find a systematic decrease in power upon combining more data in -domain. This proves that the coherent addition of data in -domain and the methodology of our power spectrum estimation are consistent with theoretical expectation.
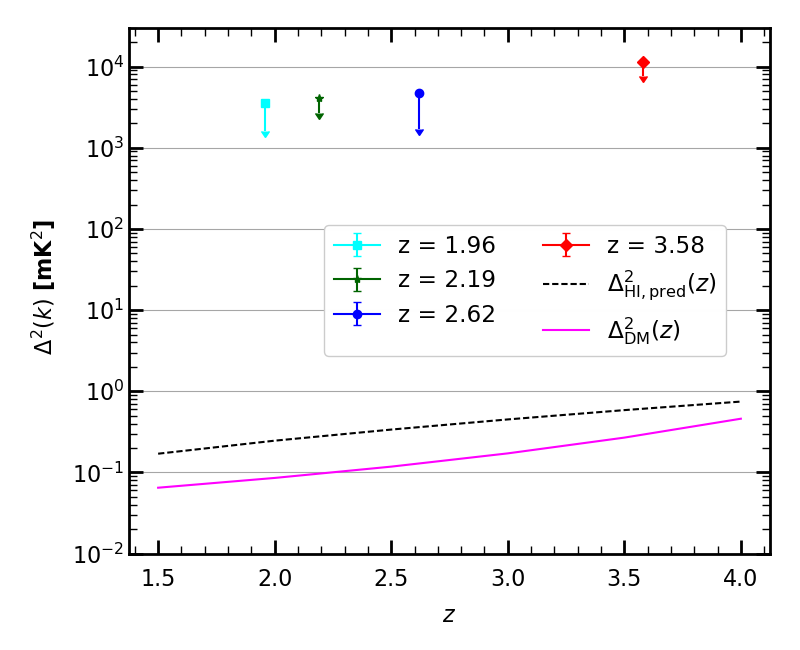
We also choose three other less RFI contaminated 8 MHz sub-bands around 392 MHz (), 444 MHz () and 479 MHz () and estimate the power spectrum following the same procedure discussed above. The cylindrically and spherically averaged power spectrum plots are being shown in Appendix A. The lowest limits, at , on spherically averaged 21 cm power spectrum are (58.87 , (61.49 , (60.89 , (105.85 at and , respectively and shown in Fig. 4. The values of along with the error bars for all at different redshifts are mentioned in Table B.1 (Appendix B).
Note that, there are several different ways which may contaminate the foreground free cosmological window above the ‘wedge’, like residual calibration errors, polarization leakage, ionospheric effects, the variation of beam, etc and affect the estimation of the Hi 21 cm power spectrum (Gehlot et al. 2018; Joseph et al. 2020; Kumar et al. 2020). Although the estimated power spectrum for different redshift bins are close to the thermal noise, the resultant power spectrum may still be affected by any plausible residual systematics. We will analyze any plausible contamination of the signal window due to different systematics in detail and present in future work.
5 Constraints on []
The main observable in 21 cm intensity mapping experiments is the power spectrum of 21 cm brightness temperature fluctuation and given by the expression (Battye et al. 2012; Anderson et al. 2018):
| (5) |
where the mean brightness temperature is given by (Anderson et al. 2018),
| (6) |
where is the Hi bias and is the dark matter power spectrum.
We use CAMB 333https://camb.info/ code to generate the dark matter power spectrum at any given redshift for the range probed here. After combining Eqns. 5 and 6 and using the best limit on Hi power spectrum at , the estimated upper limit on [] are 0.09,0.11,0.12,0.24 at , respectively. Theoretical prediction shows the value of [] at Mpc-1 for the redshift range probed here (Sarkar et al. 2016). Previous observation of DLAs suggests that [] at this redshifts (Padmanabhan et al. 2015), which is still 150 times smaller than our present limit.
6 Summary
In this analysis, using 13 hours uGMRT observation of the ELAIS N1 field, we put limits on post-EoR Hi power spectrum at redshifts . This is the first attempt to estimate the statistical feature of post-EoR Hi signal via auto power spectrum using interferomteric data at this redshift range using uGMRT.
To maintain signal ergodicity, we divide the whole 200 MHz band into 8 MHz sub-bands and choose 4 such less RFI contaminated sub-bands to put limits on Hi power spectrum. We coherently added the data in -domain and estimate the cosmological Hi 21 cm power spectrum with properly accounting for the positive noise bias. We use 1D algorithm to mitigate the foreground spillover beyond horizon limit caused by missing channels due to RFI flagging. We estimate the cylindrically averaged power spectrum using proper scaling factors and find that spectrally smooth foregrounds coupled with chromatic instrument response is contained within a ‘wedge’ shape region inside the horizon limit. Using the modes less contaminated by the foregrounds above the horizon limit, we estimate the spherically averaged power spectrum. The upper limits at on spherically averaged 21 cm power spectrum are (58.87 , (61.49 , (60.89 , (105.85 and the corresponding limit on the quantity [] are 0.09,0.11,0.12,0.24 at , respectively.
This analysis with the uGMRT observation is a first attempt to characterize the fluctuations in the post-EoR Hi signal at these high redshifts using the ‘foreground avoidance’ technique and demonstrates that the post-EoR Hi 21 cm power spectrum can be detected with more than 5000 hours of observation using uGMRT. We also constrain the product of the astrophysical quantities and , which will be helpful to characterize the uncertainties associated with the measurement of Hi power spectrum for ongoing and future Hi 21 cm intensity mapping experiments like, OWFA 444http://www.ncra.tifr.res.in/ncra/ort, CHIME 555https://chime-experiment.ca/en , TIANLAI 666https://tianlai.bao.ac.cn, HIRAX 777https://hirax.ukzn.ac.za/ and the SKA-1 mid 888https://www.skatelescope.org/mfaa/.
ACKNOWLEDGEMENTS
We thank the anonymous referee for helpful comments and suggestions that have helped to improve this work. We thank the staff of GMRT for making this observation possible. GMRT is run by National Centre for Radio Astrophysics of the Tata Institute of Fundamental Research. AC would like to thank DST for INSPIRE fellowship. AD would like to acknowledge the support of EMR-II under CSIR No. 03(1461)/19.
References
- Anderson et al. (2018) Anderson, C. J., Luciw, N. J., Li, Y. C., et al. 2018, MNRAS, 476, 3382, doi: 10.1093/mnras/sty346
- Battye et al. (2012) Battye, R. A., Brown, M. L., Browne, I. W. A., et al. 2012, arXiv e-prints, arXiv:1209.1041. https://arxiv.org/abs/1209.1041
- Bera et al. (2019) Bera, A., Kanekar, N., Chengalur, J. N., & Bagla, J. S. 2019, ApJ, 882, L7, doi: 10.3847/2041-8213/ab3656
- Bharadwaj & Ali (2005) Bharadwaj, S., & Ali, S. S. 2005, MNRAS, 356, 1519, doi: 10.1111/j.1365-2966.2004.08604.x
- Bharadwaj et al. (2001) Bharadwaj, S., Nath, B. B., & Sethi, S. K. 2001, Journal of Astrophysics and Astronomy, 22, 21, doi: 10.1007/BF02933588
- Bharadwaj & Pandey (2003) Bharadwaj, S., & Pandey, S. K. 2003, Journal of Astrophysics and Astronomy, 24, 23, doi: 10.1007/BF03012189
- Bharadwaj & Sethi (2001) Bharadwaj, S., & Sethi, S. K. 2001, Journal of Astrophysics and Astronomy, 22, 293, doi: 10.1007/BF02702273
- Bharadwaj et al. (2009) Bharadwaj, S., Sethi, S. K., & Saini, T. D. 2009, Phys. Rev. D, 79, 083538, doi: 10.1103/PhysRevD.79.083538
- Bull et al. (2015) Bull, P., Ferreira, P. G., Patel, P., & Santos, M. G. 2015, ApJ, 803, 21, doi: 10.1088/0004-637X/803/1/21
- Chakraborty et al. (2019a) Chakraborty, A., Datta, A., Choudhuri, S., et al. 2019a, MNRAS, 487, 4102, doi: 10.1093/mnras/stz1580
- Chakraborty et al. (2019b) Chakraborty, A., Roy, N., Datta, A., et al. 2019b, MNRAS, 490, 243, doi: 10.1093/mnras/stz2533
- Chang et al. (2010) Chang, T.-C., Pen, U.-L., Bandura, K., & Peterson, J. B. 2010, Nature, 466, 463, doi: 10.1038/nature09187
- Chang et al. (2008) Chang, T.-C., Pen, U.-L., Peterson, J. B., & McDonald, P. 2008, Phys. Rev. Lett., 100, 091303, doi: 10.1103/PhysRevLett.100.091303
- Datta et al. (2010) Datta, A., Bowman, J. D., & Carilli, C. L. 2010, ApJ, 724, 526, doi: 10.1088/0004-637X/724/1/526
- Datta et al. (2014) Datta, K. K., Jensen, H., Majumdar, S., et al. 2014, MNRAS, 442, 1491, doi: 10.1093/mnras/stu927
- Gehlot et al. (2018) Gehlot, B. K., Koopmans, L. V. E., de Bruyn, A. G., et al. 2018, MNRAS, 478, 1484, doi: 10.1093/mnras/sty1095
- Ghosh et al. (2011a) Ghosh, A., Bharadwaj, S., Ali, S. S., & Chengalur, J. N. 2011a, MNRAS, 418, 2584, doi: 10.1111/j.1365-2966.2011.19649.x
- Ghosh et al. (2011b) —. 2011b, MNRAS, 411, 2426, doi: 10.1111/j.1365-2966.2010.17853.x
- Gupta et al. (2017) Gupta, Y., Ajithkumar, B., Kale, H. S., et al. 2017, Current Science, 113, 707
- Högbom (1974) Högbom, J. A. 1974, A&AS, 15, 417
- Joseph et al. (2020) Joseph, R. C., Trott, C. M., Wayth, R. B., & Nasirudin, A. 2020, MNRAS, 492, 2017, doi: 10.1093/mnras/stz3375
- Kanekar et al. (2016) Kanekar, N., Sethi, S., & Dwarakanath, K. S. 2016, ApJ, 818, L28, doi: 10.3847/2041-8205/818/2/L28
- Kolopanis et al. (2019) Kolopanis, M., Jacobs, D. C., Cheng, C., et al. 2019, ApJ, 883, 133, doi: 10.3847/1538-4357/ab3e3a
- Kumar et al. (2020) Kumar, J., Dutta, P., & Roy, N. 2020, MNRAS, 495, 3683, doi: 10.1093/mnras/staa1371
- Lah et al. (2007) Lah, P., Chengalur, J. N., Briggs, F. H., et al. 2007, MNRAS, 376, 1357, doi: 10.1111/j.1365-2966.2007.11540.x
- Liu & Tegmark (2012) Liu, A., & Tegmark, M. 2012, MNRAS, 419, 3491, doi: 10.1111/j.1365-2966.2011.19989.x
- Loeb & Wyithe (2008) Loeb, A., & Wyithe, J. S. B. 2008, Phys. Rev. Lett., 100, 161301, doi: 10.1103/PhysRevLett.100.161301
- Madau et al. (1997) Madau, P., Meiksin, A., & Rees, M. J. 1997, ApJ, 475, 429, doi: 10.1086/303549
- Martin et al. (2010) Martin, A. M., Papastergis, E., Giovanelli, R., et al. 2010, ApJ, 723, 1359, doi: 10.1088/0004-637X/723/2/1359
- Masui et al. (2013) Masui, K. W., Switzer, E. R., Banavar, N., et al. 2013, ApJ, 763, L20, doi: 10.1088/2041-8205/763/1/L20
- McQuinn et al. (2006) McQuinn, M., Zahn, O., Zaldarriaga, M., Hernquist, L., & Furlanetto, S. R. 2006, ApJ, 653, 815, doi: 10.1086/505167
- Mondal et al. (2020) Mondal, R., Shaw, A. K., Iliev, I. T., et al. 2020, MNRAS, 494, 4043, doi: 10.1093/mnras/staa1026
- Morales & Hewitt (2004) Morales, M. F., & Hewitt, J. 2004, ApJ, 615, 7, doi: 10.1086/424437
- Padmanabhan et al. (2015) Padmanabhan, H., Choudhury, T. R., & Refregier, A. 2015, MNRAS, 447, 3745, doi: 10.1093/mnras/stu2702
- Parsons et al. (2012a) Parsons, A., Pober, J., McQuinn, M., Jacobs, D., & Aguirre, J. 2012a, ApJ, 753, 81, doi: 10.1088/0004-637X/753/1/81
- Parsons & Backer (2009) Parsons, A. R., & Backer, D. C. 2009, AJ, 138, 219, doi: 10.1088/0004-6256/138/1/219
- Parsons et al. (2012b) Parsons, A. R., Pober, J. C., Aguirre, J. E., et al. 2012b, ApJ, 756, 165, doi: 10.1088/0004-637X/756/2/165
- Patil et al. (2016) Patil, A. H., Yatawatta, S., Zaroubi, S., et al. 2016, MNRAS, 463, 4317, doi: 10.1093/mnras/stw2277
- Planck Collaboration et al. (2018) Planck Collaboration, Aghanim, N., Akrami, Y., et al. 2018, arXiv e-prints, arXiv:1807.06209. https://arxiv.org/abs/1807.06209
- Prochaska & Wolfe (2009) Prochaska, J. X., & Wolfe, A. M. 2009, ApJ, 696, 1543, doi: 10.1088/0004-637X/696/2/1543
- Sarkar et al. (2016) Sarkar, D., Bharadwaj, S., & Anathpindika, S. 2016, MNRAS, 460, 4310, doi: 10.1093/mnras/stw1111
- Switzer et al. (2013) Switzer, E. R., Masui, K. W., Bandura, K., et al. 2013, MNRAS, 434, L46, doi: 10.1093/mnrasl/slt074
- Tegmark (1997) Tegmark, M. 1997, Phys. Rev. D, 55, 5895, doi: 10.1103/PhysRevD.55.5895
- Trott et al. (2020) Trott, C. M., Jordan, C. H., Midgley, S., et al. 2020, MNRAS, 493, 4711, doi: 10.1093/mnras/staa414
- Wolz et al. (2017) Wolz, L., Blake, C., & Wyithe, J. S. B. 2017, MNRAS, 470, 3220, doi: 10.1093/mnras/stx1388
- Zwaan et al. (2005) Zwaan, M. A., Meyer, M. J., Staveley-Smith, L., & Webster, R. L. 2005, MNRAS, 359, L30, doi: 10.1111/j.1745-3933.2005.00029.x
Appendix A 2D and 3D power spectrum at
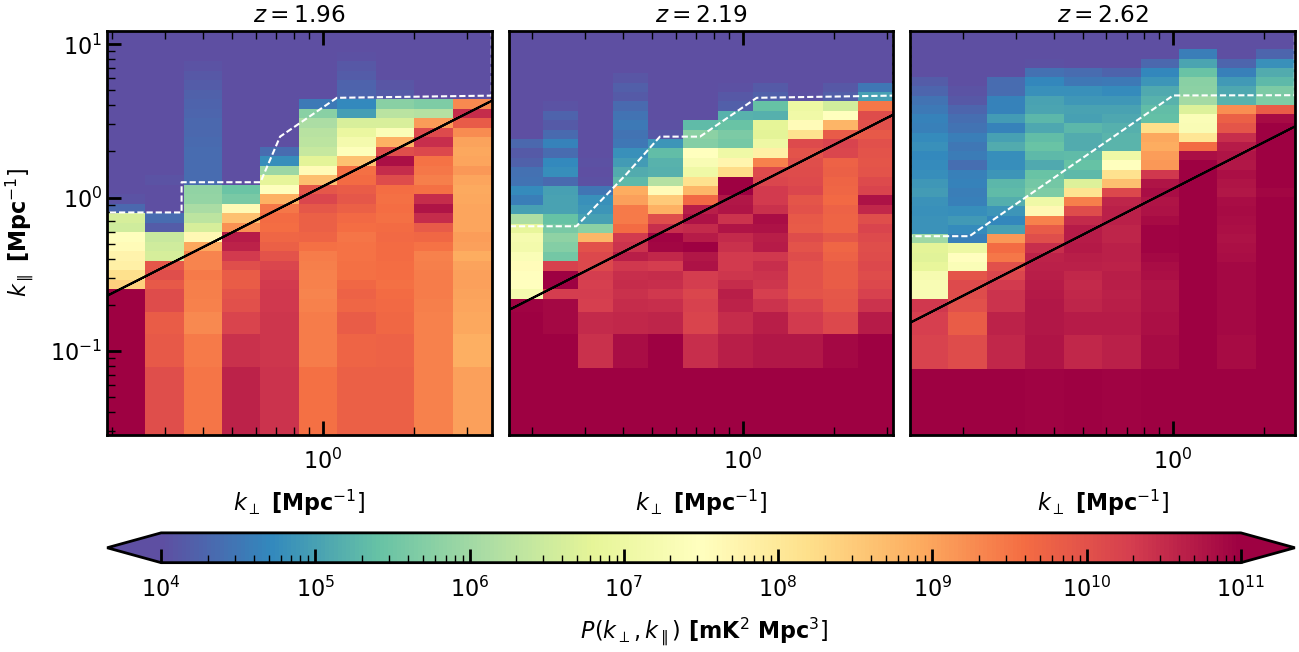 |
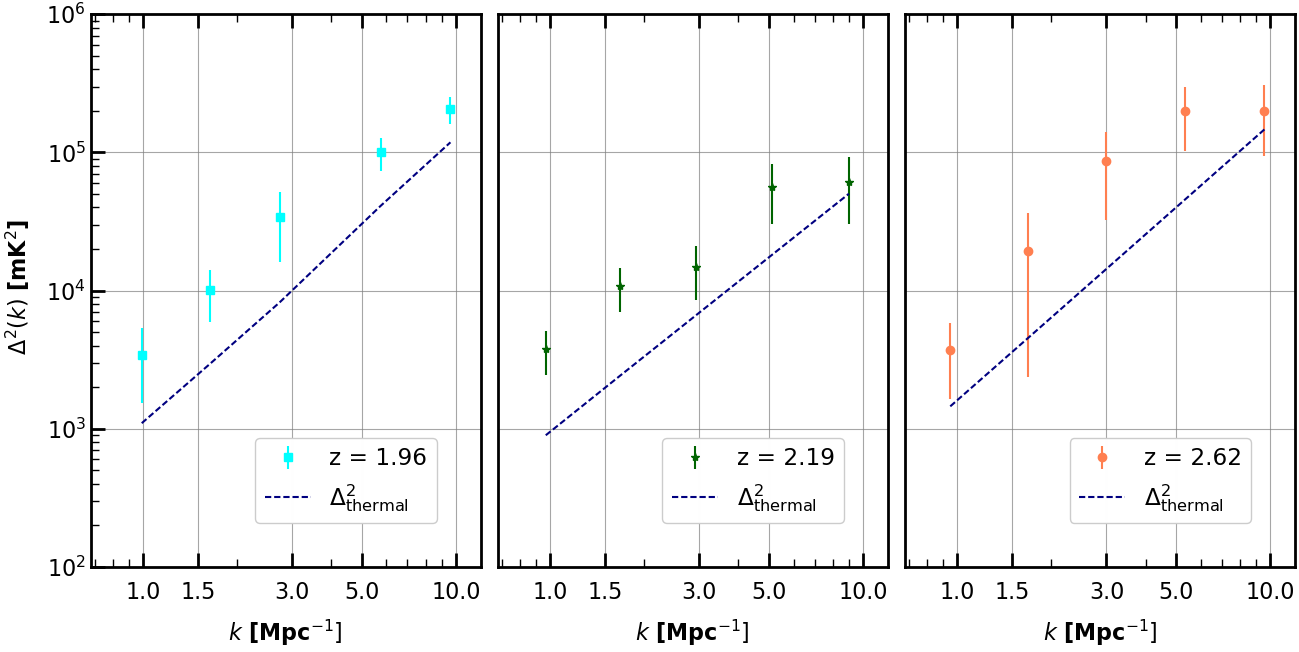 |
Appendix B Tabulated power spectrum values at different redshifts
[2]
| mK2 | mK2 | |
| 0.99 | ||
| 1.64 | ||
| 2.73 | ||
| 5.74 | ||
| 9.60 | ||
| mK2 | mK2 | |
| 0.97 | ||
| 1.67 | ||
| 2.92 | ||
| 5.12 | ||
| 9.02 | ||
[2]
| mK2 | mK2 | |
| 0.95 | ||
| 1.68 | ||
| 2.99 | ||
| 5.36 | ||
| 9.59 | ||
| mK2 | mK2 | |
| 0.99 | ||
| 1.64 | ||
| 2.73 | ||
| 4.54 | ||
| 7.58 | ||