The dual nature of blazar fast variability. Space and ground observations of S5 0716+714
Abstract
Blazar S5 0716+714 is well-known for its short-term variability, down to intra-day time-scales. We here present the 2-min cadence optical light curve obtained by the TESS space telescope in 2019 December – 2020 January and analyse the object fast variability with unprecedented sampling. Supporting observations by the Whole Earth Blazar Telescope Collaboration in , , , and bands allow us to investigate the spectral variability during the TESS pointing. The spectral analysis is further extended in frequency to the UV and X-ray bands with data from the Neil Gehrels Swift Observatory. We develop a new method to unveil the shortest optical variability time-scales. This is based on progressive de-trending of the TESS light curve by means of cubic spline interpolations through the binned fluxes, with decreasing time bins. The de-trended light curves are then analysed with classical tools for time-series analysis (periodogram, auto-correlation and structure functions). The results show that below 3 d there are significant characteristic variability time-scales of about 1.7, 0.5, and 0.2 d. Variability on time-scales d is strongly chromatic and must be ascribed to intrinsic energetic processes involving emitting regions, likely jet sub-structures, with dimension less than about pc. In contrast, flux changes on time-scales d are quasi-achromatic and are probably due to Doppler factor changes of geometric origin.
keywords:
galaxies: active – galaxies: jets – galaxies: BL Lacertae objects: general – galaxies: BL Lacertae objects: individual: S5 0716+7141 Introduction
Blazars, including BL Lac objects (BL Lacs) and flat-spectrum radio quasars (FSRQ) form a class of active galactic nuclei characterized by extreme and unpredictable emission variability at all frequencies on a wide range of time-scales. In the optical band, small (up to tenths of mag) intra-day flux variations usually overlap on larger (up to several mag) brightness changes on weeks–years scales, likely revealing different physical mechanisms at work. The distinctive feature of blazars is that most of the radiation we observe is produced in a relativistic plasma jet pointing toward us. This causes blueshift of the observed radiation with respect to the emitted one, contraction of the variability time-scales, and flux enhancement by some power of the Doppler factor , which depends on both the bulk Lorentz factor (i.e. on the bulk velocity of the emitting plasma) and the viewing angle (i.e. the angle between the velocity vector and the line of sight). Even small changes of can produce large flux variations, and at least part of the blazar variability can likely be due to geometric effects, as in the twisting inhomogeneous jet model proposed by Raiteri et al. (2017) to explain the multifrequency long-term behaviour of the FSRQ CTA 102. In the model by Camenzind & Krockenberger (1992) instead, rotating plasma bubbles in the jet can produce lighthouse effect and consequently quasi-periodic oscillations (QPOs). Other variability mechanisms involve intrinsic energetic processes, like particle injection or acceleration due to shock waves (e.g. Blandford & Königl, 1979; Marscher & Gear, 1985; Sikora et al., 2001), turbulence (Marscher, 2014; Pollack et al., 2016), or instabilities that occur in the accretion disc and propagate into the jet, giving rise to QPOs (e.g. King et al., 2013). Search for periodicities in blazar (and AGN) light curves at all wavelengths have led to a variety of results (e.g. Lainela et al., 1999; Raiteri et al., 2001; Gierliński et al., 2008; Ackermann et al., 2015; Graham et al., 2015; Gupta et al., 2018; Otero-Santos et al., 2020; Peñil et al., 2020), and to discussions on their reliability (Vaughan et al., 2016; Covino et al., 2019). Up to now, the (quasi) periodicity found in the BL Lac object OJ 287 is considered the most robust result and is interpreted in the framework of a binary black hole system (e.g. Sillanpaa et al., 1996; Villata et al., 1998b; Valtonen et al., 2016, but see Goyal et al. 2018).
Blazars have often shown intra-day/night variability or even microvariability111In the paper we will use these definitions with some flexibility to indicate flux changes on time-scales shorter than 24 h (intra-day variability) or much shorter than this (microvariability); the term “intra-night” is used when mentioning ground-based optical observations. at all wavelengths (Miller et al., 1989; Wagner & Witzel, 1995; Aharonian et al., 2007; Albert et al., 2007). This is mainly observed during flaring states, which may be an observing bias, due to the fact that intensive monitoring is usually performed when the source is bright. Moreover, data are more precise when the flux is higher, which is a requirement to assess the smallest and fastest variations. But it may also be the consequence of the amplification of the variability amplitude and contraction of its time-scales due to Doppler enhancement (Raiteri et al., 2017).
The Kepler space telescope, which was in operation between 2009 and 2013, and the following K2 mission in 2014–2018, allowed astrophysicists to investigate the variability of a few blazars on minute time-scales over time spans of several weeks. Edelson et al. (2013) analysed the 181-d long Kepler light curve of the BL Lac object W2R 1926+42 with a 30-min sampling, showing significant variations on hour scale and many day-scale flares. They found that the power spectral density (PSD) cannot be satisfactorily fitted by simple mathematical laws, implying that blazar variability requires complex physical pictures. From the study of the long-term Kepler light curve of the same object, Mohan et al. (2016) inferred a black hole mass of and a distance of the emitting region from the jet base. They also found a QPO with 9.1-d period that they ascribed to jet-based processes. The 100-d long Kepler light curve with 1-min sampling of W2R 1926+42 was analysed by Sasada et al. (2017). They noticed variations on both intra-day and inter-day scales with a variety of profiles that in general are not symmetric, showing longer decaying than rising times. From this they concluded that microvariability is likely due to intrinsic rather than geometric processes. An analysis of the multiwavelength behaviour of OJ 287 on multiple time-scales was carried out by Goyal et al. (2018), including Kepler short-cadence data. They found a complex shape of the PSD and no QPOs. Kepler data of several AGN were investigated by Wehrle et al. (2013) and Wehrle et al. (2019). The slopes of the PSD suggested either turbulence behind a shock or instabilities in the accretion disc as the origin of the observed variability.
After Kepler, the Transiting Exoplanet Survey Satellite (TESS; Ricker et al., 2015) was launched in 2018 April with the main aim of performing an all-sky survey to discover transiting exoplanets. However, a small amount of observing time was available for other scientific objectives. TESS data include 30-min cadence full frame images and 2-min cadence light curves for selected objects. In the first year of operation TESS monitored the South ecliptic sky. In the second year the observations shifted to the northern sky. Through the Guest Observer Program, we asked for 2-min cadence observations of a small sample of optically and -ray bright blazars to investigate their microvariability. The BL Lac object S5 0716+714 was among these sources. To check the TESS calibration and to obtain information on the source spectral variability, we also activated the Whole Earth Blazar Telescope222http://www.oato.inaf.it/blazars/webt (WEBT) Collaboration and required target-of-opportunity (ToO) observations by the Neil Gehrels Swift Observatory satellite during the TESS pointing.
S5 0716+714 at redshift (Nilsson et al., 2008) is well known for its intra-day variability (e.g. Wagner et al., 1996; Villata et al., 2000; Sasada et al., 2008; Chandra et al., 2011; Kaur et al., 2018, and references therein). An intensive 5-d campaign was organized by the WEBT in March 2014. The source showed microvariability with about 0.1 mag amplitude on hour time-scale, superimposed on wider variations on day scales. The fast events were characterized by high polarization degree (Bhatta et al., 2016). Simultaneous flux changes in the optical and radio bands and in the optical and -ray bands were detected by Villata et al. (2008) and Chen et al. (2008) during an active state in 2007, which was monitored by the WEBT at low frequencies and by the Astrorivelatore Gamma ad Immagini LEggero (AGILE) satellite at rays. Search for periodicities in both the optical and -ray light curves by Sandrinelli et al. (2017) led to negative results. In contrast, Rani et al. (2013) found evidence for a 63-d period in the optical and Prokhorov & Moraghan (2017) identified a 346-d period in rays. QPOs with time-scales in the range 25–73 min and of min were found by Gupta et al. (2009) and Rani et al. (2010), respectively, in selected intra-night optical observations. The multifrequency and polarimetric behaviour of the source during the 2011 October outburst was explained by Larionov et al. (2013) in the framework of a shock wave travelling downstream the jet along a helical path. RadioAstron Space VLBI observations revealed a complex structure of the radio core and inner jet bending (Kravchenko et al., 2020).
We here present the 2-min cadence light curve of S5 0716+714 obtained by TESS from 2019 December 24 to 2020 January 21, complemented by multiband optical data acquired by the WEBT and by ultraviolet and X-ray data by Swift. The paper is organized as follows. Section 2 presents the TESS light curve and Section 3 the WEBT optical observations, which are used to investigate the optical spectral variability. The ultraviolet and X-ray data obtained by Swift are analysed in Section 4. Section 5 presents the time series analysis on the TESS fluxes. The chromatism of the flux variations is discussed in Section 6. Final considerations and conclusions are drawn in Section 7.
2 Observations by TESS
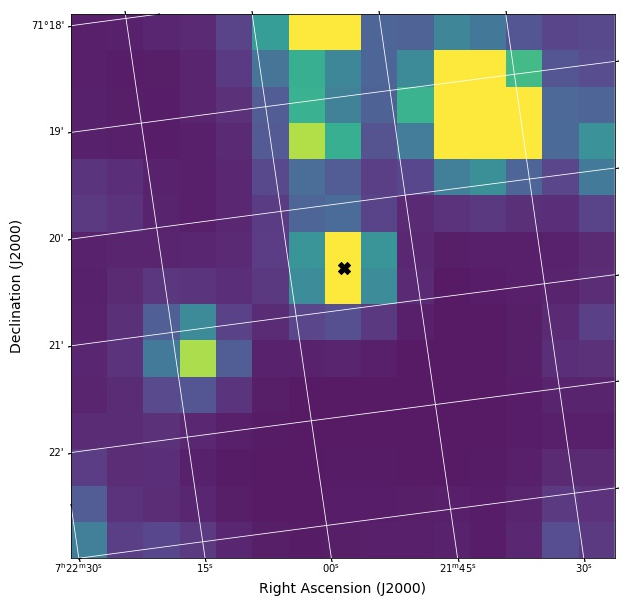
Fig. 1 shows a pixel (1 pixel = 21 arcsec) image of the TESS field centred on S5 0716+714.
The 2-min cadence TESS light curves available at the Mikulski Archive for Space Telescopes333https://mast.stsci.edu/portal/Mashup/Clients/Mast/
Portal.html (MAST) contain both the simple aperture photometry flux (SAP_FLUX, electrons per second) and the pre-search data conditioned simple aperture photometry flux (PDCSAP_FLUX), which underwent additional instrumental de-trending.
Both light curves for S5 0716+714 are shown in Fig. 2.
Apart from a flux shift that has no influence on our variability analysis, they share the same behaviour. The most remarkable difference is that while the SAP_FLUX shows only one -d gap at –8856.4, the PDCSAP_FLUX presents also another gap at about 2458857. This can be explained by the fact that de-trending has been optimized for the search for exoplanets, and it is known that this can remove some of the astrophysical signals444https://outerspace.stsci.edu/display/TESS/2.1+Levels+of+
data+processing.
To verify the stability of the TESS photometry, we also extracted 30-min light curves from the Full Frame Images (FFI) with the eleanor open source python package (Feinstein
et al., 2019).
Time-stacked postcards ( pixel cutout regions of the FFIs) are created and background subtracted. Different photometric apertures (2, 3, and 4 pixels) are tested for an optimal light curve extraction. After the raw photometry for each aperture is done, eleanor
performs principal component analysis (PCA) removing all the instrument systematics to produce a corrected light curve. However, different extraction choices led to quite different light curves.
Therefore, we decided to use the MAST SAP_FLUX for our variability analysis, checking its reliability through a comparison with the ground-based WEBT data (Section 3).
Errors on SAP fluxes are extremely small, ranging from 0.3 to 0.6 per cent.
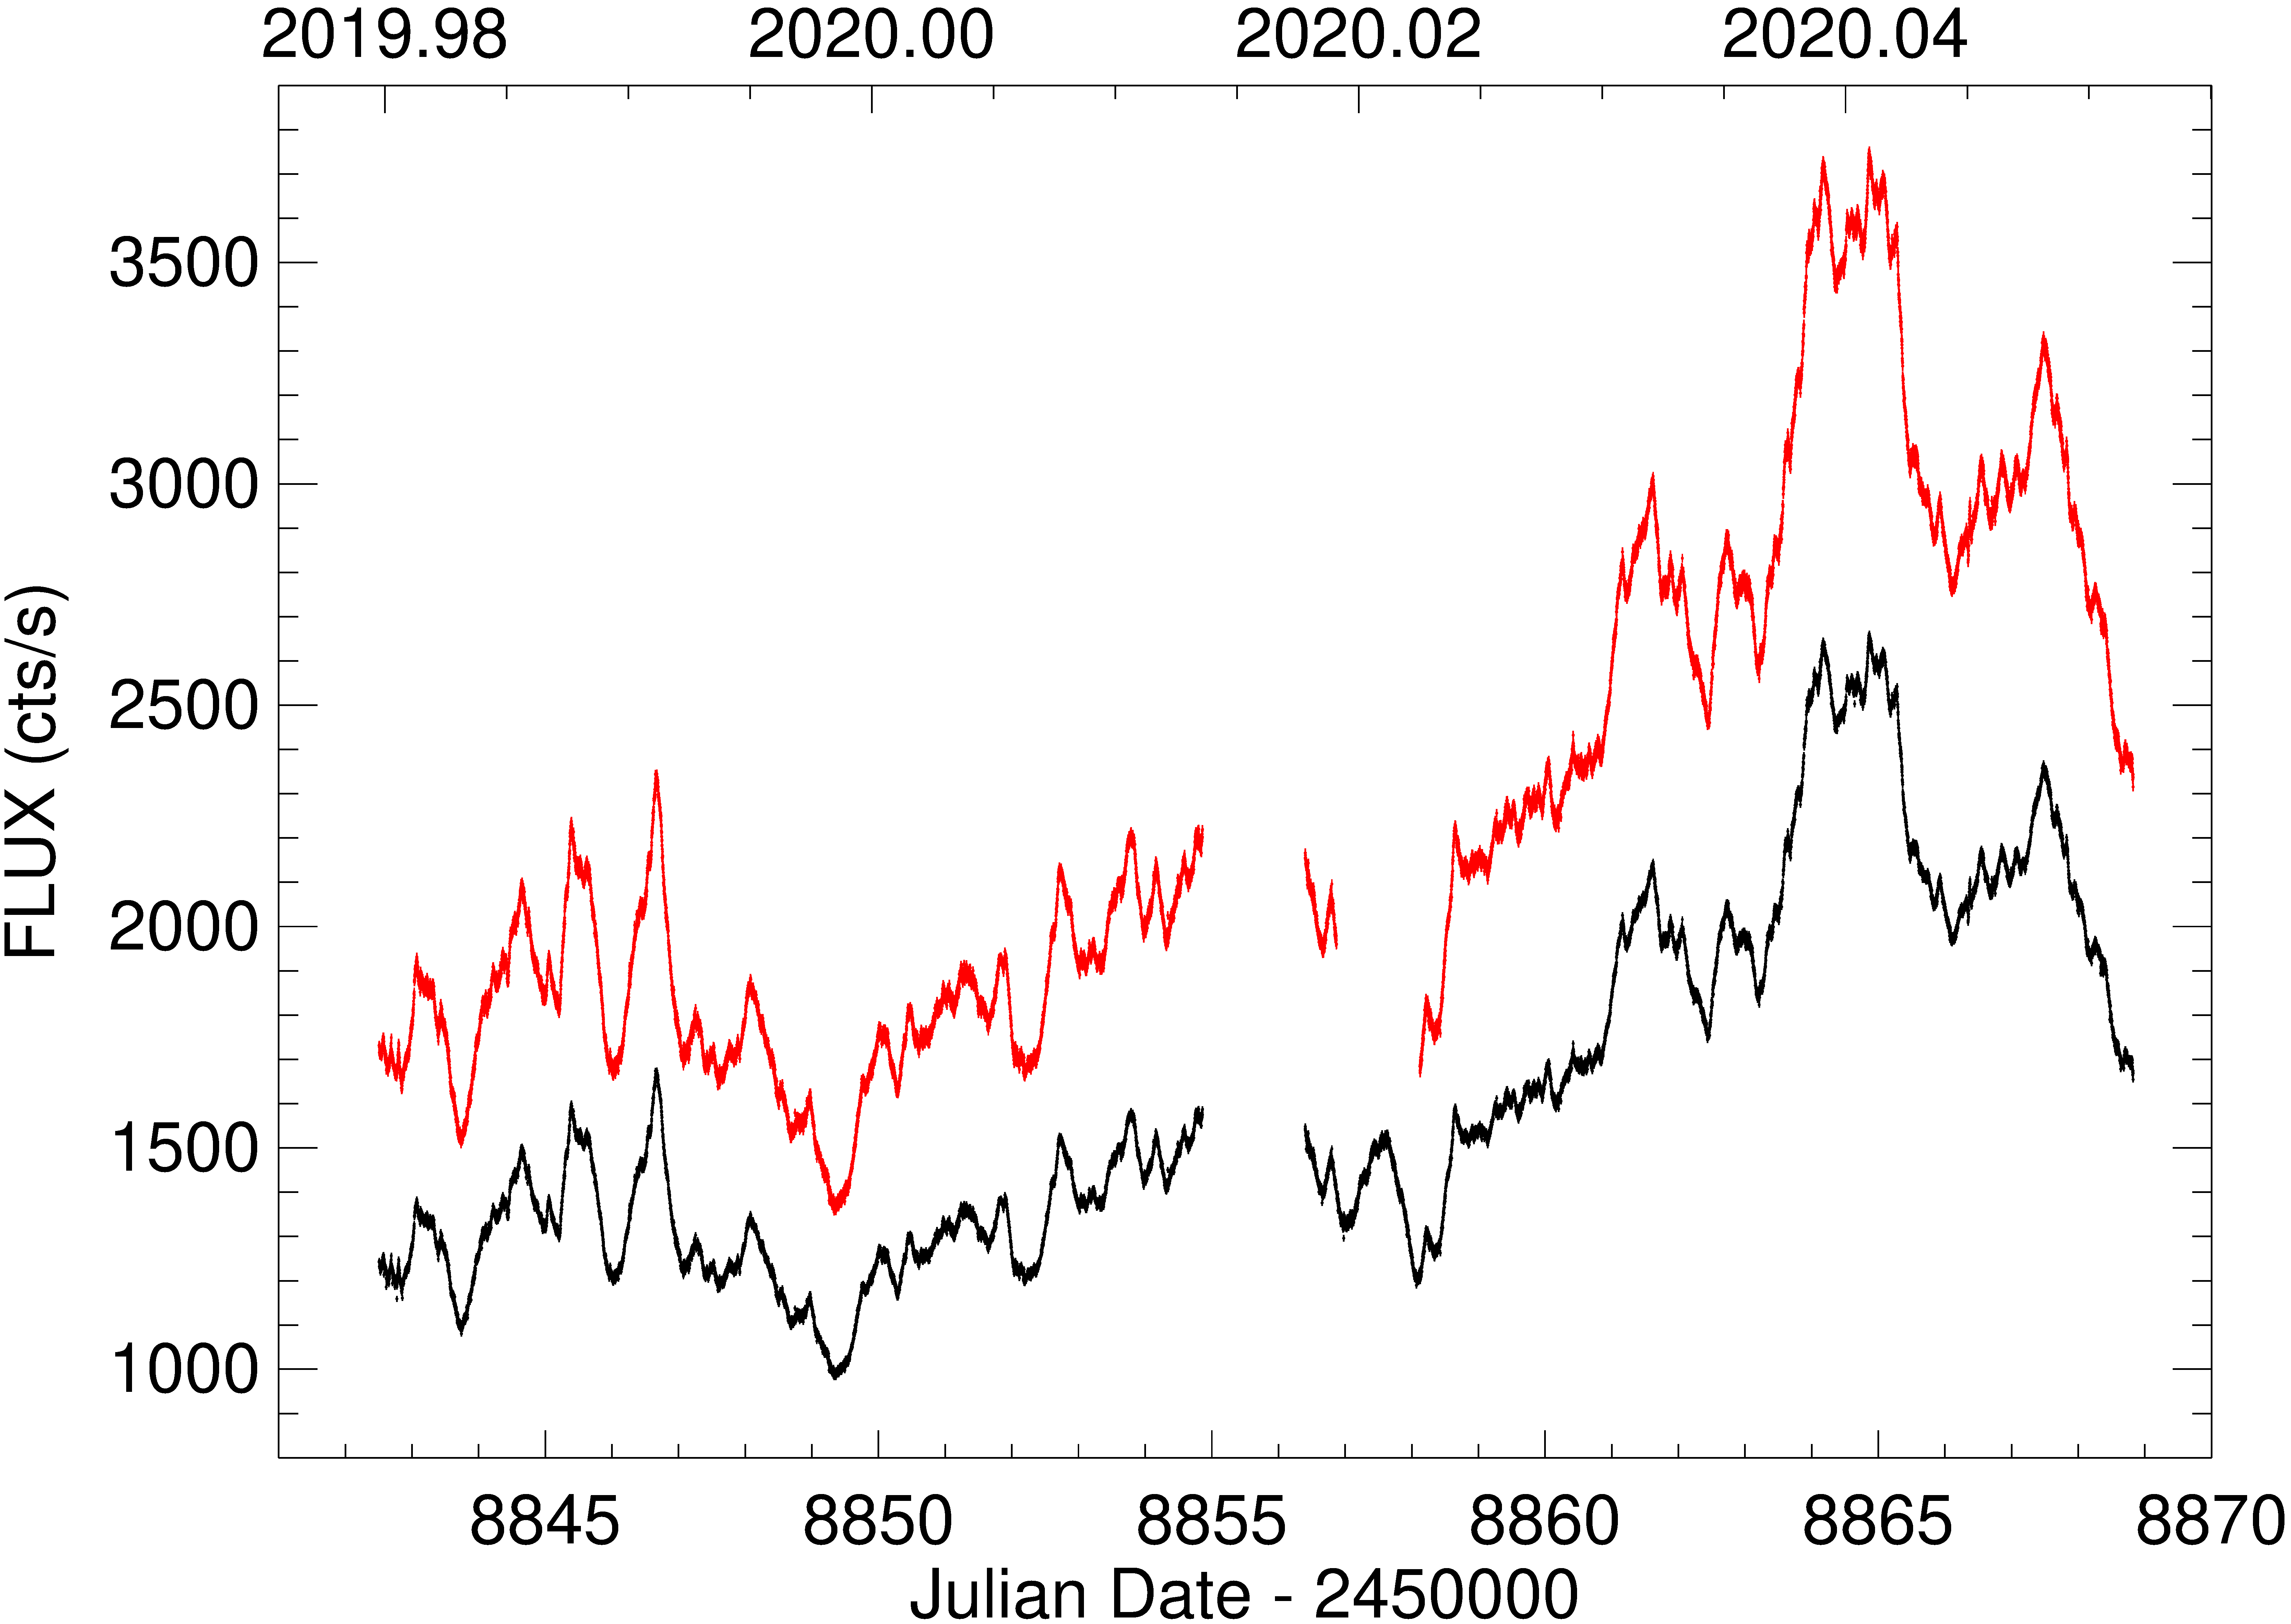
The total number of cadences is , while the number of cadences with valid (discarding null values and one strong outlier) SAP_FLUX is 17812. On the time span of , the source flux varied by a factor of about 2.7, with a fractional root mean square variability amplitude (e.g. Vaughan et al., 2003) of per cent. The light curve behaviour looks like produced by a random walk (red) noise process, with small-amplitude and fast flux changes superposed on a smoother, long-term and large-amplitude variability.
3 Observations by the WEBT
S5 0716+714 is one of the blazars regularly monitored by the WEBT Collaboration and belongs to the target list of the GLAST-AGILE Support Program (GASP; Villata et al., 2008, 2009b), which started in 2007. Previous specific works on this source that involved the WEBT were published in Villata et al. (2000); Ostorero et al. (2006); Villata et al. (2008); Chen et al. (2008) and Bhatta et al. (2016).
| Observatory | Country | Tel. size | Symbol | Colour |
|---|---|---|---|---|
| (cm) | ||||
| Abastumani | Georgia | 70 | dark green | |
| Aoyama-Gakuin | Japan | 35 | cyan | |
| ARIES | India | 130 | blue | |
| Crimean | Russia | 70 | magenta | |
| Lulin | Taiwan | 40 | cyan | |
| Mt. Maidanak | Uzbekistan | 60 | blue | |
| Osaka Kyoiku | Japan | 51 | magenta | |
| Roque de los | Spain | 260 | blue | |
| Muchachosa | ||||
| Rozhen | Bulgaria | 50/70 | black | |
| Rozhen | Bulgaria | 200 | black | |
| San Pedro Martir | Mexico | 84 | green | |
| Siena | Italy | 30 | black | |
| Sirio | Italy | 25 | orange | |
| St. Petersburg | Russia | 40 | green | |
| Teideb | Spain | 120 | blue | |
| Tijarafe | Spain | 40 | red |
a Nordic Optical Telescope (NOT)
b STELLA-I telescope
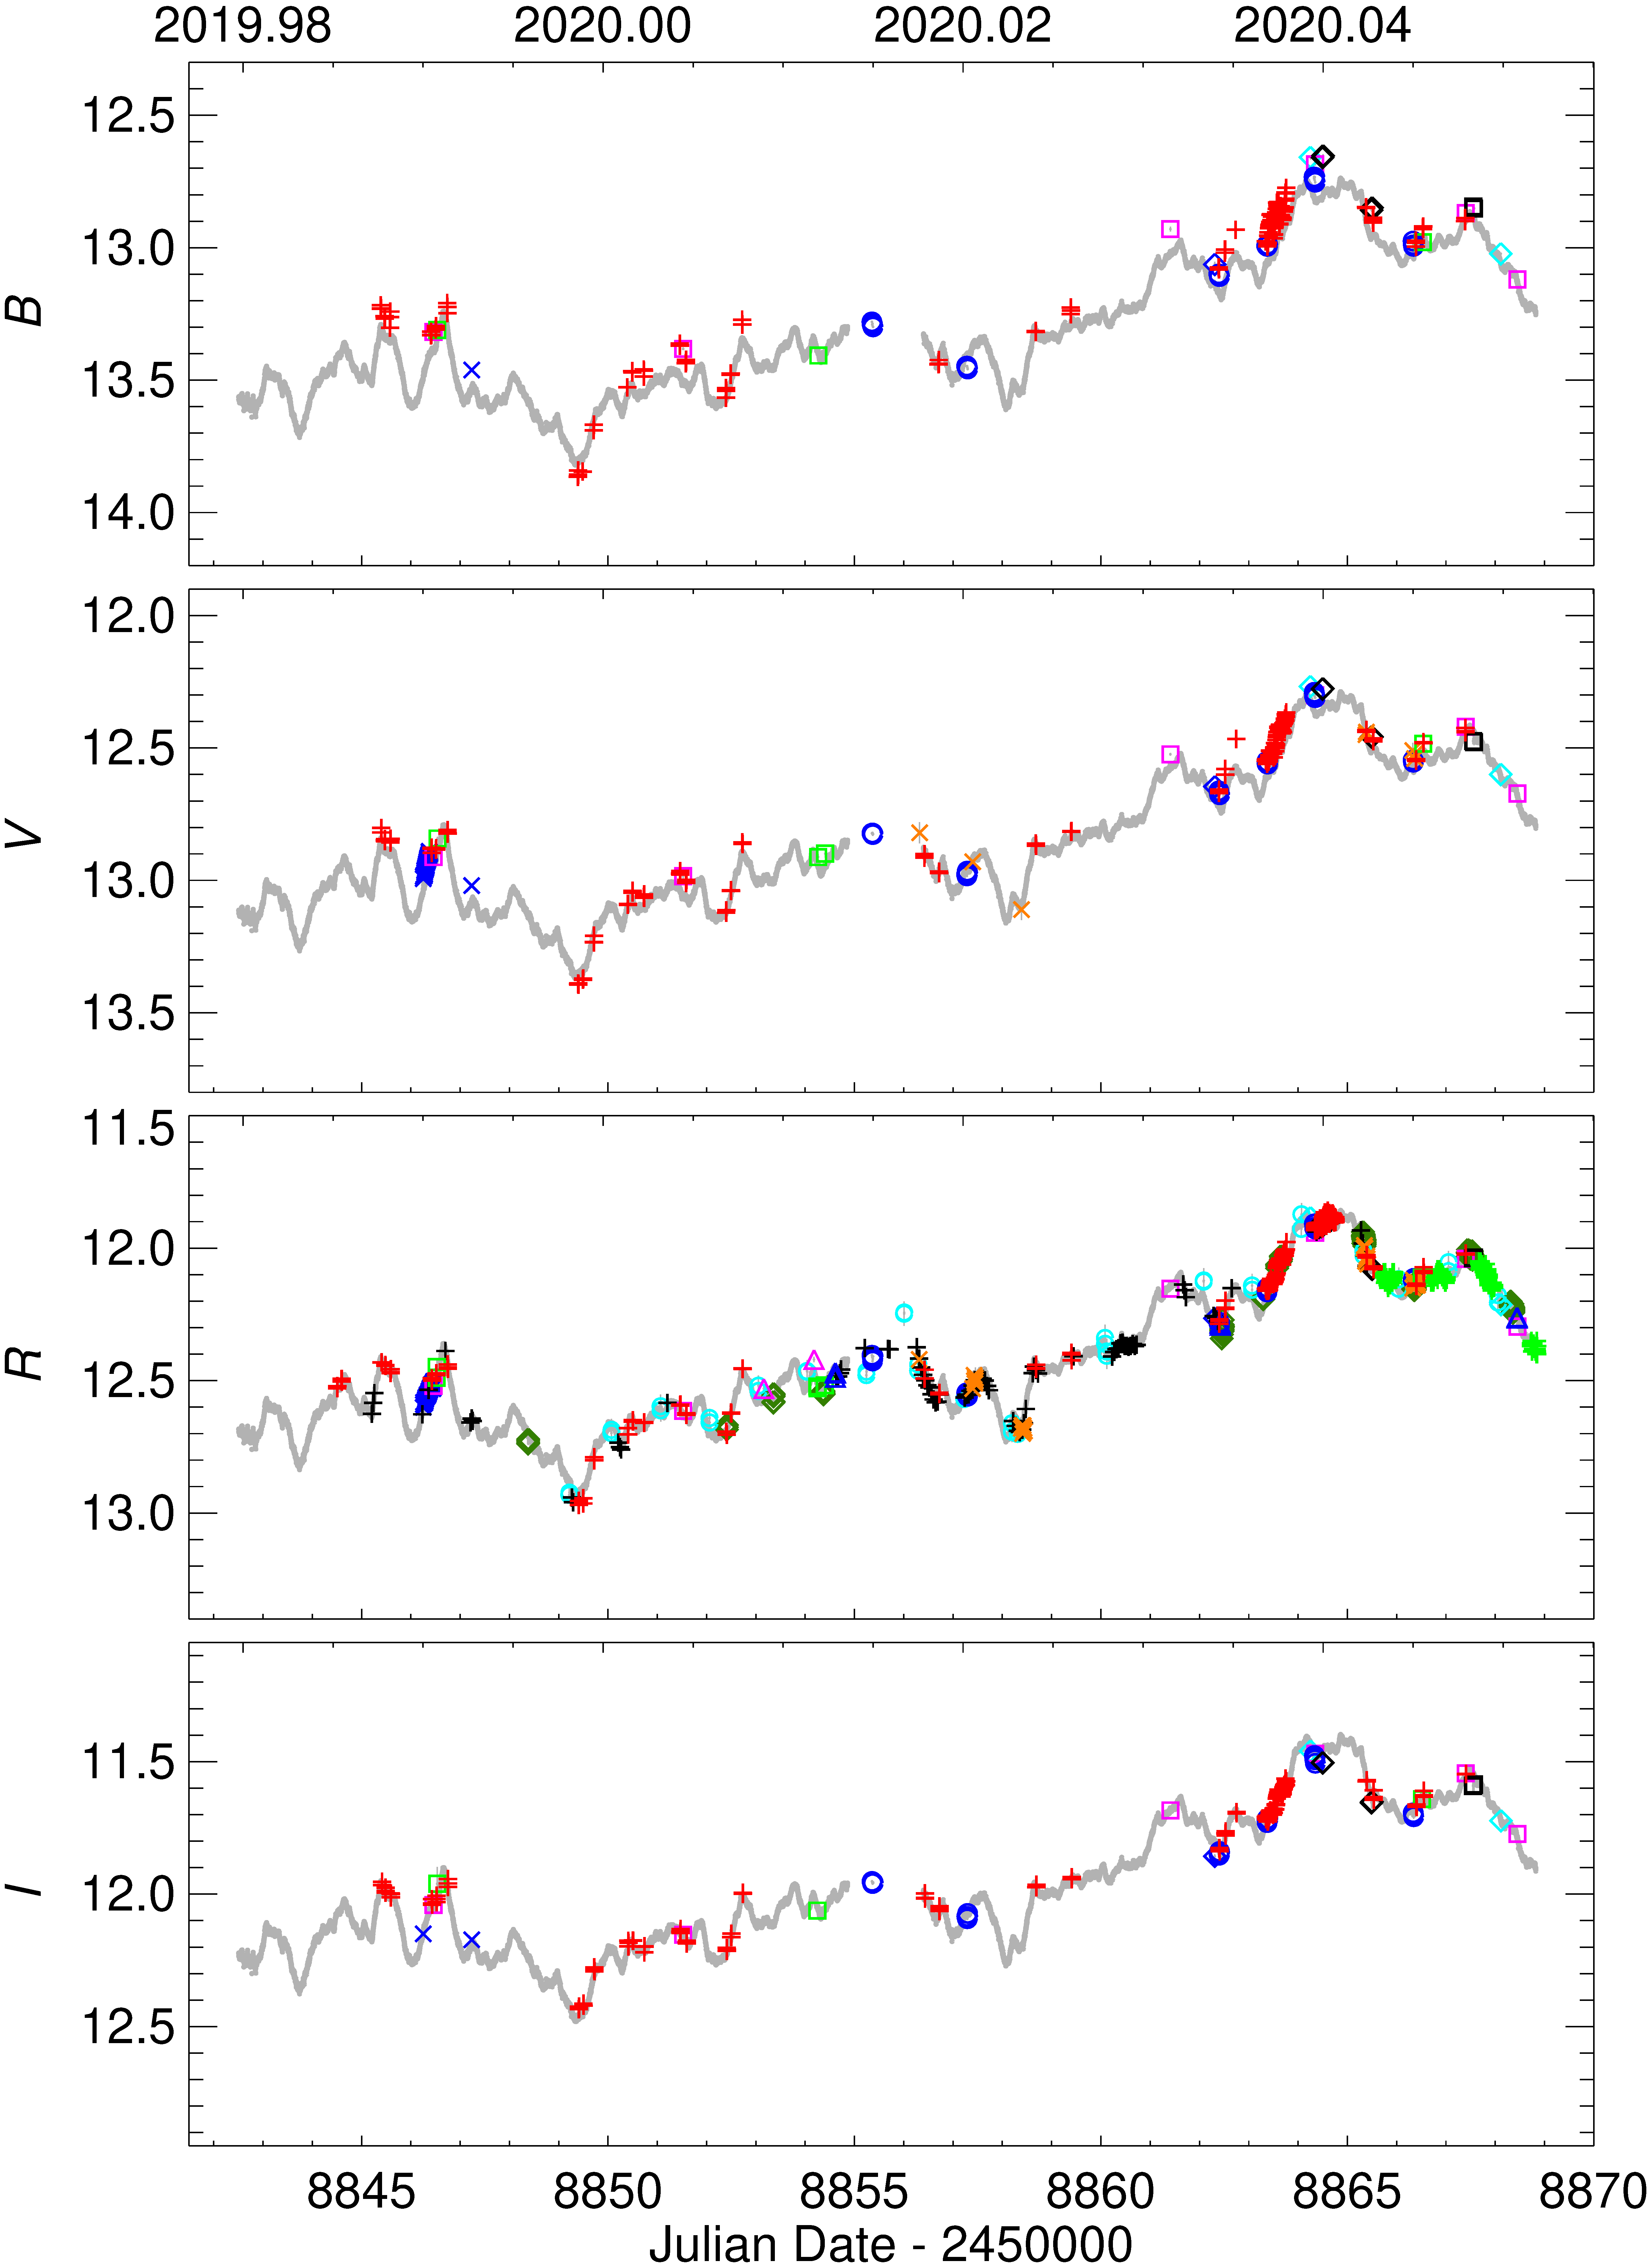
Table 1 shows the WEBT observatories which supported the TESS monitoring of S5 0716+714 with multiband observations. These were mainly done in the Johnson-Cousins bands, with a few data acquired in Johnson’s and Sloan’s bands. Data reduction was performed with standard methods. Calibration of the source was obtained using the photometric sequences by Villata et al. (1998a) in , Ghisellini et al. (1997) in , González-Pérez et al. (2001) in ; data were calibrated with Pan-STARRS PS1 data555https://panstarrs.stsci.edu/. In total, the WEBT collected 2200 data points, 1491 of which in the band.
We assembled the different datasets and carefully inspected the WEBT multiband light curves night per night. A handful of outliers were removed. We had to apply small shifts to a couple of datasets in band and to one dataset in band to align them to the common trend. In this way we obtained homogeneous light curves. These are plotted in Fig. 3 and reveal that the source was in a fairly bright state when compared to past observations (e.g. Villata et al., 2000; Raiteri et al., 2003; Hagen-Thorn et al., 2006; Villata et al., 2008). They also show that the variability amplitude increases from red to blue, as usually found in BL Lac objects. The differences between the maximum and minimum magnitude are 0.974, 1.111, 1.125, 1.212 in , respectively.
Fig. 3 also shows the TESS fluxes transformed into “equivalent" magnitudes according to the formula: (SAP_FLUX), where the zero-point mags are: in , respectively. These values have been set empirically to make the TESS light curve match the overall behaviour of the WEBT ones, and represent average offsets over the whole light curves. The comparison between the space- and ground-based data reveals an excellent agreement. The differences in variability amplitude in and especially in can be ascribed to the fact that the TESS spectral response function666https://heasarc.gsfc.nasa.gov/docs/tess/the-tess-space-telescope.html is very wide and covers the whole spectral range of the and bands, most of the spectral range of the band, but overlaps only in part with the -band transmission curve, and has practically no overlap with that of the band.
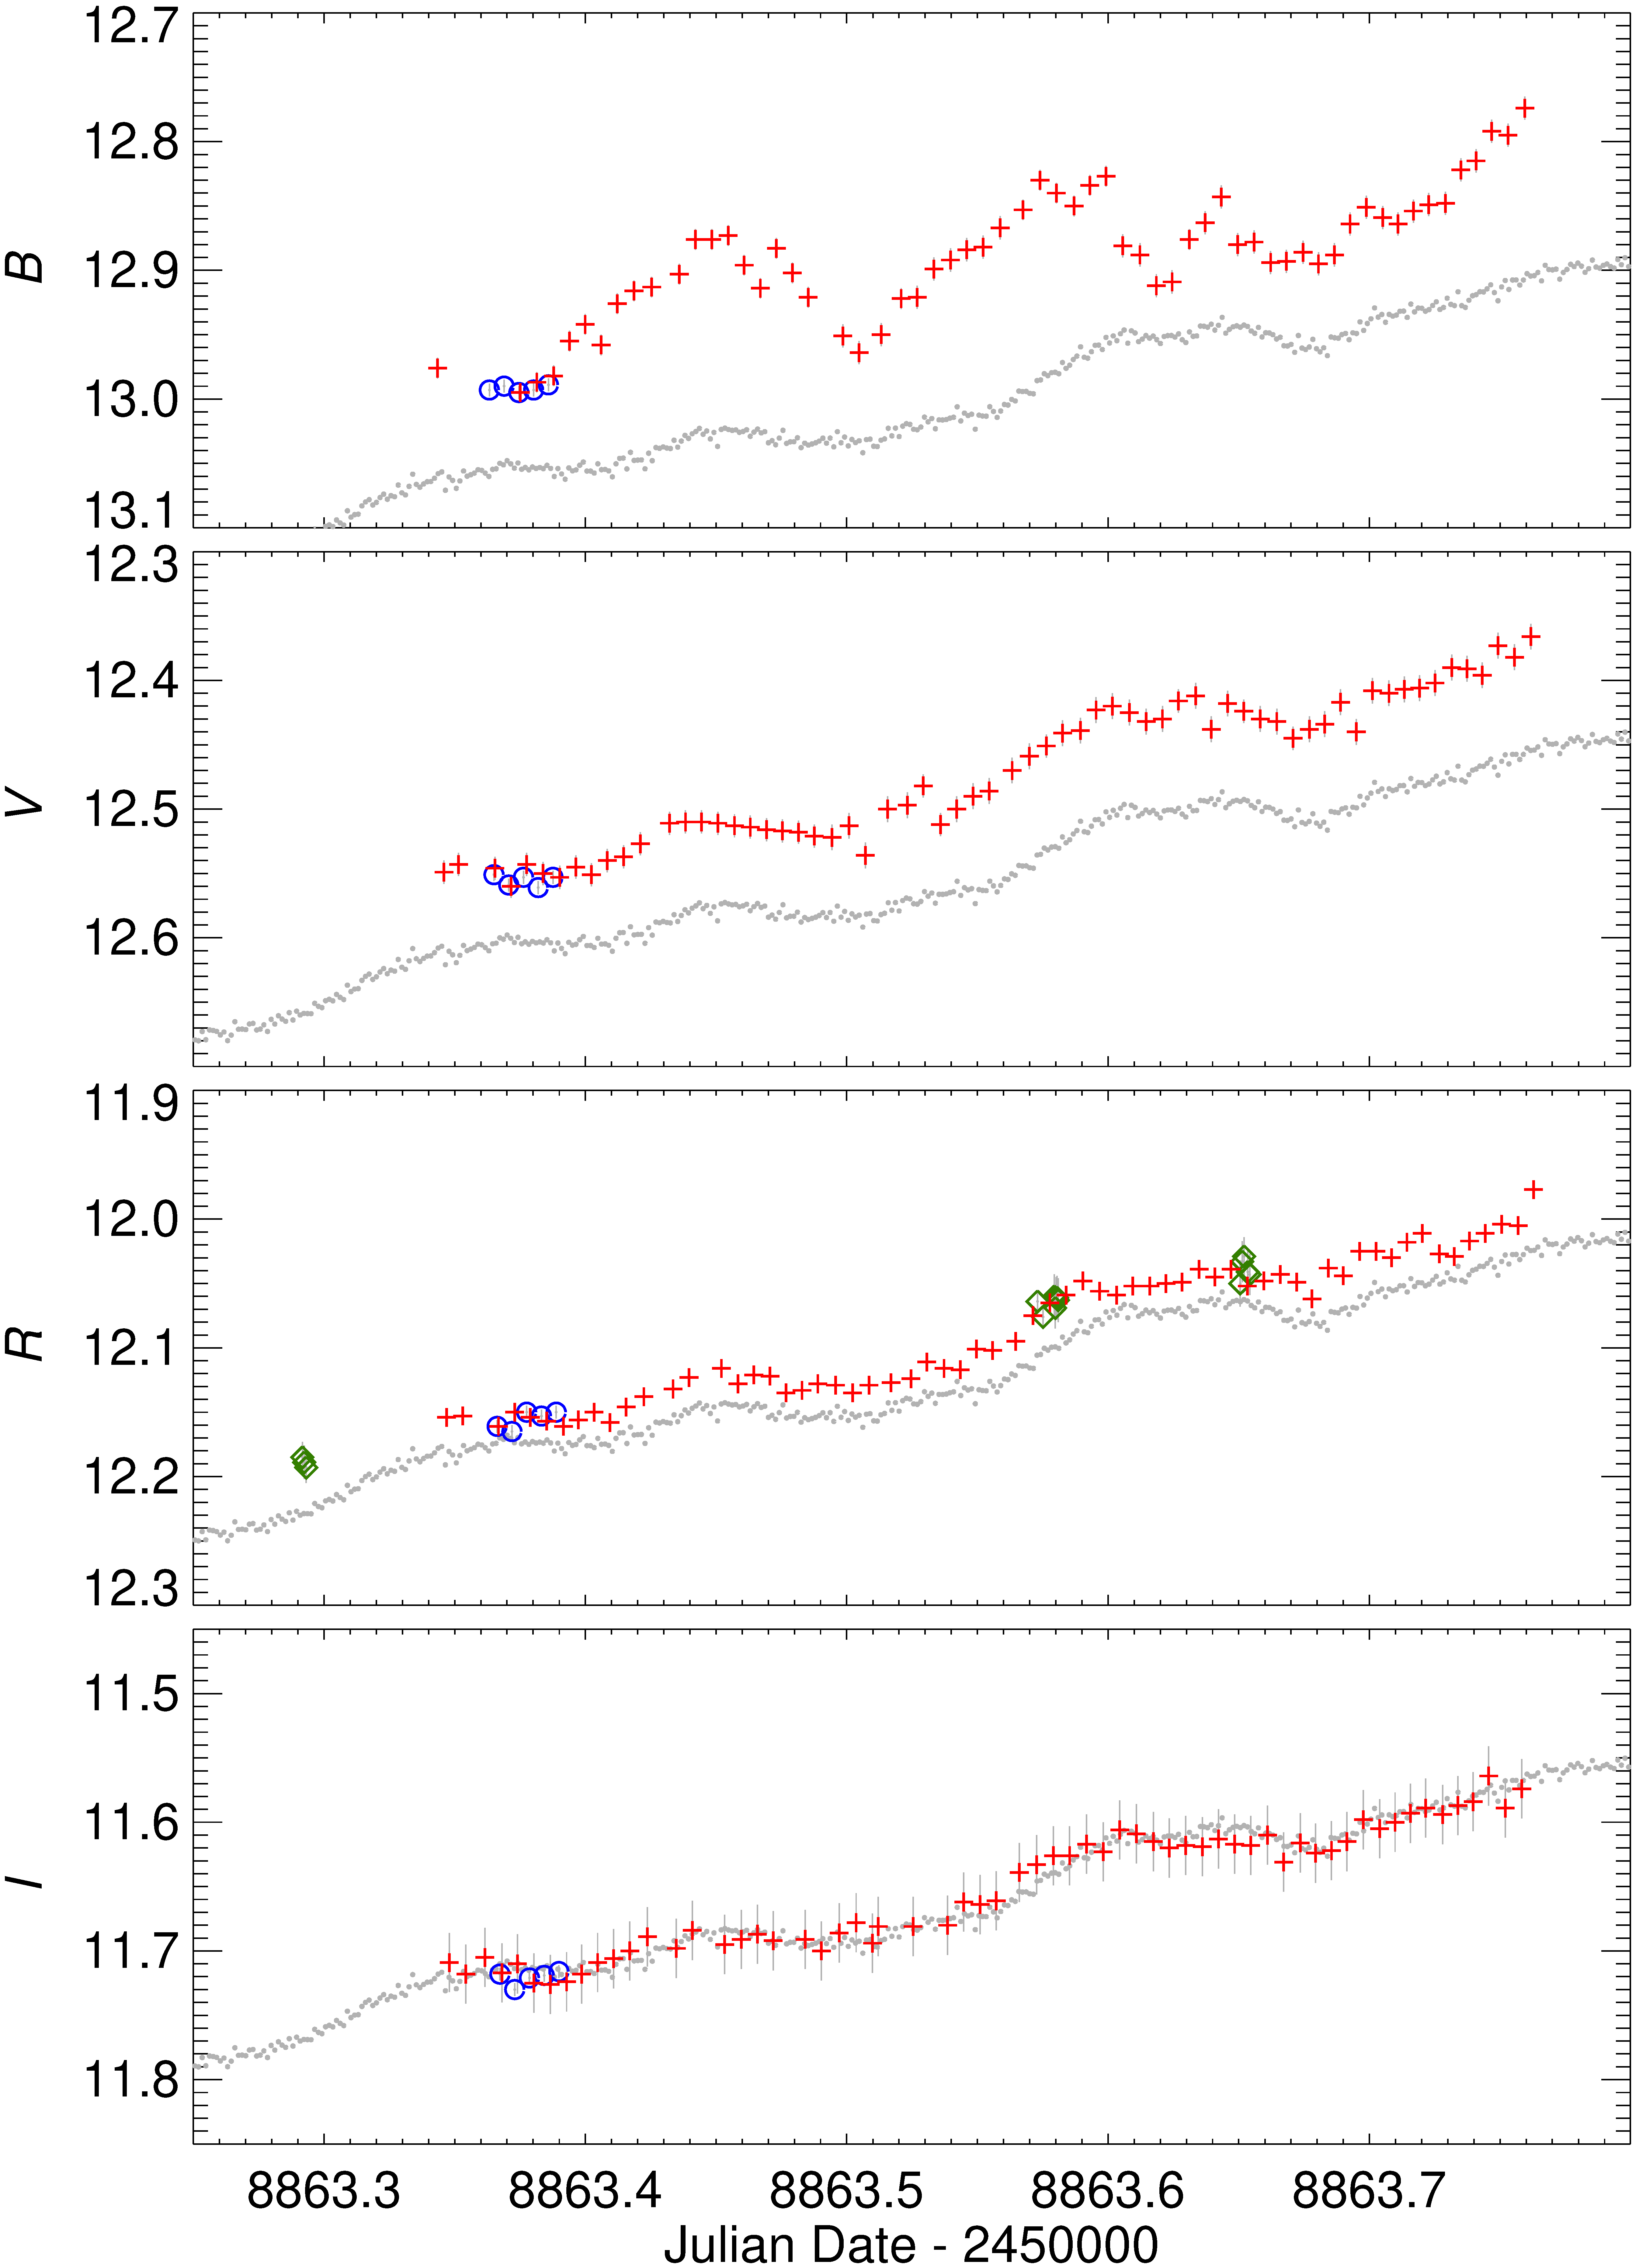
A better view on the brightness and spectral short-term variability is given in Fig. 4, which presents a zoom into the multiband light curves on . The TESS light curve is reported here with the same scaling as in Fig. 3. As mentioned above, the zero points were set by considering the bulk behaviour over the whole TESS observing period. A comparison with Fig. 3 shows that on the source was in a relatively high state, so we expect differences between ground and space data, more pronounced toward the blue, i.e. moving away from the TESS passband. Indeed, the densely-sampled intra-night observations at the Tijarafe Observatory show an excellent agreement with the TESS light curve in band, while ground-based data in , and bands show increasing deviations from the space data and increasing oscillation amplitudes. The offset between space and ground data is of the order of mag in band, and ranges between 0.04 and 0.08 mag in band and between 0.04 and 0.15 mag in band. We also notice that the brightness rising phase starting at in band possibly leads the corresponding variation in band; lags in and bands are difficult to assess because of the smaller variability.
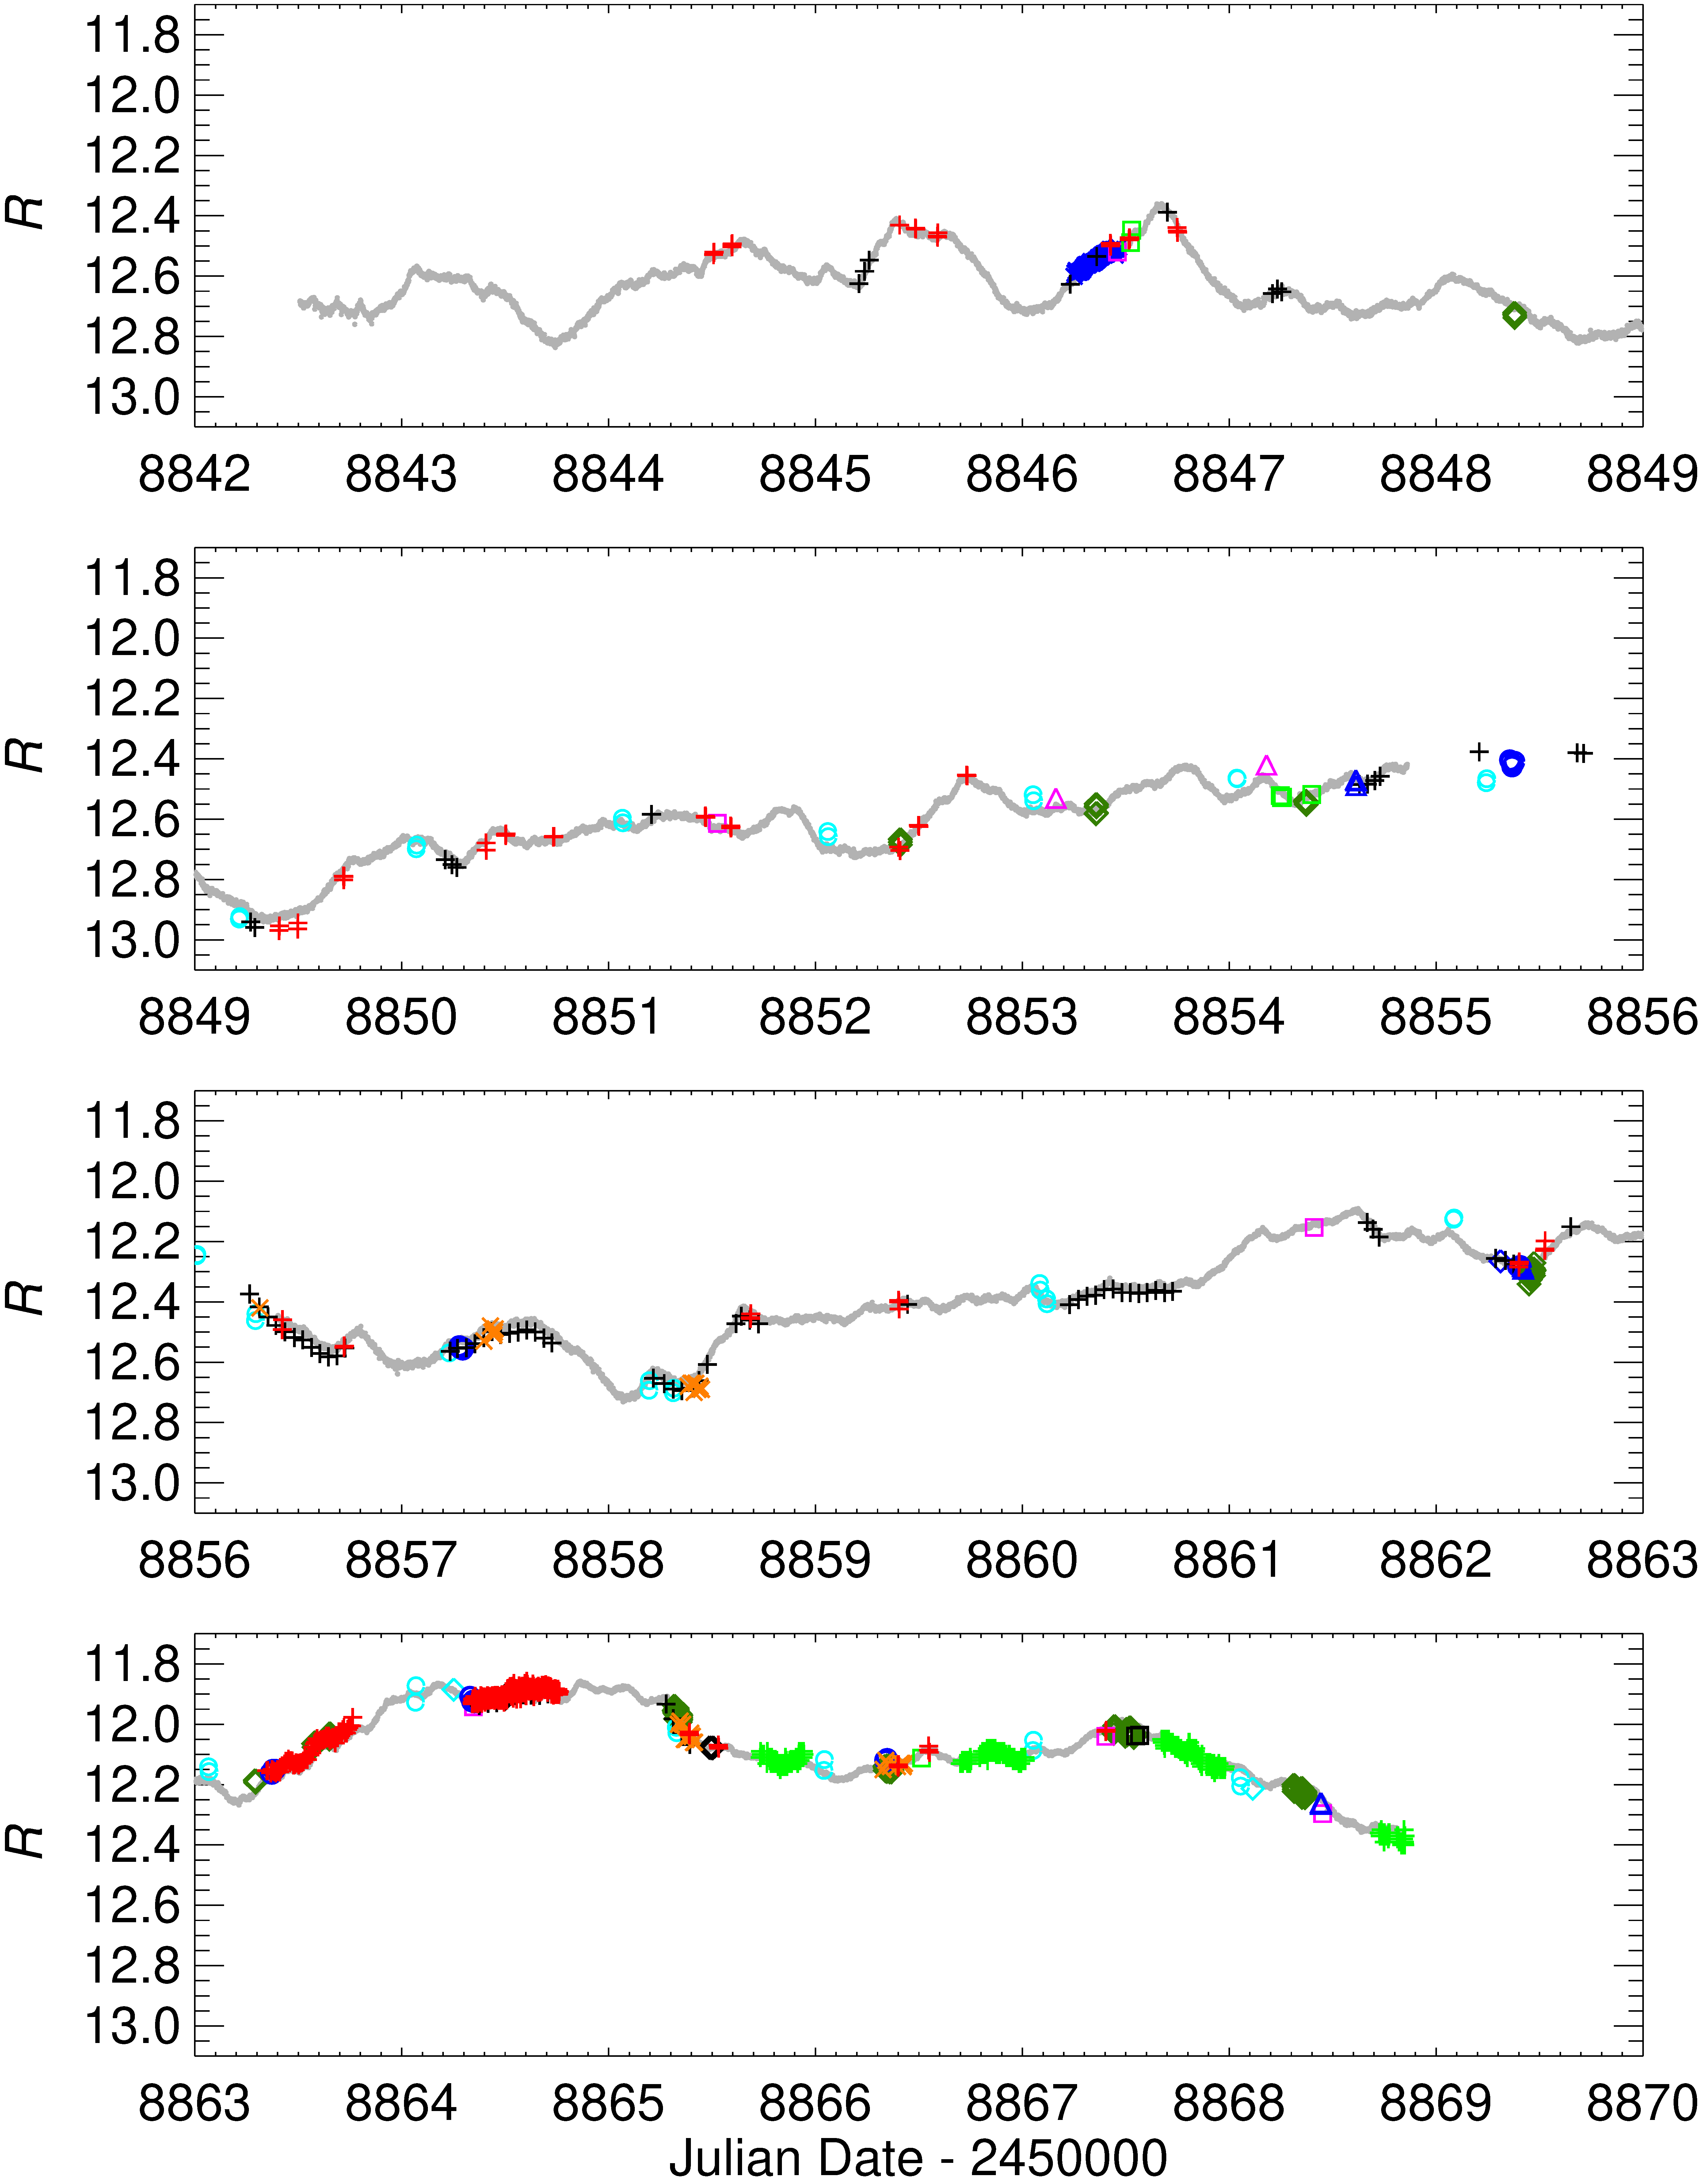
Microvariability on the whole TESS observing period can be appreciated in Fig. 5, where we show again the WEBT -band light curve folded in time intervals of one week, superposed to the TESS light curve. The WEBT sampling is sparse in the first week and becomes denser thereafter, especially in the last week. Long intra-night sequences were made at the San Pedro Martir, Siena, and Tijarafe observatories. These sequences follow very closely the trend traced by the 2-min cadence TESS data. The good agreement between the ground and space data also provides a validation of the TESS photometry.


S5 0716+714 is a distant BL Lac object, therefore its optical emission is completely dominated by the non-thermal synchrotron emission from the jet. Fig. 6 shows the optical spectral energy distributions (SEDs) in the usual versus representation at various epochs during the TESS pointing period. SEDs have been built with data from the WEBT Collaboration binned in time intervals of 0.2 d, i.e. the data points belonging to a given SED represent averages of data acquired within 4.8 h. Magnitudes have been corrected for Galactic extinction using the values of the NASA/IPAC Extragalactic Database777https://ned.ipac.caltech.edu/ (NED), and then transformed into flux densities adopting the zero-point values of Bessell et al. (1998).
The SEDs show a variety of spectral shapes and there is not a clear trend with brightness. However, the faintest states display a soft spectrum, suggesting that the synchrotron frequency peak is in the red part of the spectrum, while the brightest states indicate that the peak has moved toward the blue part.
To further analyse the optical spectral variability, we plot in Fig. 7 the colour indices obtained by coupling and data points taken by the same telescope within 30 min. This represents a stricter constraint than that used to build the SEDs. We obtained 180 colours, with an average value 0.82 and standard deviation 0.04. The figure shows that spectral changes on short time-scales, even within the same night, span almost the whole range of values. This means that the long-term flux oscillations are much less chromatic than the fast flux changes. The strong spectral variations on short time-scales are not simply correlated with the flux, as the data acquired on demonstrate. There, a bluer-when-brighter trend can be seen if we correlate the colour index with the small and fast flux changes that are superposed on the quasi-linear increasing base level. We will come back to this point in Section 6.
The bulk behaviour of versus shows only a mild bluer-when-brighter trend, ascribable to the long-term flux variability, with . This has been inferred by defining a stripe whose boundaries follow the maxima and minima trends. In comparison, the ratio between the maximum colour difference and the -band range spanned by the points used to build colours is 0.15, i.e. more than 4 times larger.
From the and de-reddened flux densities we derive the optical spectral index (). It ranges from 0.95 to 1.34, with a mean value of 1.14 and standard deviation 0.09. All values below unity, which indicate a hard spectrum, belong to bright states, while the faintest states are characterized by the largest values, i.e. the softest spectra. This confirms what was already noticed above for the SEDs. Moreover, from both spectra and colour indices it can be seen that spectral hardness is not strictly depending on brightness (apart from the most extreme states), but it most likely depends on the very fast changes, according to the harder-when-brighter relation noted above and already reported by Ghisellini et al. (1997) and Raiteri et al. (2003) for the same source in earlier periods. This double (long and short-term) chromatism is rather common in BL Lac objects, as shown e.g. for BL Lacertae during WEBT campaigns (Villata et al., 2002, 2004; Papadakis et al., 2007).
4 Observations by Swift
The multiband WEBT data presented in Section 3 provide spectral information in the optical wavelength range. To extend the spectral information to higher frequencies, we asked for ToO observations by the Neil Gehrels Swift Observatory during the TESS pointing. Swift can provide data in the optical (, , and bands) and ultraviolet (, , and bands) with the 30-cm Ultraviolet/Optical telescope (UVOT, Roming et al., 2005), and at X-rays (0.3–10 keV) with the X-ray Telescope (XRT, Burrows et al., 2005). We processed the satellite data with the HEASoft software and calibration data available at NASA’s High Energy Astrophysics Science Archive Research Center888https://heasarc.gsfc.nasa.gov/ (HEASARC), following standard procedures.
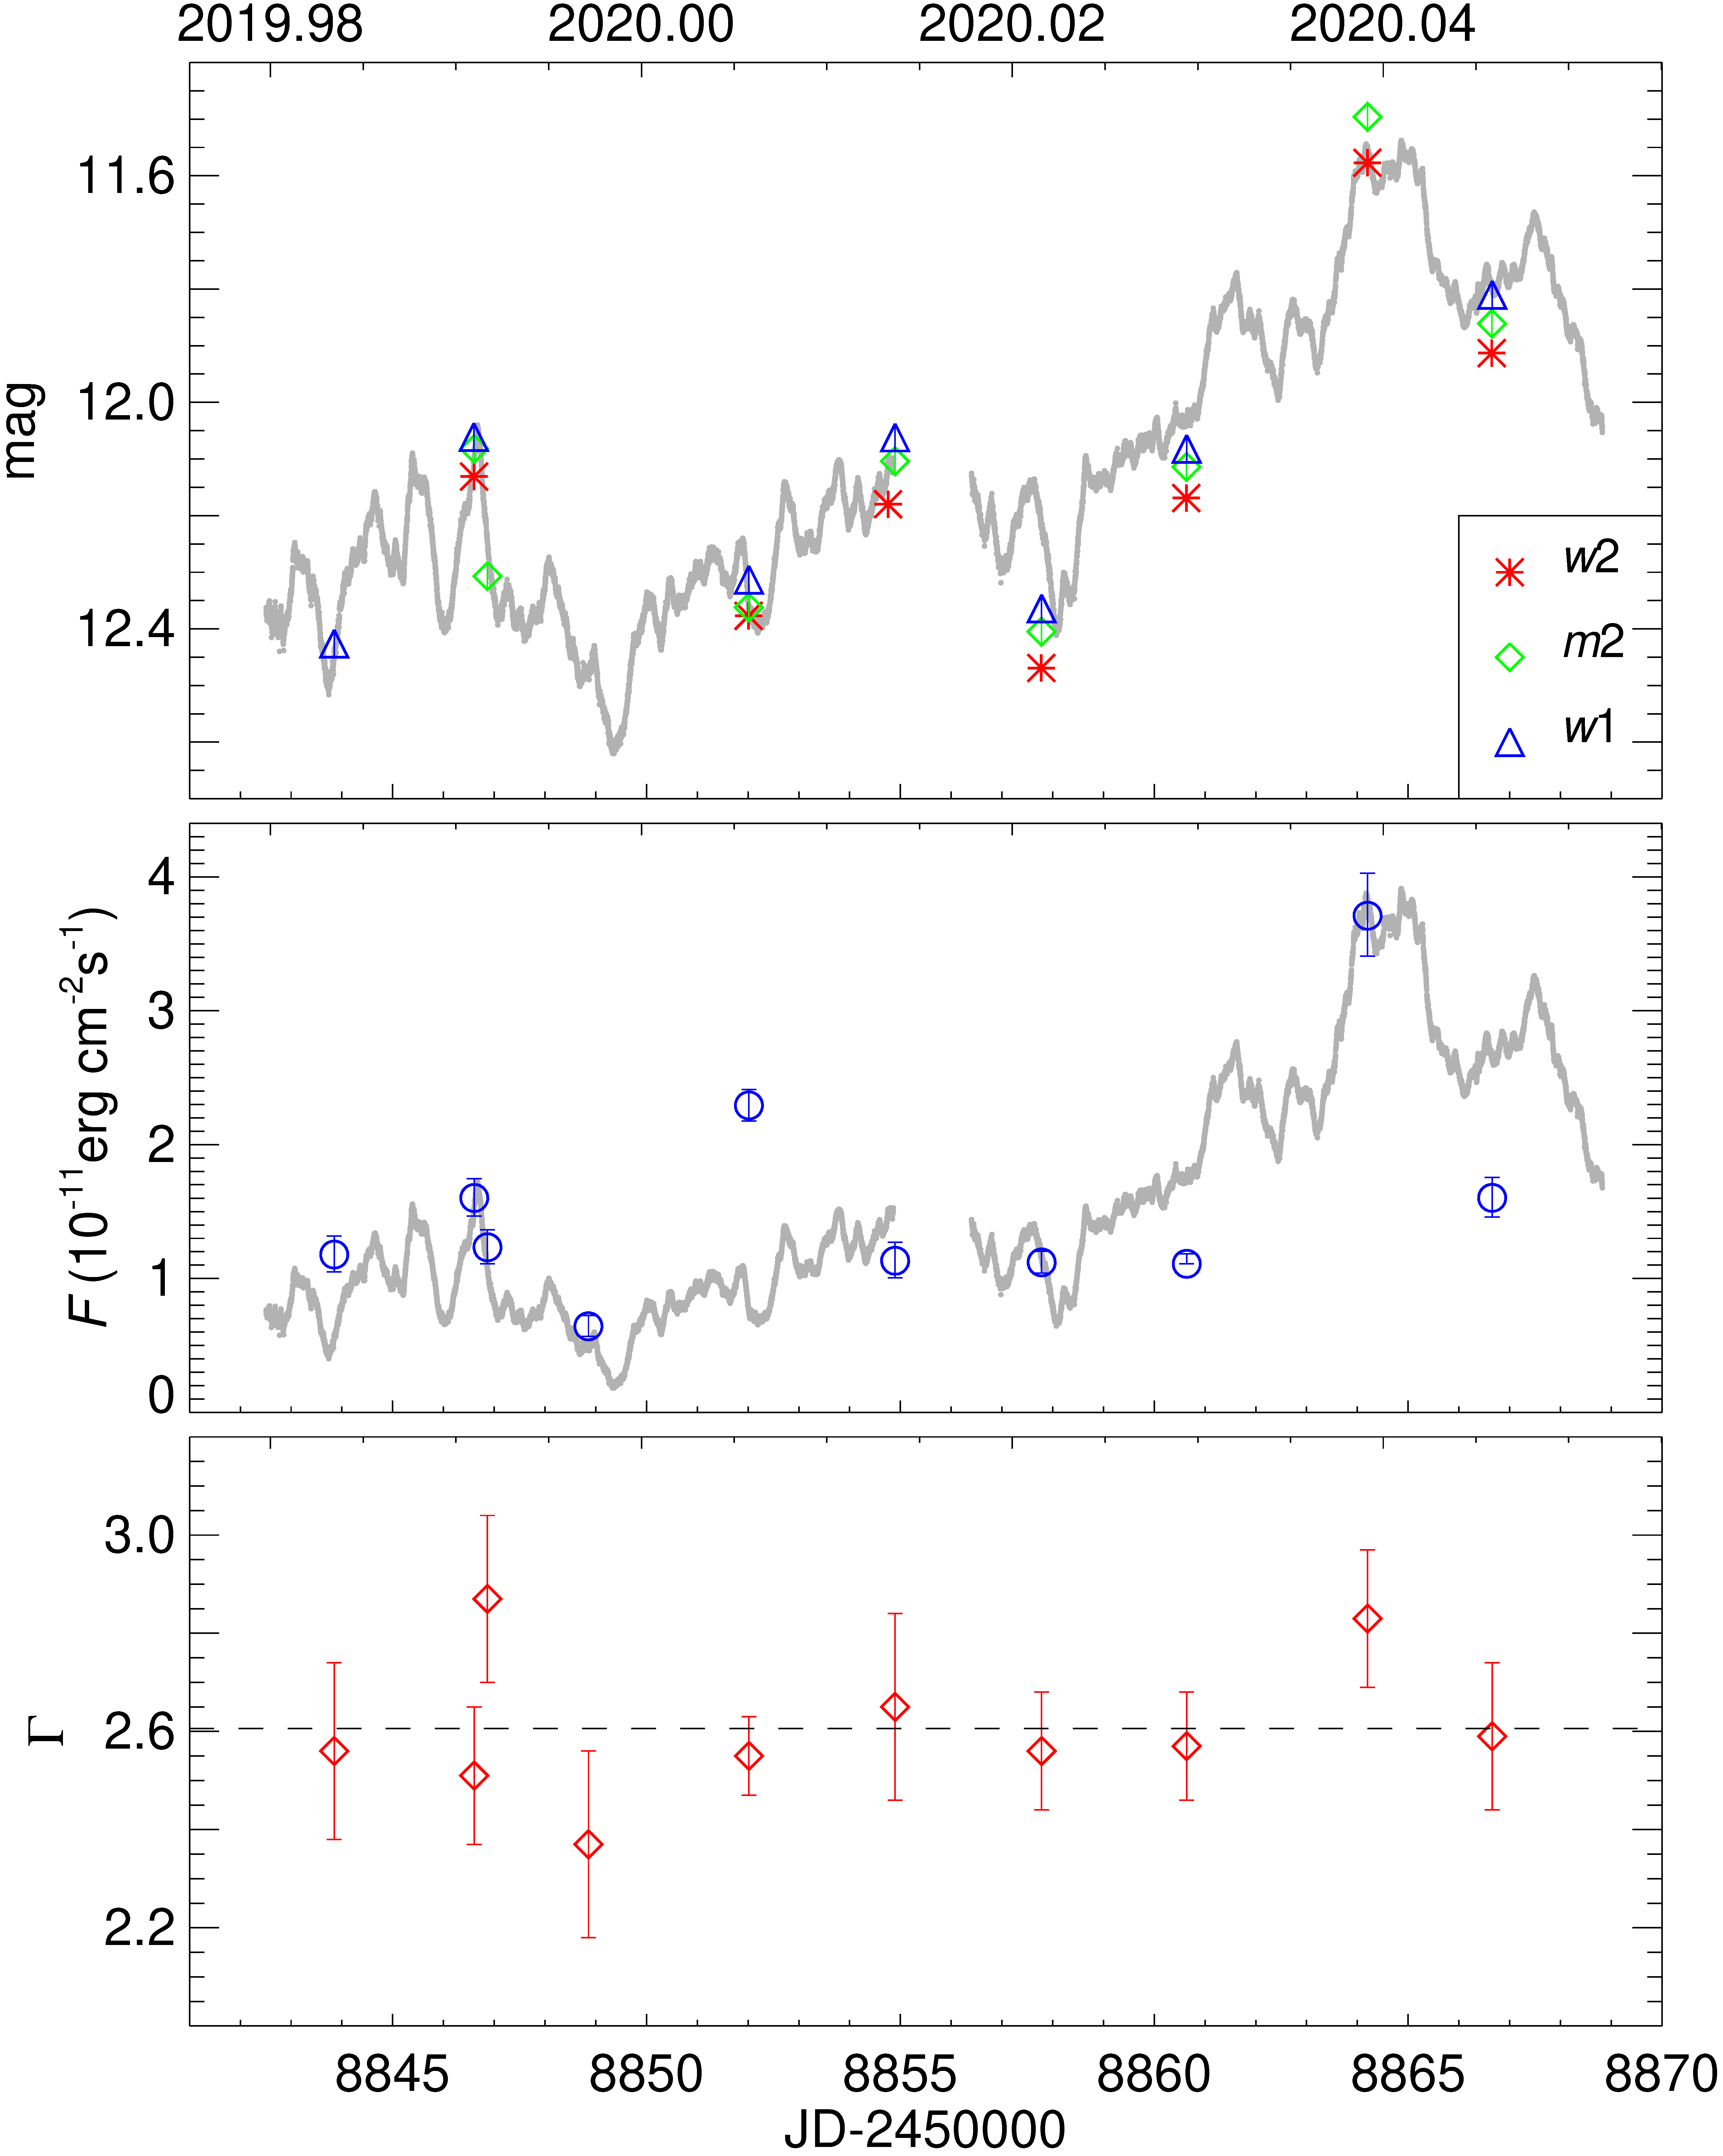
The S5 0716+714 counts were extracted from the UVOT images within a circle of 5 arcsec radius centred on the source, and background counts within a 20 arcsec radius circular region in the surroundings. We checked that the source is not affected by small scale sensitivity problems. The UVOT ultraviolet light curves are plotted in Fig. 8.

The same figure also shows the source fluxes in the 0.3–10 keV energy range. They were obtained by fitting the XRT data with an absorbed power-law model using the XSPEC software. The hydrogen column density was fixed to the Galactic value derived999https://www.astro.uni-bonn.de/hisurvey/AllSky_profiles/ from the Effelsberg-Bonn H i Survey (Winkel et al., 2016). Because of the low number of counts we used the Cash statistics (Cash, 1979). As can be seen in Fig. 9, which displays the XRT spectrum of 2020 January 3 () together with the best-fit absorbed power-law, the model gives a good description of the data.
The comparison between the source behaviour in the ultraviolet and X-ray bands and the TESS light curve reveals some interesting features. The ultraviolet magnitudes fairly agree with the TESS fluxes properly scaled as . In line with what has been already noticed for the optical bands in Section 3, the variability amplitude in ultraviolet appears larger than in the TESS band. The X-ray light curve sometimes correlates with the optical one, while sometimes it does not. In particular, the X-ray flux is higher than expected on and lower on 8860 and 8866. The former case suggests that the X-ray emission can receive an additional contribution from a source that does not affect the optical output. The latter cases may indicate that the mechanism which leads to the long-term oscillation of the baseline optical flux level is much less effective at X-rays.
The photon index , shown in Fig. 8, is affected by large uncertainties and is in general compatible with its average value . It never goes below , which means that the X-ray spectrum of S5 0716+714 is always soft. This in turn implies that the 0.3–10 keV flux receives a dominant emission contribution from the synchrotron process rather than from the inverse-Compton process that is responsible for the emission at hard X-ray and -ray energies. We note that the dimmest X-ray level corresponds to the hardest X-ray spectrum and the brightest X-ray level is characterized by a softer spectrum than average. Therefore, it seems that when the synchrotron emission is fainter, the larger weight of the inverse-Compton contribution makes the spectrum harder.
We finally note the fast brightness decrease in the band on 2019 December 29 (–8846.9), with a change of more than 0.2 mag (from to ) in 0.26 d. This decrease is consistent with the behaviour in the optical band, as highlighted by the TESS light curve. Contemporaneously, the X-ray flux decreased by about 30 per cent. We also checked for significant flux changes within the same ObsID. On 2020 January 6 (–8854.9) we detected an increase of the source X-ray count rate by a factor , from to in 0.27 d with a significance. In the same epoch, we have a double measurement in the UVOT band, showing a brightening from to in nearly the same time span.
5 Time series analysis of TESS data
5.1 Power spectrum
We now investigate the processes at work in the TESS light curve by means of the periodogram. The periodogram is obtained by performing the Fourier transform of a time series and gives an estimate of its power spectral density (PSD, also named power spectrum) (see VanderPlas, 2018, for a review). When modelled as a power law: , where is the frequency, the spectral index depends on the noise process: characterizes white noise, flicker noise, and red (or random-walk) noise. Because of the presence of a gap in the data, we estimate the PSD with methods for unevenly sampled datasets, based on discrete Fourier transform (Lomb, 1976; Scargle, 1982; Horne & Baliunas, 1986; Press et al., 1992).
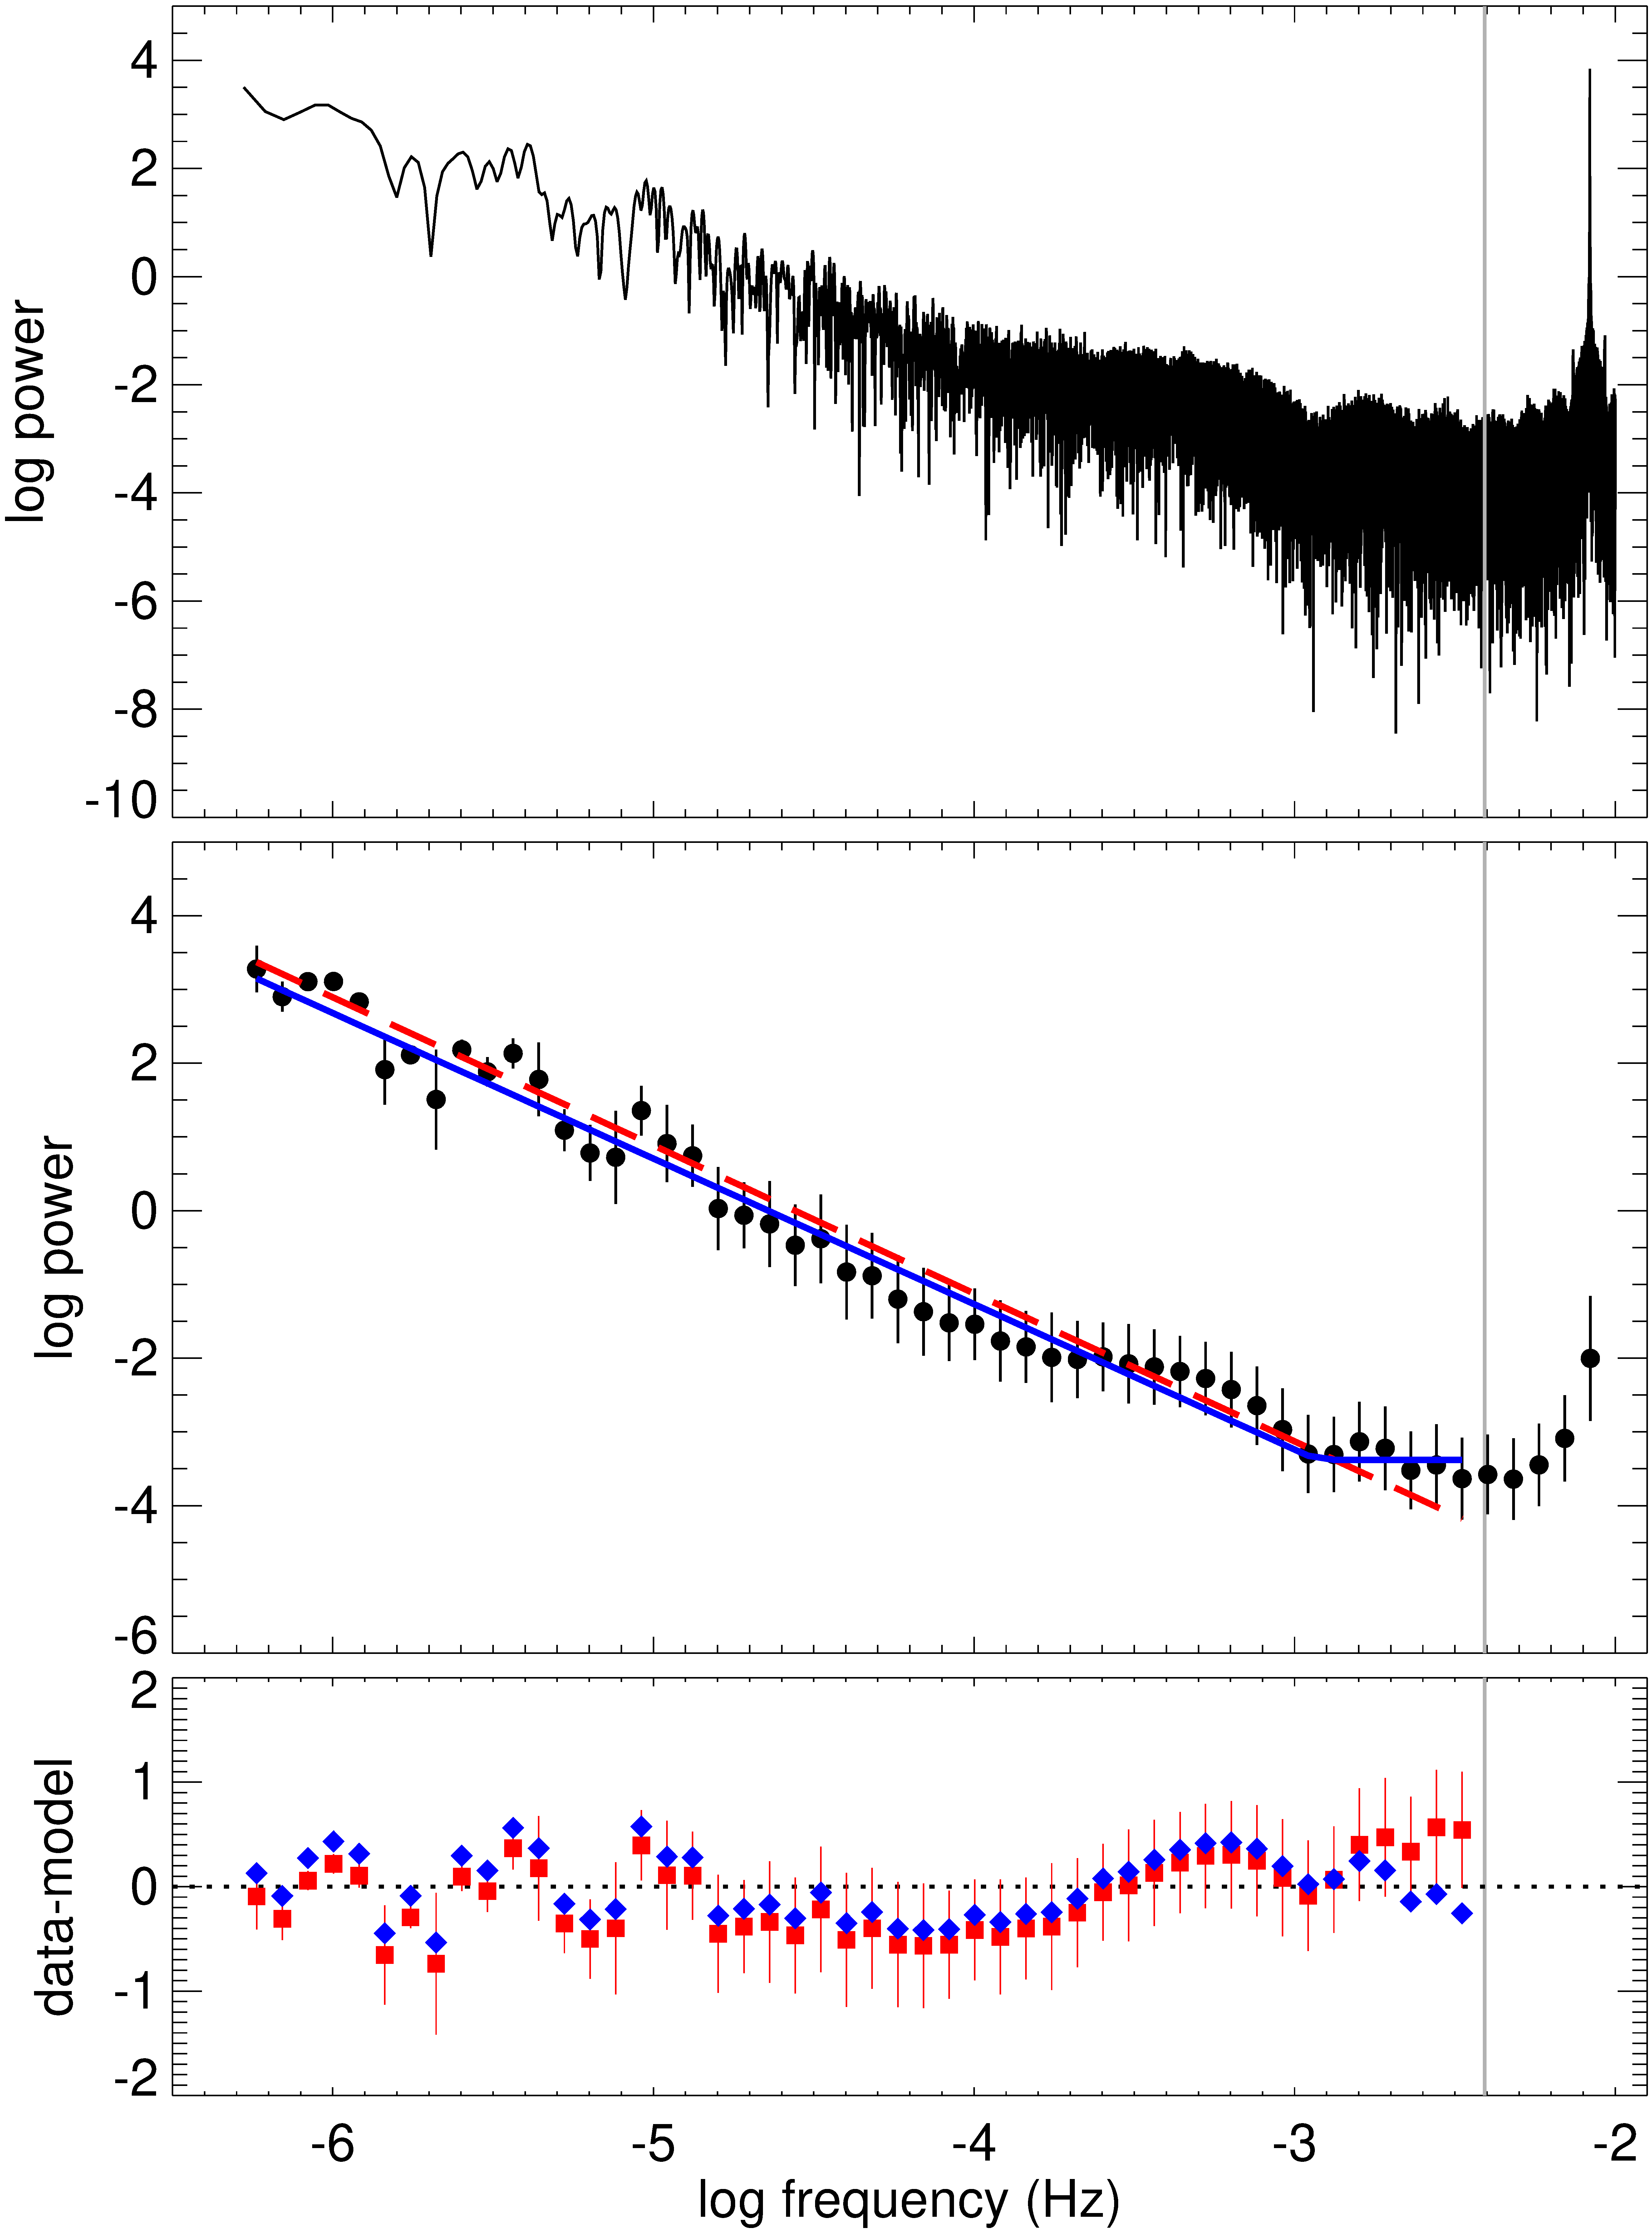
Fig. 10 shows the periodogram versus frequency in a log-log plot. An oversampling factor of 5 was used to increase the number of frequencies for which the power is calculated (Press et al., 1992). The periodogram displays a roughly linear decreasing trend for frequencies lower than the Nyquist critical frequency (), where is the number of points of the light curve and is the length of the observing period. This frequency corresponds to a time interval of about 4 min, i.e. twice the sampling one. For higher frequencies the periodogram inverts the trend and turns up. This is the effect of the signal due to the 2-min time separation between data points.
Because of the sampling in frequency, the higher-frequency range is much more represented. Therefore, to estimate the spectral index of the power-law model, we bin the periodogram in steps of up to and then perform a least-squares linear fit. The slope/spectral index is , which confirms the red noise nature of the process already noticed in Section 2. The reduced chi-squared goodness of fit is , for dof=46 degrees of freedom, and indicates a good fit. A Kolmogorov–Smirnov (KS) test gives a probability of 99.4 per cent that the points of the binned log-log periodogram and those of the corresponding power-law model fit are drawn from the same distribution.
The lower panel of Fig. 10 shows the residuals (data minus model). They allow us to better recognize the deviations of the data from the model. While at there is some dispersion around 0, at higher frequencies the deviations from the model appear to follow a path. Notwithstanding the large errors, this suggests that a power-law model for the PSD may be an oversimplification. In particular, the last residual points indicate underfitting, in agreement with the flattening of the periodogram above . This may be due to red noise turning into instrumental white noise above some break frequency, as found in the Kepler light curves of some AGN (Wehrle et al., 2013; Sasada et al., 2017; Wehrle et al., 2019). Therefore, we perform a second fit using a broken power-law, forcing the slope of the higher-frequency linear fit to be zero. The result is a statistically worse fit, with . The best-fit break frequency is (about 14 min), and the slope/spectral index of the lower-frequency linear fit , not very far from the simple power-law case (see Fig. 10). The KS test leads to the same probability as before (within the sixth decimal digit).
In summary, the evaluation of the PSD of S5 0716+714 obtained from the TESS 2-min cadence light curve indicates that the main variability process operating is essentially red noise, which possibly becomes instrumental white noise on time-scales shorter than about 14 min. However, the fine structure of the periodogram, which presents some bending, reveals a more complex situation, whose explanation is hard to figure out. Complex shapes of the blazar optical PSD were also found by other authors (Edelson et al., 2013; Sasada et al., 2017; Goyal et al., 2018).
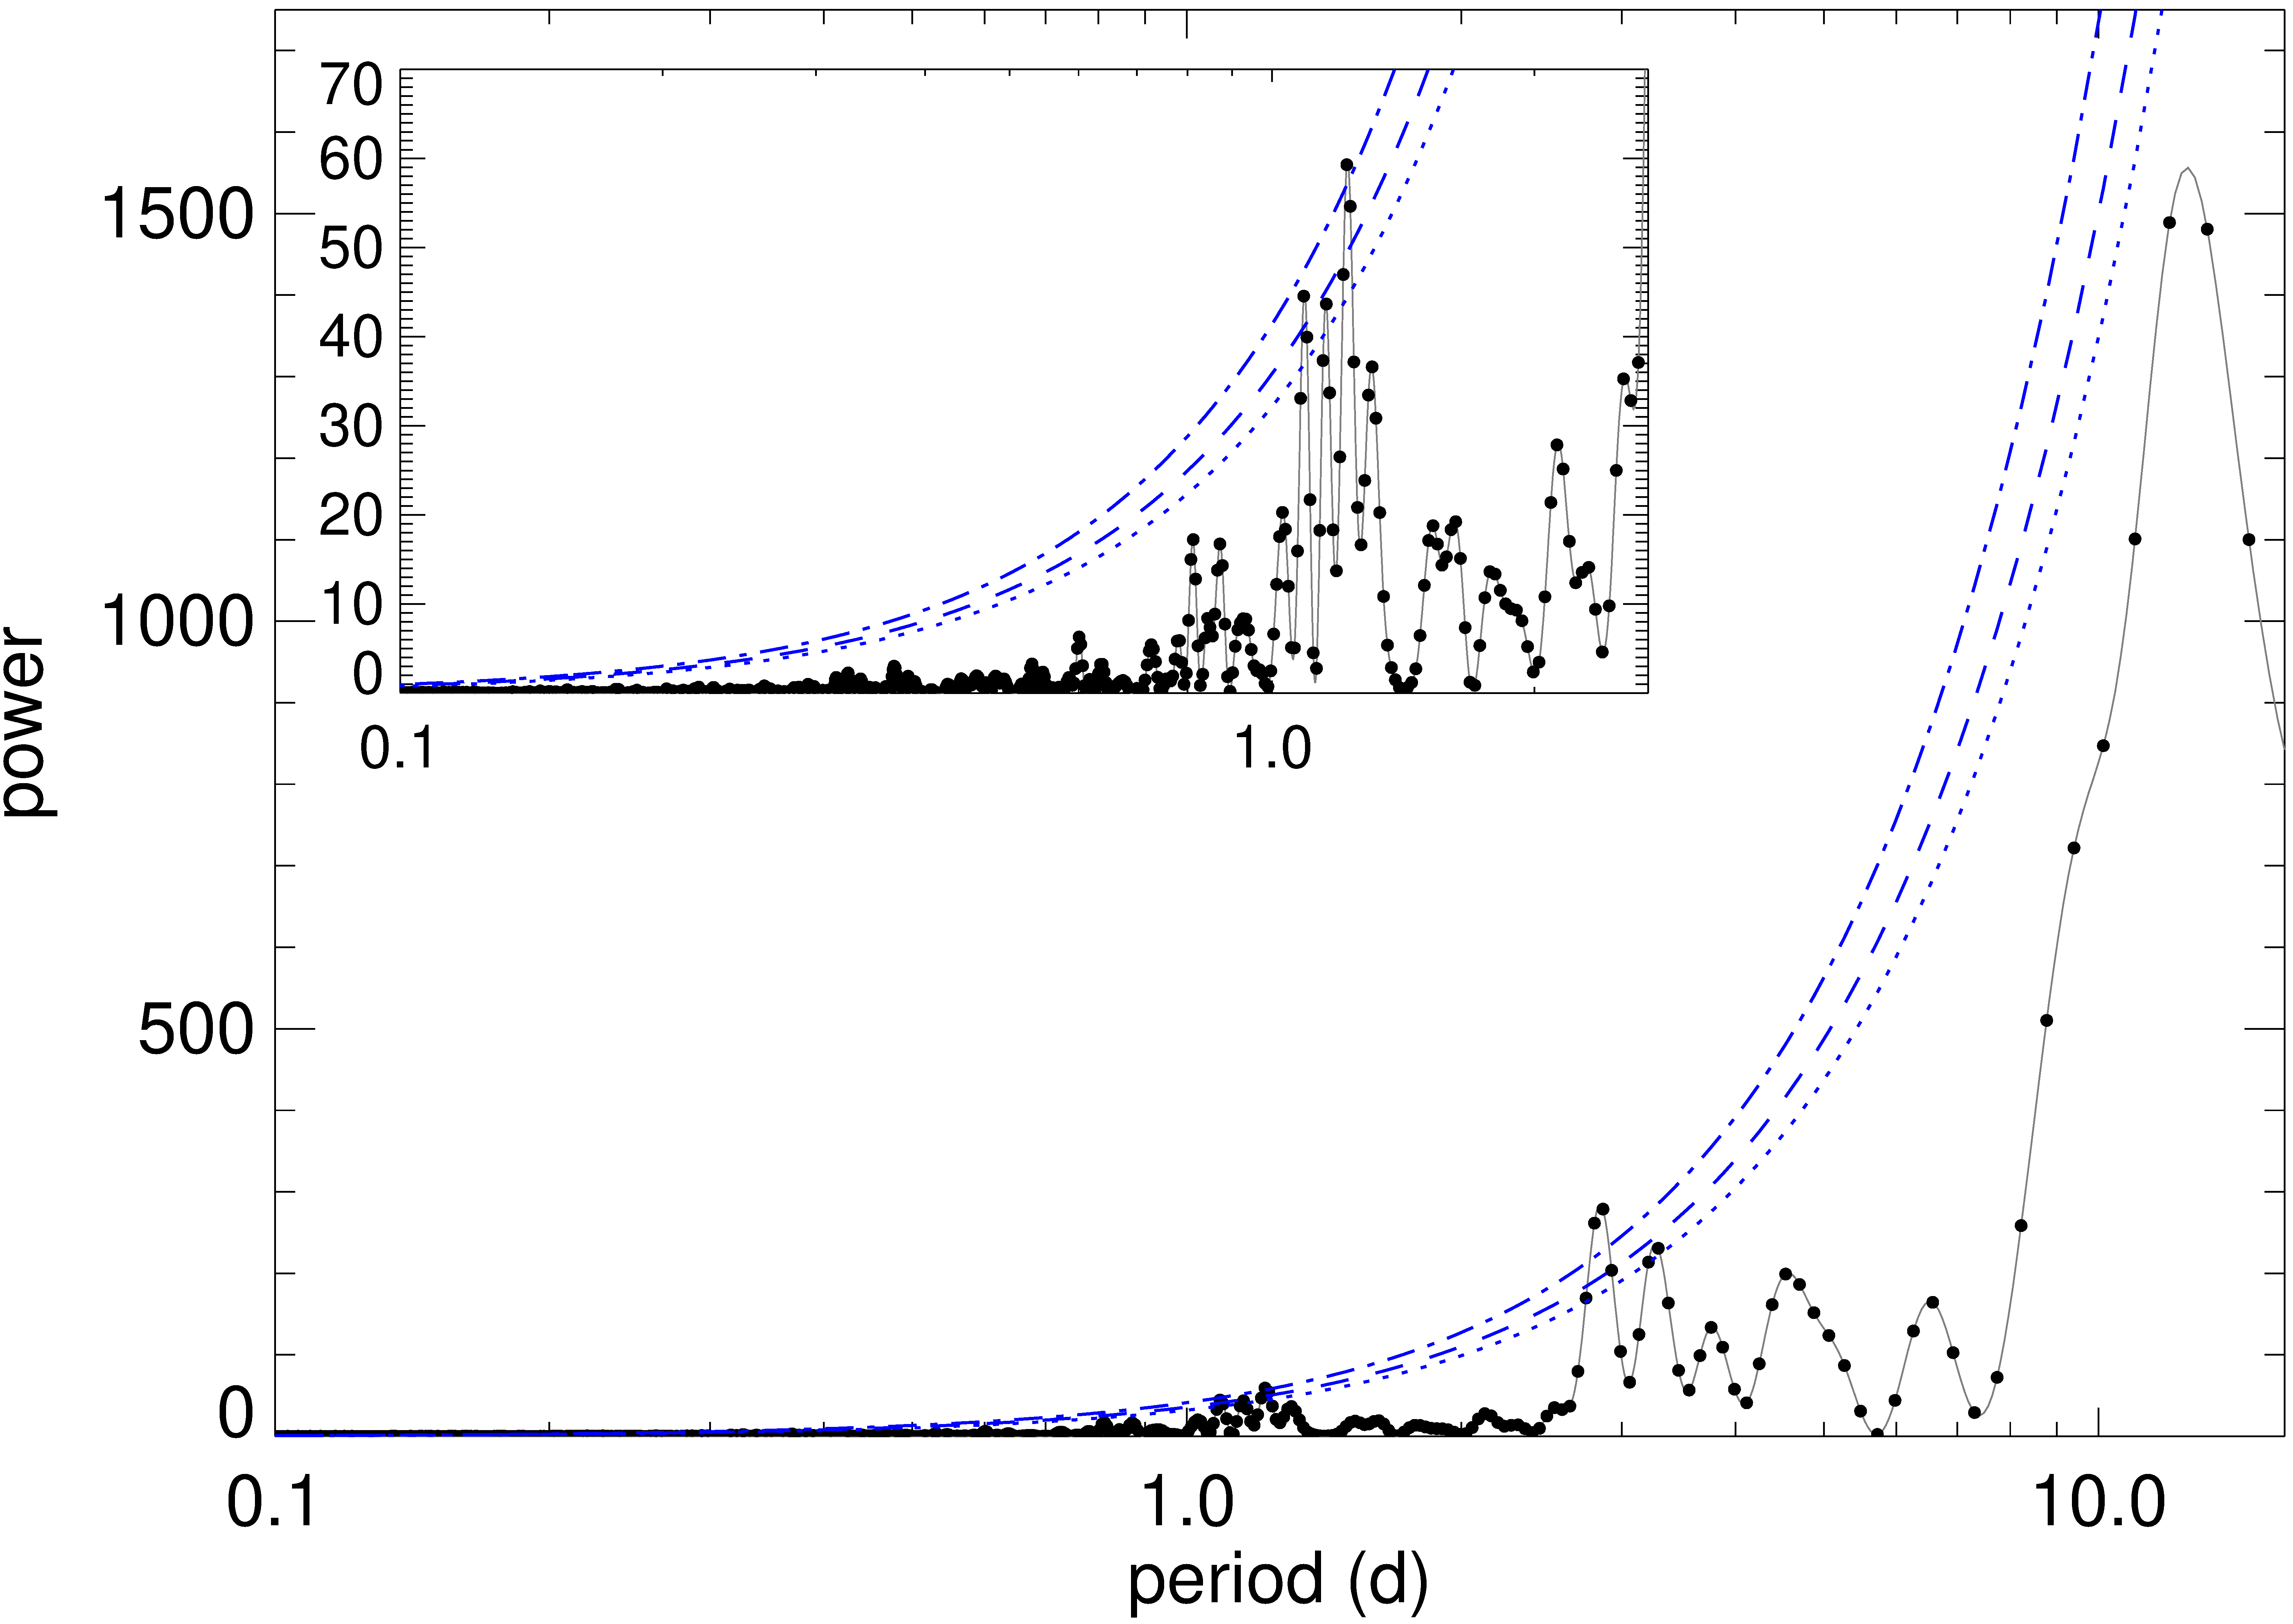
Besides revealing the type of process determining the source variability, the periodogram can be used to investigate the presence of sinusoidal components in a light curve, i.e. of periodicities. These will produce peaks in the PSD at the corresponding frequencies/periods. Indeed, some of the PSD peaks in Fig. 10 may in principle be due to periodic signals. For convenience, in Fig. 11 we show the periodogram versus time. A series of peaks are present, whose power increases with period, as expected for red noise and already visible in Fig. 10. The evaluation of peak significance in presence of red noise is a crucial issue that has been tackled in different ways (Benlloch et al., 2001; Vaughan, 2005, 2010; VanderPlas, 2018). We adopted the method presented by Vaughan (2005). We first fit the unbinned log-log periodogram of Fig. 10 with a power-law model up to the Nyquist frequency. Then we add the logarithm of to the model, where is the number of points of the periodogram that have been used for the power-law fit, is the false alarm probability, so that is the significance level for a detection, and is the corresponding confidence limit. In Fig. 11 we plot significance levels of 95, 99, and 99.9 per cent. Among the several peaks displayed in Fig. 11, some of which appear very close in period, only a few seem to be marginally significant. They correspond to periods of 1.1–1.2 d and 2.8–3.3 d. This suggests that in the time span that we are considering, there are events which may repeat regularly. No significant peak is found below 1 d, possibly meaning that the very fast flux changes that we noticed in the light curves are not part of a regular process. However, the fact that some of the periodogram signals present very similar periods also suggests that we may see the signature of quasi-periodicities, QPOs. In this case, the power of the QPO is spread over multiple frequencies and this reduces its significance. In the following section, we will use another method to check whether the above QPOs can be confirmed and to better characterize the short-term variability.
5.2 Auto-correlation function
One popular time series analysis technique is the discrete correlation function (Edelson & Krolik, 1988; Hufnagel & Bregman, 1992), which quantifies the correlation between two unevenly-sampled datasets. When these coincide, we obtain an auto-correlation function (ACF). Deep minima in the ACF highlight characteristic variability time-scales, while periodicities produce strong ACF peaks, i.e. with values close to 1, for time separations corresponding to the period and its multiples. While the PSD is sensitive to sinusoidal signals in the data train, the ACF is strongly affected by peaks and dips of the light curve.
In this sub-section we use this method to study the characteristic time-scales in the TESS light curve. The ACF run on the simple aperture photometry fluxes is shown in top-right panel of Fig. 12.
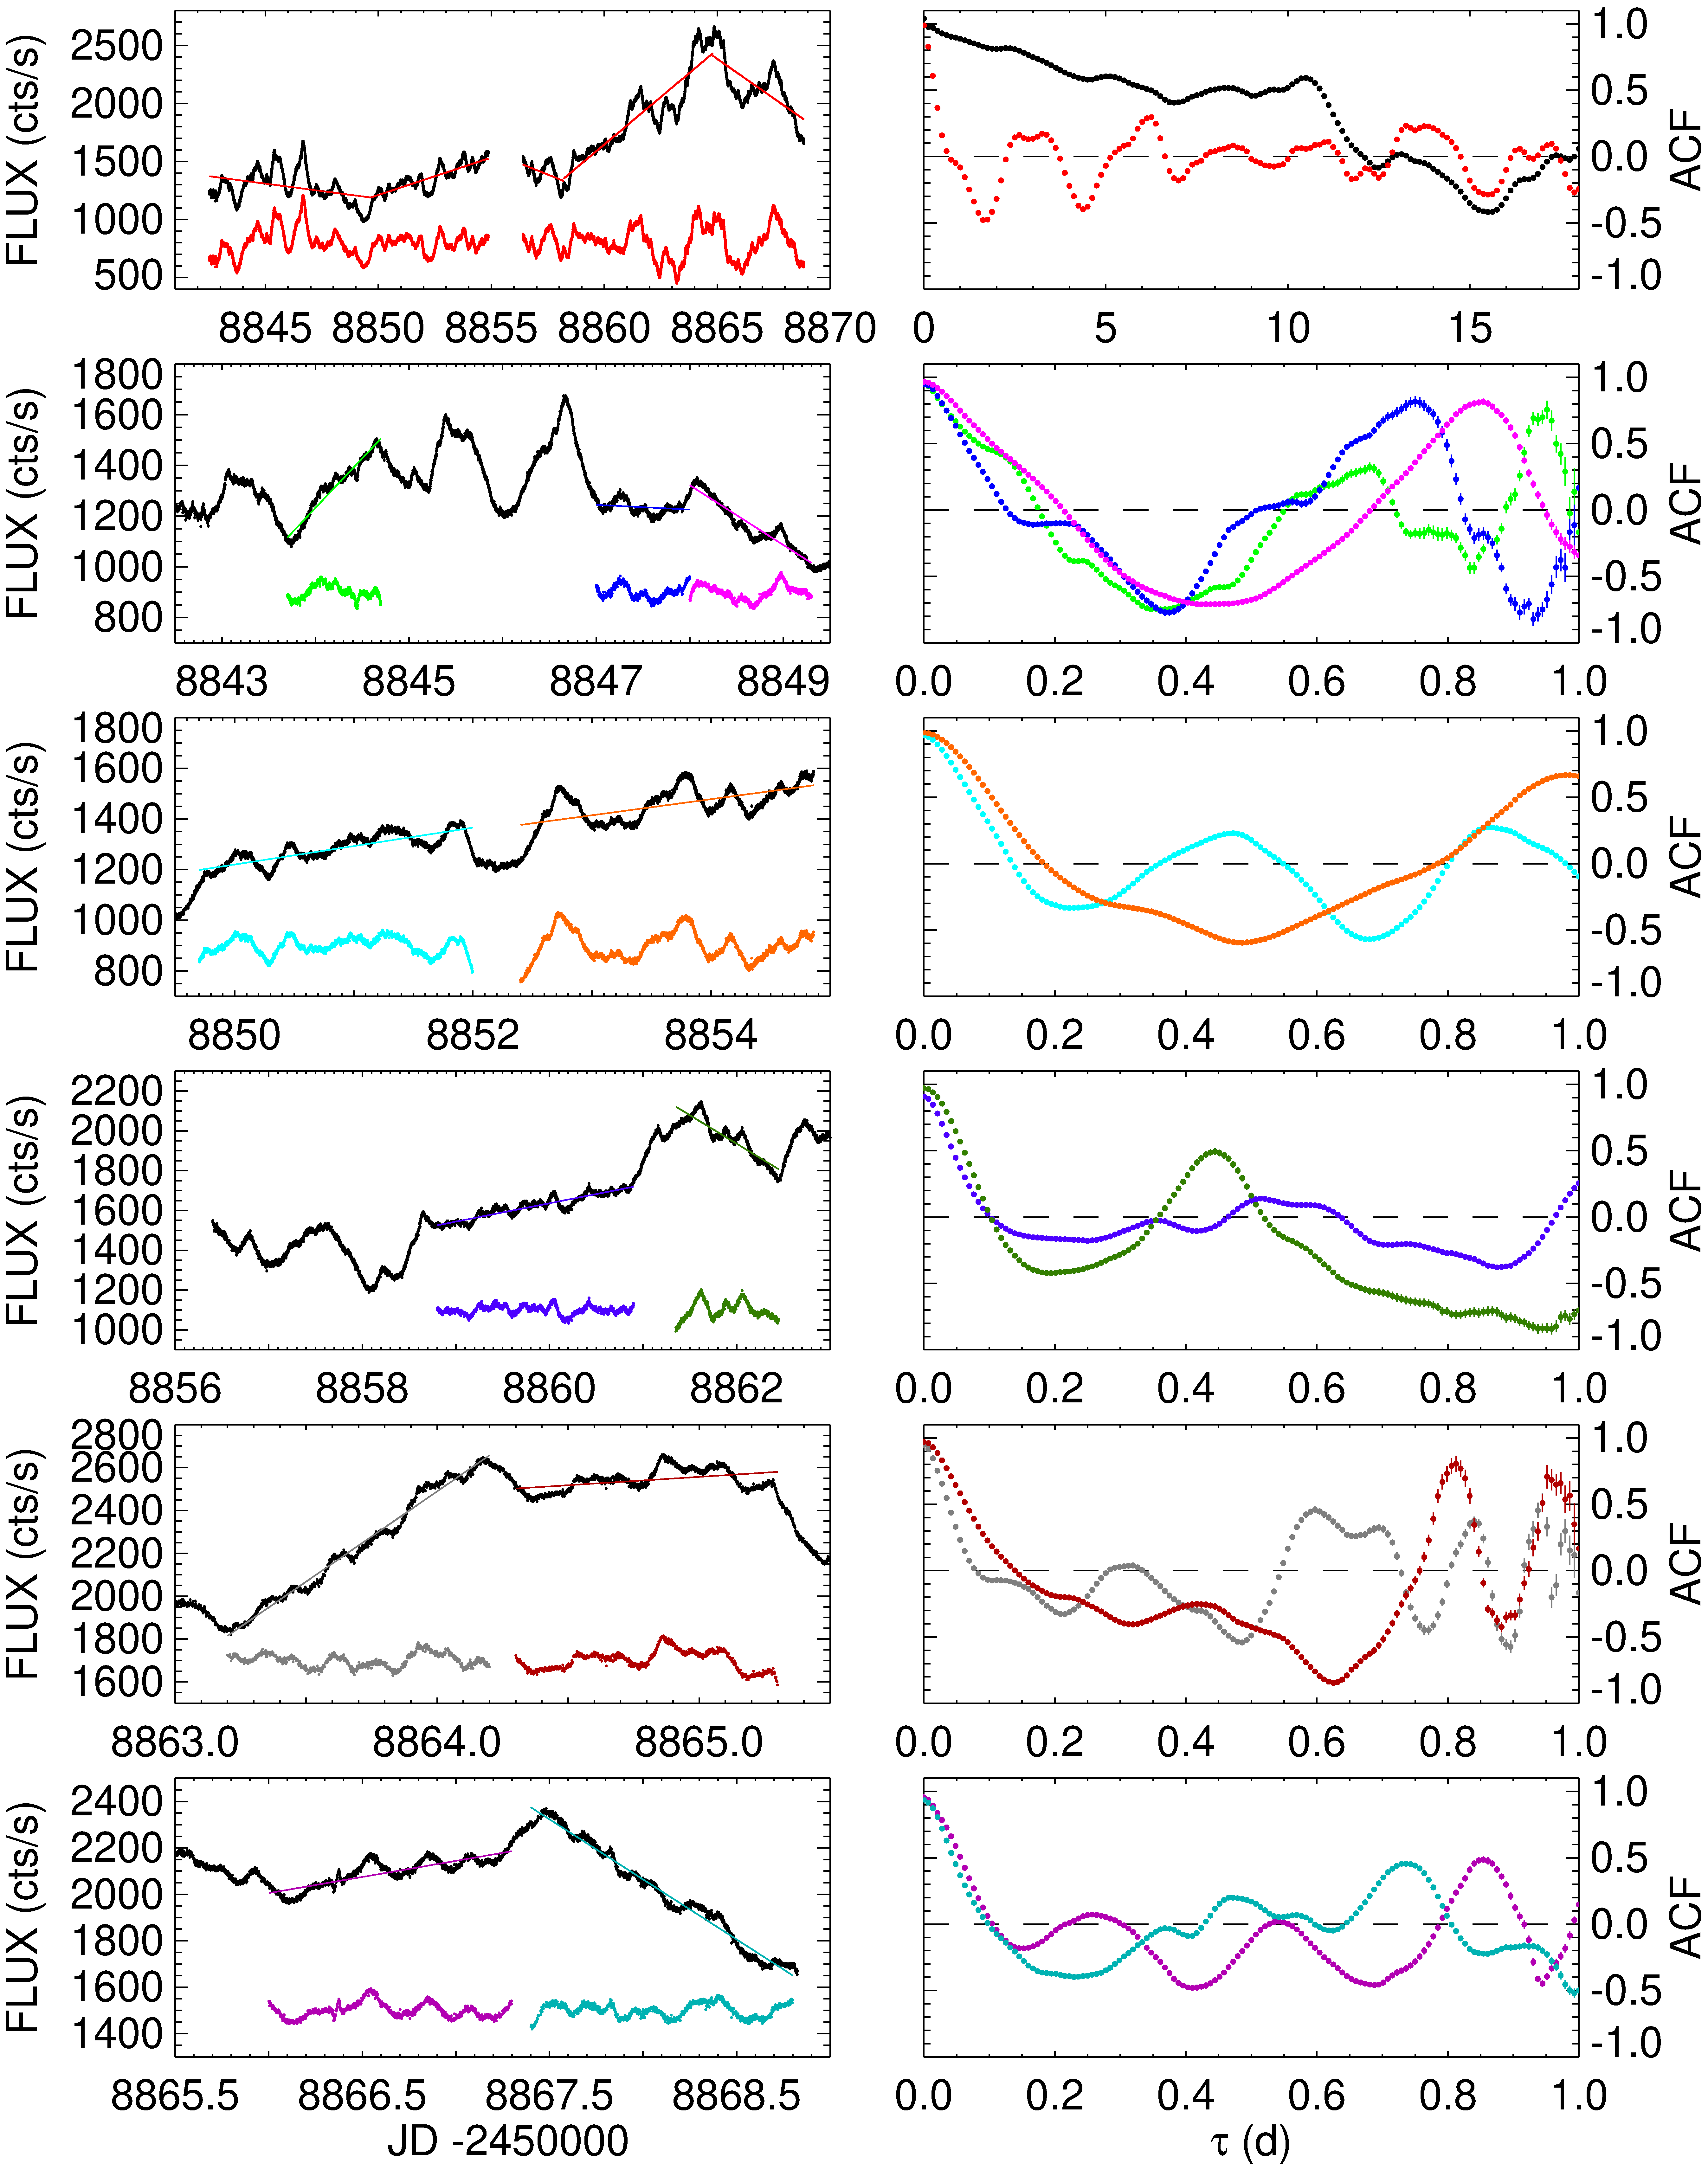
We adopted a preliminary binning of the SAP_FLUX of 30 min and then sampled the ACF in time separation bins of 3 h. The only strong minimum in the ACF occurs at d, which corresponds to the time distance between the flux minimum at and the maximum at . The only prominent maximum besides that at the origin is at d, the interval among various peaks or dips. However, the results are strongly affected by the long-term trend of the TESS light curve, which can mask other signals. It is well known that blazars present different variability time-scales; if the goal is to investigate short time-scales, it is necessary to correct for the long-term flux oscillations before calculating the correlation function (e.g. Smith et al., 1993).
To perform this light-curve de-trending, we first subtracted best-fit linear trends to different parts of the light curve which show various decreasing or increasing baselines (see Fig. 12, top-left panel). The dates of the connection points were chosen so that the de-trended light curve presents no jumps there. We then run the ACF on the de-trended light curve, which now reveals many more clear minima and maxima (top-right panel). The higher peak beside the origin is at , which is very similar to the minor peak at 6.5 d shown by the periodogram in Fig. 11. Other double-peaked, minor maxima are visible at 2.6–3.3 d, this too confirming the PSD results, and at 13.3–13.8 d. The strongest minimum is at , followed by and . Weaker signals appear at , , and . We note that these signals were already sketched in the ACF on the original TESS light curve, but they were overwhelmed by the long-term baseline trends. In the same way, the imprint of further, shorter time-scales may be hindered by the prevalence of the major, day-long features in the de-trended light curve. To verify this point, we have visually identified segments of the TESS light curve, which are short enough to avoid big features, but covering at least 24 h each to explore time-scales shorter than 1 d. We show them in Fig. 12. After linear de-trending, we calculated the ACF with 10 min time resolution. The ACFs reveal a variety of sub-day time-scales, with minima around , 0.35–, and 0.5–. Indeed, the TESS light curve results from the superposition of a great deal of flux oscillations of different duration and strength.
The above local analysis on short segments of the TESS light curve revealed a wealth of intra-day variability time-scales, suggesting that the process at the base of these flux changes can be described by a stochastic model. However, if we identified characteristic variability time-scales on the whole light curve, these would likely be due to persistent physical processes which can be treated by deterministic models. To verify this point, we develop a method for de-trending the TESS light curve for progressively shorter baseline trends to unveil progressively shorter characteristic time-scales.
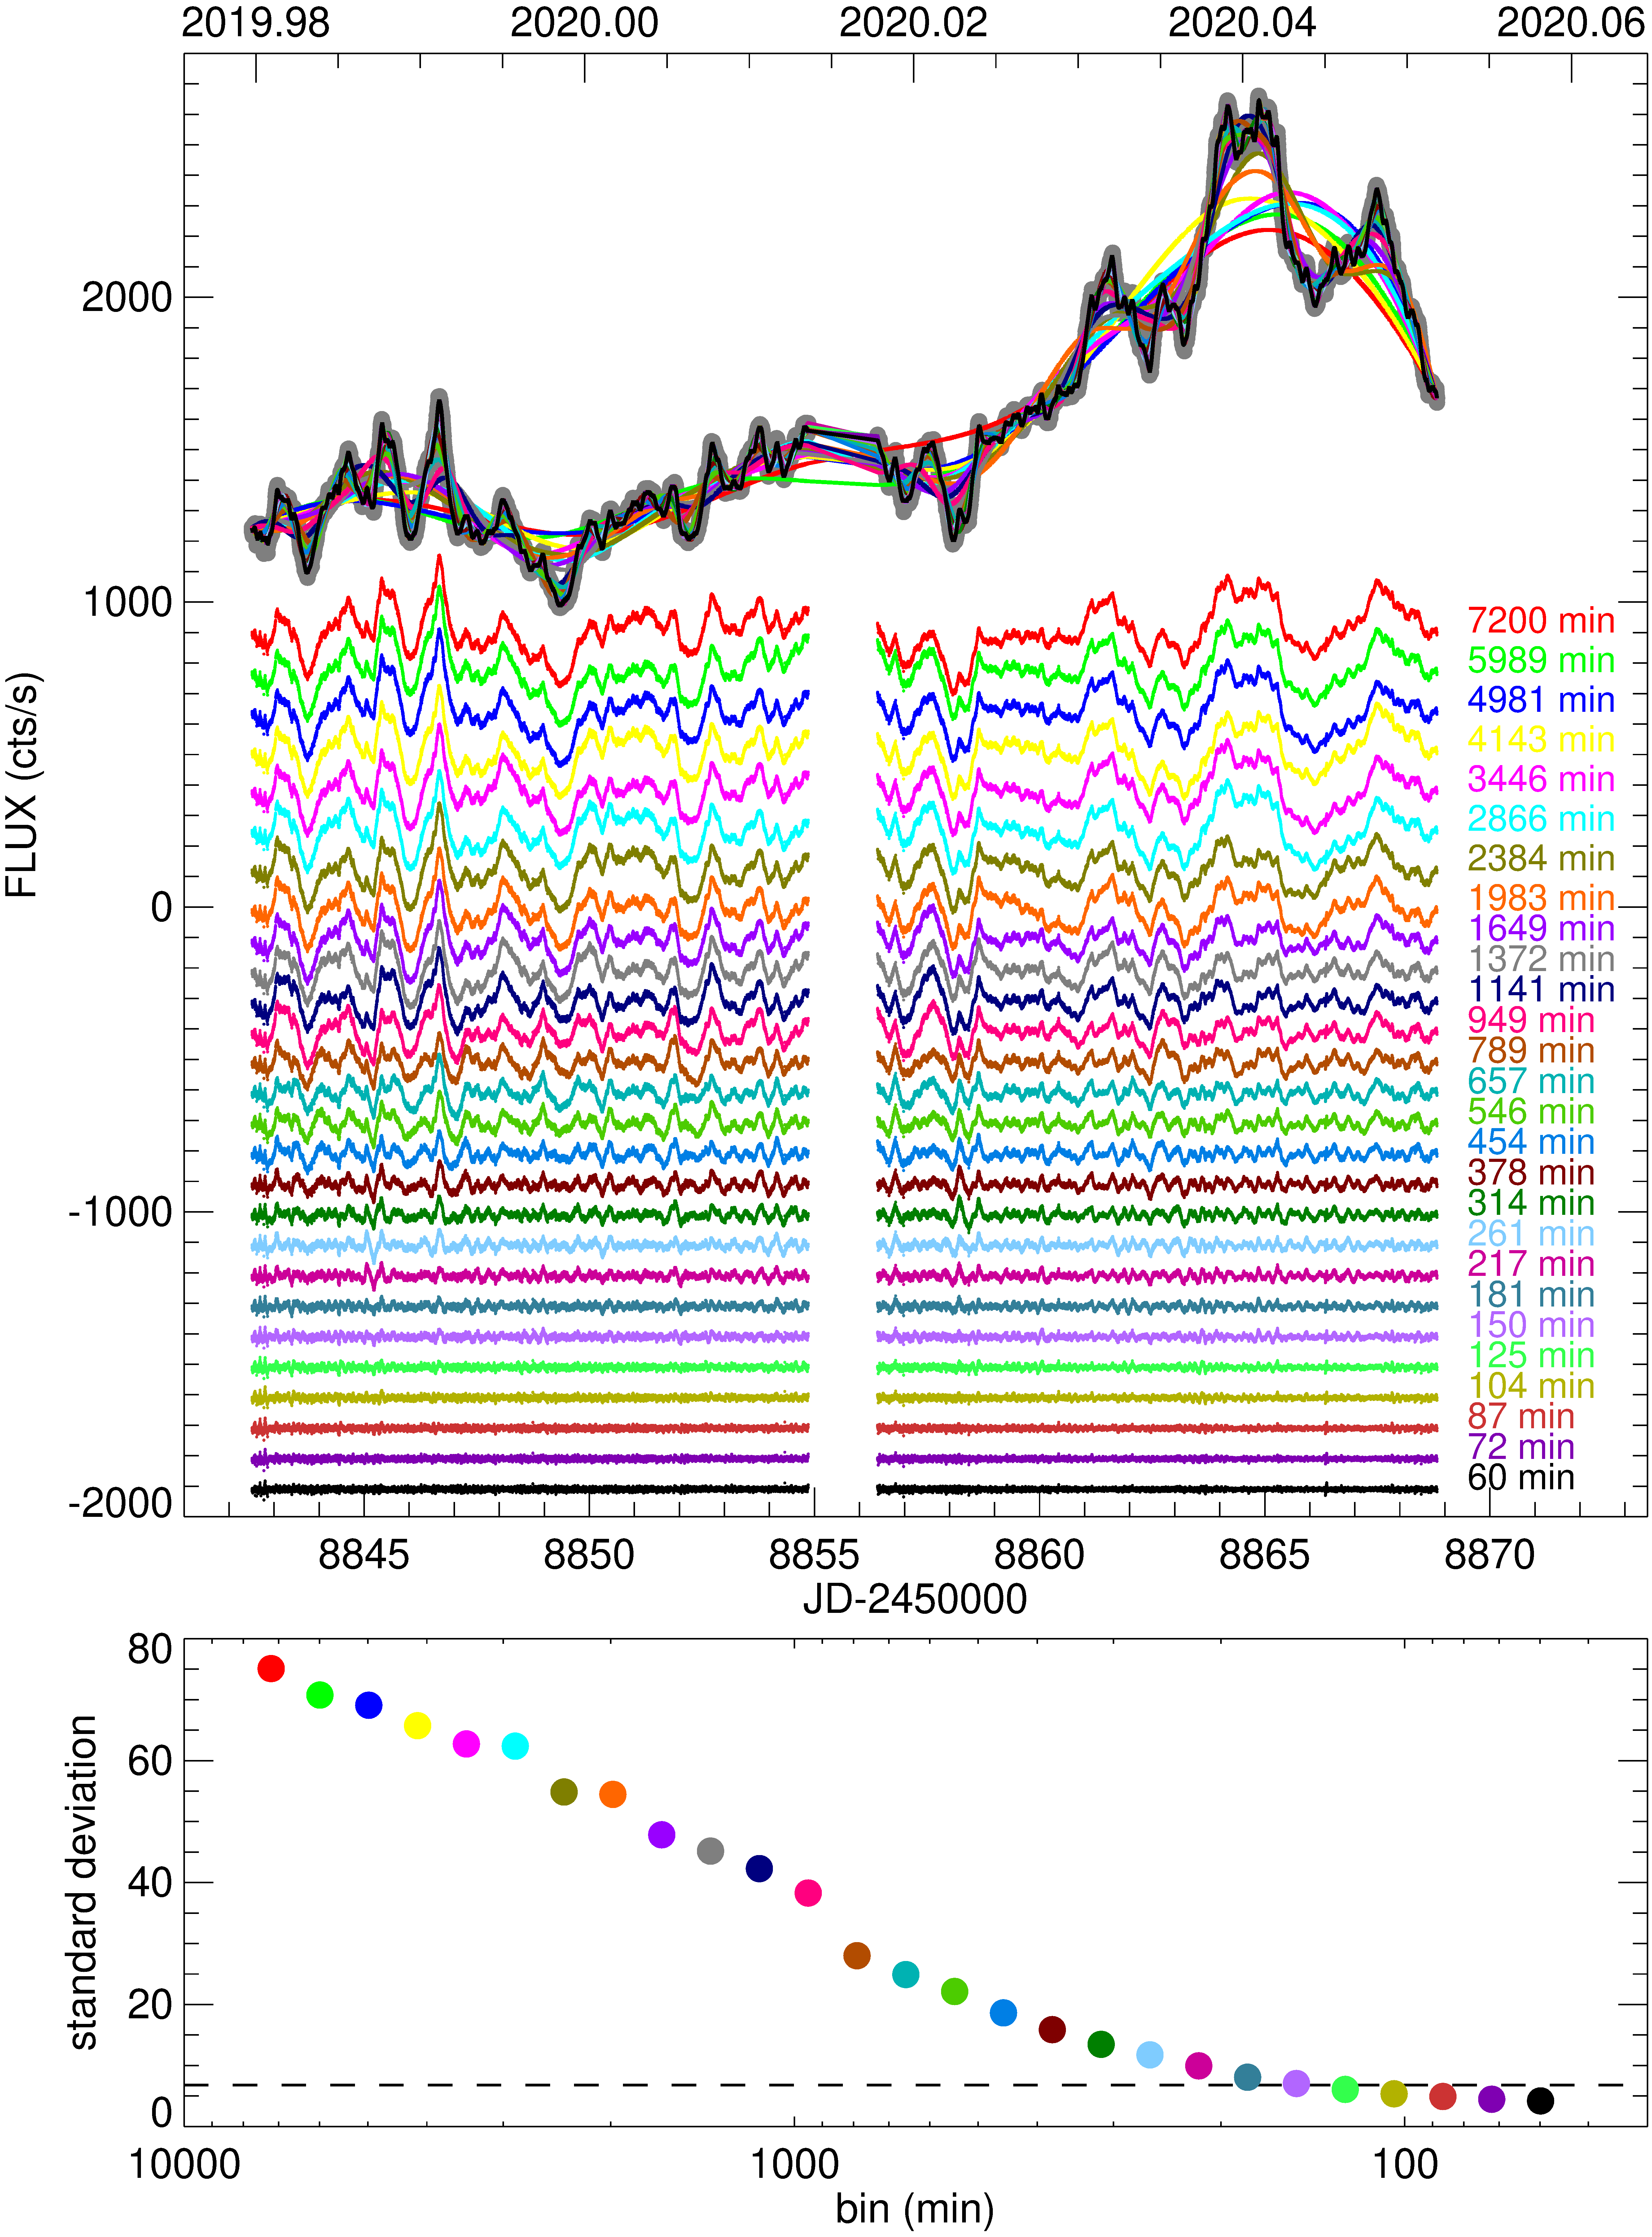
We use cubic spline interpolation with variable time binning as our de-trending tool. We build 27 binned light curves from the observed TESS light curve. Each of them is obtained with a different binning time interval, ranging from 5 d to 1 h and equally spaced in logarithm. The binned light curves are then interpolated with cubic splines101010We note that cubic spline interpolations have been largely used in blazar variability studies to model the long-term trend (e.g. Ghisellini et al., 1997; Villata et al., 2002; Raiteri et al., 2017). (see Fig. 13). De-trended light curves are finally obtained by dividing the observed TESS light curve by the splines and then multiplying for the same scale factor. They are plotted in Fig. 13 and show progressively smaller fluctuations as the splines enter more deeply inside the light curve ripples. The major flares clearly distinguishable in the 5 d (7200 min) de-trended light curve111111Here and in the following, when we mention a given time de-trended light curve, we mean the light curve which is obtained by dividing the TESS light curve by the cubic spline interpolation through the TESS fluxes binned over that given time interval. become less and less prominent; at time bins below 2400 min, their peaks are almost all at the same level, and below about 1200 min they have the same relevance as other events, which were minor flares in the observed light curve. For time bins of min, the signature of the major flares is completely lost and we can appreciate smaller and faster flux changes that were overwhelmed by more prominent flares in the observed light curve. As the binning interval continues to shorten, we are left with microvariations. Fig. 13 shows that the standard deviation of the de-trended light curves with time bins below about 120 min is smaller than the mean error of the SAP fluxes. Yet, in the 60-min de-trended light curve we can still recognize well-defined flux variations that may still be of source intrinsic nature. Indeed, in Section 5.1 we found that instrumental white noise appears below a 14 min time-scale.
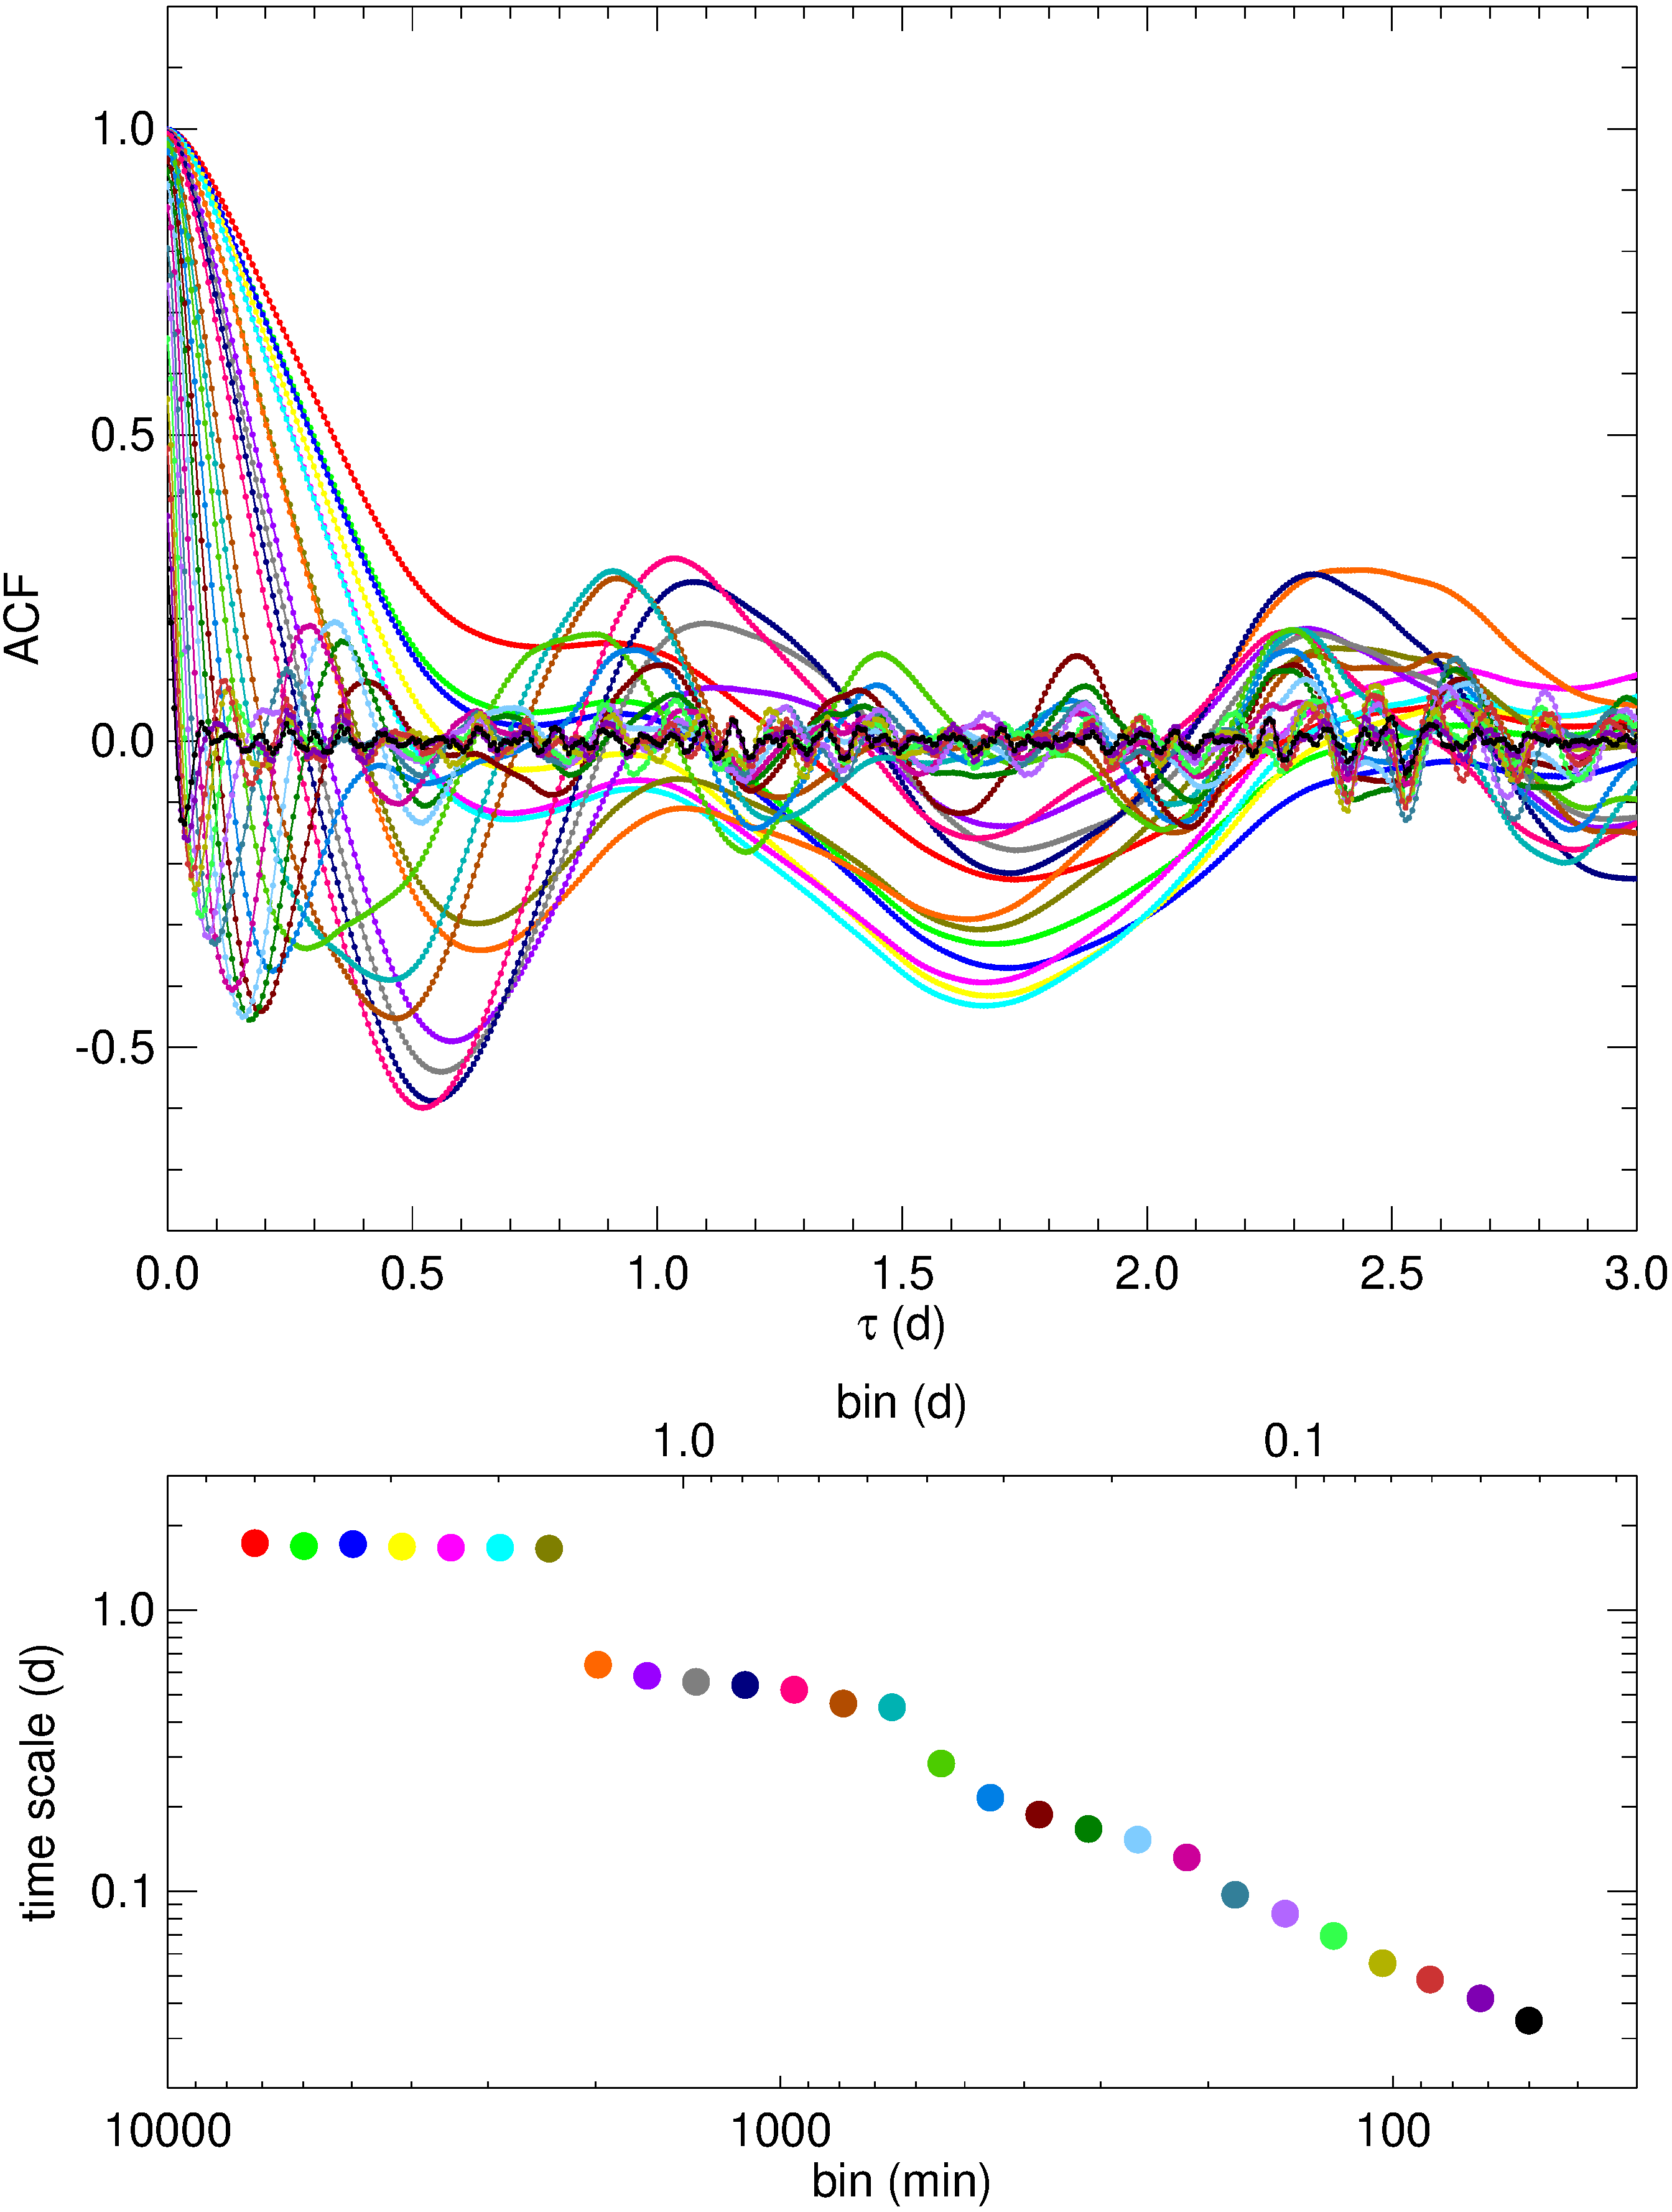
The ACFs obtained from the de-trended light curves are presented in Fig. 14 (top panel). They have a time resolution of 10 min and explore time separations up to 3 d. We again obtain a variety of time-scales. The most remarkable minima, which are shared by several curves, are found at time separations of about 1.7, 0.5, and 0.2 d. The minimum time-scale decreases as the time bin used for the spline interpolation shortens, i.e. as the de-trending model follows the light curve in more and more detail. We note that the ACFs with minima at d show maxima at about 1 d, suggesting repeating events on day time-scale, in agreement with the results of the PSD.
Fig. 14 (lower panel) shows the characteristic time-scale (i.e. the time separation at which the above ACFs present a minimum) versus the time bin which was used to obtain the spline representing the smoothed trend. This allows us to better define the most relevant time-scales. Going from longer to shorter time bins, there are 7 de-trended light curves, corresponding to time bins from 7200 to 2384 min, whose deepest ACF minimum (for time separations less than 3 d) is found at d, very close to that obtained with the previous linear de-trending. Then the principal minimum jumps at d. The ACF on the de-trended light curve corresponding to a time bin of 546 min (see Fig. 13) and to a time-scale of about 0.28 d, shows a somewhat transition behaviour. For shorter time bins the variability time-scale decreases almost linearly, reaching d for a 60 min time bin. As mentioned above, this is the case where the de-trended light curve still shows well-defined features, even if the standard deviation of the whole de-trended light curve is smaller than the mean error of the SAP fluxes. This almost linear decrease implies the existence of a nearly continuous set of time-scales from about 0.22 d to less than 1 h, among which the strongest signal corresponds to 0.17 d.
In conclusion, our method identifies three characteristic variability time-scales of 1.67, 0.52, and 0.17 d. These are revealed through the presence of common strong minima in the ACFs in the upper panel of Fig. 14 (and of steps in the lower panel). Indeed, such an aggregation means that these time-scales are true, intrinsic variability time-scales of the source, since they do not depend on the choice of a particular binning time interval, i.e. they are parameter-independent.

It is now interesting to compare the results of the PSD and ACF analyses on the de-trended light curves. Fig. 15 shows the periodograms corresponding to the de-trended light curves obtained by using spline interpolations on the TESS fluxes binned over 2866, 949, and 314 min. These are the de-trended light curves that are characterized by the strongest ACF minima in Fig. 14. By comparing these periodograms with that built with the TESS fluxes (Fig. 11), we see now a series of very high peaks, whose maxima are at 2.80, 1.22, and 0.368 d, respectively. Because peaks in the PSD correspond to “periods", i.e. to time intervals between subsequent maxima (or minima), we must take their halves to compare them with the ACF characteristic time-scales, which instead give the interval between minima and maxima. We then obtain 1.40, 0.61, and 0.184 d, respectively, which are not far from the minima of the ACFs reported above. We also notice that the periodogram corresponding to the 2866 min de-trended light curve also shows secondary maxima at the location of the main maxima in the PSD of the 949 and 314 min de-trended light curves, and in turn the PSD of the 949 min curve has a secondary maximum at the position of the principal peak of the 314 min curve. This underlines once again the fact that by decreasing the interpolation step we just emphasize signals at progressively shorter time intervals, which were already present in the PSD of the TESS SAP fluxes in Fig. 11.
5.3 Structure function
The structure function (SF; Simonetti et al., 1985) is another method to analyse variability. It returns the square mean difference between flux densities as a function of their time separation . Peaks in the SF indicate characteristic variability time-scales and should correspond to ACF dips. Moreover, if , the index is linked to the PSD spectral index (see Section 5.1) by the following relationship: . Although the SF presents some caveats (Emmanoulopoulos et al., 2010), we will use it here to see whether it can confirm the results obtained with the periodogram and auto-correlation function.
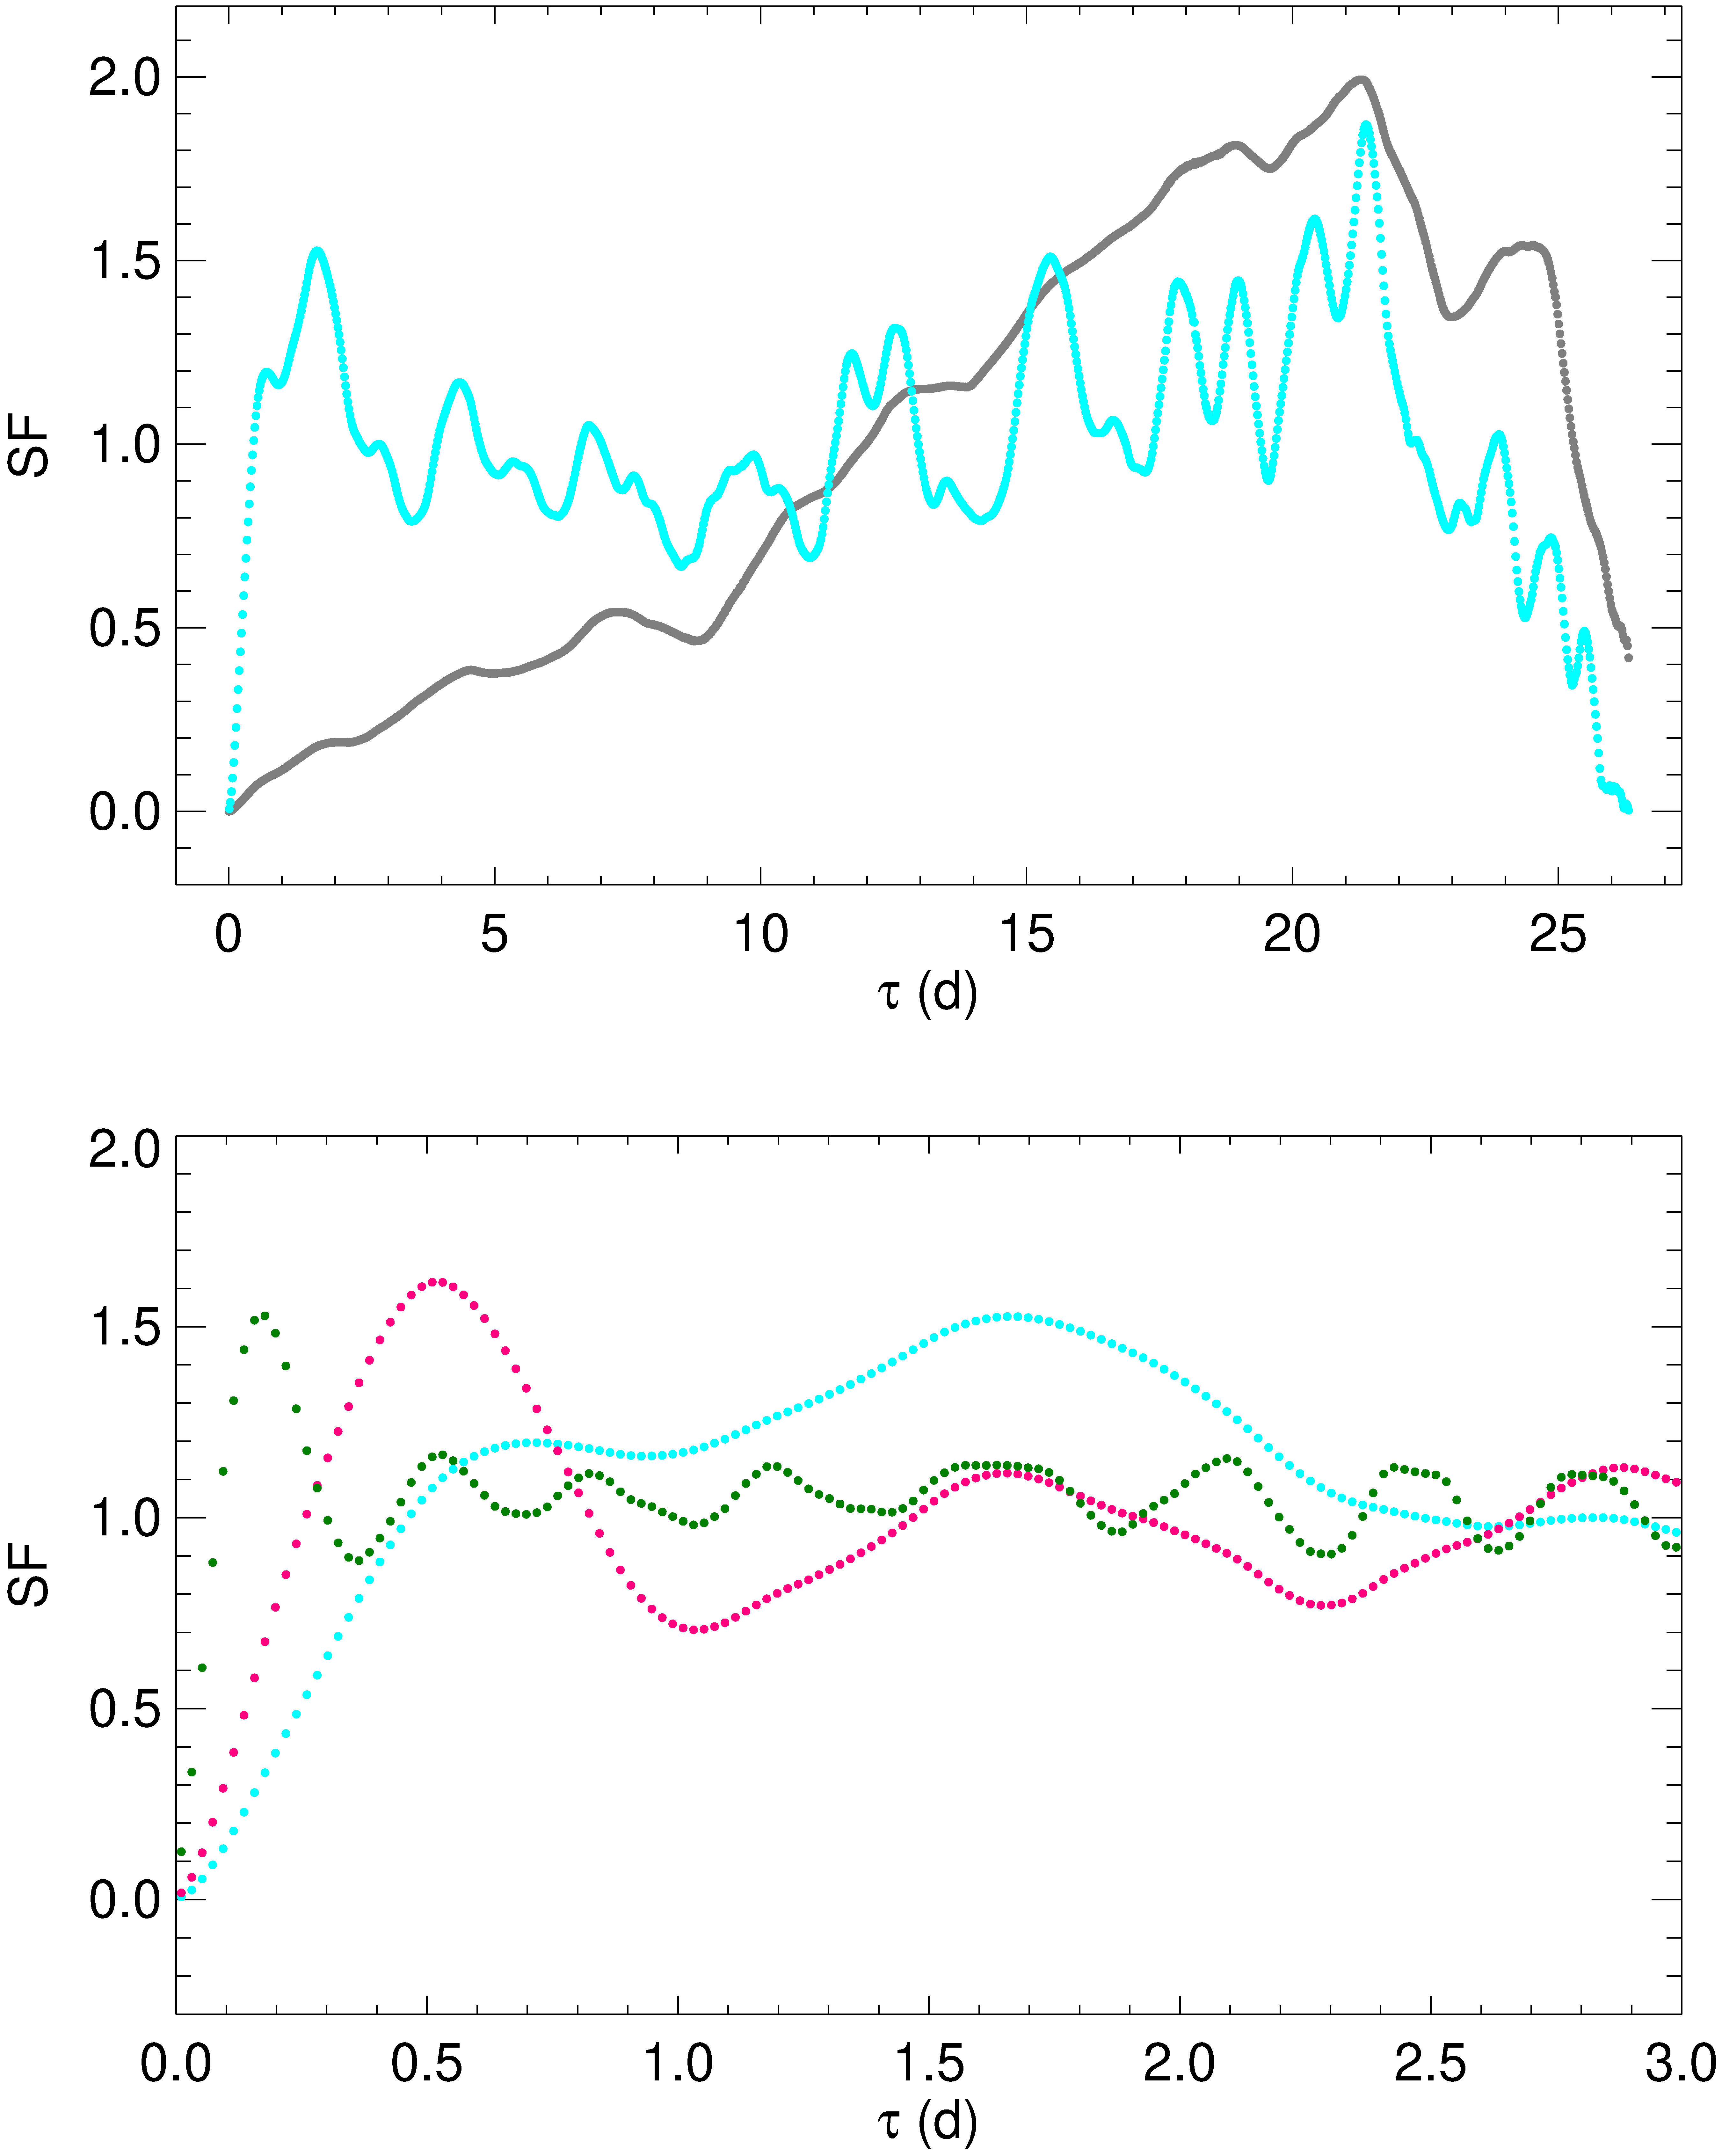
The SF obtained from the TESS data is shown in the top panel of Fig. 16. It was calculated in bins of 30 min. The SF increases up to a time-scale of about 21 d, representing the maximum time-scale we can resolve. From the SF shape it is difficult to characterize variability, because there are no prominent maxima, especially at short time-scales. Therefore, we follow the same strategy adopted in Section 5.2 and work on de-trended light curves. We concentrate again on those which showed the strongest minima in their ACF below a time lag of 3 d. The SF on the 2866 min de-trended light curve is plotted in the same Fig. 16 and reveals a lot of time-scales. In particular, the first most remarkable peak is at , very close to the value inferred from the ACF. The bottom panel of Fig. 16 shows again the SF on the 2866 min de-trended light curve together with those corresponding to 949 and 314 min binning of the original TESS fluxes. These SFs are zoomed for time lags shorter than 3 d and allow us to obtain time-scales of 0.51 and 0.18 d, in agreement with those already found when analysing the corresponding ACFs.
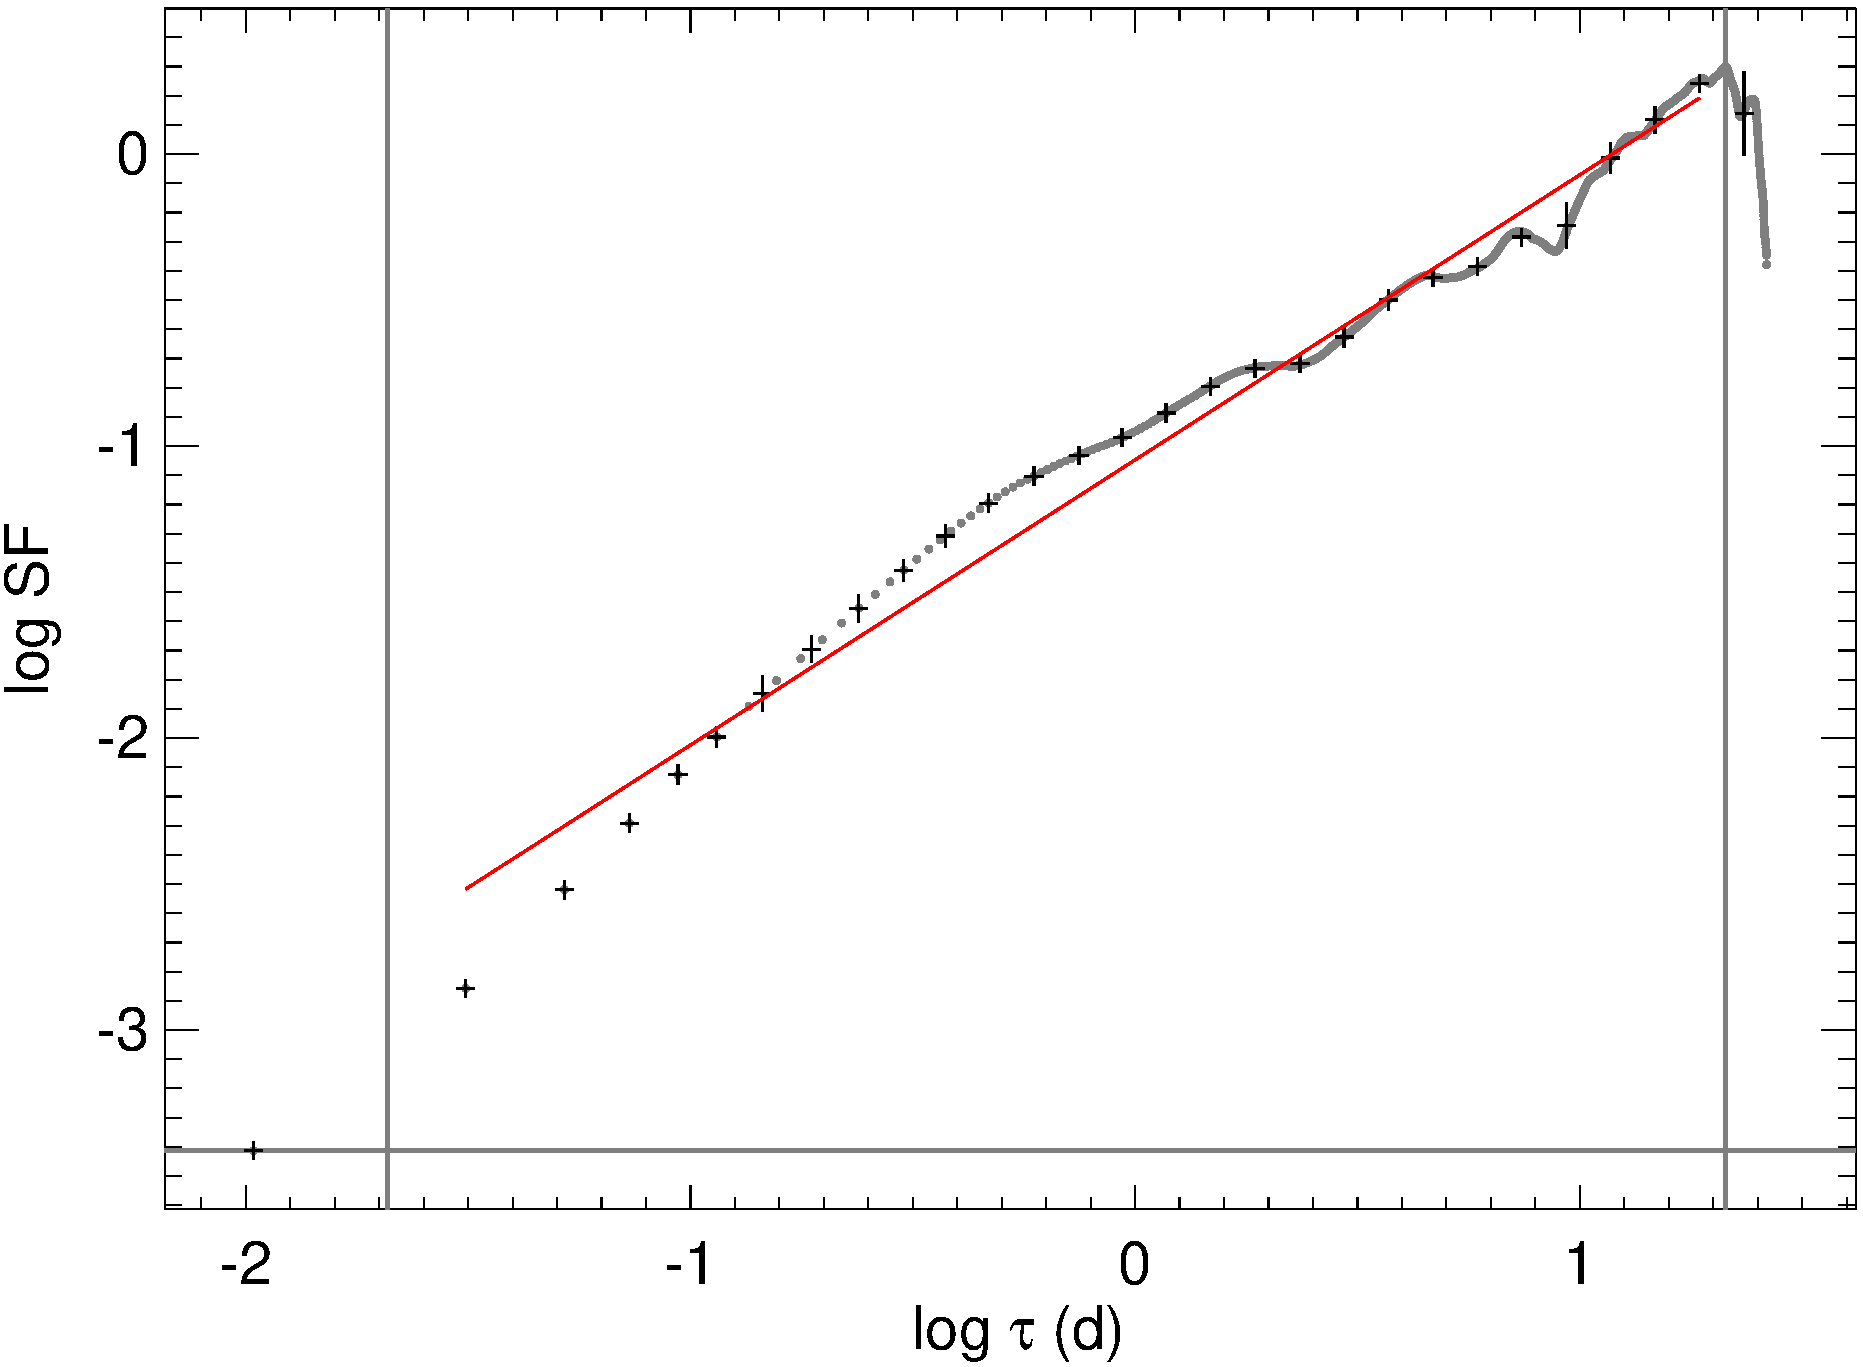
In Fig. 17 the SF is plotted in logarithmic scale to measure its power-law index and thus investigate its relationship with the PSD. As in the case of the PSD, we binned the SF before fitting it with a power law to avoid now oversampling of the largest bins. Then we set limits for the fit: the lower is fixed at 30 min, the bin used to build the SF, and the higher at 21.3 d, corresponding to the SF peak. The best-fit spectral slope is , which matches the expected relationship with the PSD spectral index.
6 Chromatic versus achromatic variations
We now apply the de-trending method to investigate in more detail the chromatism of the flux variations on different time-scales. In order to perform de-trending of the multiband WEBT data, we use the much better sampled TESS light curve and “adapt" it to give a good description of the WEBT light curves. This is obtained by amplifying the TESS fluxes according to . The amplification power is set to 1.05 for the band and 1.15 for the band to match the amplitude of the corresponding flux density variations. The amplified light curves are then binned and interpolated with cubic splines. These splines are used to de-trend the flux densities: , with representing the spline fluxes at the acquisition times of the WEBT data. De-trended and magnitudes are finally derived from flux densities and colour indices are obtained with the same prescriptions adopted in Section 3.

Fig. 18 compares the colour indices inferred from the original WEBT data and already shown in Fig. 7 to those calculated after de-trending the WEBT light curves as outlined above. The usual three cases corresponding to time intervals of 2866, 949, and 314 min for the TESS light curve binning and its spline interpolation are displayed. As the time bin shortens, the range of magnitude variation decreases, from about 1 mag down to 0.1 mag in the 314 min case. Instead, the range of values spanned by the colour indices remains about the same, i.e. mag. This is another confirmation that fast flares are strongly chromatic with respect to the flux changes on longer time-scales. The figure also shows the intra-night colour indices obtained from the 314 min de-trended WEBT light curves on (see right panels of Fig. 7 for a comparison to the situation before de-trending). The -band magnitude range is 0.04, while the range is 0.12, yielding a versus slope of 3. This can be compared with the quasi-achromatism of the long-term oscillations, with slope 0.035, as estimated in Section 3.
7 Discussion and Conclusions
We have presented the 2-min cadence optical light curve of the BL Lac object S5 0716+714 obtained by the TESS satellite during cycle 2, from 2019 December 24 to 2020 January 21. These data have been complemented by multiband optical monitoring carried out by the WEBT Collaboration and by ultraviolet and X-ray observations by the Neil Gehrels Swift Observatory. While the TESS data allowed us to analyse the source variability down to the shortest time-scales, those collected by the WEBT and Swift provided information on the spectral variability. A simple power-law fit to the PSD and SF gives a slope of and , respectively, suggesting that the variability process is in agreement with random walk/red noise, with more power at longer periods. However, both the PSD and SF shapes suggest that a more complex scenario must be envisaged to explain the source flux variations, as already found by other authors working with Kepler data (Edelson et al., 2013; Sasada et al., 2017; Goyal et al., 2018). Interestingly, random walk noise was found by Hughes et al. (1992) when analysing the radio light curves (at 4.8, 8.0 and 14.5 GHz) of a sample of 51 BL Lacs and FSRQs monitored for more than 10 yr at the University of Michigan Radio Astronomy Observatory (UMRAO). The fact that optical and radio PSD share the same properties is expected, because the emission in both these bands is due to a synchrotron process, though likely coming from separate regions in jet. The observed smoother radio variability, the commonly detected delay of the radio flares after the optical ones, together with synchrotron self-absorption being stronger at radio wavelengths, make the observed radio emission likely come from more external jet zones than the optical radiation.
From the colour indices we have found that the long-term optical variability of S5 0716+714 is characterized by a mild chromatism. This is compatible with the major flux variations be due to changes of the Doppler factor. In contrast, fast flux changes are strongly chromatic and are likely of intrinsic and energetic nature. The X-ray spectrum is always soft, implying a dominant contribution by the synchrotron component. However, the smallest spectral index belongs to the faintest state, in agreement with the contribution of the inverse-Compton becoming more appreciable when the brightness decreases. We detected significant fast variations also in the Swift data: up to mag in the ultraviolet in 0.26 d, and more than a factor 2 in the X-ray flux in 0.27 d.
Time series analysis techniques on the TESS data can reveal the shortest characteristic time-scales of variability. However, this can be achieved only after the removal of the overwhelming signature of the larger flux changes. Light curve de-trending is a necessary step to unveil the time-scales of the fastest flux variations, but the choice of the de-trending function can affect the results of the analysis. Therefore, we have proposed a method that performs de-trending by using cubic splines interpolations through the TESS light curve binned in progressively shorter time intervals. As the time bin decreases, the interpolation follows in more and more detail the meanderings of the light curve, and the de-trending process removes larger variations emphasizing the smaller ones. The de-trended light curves then have been analysed by means of the periodogram, the auto-correlation function, and the structure function. We have found that the shortest characteristic time-scales (typical time intervals between a flux maximum and a minimum or viceversa), are about 1.7, 0.5 and 0.2 d long. Table 2 summarizes the results obtained with the various methods.
| PSD | ACF | SF | Bin |
|---|---|---|---|
| (d) | (d) | (d) | (min) |
| 0.18 | 0.17 | 0.18 | 314 |
| 0.61 | 0.52 | 0.51 | 949 |
| 1.40 | 1.67 | 1.66 | 2866 |
Below about 0.2 d, the source flux shows variability on a continuous variety of time-scales, suggesting a process that can be described by a stochastic model. Causality arguments imply that the shortest variability time-scales set an upper limit to the dimension of the emitting region, , where is the redshift. For a source at like S5 0716+714, and with a value of (Savolainen et al., 2010; Kravchenko et al., 2020), a 0.2 d time-scale means that the region must be smaller than about . This would imply a jet sub-structure, if we assume that the jet dimension where the radiation is emitted is that predicted by blazar SED modelling, i.e. typically of the order of hundredths of pc in case it is inside the broad line region, and of the order of tenths of pc if it is outside (see e.g. MAGIC Collaboration et al., 2018, and references therein). Therefore, the strongly chromatic flux variations on time-scales shorter than about 0.2 d must have an intrinsic nature and are likely linked to sub-structures of the jet. On these time-scales we may see the stochastic footprint of injection/acceleration of particles in turbulent jet regions (Marscher, 2014; Pollack et al., 2016).
On longer time-scales, where flux variability is quasi-achromatic, we likely see the effect of variations of the Doppler factor. As in previous works, we favour a scenario in which changes are caused by variations of the viewing angle of the emitting jet regions. Time-scales as short as 0.5 d may still imply sub-structures of the jet, which we may imagine as twisted filaments. In this view, the variability time-scales would correspond to the time a filament takes to align close to the line of sight. The de-trending procedure applied in this paper is consistent with correcting for variable beaming in case the flux variations are due to changes in the Doppler factor. Indeed, assuming that changes in time, the ratio between two observed flux densities will depend on some power of the ratio between their Doppler factors121212The observed flux density , where is the spectral index and for a continuous jet, while for a discrete point-like component (Urry & Padovani, 1995).. If we represent the observed baseline flux with a cubic spline interpolation through the binned light curve, then by dividing the fluxes by the spline and normalizing to some minimum flux, we obtain a Doppler-corrected light curve, i.e. we remove that part of variability caused by variations of the Doppler factor.
In previous works we already found that an interpretation of the variability in terms of variations of the Doppler factor can successfully be applied to the long-term behaviour of many blazars (e.g. Villata et al., 1998b; Villata & Raiteri, 1999; Villata et al., 2004; Ostorero et al., 2006; Villata et al., 2009a; Raiteri et al., 2010, 2011, 2012, 2013, 2015), most remarkably to the multifrequency variability of CTA 102 (Raiteri et al., 2017). In all these cases, we made the further assumption that the changes of the Doppler factor have a geometric explanation, i.e. that they are due to a variation of the orientation of the jet emitting regions. Here for the first time we can quantify what is the shortest variability time-scale due to geometrical effects. We found that in S5 0716+714 it corresponds to about half a day, i.e. d in the rest frame, if . The existence of various geometric time-scales can be explained if we think of a twisted jet that is composed of many filaments winding up around the jet axis like strands in a rope. Apart from the case where the viewing angle of the jet axis is null, each filament would have its own orientation with respect to the observer and thus its own changing Doppler factor. Moreover, each strand may be made up of thinner threads, giving rise to different variability time-scales.
A geometric interpretation of the S5 0716+714 variability was also given by Kravchenko et al. (2020). They analysed space-VLBI and VLBA observations, which revealed that the jet has a curved structure. These authors favoured a scenario where radio variability is due to Doppler factor changes caused by changes of the viewing angle.
A final remark is due on the issue whether the shape of flux variations is symmetric or not. According to the scenario traced above, we would expect that the intrinsic and chromatic flux changes on time-scales below about 0.2 d be asymmetric. In contrast, the mildly achromatic variations on longer time-scales caused by orientation changes should be symmetric. The point is hard to investigate, because most events are blended, i.e. they seem the result of the superposition of multiple events. Moreover, we could speculate on whether variations of the Doppler factor of geometrical origin always produce flux changes with symmetric profiles. This is certainly true when the viewing angle changes in a “regular" way, as in a helical rotating jet with constant rotation velocity. But if the change in the orientation of the emitting jet region occurs in an irregular way, as in the case of different velocities in approaching/leaving the line of sight, then the resulting flux variation profile could be asymmetric.
Acknowledgements
The Astronomical Observatory of the University of Siena thanks the friend amateur astronomers Massimo Conti and Claudio Vallerani for their invaluable and unceasing contribution, essential for the performance of the observatory. This paper includes data collected by the TESS mission. Funding for the TESS mission is provided by the NASA Explorer Program. This research has made use of NASA’s Astrophysics Data System and of the NASA/IPAC Extragalactic Database (NED), which is operated by the Jet Propulsion Laboratory, California Institute of Technology, under contract with the National Aeronautics and Space Administration. Based on observations made with the Nordic Optical Telescope, operated by the Nordic Optical Telescope Scientific Association at the Observatorio del Roque de los Muchachos, La Palma, Spain, of the Instituto de Astrofisica de Canarias. Based (partly) on data obtained with the STELLA robotic telescopes in Tenerife, an AIP facility jointly operated by AIP and IAC. This work is partly based upon observations carried out at the Observatorio Astronómico Nacional on the Sierra San Pedro Martir (OAN-SPM), Baja California, Mexico. This research was partially supported by the Bulgarian National Science Fund of the Ministry of Education and Science under grants DN 18-13/2017, KP-06-H28/3 and KP-06-PN38/4. K. M. acknowledges JSPS KAKENHI grant no. JP19K03930. S. O. K. acknowledges financial support by Shota Rustaveli National Science Foundation of Georgia under contract PHDF-18-354. E. B. acknowledges support from DGAPA-PAPIIT GRANT IN113320. G. B. acknowledges financial support from the State Agency for Research of the Spanish MCIU through the “Center of Excellence Severo Ochoa" award to the Instituto de Astrofísica de Andalucía (SEV-2017-0709).
Data availability
The data collected by the WEBT collaboration are stored in the WEBT archive at the Osservatorio Astrofisico di Torino - INAF (http://www.oato.inaf.it/blazars/webt/); for questions regarding their availability, please contact the WEBT President Massimo Villata (massimo.villata@inaf.it).
References
- Ackermann et al. (2015) Ackermann M., et al., 2015, ApJ, 813, L41
- Aharonian et al. (2007) Aharonian F., et al., 2007, ApJ, 664, L71
- Albert et al. (2007) Albert J., et al., 2007, ApJ, 669, 862
- Benlloch et al. (2001) Benlloch S., Wilms J., Edelson R., Yaqoob T., Staubert R., 2001, ApJ, 562, L121
- Bessell et al. (1998) Bessell M. S., Castelli F., Plez B., 1998, A&A, 333, 231
- Bhatta et al. (2016) Bhatta G., et al., 2016, ApJ, 831, 92
- Blandford & Königl (1979) Blandford R. D., Königl A., 1979, ApJ, 232, 34
- Burrows et al. (2005) Burrows D. N., Hill J. E., Nousek J. A., Kennea J. A., Wells A., Osborne J. P., Abbey A. F., Beardmore et al. A., 2005, Space Science Reviews, 120, 165
- Camenzind & Krockenberger (1992) Camenzind M., Krockenberger M., 1992, A&A, 255, 59
- Cash (1979) Cash W., 1979, ApJ, 228, 939
- Chandra et al. (2011) Chandra S., Baliyan K. S., Ganesh S., Joshi U. C., 2011, ApJ, 731, 118
- Chen et al. (2008) Chen A. W., et al., 2008, A&A, 489, L37
- Covino et al. (2019) Covino S., Sandrinelli A., Treves A., 2019, MNRAS, 482, 1270
- Edelson & Krolik (1988) Edelson R. A., Krolik J. H., 1988, ApJ, 333, 646
- Edelson et al. (2013) Edelson R., Mushotzky R., Vaughan S., Scargle J., Gandhi P., Malkan M., Baumgartner W., 2013, ApJ, 766, 16
- Emmanoulopoulos et al. (2010) Emmanoulopoulos D., McHardy I. M., Uttley P., 2010, MNRAS, 404, 931
- Feinstein et al. (2019) Feinstein A. D., et al., 2019, PASP, 131, 094502
- Ghisellini et al. (1997) Ghisellini G., et al., 1997, A&A, 327, 61
- Gierliński et al. (2008) Gierliński M., Middleton M., Ward M., Done C., 2008, Nature, 455, 369
- González-Pérez et al. (2001) González-Pérez J. N., Kidger M. R., Martín-Luis F., 2001, AJ, 122, 2055
- Goyal et al. (2018) Goyal A., et al., 2018, ApJ, 863, 175
- Graham et al. (2015) Graham M. J., et al., 2015, Nature, 518, 74
- Gupta et al. (2009) Gupta A. C., Srivastava A. K., Wiita P. J., 2009, ApJ, 690, 216
- Gupta et al. (2018) Gupta A. C., Tripathi A., Wiita P. J., Gu M., Bambi C., Ho L. C., 2018, A&A, 616, L6
- Hagen-Thorn et al. (2006) Hagen-Thorn V. A., et al., 2006, Astronomy Reports, 50, 458
- Horne & Baliunas (1986) Horne J. H., Baliunas S. L., 1986, ApJ, 302, 757
- Hufnagel & Bregman (1992) Hufnagel B. R., Bregman J. N., 1992, ApJ, 386, 473
- Hughes et al. (1992) Hughes P. A., Aller H. D., Aller M. F., 1992, ApJ, 396, 469
- Kaur et al. (2018) Kaur N., Baliyan K. S., Chandra S., Sameer Ganesh S., 2018, AJ, 156, 36
- King et al. (2013) King O. G., et al., 2013, MNRAS, 436, L114
- Kravchenko et al. (2020) Kravchenko E. V., et al., 2020, ApJ, 893, 68
- Lainela et al. (1999) Lainela M., et al., 1999, ApJ, 521, 561
- Larionov et al. (2013) Larionov V. M., et al., 2013, ApJ, 768, 40
- Lomb (1976) Lomb N. R., 1976, Ap&SS, 39, 447
- MAGIC Collaboration et al. (2018) MAGIC Collaboration et al., 2018, A&A, 619, A159
- Marscher (2014) Marscher A. P., 2014, ApJ, 780, 87
- Marscher & Gear (1985) Marscher A. P., Gear W. K., 1985, ApJ, 298, 114
- Miller et al. (1989) Miller H. R., Carini M. T., Goodrich B. D., 1989, Nature, 337, 627
- Mohan et al. (2016) Mohan P., Gupta A. C., Bachev R., Strigachev A., 2016, MNRAS, 456, 654
- Nilsson et al. (2008) Nilsson K., Pursimo T., Sillanpää A., Takalo L. O., Lindfors E., 2008, A&A, 487, L29
- Ostorero et al. (2006) Ostorero L., et al., 2006, A&A, 451, 797
- Otero-Santos et al. (2020) Otero-Santos J., et al., 2020, MNRAS, 492, 5524
- Papadakis et al. (2007) Papadakis I. E., Villata M., Raiteri C. M., 2007, A&A, 470, 857
- Peñil et al. (2020) Peñil P., et al., 2020, ApJ, 896, 134
- Pollack et al. (2016) Pollack M., Pauls D., Wiita P. J., 2016, ApJ, 820, 12
- Press et al. (1992) Press W. H., Teukolsky S. A., Vetterling W. T., Flannery B. P., 1992, Numerical recipes in FORTRAN. The art of scientific computing
- Prokhorov & Moraghan (2017) Prokhorov D. A., Moraghan A., 2017, MNRAS, 471, 3036
- Raiteri et al. (2001) Raiteri C. M., et al., 2001, A&A, 377, 396
- Raiteri et al. (2003) Raiteri C. M., et al., 2003, A&A, 402, 151
- Raiteri et al. (2010) Raiteri C. M., et al., 2010, A&A, 524, A43
- Raiteri et al. (2011) Raiteri C. M., et al., 2011, A&A, 534, A87
- Raiteri et al. (2012) Raiteri C. M., et al., 2012, A&A, 545, A48
- Raiteri et al. (2013) Raiteri C. M., et al., 2013, MNRAS, 436, 1530
- Raiteri et al. (2015) Raiteri C. M., et al., 2015, MNRAS, 454, 353
- Raiteri et al. (2017) Raiteri C. M., et al., 2017, Nature, 552, 374
- Rani et al. (2010) Rani B., Gupta A. C., Joshi U. C., Ganesh S., Wiita P. J., 2010, ApJ, 719, L153
- Rani et al. (2013) Rani B., et al., 2013, A&A, 552, A11
- Ricker et al. (2015) Ricker G. R., et al., 2015, Journal of Astronomical Telescopes, Instruments, and Systems, 1, 014003
- Roming et al. (2005) Roming P. W. A., et al., 2005, Space Science Reviews, 120, 95
- Sandrinelli et al. (2017) Sandrinelli A., et al., 2017, A&A, 600, A132
- Sasada et al. (2008) Sasada M., et al., 2008, PASJ, 60, L37
- Sasada et al. (2017) Sasada M., Mineshige S., Yamada S., Negoro H., 2017, PASJ, 69, 15
- Savolainen et al. (2010) Savolainen T., Homan D. C., Hovatta T., Kadler M., Kovalev Y. Y., Lister M. L., Ros E., Zensus J. A., 2010, A&A, 512, A24
- Scargle (1982) Scargle J. D., 1982, ApJ, 263, 835
- Sikora et al. (2001) Sikora M., Błażejowski M., Begelman M. C., Moderski R., 2001, ApJ, 554, 1
- Sillanpaa et al. (1996) Sillanpaa A., et al., 1996, A&A, 305, L17
- Simonetti et al. (1985) Simonetti J. H., Cordes J. M., Heeschen D. S., 1985, ApJ, 296, 46
- Smith et al. (1993) Smith A. G., Nair A. D., Leacock R. J., Clements S. D., 1993, AJ, 105, 437
- Urry & Padovani (1995) Urry C. M., Padovani P., 1995, PASP, 107, 803
- Valtonen et al. (2016) Valtonen M. J., et al., 2016, ApJ, 819, L37
- VanderPlas (2018) VanderPlas J. T., 2018, ApJS, 236, 16
- Vaughan (2005) Vaughan S., 2005, A&A, 431, 391
- Vaughan (2010) Vaughan S., 2010, MNRAS, 402, 307
- Vaughan et al. (2003) Vaughan S., Edelson R., Warwick R. S., Uttley P., 2003, MNRAS, 345, 1271
- Vaughan et al. (2016) Vaughan S., Uttley P., Markowitz A. G., Huppenkothen D., Middleton M. J., Alston W. N., Scargle J. D., Farr W. M., 2016, MNRAS, 461, 3145
- Villata & Raiteri (1999) Villata M., Raiteri C. M., 1999, A&A, 347, 30
- Villata et al. (1998a) Villata M., Raiteri C. M., Lanteri L., Sobrito G., Cavallone M., 1998a, A&AS, 130, 305
- Villata et al. (1998b) Villata M., Raiteri C. M., Sillanpää A., Takalo L. O., 1998b, MNRAS, 293, L13
- Villata et al. (2000) Villata M., et al., 2000, A&A, 363, 108
- Villata et al. (2002) Villata M., et al., 2002, A&A, 390, 407
- Villata et al. (2004) Villata M., et al., 2004, A&A, 421, 103
- Villata et al. (2008) Villata M., et al., 2008, A&A, 481, L79
- Villata et al. (2009a) Villata M., et al., 2009a, A&A, 501, 455
- Villata et al. (2009b) Villata M., et al., 2009b, A&A, 504, L9
- Wagner & Witzel (1995) Wagner S. J., Witzel A., 1995, ARA&A, 33, 163
- Wagner et al. (1996) Wagner S. J., et al., 1996, AJ, 111, 2187
- Wehrle et al. (2013) Wehrle A. E., Wiita P. J., Unwin S. C., Di Lorenzo P., Revalski M., Silano D., Sprague D., 2013, ApJ, 773, 89
- Wehrle et al. (2019) Wehrle A. E., Carini M., Wiita P. J., 2019, ApJ, 877, 151
- Winkel et al. (2016) Winkel B., Kerp J., Flöer L., Kalberla P. M. W., Ben Bekhti N., Keller R., Lenz D., 2016, A&A, 585, A41
Affiliations
1INAF, Osservatorio Astrofisico di Torino, Via Osservatorio 20, I-10025 Pino Torinese, Italy
2EPT Observatories, Tijarafe, E-38780 La Palma, Spain
3INAF, TNG Fundación Galileo Galilei, E-38712 La Palma, Spain
4Instituto de Astronomía, Universidad Nacional Autónoma de México, Cd. Universitaria, CDMX, Mexico
5Abastumani Observatory, Mt. Kanobili, 0301 Abastumani, Georgia
6Samtskhe-Javakheti State University, 92 Shota Rustaveli St. Akhaltsikhe, Georgia
7Landessternwarte, Zentrum für Astronomie der Universität Heidelberg, Königstuhl 12, 69117 Heidelberg, Germany
8Aryabhatta Research Institute of Observational Sciences (ARIES), Manora Peak, Nainital - 263 001, India
9Ulugh Beg Astronomical Institute, Maidanak Observatory, Tashkent, 100052, Uzbekistan
10INAF, Istituto di Radioastronomia, Via Gobetti 101, I-40129 Bologna, Italy
11Pulkovo Observatory, 196140 St. Petersburg, Russia
12Nordic Optical Telescope, Apartado 474, E-38700 Santa Cruz de La Palma, Spain
13Instituto de Astrofísica de Canarias, E-38200, La Laguna, Tenerife, Spain
14Universidad de La Laguna, Departamento de Astrofisica, E38206, La Laguna, Tenerife, Spain
15Crimean Astrophysical Observatory RAS, P/O Nauchny, 298409, Russia
16University of Siena, Department of Physical Sciences, Earth and Environment, Astronomical Observatory, Via Roma 56, I-53100 Siena, Italy
17Graduate Institute of Astronomy, National Central University, 300 Jhongda Road, Zhongli, Taoyuan 32001, Taiwan
18Osservatorio Astronomico Sirio, I-70013 Castellana Grotte, Italy
19Instituto de Astronomía, Universidad Nacional Autónoma de México, Ensenada, Baja California, Mexico
20Engelhardt Astronomical Observatory, Kazan Federal University, Tatarstan, Russia
21Facultad de Ciencias, Universidad Autónoma de Baja California, Campus El Sauzal, Ensenada B.C., Mexico
22Astronomical Institute, Osaka Kyoiku University, Osaka 582-8582, Japan
23Instituto Nacional de Astrofísica, Óptica y Electrónica, Tonantzintla, Puebla, Mexico
24Department of Physics and Mathematics, Aoyama Gakuin University, 5-10-1 Fuchinobe, Chuo-ku, Sagamihara, Kanagawa 252-5258, Japan
25Astronomical Institute, St. Petersburg State University, 198504 St. Petersburg, Russia
26Institute of Astronomy and National Astronomical, Observatory, Bulgarian Academy of Sciences, Sofia, Bulgaria