The distances of 61 PGCCs in the Second Galactic Quadrant
Abstract
Determining the distances to the Planck Galactic cold clumps (PGCCs) is crucial for the measurement of their physical parameters and the study of their Galactic distribution. Based on two large catalogues of stars with robust distances and reddening estimates from the literature, we have estimated accurate distances to 61 PGCCs in the second Galactic quadrant. For this purpose, we have selected stars along the sightlines overlapping with the cores of the sample clumps and fitted the reddening profiles with a simple reddening model. The typical uncertainties of the resultant distances of these PGCCs are less than 8 per cent. The new estimates differ significantly from the kinematic values, well known to suffer from large errors. With the new distances, we have updated the physical properties including the radii, masses and virial parameters of the cores of the PGCCs.
keywords:
dust, extinction – ISM: clouds – Galaxy: structure1 Introduction
Star formation is a key process in the life cycle of galaxies. It occurs in the cold and dense parts of molecular clouds (Blitz & Williams, 1999), whose physical and chemical properties are still poorly understood. A statistical study of the properties of the cold dense clumps within molecular clouds based on unbiased large surveys of the Milky Way is important to understand the initial conditions and the early phases of star formation.
The Planck mission (Planck Collaboration et al., 2011a) has revealed a huge number of Planck Galactic cold clumps (PGCCs) based on multi-band observations ranging from sub-millimetre to millimetre wavelengths. The Cold Core Catalogue of Planck Objects (C3PO; Planck Collaboration et al., 2011d) containing cold cores, and the sub-catalogue, the Planck Early Release Cold Cores Catalogue (ECC; Planck Collaboration et al., 2011b) containing 915 most reliable detections, were released in 2011. The C3PO presented the first unbiased, all-sky catalogue of cold objects. PGCCs are cold (10-15 K) and turbulence-dominated. They have relatively low column densities compared to other star forming regions (Planck Collaboration et al., 2011c, d; Wu et al., 2012). PGCCs are widely used to probe the initial conditions of star formation and the early evolution of stars in a wide range of Galactic environments. Understanding the properties of those clumps also offer a unique view of the evolution of molecular gas.
Accurate estimation of distances to PGCCs is crucial for both the determinations of their physical properties, as well as their Galactic distribution. In most studies, the commonly adopted distances are the kinematic values yielded with a Bayesian estimator (Reid et al., 2016), based on the locations on the celestial sphere and radial velocities of the sources, with knowledge such as the Galactic rotation curve (e.g. Reid et al., 2014; Xue et al., 2015; Huang et al., 2016) and the distances to the previously known star-forming regions (e.g. Pestalozzi et al., 2005; Xu et al., 2013; Zhang et al., 2013; Choi et al., 2014; Wu et al., 2014; Hachisuka et al., 2015; Xu et al., 2016) taken as priors. Although the approach has been widely used to determine the distances of star forming regions in the Galaxy, the method is not particularly suitable for PGCC. This is because PGCCs are mostly nearby clouds of relatively small masses (Zhang et al., 2018) and their motion might not follow that of the Galactic rotation exactly (Kolpak et al., 2003; Reid et al., 2009). Consequently, for PGCCs, their kinematic distances often suffer from large errors, leading to significant difficulties for the subsequent analyses.
Direct estimates of distances to PGCCs can be achieved via the three-dimensional (3D) dust extinction mapping. Compared to the diffuse interstellar medium, PGCCs have much higher densities of dust grains. The amount of sightline dust extinction is thus expected to increase significantly and abruptly at the location of a PGCC. One can thus estimate the distance to a PGCC by finding the position of a sharp increase of extinction in the extinction versus distance profile of the sightline towards the PGCC. Benefiting from accurate extinction and distance estimates of millions of individual stars(e.g., Chen et al., 2014, 2019; Green et al., 2015, 2018; Green et al., 2019; Lallement et al., 2019; Anders et al., 2019; Guo et al., 2020), accurate distances to large numbers of Galactic molecular clouds have been obtained in this way (e.g., Schlafly et al., 2014; Chen et al., 2017; Chen et al., 2020a; Chen et al., 2020b), as well as distances to other types of objects, including supernovae remnants associated with molecular clouds (e.g., Zhao et al., 2018; Yu et al., 2019; Shan et al., 2019; Zhao et al., 2020; Wang et al., 2020). The robustness of distances thus obtained relies on the precision of distance estimates of the individual stars. Tests based on stellar distances yielded by Gaia DR2 parallaxes (Gaia Collaboration et al., 2016, 2018; Lindegren et al., 2018) have shown that molecular cloud distances estimated with the aforementioned extinction method can reach an accuracy better than 5 per cent (Chen et al., 2020b).
In the current work, we have applied the method and derived accurate distances to a sample of 64 PGCCs, of which Zhang et al. (2018) presented a detailed study of their physical properties based on the kinematic distances calculated with the Bayesian distance calculator of Reid et al. (2016). For this purpose, we have used the stellar catalogues from Chen et al. (2019) and Green et al. (2019). Apart from providing significantly improved distance estimates, our results also allow us to assess the uncertainties of kinematic distances and provide an update of the physical parameters presented by Zhang et al. (2018).
2 Data
Zhang et al. (2016) selected 96 PGCCs in the second Galactic quadrant (98° 180°and 4° 10°) which are those densest ECCs in the region. Zhang et al. (2018) studied 64 of the 96 Zhang et al. (2016) PGCCs that were covered by both the Submillimetre Common-User Bolometer Array 2 (SCUBA-2; Holland et al., 2013) 850 m continuum and Purple Mountain Observatory (PMO) 13CO and C18O = 1-0 line observations. These sources are of great important to understand the early evolution of molecular clouds and dense cores in different environments. To estimate the extinction distances of the PGCCs catalogued by Zhang et al. (2018), one needs extinction profiles along the sightlines of those PGCCs. In the current work, data from two previous studies have been used to construct those profiles.
Chen et al. (2019) presented estimates of dust reddening, and colour excesses , and of over 56 million stars in the Galactic disk ( 10°), based on the optical to near-infrared (IR) photometry provided by the Gaia DR2, the Two Micron All Sky Survey (2MASS; Skrutskie et al., 2006) and the Wide-Field Infrared Survey Explorer (WISE; Wright et al., 2010). The reddening values were estimated with a Random Forest model trained by a training sample constructed from the various spectroscopic surveys. In this work, we convert their values to those of using the relation, = 0.75 (Chen et al., 2019). The typical uncertainties in are 0.07 mag (Chen et al., 2019). Distances from Bailer-Jones et al. (2018) are adopted for the stars, estimated from the Gaia DR2 parallaxes with a simple Bayesian approach. Chen et al. (2019) excluded the stars with Gaia DR2 parallax uncertainties larger than 20 per cent, leading to a sample of over 32 million stars. The typical distances probed by stars catalogued by Chen et al. are only about 4 kpc, mainly due to their parallax error cut adopted in that work.
In this work, we have also used the extinction catalogue presented by Green et al. (2019). Based on optical to near-IR photometry provided by the Pan-STARRS1 (Chambers et al., 2016), 2MASS and Gaia DR2, as well as the parallaxes from the Gaia DR2, Green et al. (2019) have calculated distances and reddening values of about 799 million stars in the northern sky (Declination 30°) with a hierarchical Bayesian algorithm. The stellar parameter catalogue of Green et al. (2019) provides values of distance modulus (“dm") and reddening (“E") of the stars. The typical uncertainties are 0.10 mag for (Green et al., 2019). The typical depth distance limit of sightlines that overlap with our sample PGCCs are about 7.0 kpc.


3 Method
To determine the extinction distance to a given sample PGCC, we first select stars from the catalogues of Chen et al. (2019) and Green et al. (2019) along the lines of sight overlap with the PGCC. For each PGCC, there are several cores identified by Zhang et al. (2018). In the current work, we only use the reddening profiles of the sightlines overlapping with those cores, where the sharp increases of the reddening values, i.e. the reddening jumps, are much more significant than for the other regions of the cloud. For each core of a given PGCC, we select stars that fall within the core size area (‘FWHM’ in Table 3 of Zhang et al., 2018). For a typical solid angle of about 6.15 arcmin2 subtended by a core, there are typically 300 stars within the area. In the current work, we assume that all the cores in a single clump have the same distances and merge all the stars selected from the individual cores of a clump to determine its extinction distance. Typically, there are 1,900 stars for an area of about 61.2 arcmin2 covered by a typical clump. There are not enough stars ( 1000) for 6 catalogued clumps (G133.28+08.81, G133.48+09.02, G142.62+07.29, G147.01+03.39, G156.04+06.03 and G176.35+01.92), mainly due to the small total areas of their cores. This leads to very large distance uncertainties of those clumps. Accordingly, to better constrain the distances of those six clumps, we have adopted a star selection radius of twice the core size for each core. For the nearby clumps (distance 0.5 kpc), we are not able to find enough foreground stars to the clumps within the radii of their cores. For sightlines through those nearby clumps, we also adopt a larger star selection radius twice of their core sizes.
We then find the position of the reddening jump, i.e. the distance of the PGCC, by modeling the reddening profile constructed from the selected stars. As the dust grain densities in the cores of a PGCC are much higher than those in the diffuse medium, we have assumed that the dust extinction within the distance range of the clump all arises from the local dust grains within the cores of the clump. The reddening profile within the distance range of the clump is thus given by,
| (1) |
where is a constant that represents the reddening contributed by the foreground dust, and is the reddening contributed by the dust grains in the cores of the clump. Assuming a Gaussian radial density profile of the core dust, we have,
| (2) |
where is the distance of the clump, the width of the reddening jump and the total reddening contributed by the cores of the clump.
There could be more than one reddening jump in the reddening profile of a given PGCC. We expect that the cores of the PGCC would produce the most significant jump. We thus only fit the most significant jump for a given profile. The binned average reddening values in the distance range of a jump are fitted with the above model using the Markov chain Monte Carlo (MCMC) algorithm emcee (Foreman-Mackey et al., 2013). The uncertainties of the resultant parameters are calculated using the Monte Carlo method (Wall & Jenkins, 2003). For each clump, we randomly generate 300 samples of the selected stars according to their distance and reddening uncertainties. The fitting algorithm is applied to all those samples. The rms scatters of the derived parameters are taken as their uncertainties.
4 Result
The distance estimation algorithm outlined above is applied to all the 64 PGCCs catalogued. Among these, three clumps (G175.20+01.28, G175.53+01.34, G176.35+01.92) exhibit no obvious jump, thus we can not derive their distances. As a result, we have derived directly-measured extinction distances to 61 PGCCs. In Fig. 1 we show 4 examples of the reddening profile fitting. In general, the extinction profiles yielded by stars from Chen et al. (2019) are in good agreement with those of Green et al. (2019). Reddening jumps produced by the cores of the PGCCs are significant and clearly visible. The medians binned reddening values are nicely traced by the best-fit models.
The upper two panels of Fig. 1 show the example extinction distance determinations for clumps G112.52+08.38 and G169.14-01.13. In both cases, one reddening jump produced by the corresponding clump is clearly visible. The resultant distances of G112.52+08.38 and G169.14-01.13 are respectively 363 pc and 3,019 pc. The width of the reddening jump of the much more distant clump G169.14-01.13 ( = 1017 pc) is much larger than that of the nearby clump G112.52+08.38 ( = 120 pc). This is mainly due to the fact that the widths of the reddening jumps are mainly dominated by the distance uncertainties of stars used to construct the reddening profiles (Chen et al., 2020b), and in general, the more distant the stars, the larger the uncertainties of their distances.
In the lower two panels of Fig. 1, we show the extinction distance determinations for clumps G133.48+09.02 and G148.24+00.41. More than one reddening jumps are found in the reddening profiles of these two PGCCs. As mentioned in Sec. 3, we select the most significant reddening jump in such cases. The resultant distances of G133.48+09.02 and G148.24+00.41 are 980 pc and 1616 pc, respectively. Again we find that the width of the reddening jump of the more distant clump G133.48+09.02 ( = 554 pc) is much larger than that of the nearby clump G148.24+00.41 ( = 112 pc).
Figures analogous to Fig. 1 for all the 61 PGCCs are available online111http://paperdata.china-vo.org/guo/dust/PGCCs˙61.pdf. In Table 1 we list the best-fit values of distance and of the total reddening of these clumps. For comparison, we also list their values of kinematic distance derived by Zhang et al. (2018). The sample clumps range in distance from 200 to 4,000 pc.
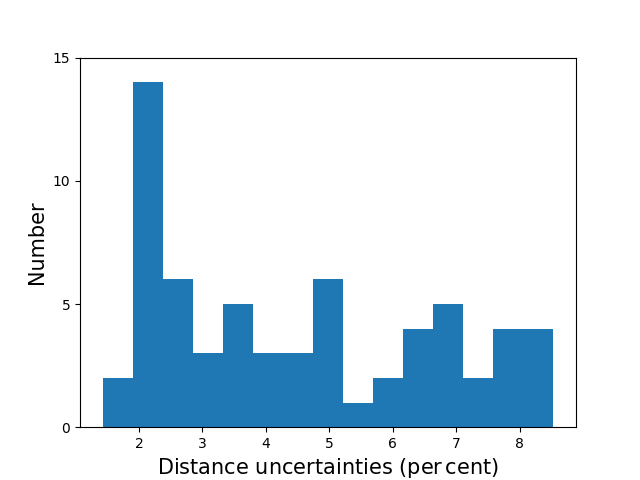
In Fig. 2, we show a histogram distribution of the resulting distance uncertainties. For our catalogued clumps, the distance uncertainties are smaller than 8 per cent. This is benefits from the accurate parallax measurements of stars from Gaia DR2. The uncertainties of the derived distances include contributions from the statistical and systematic errors. The statistical uncertainties are given by the MCMC analysis, and are very small due to the large sample of selected stars. The systematic uncertainties, resulting from the uncertainties of the distances and reddening values of the individual stars, arise mainly from the uncertainties in the Gaia parallaxes, the stellar atmospheric models, and of the extinction law and possible variations of the latter. In this work, most of the sample clumps are located at nearby distances ( 2 kpc), where we can have very accurate stellar parallaxes from Gaia DR2. The typical distance errors for the individual stars from the Chen et al. and Green et al. catalogues are smaller than 10 and 15 per cent, respectively.
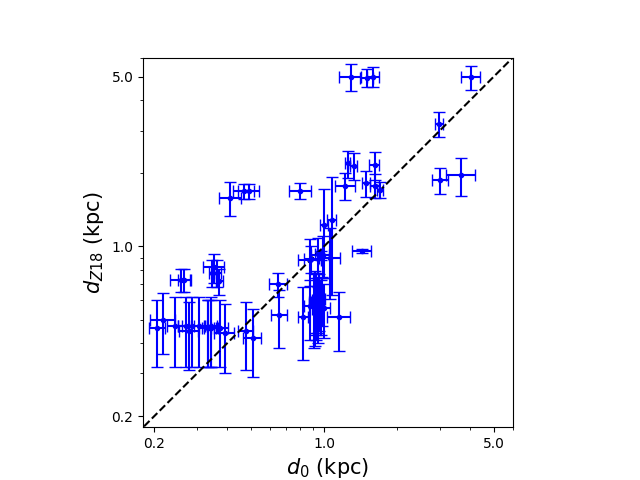
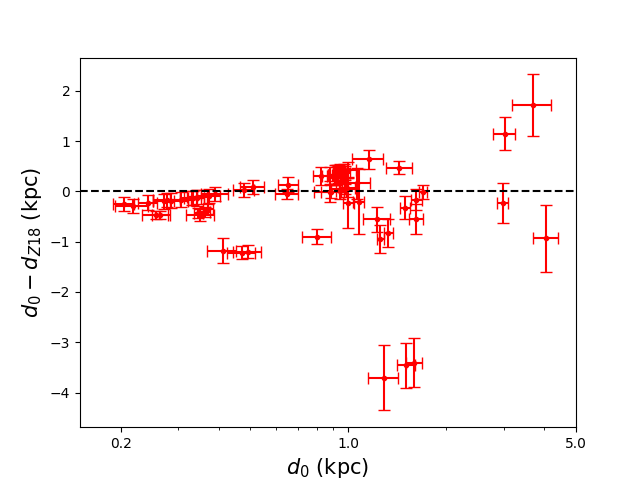
In Fig. 3, we compare our newly derived extinction distances with the kinematic values deduced by Zhang et al. (2018). In general, the newly estimated extinction distances differ significantly from the kinematic ones. Amongst the sample objects, 10 clumps have similar kinematic distances ( 0.46 kpc), as they all have similar radial velocities ( 8.0 or 3.0 km s-1). However, their directly measured extinction distances range from 0.21 to 0.51 kpc. It is quite possible that the peculiar and non-circular motions of the clumps may have significantly affected the calculation of their kinematic distances (Liszt & Burton, 1981; Gómez, 2006; Reid et al., 2009). For some PGCCs, such as G176.17-02.10 and G177.14-01.21, the differences between the two sets of distances are very large. The kinematic distance probabilities of those clumps derived with the Bayesian Distance Calculator (see Table 1 of Zhang et al., 2018) are very small (less than 0.5), indicating that those kinematic distances are poorly constrained.
5 Discussion
The improved distance estimates allow us to revise some of the distance-dependent physical properties of the cores of the PGCCs, such as their radii, masses and the virial parameters. We update those physical parameters by simply rescaling the results of Zhang et al. (2018). For example, effective radius of a Planck core is proportional to distance , . Thus the revised radius is evaluated as,
| (3) |
Similarly, the revised mass is given by,
| (4) |
We note that these updates also lead to changes of other parameters, such as the virial parameter, which is given by,
| (5) |
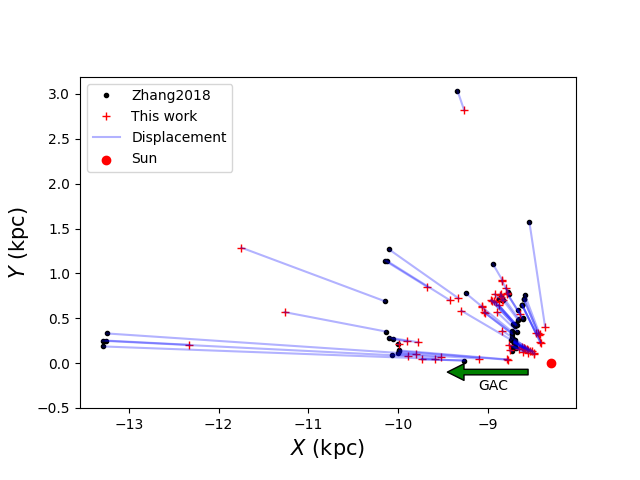
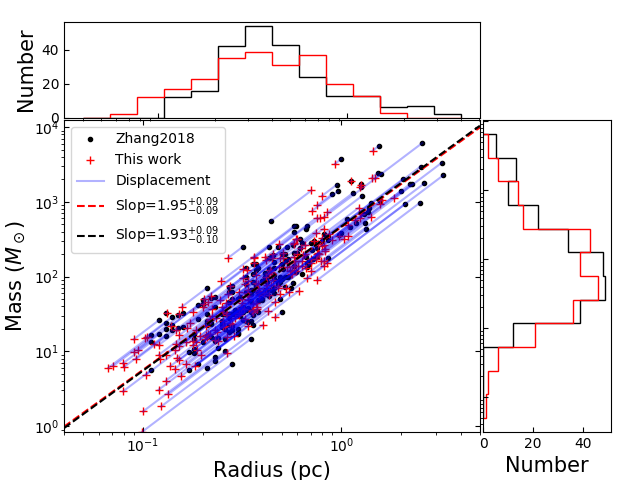
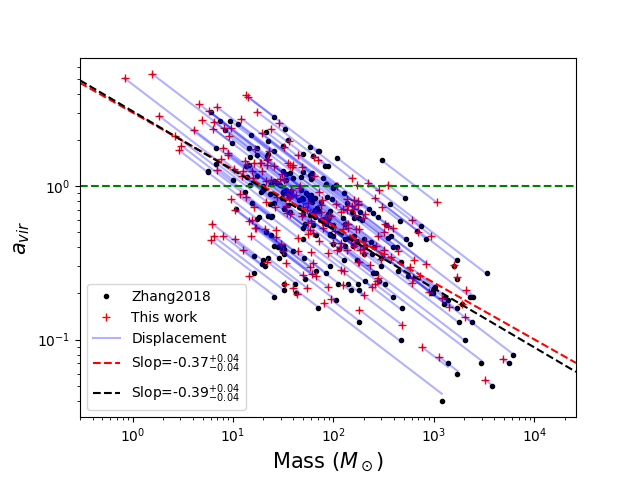
Fig. 4 plots the space distribution of these 61 PGCCs in the – space with both the original kinematic distances and our updated distances, where the distance changes are indicated. According to the formula (3) and (4), we present the changes of these physical quantities in Fig. 5. From the histograms in the left panel of Fig. 5, we find that on the whole the radii and masses calculated with the new extinction distances tend to be smaller than those of Zhang et al. (2018), by respectively 17.9 and 32.6 per cent. This leads us to conclude that to understand the local molecular structures, accurate distances are necessary. We use an MCMC algorithm to fit the mass-radius relation for both sets of distances. The new distances yield a slope of 1.950.09, comparable to 1.930.09 obtained with the kinematic distances. In spite of the significant changes, the slope is largely unaffected. The result is understandable, considering that a change in the distance measurement leads to changes in both mass and size estimates. Since the changes are correlated, the relation remains untouched.
In addition, we have applied simple Kolmogorov-Smirnov (K-S) tests to the newly derived physical properties (e.g. radius and masses) of the sample PGCCs and those from Zhang et al. (2018). The distributions of the radius and masses obtained from the new extinction distances do not change significantly comparing to those estimated from the kinematic distances. Accurate extinction-based distance measurements are necessary for the estimation of robust physical parameters of the individual sources. However, as the sample PGCCs have relative large ranges of masses and radius, the distance error of a level of about 50 per cent will not significantly affect the overall sample properties like the mass and radii distributions.
We have also revisited the relation between mass () and virial parameter, = / (Bertoldi & McKee, 1992; Zhang et al., 2018), the result of which is presented in the right panel of Fig. 5. The two slopes, 0.380.04 derived from the updated distances, and 0.390.04 derived from the kinematic distances, are consistent with each other. Again, the relation is largely unaffected, although the virial parameters of the individual cores do change significantly with the new distance estimates. On average, the new virial parameters of the cores deduced with our extinction distances are larger than those of Zhang et al. (2018) by 21.8 per cent. This again points to the importance of robust distance estimates when studying the gravitational boundedness of molecular clumps.
6 Summary
Based on results of 3D extinction mapping, we have calculated the extinction distances of 61 PGCCs in the second quadrant of the Milky Way analyzed previously by Zhang et al. (2018). For this purpose, we use two catalogues published by Chen et al. (2019) and Green et al. (2019) that presented robust estimates of extinction and distance for huge numbers of stars. Distances of the clumps are determined by finding the positions of significant reddening jumps in the reddening profiles. The jumps are fitted with a simple reddening model using an MCMC algorithm. The typical uncertainties of distances thus derived are less than 8 per cent. For the majority of the PGCCs, we find significant differences between our newly derived distances and those kinematic ones from Zhang et al. (2018).
Using newly estimated distances, we have updated distance-dependent physical parameters of the cores, including radius, mass and the virial parameter. Comparing to the results of Zhang et al. (2018), the new radii, masses and virial parameters calculated using our new extinction distances tend to be smaller by 17.9, 32.6 and larger by 21.8 per cent, respectively.
Table 1. Distances of 64 PGCCs in the second Galactic quadrant
| Name | R.A.(J2000) | DEC.(J2000) | a | ||
|---|---|---|---|---|---|
| (hh:mm:ss) | (dd:mm:ss) | (pc) | (mag) | (pc) | |
| G098.50-03.24 | 22:05:00.08 | +51:33:11.69 | 0.3 | ||
| G108.85-00.80 | 22:58:51.53 | +58:57:27.09 | 0.87 | ||
| G110.65+09.65 | 22:28:00.22 | +69:01:48.10 | 0.6 | ||
| G112.52+08.38 | 22:52:47.62 | +68:49:28.31 | 0.89 | ||
| G112.60+08.53 | 22:52:54.76 | +68:59:53.90 | 0.86 | ||
| G115.92+09.46 | 23:24:04.62 | +71:08:08.69 | 0.59 | ||
| G116.08-02.38 | 23:56:41.79 | +59:45:13.19 | 0.87 | ||
| G116.12+08.98 | 23:28:14.03 | +70:45:12.38 | 0.56 | ||
| G120.16+03.09 | 00:24:26.01 | +65:49:27.59 | 1.1 | ||
| G120.67+02.66 | 00:29:41.95 | +65:26:39.99 | 0.83 | ||
| G120.98+02.66 | 00:32:38.94 | +65:28:07.08 | 0.71 | ||
| G121.35+03.39 | 00:35:48.66 | +66:13:13.29 | 0.69 | ||
| G121.90-01.54 | 00:42:52.64 | +61:18:23.20 | 0.81 | ||
| G121.92-01.71 | 00:43:06.34 | +61:08:21.59 | 0.65 | ||
| G125.66-00.55 | 01:14:52.20 | +62:11:16.60 | 0.57 | ||
| G126.49-01.30 | 01:21:14.55 | +61:21:34.60 | 0.68 | ||
| G126.95-01.06 | 01:25:19.48 | +61:32:36.19 | 0.41 | ||
| G127.22-02.25 | 01:26:10.18 | +60:19:29.30 | 0.39 | ||
| G127.88+02.66 | 01:38:39.10 | +65:05:06.49 | 0.42 | ||
| G128.95-00.18 | 01:43:15.17 | +62:04:39.09 | 0.47 | ||
| G131.72+09.70 | 02:39:57.51 | +70:42:11.60 | 0.4 | ||
| G132.07+08.80 | 02:39:18.17 | +69:44:01.11 | 0.71 | ||
| G132.03+08.95 | 02:39:33.56 | +69:53:21.08 | 0.56 | ||
| G133.28+08.81 | 02:51:42.22 | +69:14:13.39 | 1.1 | ||
| G133.48+09.02 | 02:54:44.50 | +69:19:57.59 | 1.03 | ||
| G136.31-01.77 | 02:36:07.02 | +58:21:09.09 | 0.53 | ||
| G140.49+06.07 | 03:37:46.12 | +63:07:27.29 | 0.84 | ||
| G140.77+05.00 | 03:34:18.18 | +62:05:35.89 | 0.67 | ||
| G142.49+07.48 | 03:59:13.56 | +62:58:52.40 | 0.44 | ||
| G142.62+07.29 | 03:59:00.66 | +62:45:12.60 | 0.46 | ||
| G144.84+00.76 | 03:40:20.80 | +56:16:28.09 | 0.98 | ||
| G146.11+07.80 | 04:23:14.52 | +60:44:31.20 | 0.56 | ||
| G146.71+02.05 | 03:56:37.16 | +56:07:23.10 | 0.79 | ||
| G147.01+03.39 | 04:04:41.36 | +56:56:16.79 | 0.53 | ||
| G148.00+00.09 | 03:54:48.04 | +53:47:19.89 | 0.97 | ||
| G148.24+00.41 | 03:57:26.18 | +53:52:36.30 | 0.91 | ||
| G149.23+03.07 | 04:14:48.52 | +55:12:03.29 | 1.4 | ||
| G149.41+03.37 | 04:17:09.06 | +55:17:39.39 | 1.16 | ||
| G149.52-01.23 | 03:56:52.61 | +51:48:01.70 | 1.05 | ||
| G149.58+03.45 | 04:18:23.93 | +55:13:30.59 | 1.1 | ||
| G149.65+03.54 | 04:19:11.24 | +55:14:44.39 | 1.26 | ||
| G150.22+03.91 | 04:23:51.69 | +55:06:22.50 | 1.17 | ||
| G150.44+03.95 | 04:25:07.08 | +54:58:32.39 | 1.04 | ||
| G151.08+04.46 | 04:30:42.87 | +54:51:53.89 | 0.9 | ||
| G151.45+03.95 | 04:29:56.25 | +54:14:51.70 | 1.08 | ||
| G154.90+04.61 | 04:48:27.03 | +52:06:30.39 | 0.88 | ||
| G156.04+06.03 | 05:00:19.24 | +52:06:45.60 | 0.7 | ||
| G156.20+05.26 | 04:57:00.65 | +51:31:08.89 | 1.03 | ||
| G157.25-01.00 | 04:32:09.45 | +46:37:25.00 | 1.36 | ||
| G159.52+03.26 | 04:59:55.05 | +47:40:52.00 | 1.04 |
Table 2 - continued
| Name | R.A.(J2000) | DEC.(J2000) | a | ||
|---|---|---|---|---|---|
| (hh:mm:ss) | (dd:mm:ss) | (pc) | (mag) | (pc) | |
| G162.79+01.34 | 05:02:42.87 | +43:55:05.70 | 0.87 | ||
| G169.14-01.13 | 05:12:20.07 | +37:20:57.09 | 0.86 | ||
| G171.03+02.66 | 05:33:35.43 | +37:56:42.69 | 0.97 | ||
| G171.34+02.59 | 05:34:06.95 | +37:38:47.30 | 0.87 | ||
| G172.85+02.27 | 05:36:51.80 | +36:11:58.29 | 1.18 | ||
| G175.20+01.28 | 05:38:55.10 | +33:41:05.89 | 0.37 | ||
| G175.53+01.34 | 05:39:59.24 | +33:26:08.80 | 0.37 | ||
| G176.17-02.10 | 05:27:55.18 | +31:01:34.99 | 0.63 | ||
| G176.35+01.92 | 05:44:23.17 | +33:02:58.99 | 0.73 | ||
| G176.94+04.63 | 05:57:00.77 | +33:55:16.30 | 0.89 | ||
| G177.09+02.85 | 05:50:02.12 | +32:53:35.90 | 0.82 | ||
| G177.14-01.21 | 05:33:52.82 | +30:42:36.29 | 0.68 | ||
| G177.86+01.04 | 05:44:35.76 | +31:17:57.40 | 0.83 | ||
| G178.28-00.61 | 05:39:03.83 | +30:04:05.90 | 1.02 |
a Kinematic distances from Zhang
et al. (2018)
Acknowledgements
We thank the anonymous referee for the instructive comments. This work is partially supported by National Key R&D Program of China No. 2019YFA0405503, National Natural Science Foundation of China grants No. 11803029, U1531244, 11833006 and U1731308, and Yunnan University grant No. C176220100007.
Data availability
The data underlying this article are available in the article and in its online supplementary material.
References
- Anders et al. (2019) Anders F., et al., 2019, A&A, 628, A94
- Bailer-Jones et al. (2018) Bailer-Jones C. A. L., Rybizki J., Fouesneau M., Mantelet G., Andrae R., 2018, AJ, 156, 58
- Bertoldi & McKee (1992) Bertoldi F., McKee C. F., 1992, ApJ, 395, 140
- Blitz & Williams (1999) Blitz L., Williams J. P., 1999, in Lada C. J., Kylafis N. D., eds, NATO Advanced Science Institutes (ASI) Series C Vol. 540, NATO Advanced Science Institutes (ASI) Series C. p. 3
- Chambers et al. (2016) Chambers K. C., et al., 2016, arXiv e-prints, p. arXiv:1612.05560
- Chen et al. (2014) Chen B. Q., et al., 2014, MNRAS, 443, 1192
- Chen et al. (2017) Chen B. Q., et al., 2017, MNRAS, 472, 3924
- Chen et al. (2019) Chen B. Q., et al., 2019, MNRAS, 483, 4277
- Chen et al. (2020a) Chen B., Wang S., Hou L., Yang Y., Li Z., Zhao H., Jiang B., 2020a, MNRAS,
- Chen et al. (2020b) Chen B. Q., et al., 2020b, MNRAS, 493, 351
- Choi et al. (2014) Choi Y. K., Hachisuka K., Reid M. J., Xu Y., Brunthaler A., Menten K. M., Dame T. M., 2014, ApJ, 790, 99
- Foreman-Mackey et al. (2013) Foreman-Mackey D., Hogg D. W., Lang D., Goodman J., 2013, PASP, 125, 306
- Gaia Collaboration et al. (2016) Gaia Collaboration et al., 2016, A&A, 595, A1
- Gaia Collaboration et al. (2018) Gaia Collaboration et al., 2018, A&A, 616, A1
- Gómez (2006) Gómez G. C., 2006, AJ, 132, 2376
- Green et al. (2015) Green G. M., et al., 2015, ApJ, 810, 25
- Green et al. (2018) Green G. M., et al., 2018, MNRAS, 478, 651
- Green et al. (2019) Green G. M., Schlafly E., Zucker C., Speagle J. S., Finkbeiner D., 2019, ApJ, 887, 93
- Guo et al. (2020) Guo H. L., et al., 2020, arXiv e-prints, p. arXiv:2010.14092
- Hachisuka et al. (2015) Hachisuka K., Choi Y. K., Reid M. J., Brunthaler A., Menten K. M., Sanna A., Dame T. M., 2015, ApJ, 800, 2
- Holland et al. (2013) Holland W. S., et al., 2013, MNRAS, 430, 2513
- Huang et al. (2016) Huang Y., et al., 2016, MNRAS, 463, 2623
- Kolpak et al. (2003) Kolpak M. A., Jackson J. M., Bania T. M., Clemens D. P., Dickey J. M., 2003, ApJ, 582, 756
- Lallement et al. (2019) Lallement R., Babusiaux C., Vergely J. L., Katz D., Arenou F., Valette B., Hottier C., Capitanio L., 2019, A&A, 625, A135
- Lindegren et al. (2018) Lindegren L., et al., 2018, A&A, 616, A2
- Liszt & Burton (1981) Liszt H. S., Burton W. B., 1981, ApJ, 243, 778
- Pestalozzi et al. (2005) Pestalozzi M. R., Minier V., Booth R. S., 2005, A&A, 432, 737
- Planck Collaboration et al. (2011a) Planck Collaboration et al., 2011a, A&A, 536, A1
- Planck Collaboration et al. (2011b) Planck Collaboration et al., 2011b, A&A, 536, A7
- Planck Collaboration et al. (2011c) Planck Collaboration et al., 2011c, A&A, 536, A22
- Planck Collaboration et al. (2011d) Planck Collaboration et al., 2011d, A&A, 536, A23
- Reid et al. (2009) Reid M. J., et al., 2009, ApJ, 700, 137
- Reid et al. (2014) Reid M. J., et al., 2014, ApJ, 783, 130
- Reid et al. (2016) Reid M. J., Dame T. M., Menten K. M., Brunthaler A., 2016, ApJ, 823, 77
- Schlafly et al. (2014) Schlafly E. F., et al., 2014, ApJ, 786, 29
- Shan et al. (2019) Shan S.-S., Zhu H., Tian W.-W., Zhang H.-Y., Yang A.-Y., Zhang M.-F., 2019, Research in Astronomy and Astrophysics, 19, 092
- Skrutskie et al. (2006) Skrutskie M. F., et al., 2006, AJ, 131, 1163
- Wall & Jenkins (2003) Wall J. V., Jenkins C. R., 2003, Practical Statistics for Astronomers. Vol. 3
- Wang et al. (2020) Wang S., Zhang C., Jiang B., Zhao H., Chen B., Chen X., Gao J., Liu J., 2020, A&A, 639, A72
- Wright et al. (2010) Wright E. L., et al., 2010, AJ, 140, 1868
- Wu et al. (2012) Wu Y., Liu T., Meng F., Li D., Qin S.-L., Ju B.-G., 2012, ApJ, 756, 76
- Wu et al. (2014) Wu Y. W., et al., 2014, A&A, 566, A17
- Xu et al. (2013) Xu Y., et al., 2013, ApJ, 769, 15
- Xu et al. (2016) Xu Y., et al., 2016, Science Advances, 2, e1600878
- Xue et al. (2015) Xue X.-X., Rix H.-W., Ma Z., Morrison H., Bovy J., Sesar B., Janesh W., 2015, ApJ, 809, 144
- Yu et al. (2019) Yu B., Chen B. Q., Jiang B. W., Zijlstra A., 2019, MNRAS, 488, 3129
- Zhang et al. (2013) Zhang B., Reid M. J., Menten K. M., Zheng X. W., Brunthaler A., Dame T. M., Xu Y., 2013, ApJ, 775, 79
- Zhang et al. (2016) Zhang T., Wu Y., Liu T., Meng F., 2016, ApJS, 224, 43
- Zhang et al. (2018) Zhang C.-P., et al., 2018, ApJS, 236, 49
- Zhao et al. (2018) Zhao H., Jiang B., Gao S., Li J., Sun M., 2018, ApJ, 855, 12
- Zhao et al. (2020) Zhao H., Jiang B., Li J., Chen B., Yu B., Wang Y., 2020, ApJ, 891, 137