Radio Monitoring of the Tidal Disruption Event Swift J164449.3+573451. IV. Continued Fading and Non-Relativistic Expansion
Abstract
We present continued radio and X-ray observations of the previously relativistic tidal disruption event (TDE) Swift J164449.3+573451 (Sw 1644+57) extending to about 9.4 years post disruption, as part of ongoing campaigns with the Jansky Very Large Array (VLA) and the Chandra X-ray observatory. We find that the X-ray emission has faded below detectable levels, with an upper limit of erg cm-2 s-1 in a 100 ks observation, while the radio emission continues to be detected and steadily fade. Both are consistent with forward shock emission from a non-relativistic outflow, although we find that the radio spectral energy distribution is better fit at these late times with an electron power law index of (as opposed to at earlier times). With the revised spectral index we find using the radio and X-ray data, and a density of cm3 at a radius of pc ( R⊙) from the black hole. The energy scale of the blastwave is erg. We also report detections of Sw 1644+57 at 3 GHz from the first two epochs of the VLA Sky Survey (VLASS), and find that off-axis Sw 1644+57-like events to may be present in the VLASS data. Finally, we find that Sw 1644+57 itself will remain detectable for decades at radio frequencies, although observations at sub-GHz frequencies will become increasingly important to characterize its dynamical evolution.
1 Introduction
A tidal disruption event (TDE) occurs when a star wanders sufficiently close to a supermassive black hole (SMBH) to be torn apart by tidal forces. In recent years, the number of observed TDEs has increased dramatically, primarily thanks to wide-field optical time-domain surveys111See http://tde.space. So far, only about 10 TDEs (about 10% of the known sample) have been detected in the radio band during dedicated follow-up observations (see Table 1; Alexander et al., 2020). In these cases, the radio emission points to non-relativistic outflows with an energy scale of erg s-1.
The TDE Sw 1644+57 remains unusual in this context. It was first detected as a -ray/X-ray event on 2011 March 28 by the Swift Burst Alert Telescope (BAT), although further analysis showed discernible emission as early as 2011 March 25 (Burrows et al., 2011). Multi-wavelength observations in the radio, millimeter, near-IR, and optical were obtained shortly after discovery, and along with the high energy emission pointed to the launch of a relativistic jet (Bloom et al., 2011; Burrows et al., 2011; Zauderer et al., 2011; Berger et al., 2012). Subsequently, two additional potential relativistic TDEs have been discovered (Cenko et al., 2012; Brown et al., 2015), although Sw 1644+57 remains by far the best-studied case.
Continued monitoring of Sw 1644+57 revealed a sharp decline by about 2 orders of magnitude in its X-ray emission days post disruption, corresponding to the relativistic jet shutting off (Zauderer et al., 2013). The subsequent X-ray emission has instead been shown to be an extension of the spectral energy distribution (SED) from the radio band, produced by the interaction of the blastwave with the ambient medium. The early radio/mm emission, and subsequent addition of X-ray information, have allowed us to track the velocity and energy scale of the blastwave, as well as the density profile of the circumnuclear medium (Berger et al., 2012; Zauderer et al., 2013; Eftekhari et al., 2018).
Here, we present continued X-ray and radio observations of Sw 1644+57 on a timescale of about 2390 to 3430 days post disruption. We use these most recent observations to continue tracking the blastwave energy and circumnuclear medium density profile. In Section 2, we present our new observations. In Section 3 we model the radio data, in conjunction with the X-ray data determine the location of the cooling frequency, and carry out an equipartition analysis to determine the physical properties of the outflow and ambient medium. In section 4 we discuss our findings in the context of the on-going evolution of Sw 1644+57, and the implications of its detection in VLASS. We summarize our conclusions in Section 5.
2 Observations
Our previous work presented radio and mm observations of Sw 1644+57 extending to about 1895 d post disruption, and X-ray observations extending to about 2020 d post disruption (Zauderer et al., 2011; Berger et al., 2012; Zauderer et al., 2013; Eftekhari et al., 2018). Here we present continued radio and X-ray observations.
2.1 Radio Observations
We obtained radio observations of Sw 1644+57 with the Karl G. Jansky Very Large Array (VLA) spanning from L- to K-band ( GHz; see Table 1; Program ID: 17B-198; PI: Eftekhari). All times are measured relative to 2011 March 25, corresponding to the time of first discernible -ray emission. We processed the data using the Common Astronomy Software Application package (CASA; McMullin et al. 2007) accessed through the python-based pwkit package222https://github.com/pkgw/pwkit (Williams et al., 2017). We performed bandpass and flux density calibration using 3C286 for all observations and frequencies and J1638+5720 for the phase calibrator. We obtained all flux densities and uncertainties via the imtool program in pwkit.
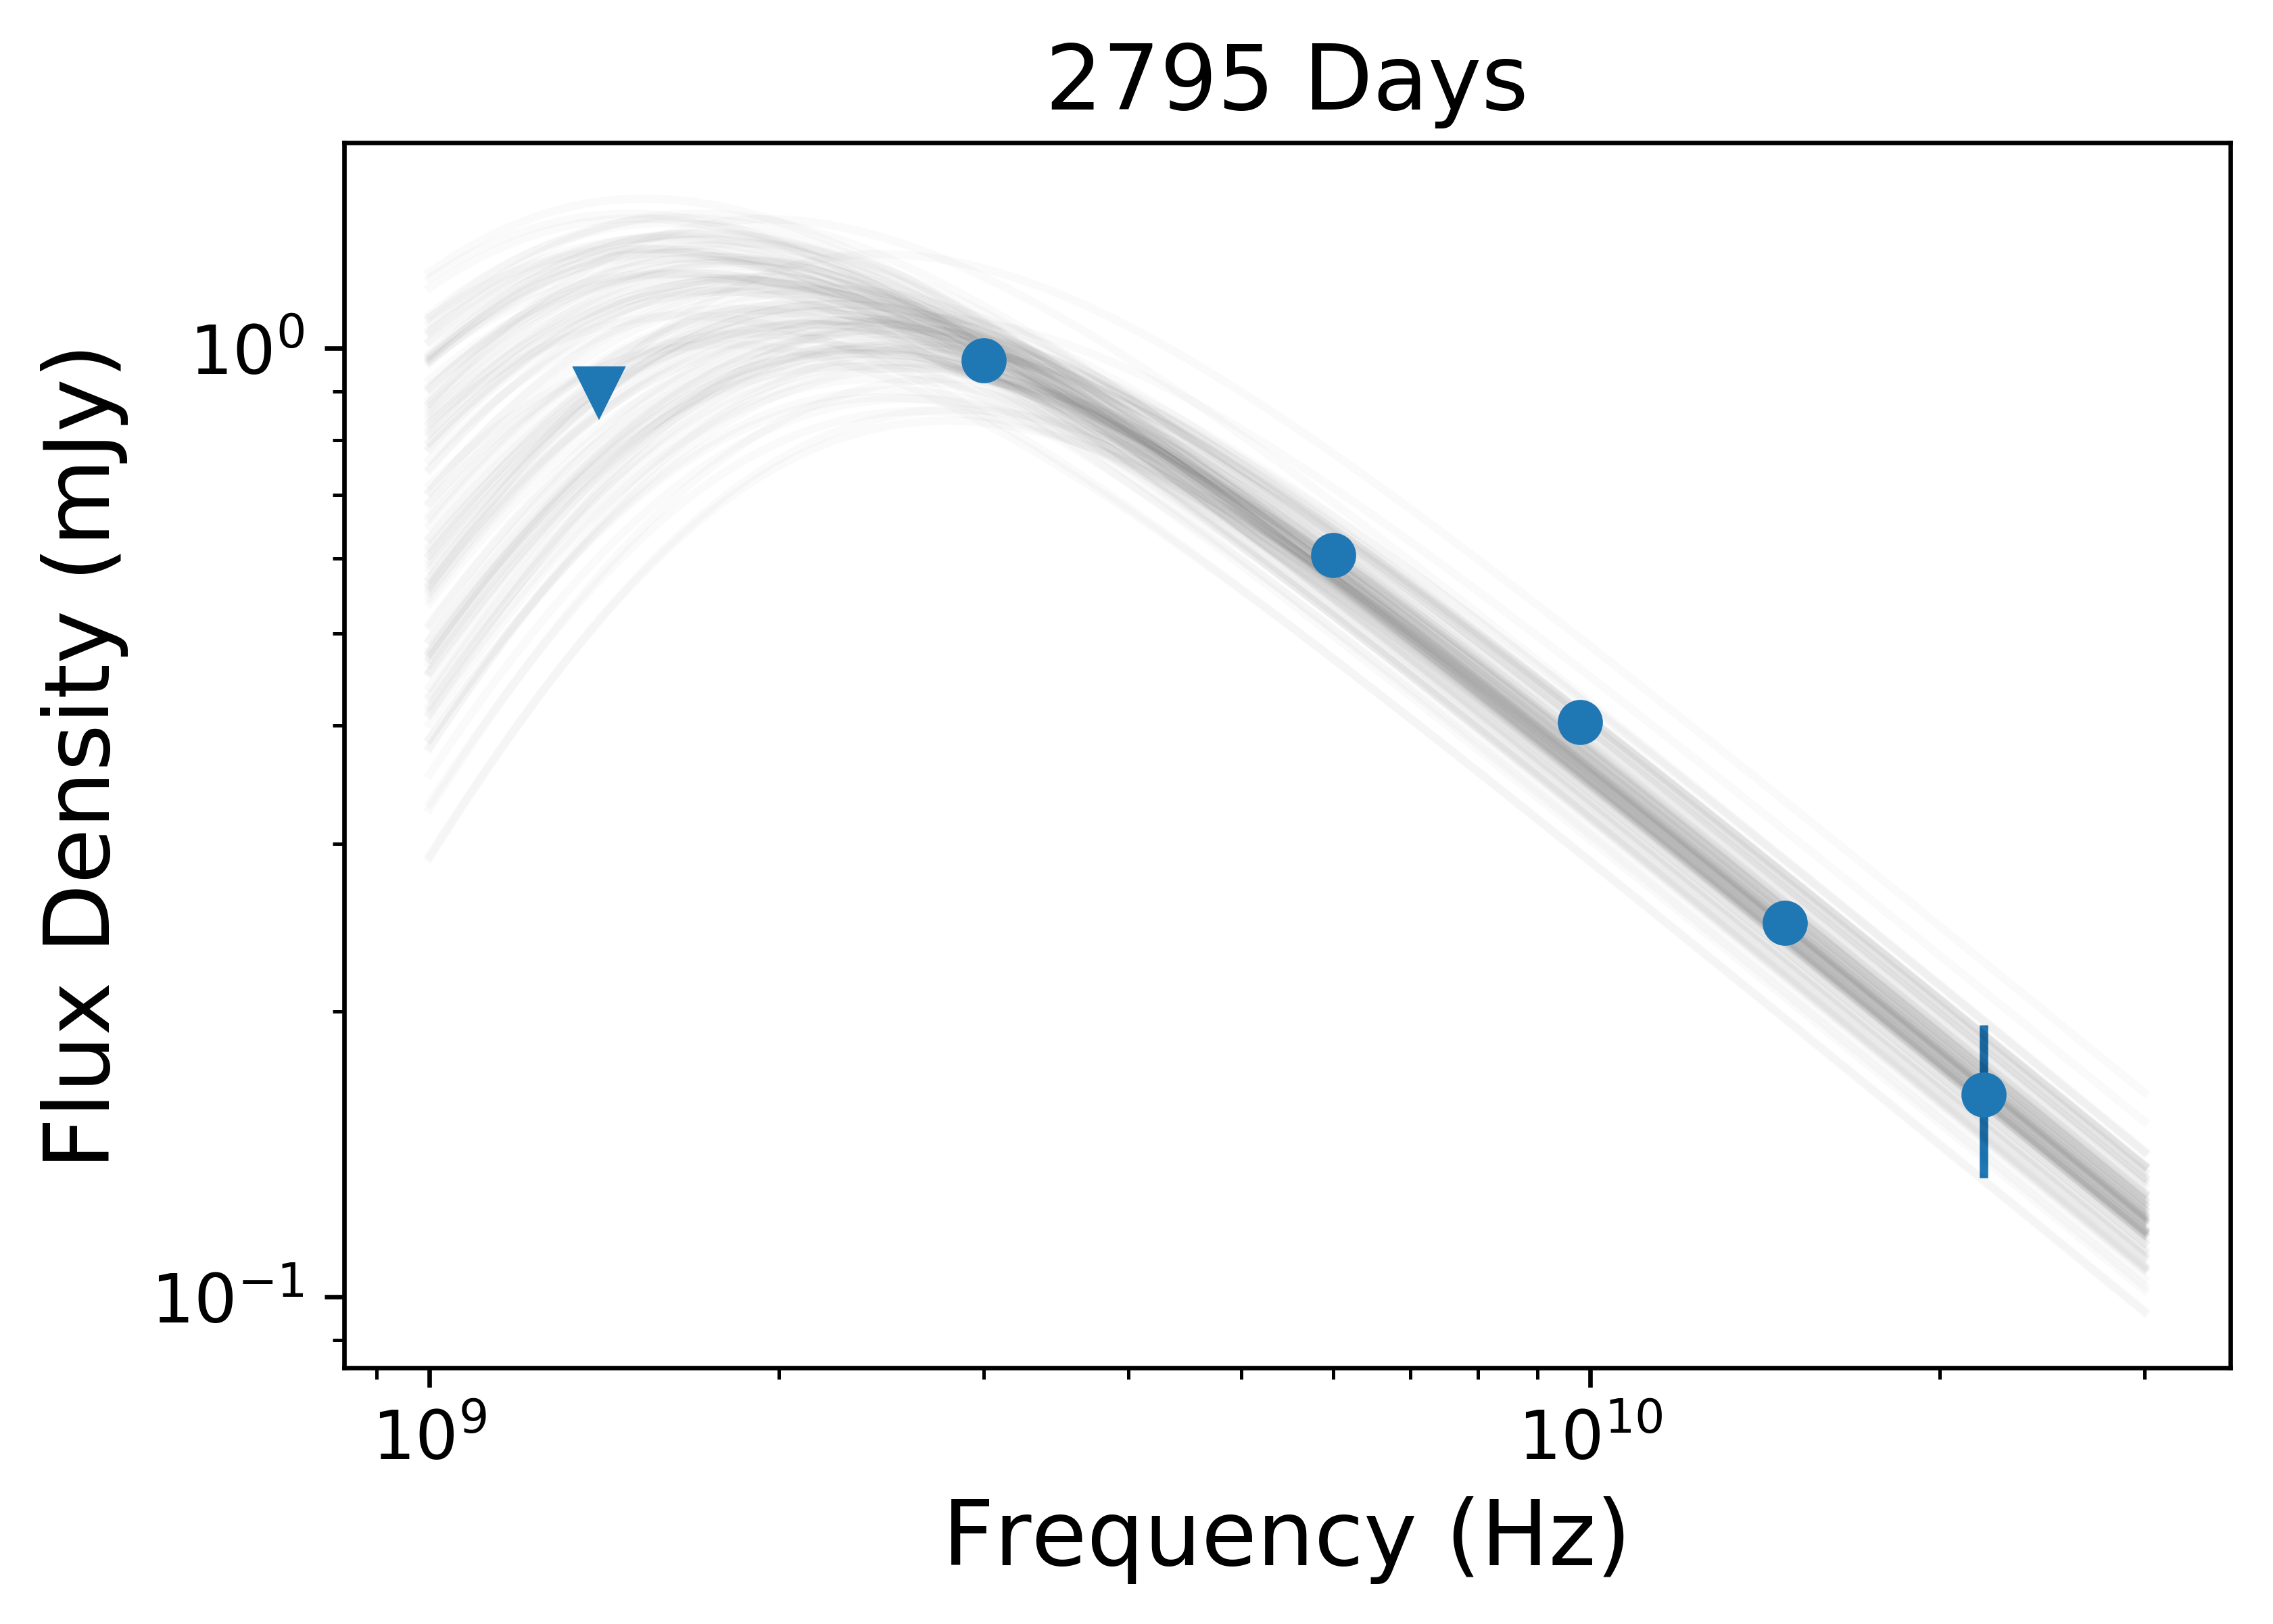
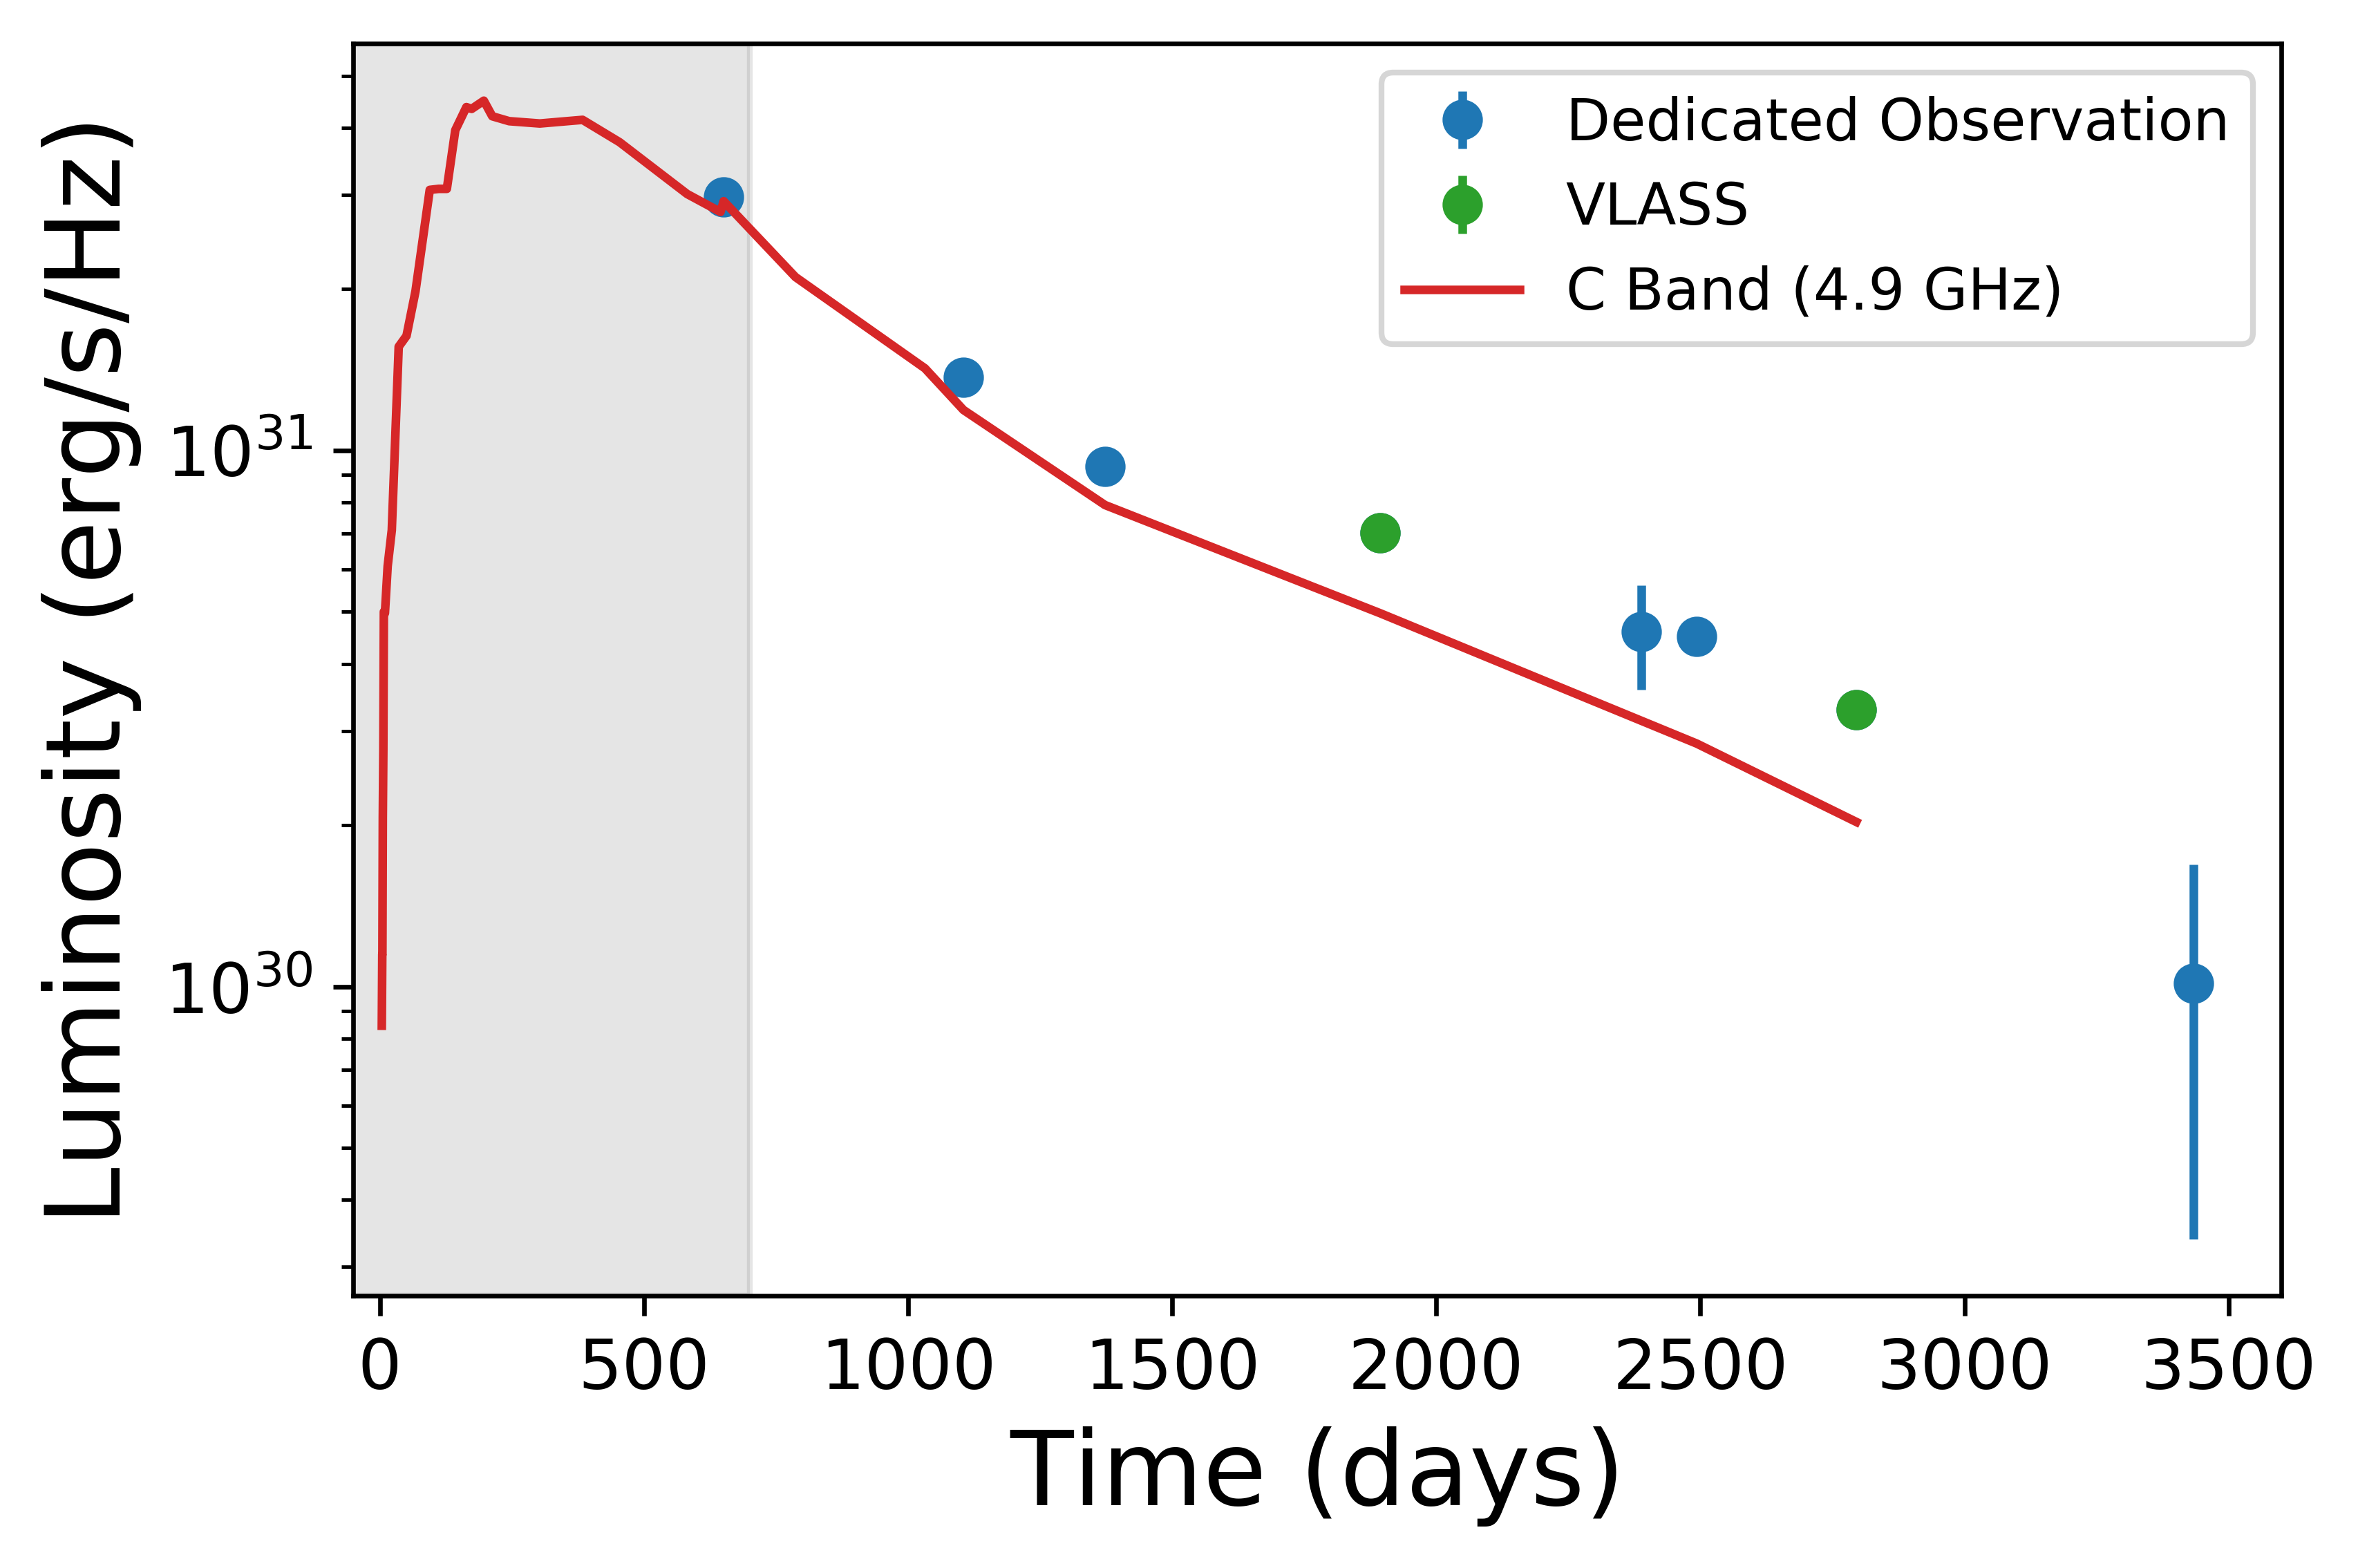
In addition to our dedicated observations, we examined observations from the Very Large Array Sky Survey (VLASS; Lacy et al., 2020) at a frequency of 3 GHz (S-band) and report a detection of mJy in the “quick look” images from 2017 October 7 (Day 2388), and a detection of mJy on 2020 August 4 (Day 3434; see Table 1). Additionally, we identified data collected by the VLA Low-band Ionosphere and Transient Experiment (VLITE; Clarke et al., 2016) during our dedicated observation on 2018 January 18 (Day 2493) and report a upper limit at 350 MHz of mJy (Table 1).
| Date | Frequency | Flux Density | |
|---|---|---|---|
| (UTC) | (d) | (GHz) | (mJy) |
| 2017 Oct 7 | 2388∗ | 3.0 | |
| 2018 Jan 20 | 2493 | 0.35 | |
| 1.5 | |||
| 2.6 | |||
| 3.4 | |||
| 6.0 | |||
| 9.8 | |||
| 14.7 | |||
| 21.8 | |||
| 2018 Nov 17 | 2795 | 1.5 | |
| 3.0 | |||
| 6.0 | |||
| 9.8 | |||
| 14.7 | |||
| 21.8 | |||
| 2020 Aug 4 | 3434∗ | 3.0 |
Note. — New VLA observations of Sw 1644+57, with upper limits quoted as .
∗ Flux density measurement from the VLA Sky Survey.
2.2 X-Ray Observations
| Date | Exposure Time | Net Counts | Net Count Rate | Flux ( keV) | |
|---|---|---|---|---|---|
| (UTC) | (d) | (ks) | (cts/s) | (ergs/cm2/s) | |
| 2015 Feb 20 | 1425 | 27.8 | 12.9 3.6 | (4.6 1.3) | (1.5 |
| 2015 April 9 | 1473 | 18.7 | 3.9 2.0 | (2.1 1.0) | (7.3 |
| 2015 Aug 25 | 1611 | 19.7 | 0 | < 4.1 | < 1.4 |
| 2016 Feb 1 | 1771 | 26.7 | 6.4 2.4 | (2.4 1.0) | (8.5 |
| 2016 April 6 | 1836 | 24.6 | 5.8 2.4 | (2.3 1.0) | (8.4 |
| 2016 19 June | 1910 | 24.6 | 4.8 2.1 | (1.9 0.9) | (6.7 |
| 2016 Oct 3 | 2019 | 24.6 | 2.6 1.5 | (1.1 0.6) | (3.9 |
| 2018 Feb | 2516 | 47.2 | 2.3 2.7 | < 1.3 | < 5.3 |
| 2018 Aug 6 | 2690 | 50.9 | 2.0 3.0 | < 1.2 | < 4.8 |
Note. — Observed X-ray counts and source significance (1) for Sw 1644+57. Unabsorbed X-ray fluxes are calculated assuming an absorbed power law model with (that is, assuming ), , and . Upper limits correspond to 3 limits. Data for are from Levan et al. (2016) (PI: Levan), and all other data before Day 2513 is from (Eftekhari et al., 2018), although the fluxes reported have been recalculated for the power law model described above.
The Chandra X-ray observations were obtained on 2018 February and August 6 (Day 2516: 47.2 ks; Day 2690: 50.9 ks; Program IDs: 19700497 and 19700757; PI: Eftekhari) using the Advanced CCD Imaging Spectrometer (ACIS-S). We analyzed the observations using standard ACIS data filtering, using CALDB within the CIAO software package (v4.12). For source detection, we performed a targeted extraction using an aperture size of and an annular background region with inner and outer radii of and , respectively, obtaining an individual net count rate and source significance for each observation.
Both of our observations yielded non-detections (see Table 2). We calculated the unabsorbed fluxes ( keV) with PIMMS (v4.10), based on the assumption of forward shock emission where and (see below), leading to a power law index of . Eftekhari et al. (2018) provided flux values for Days 1425 through 2019 assuming , and we therefore recalculate these fluxes with for consistency. We assumed an absorbed power law model with an intrinsic absorption column (Mangano et al., 2016), and a Galactic absorption of (Willingale et al., 2013).
3 Modeling and Analysis
3.1 Spectral Energy Distribution
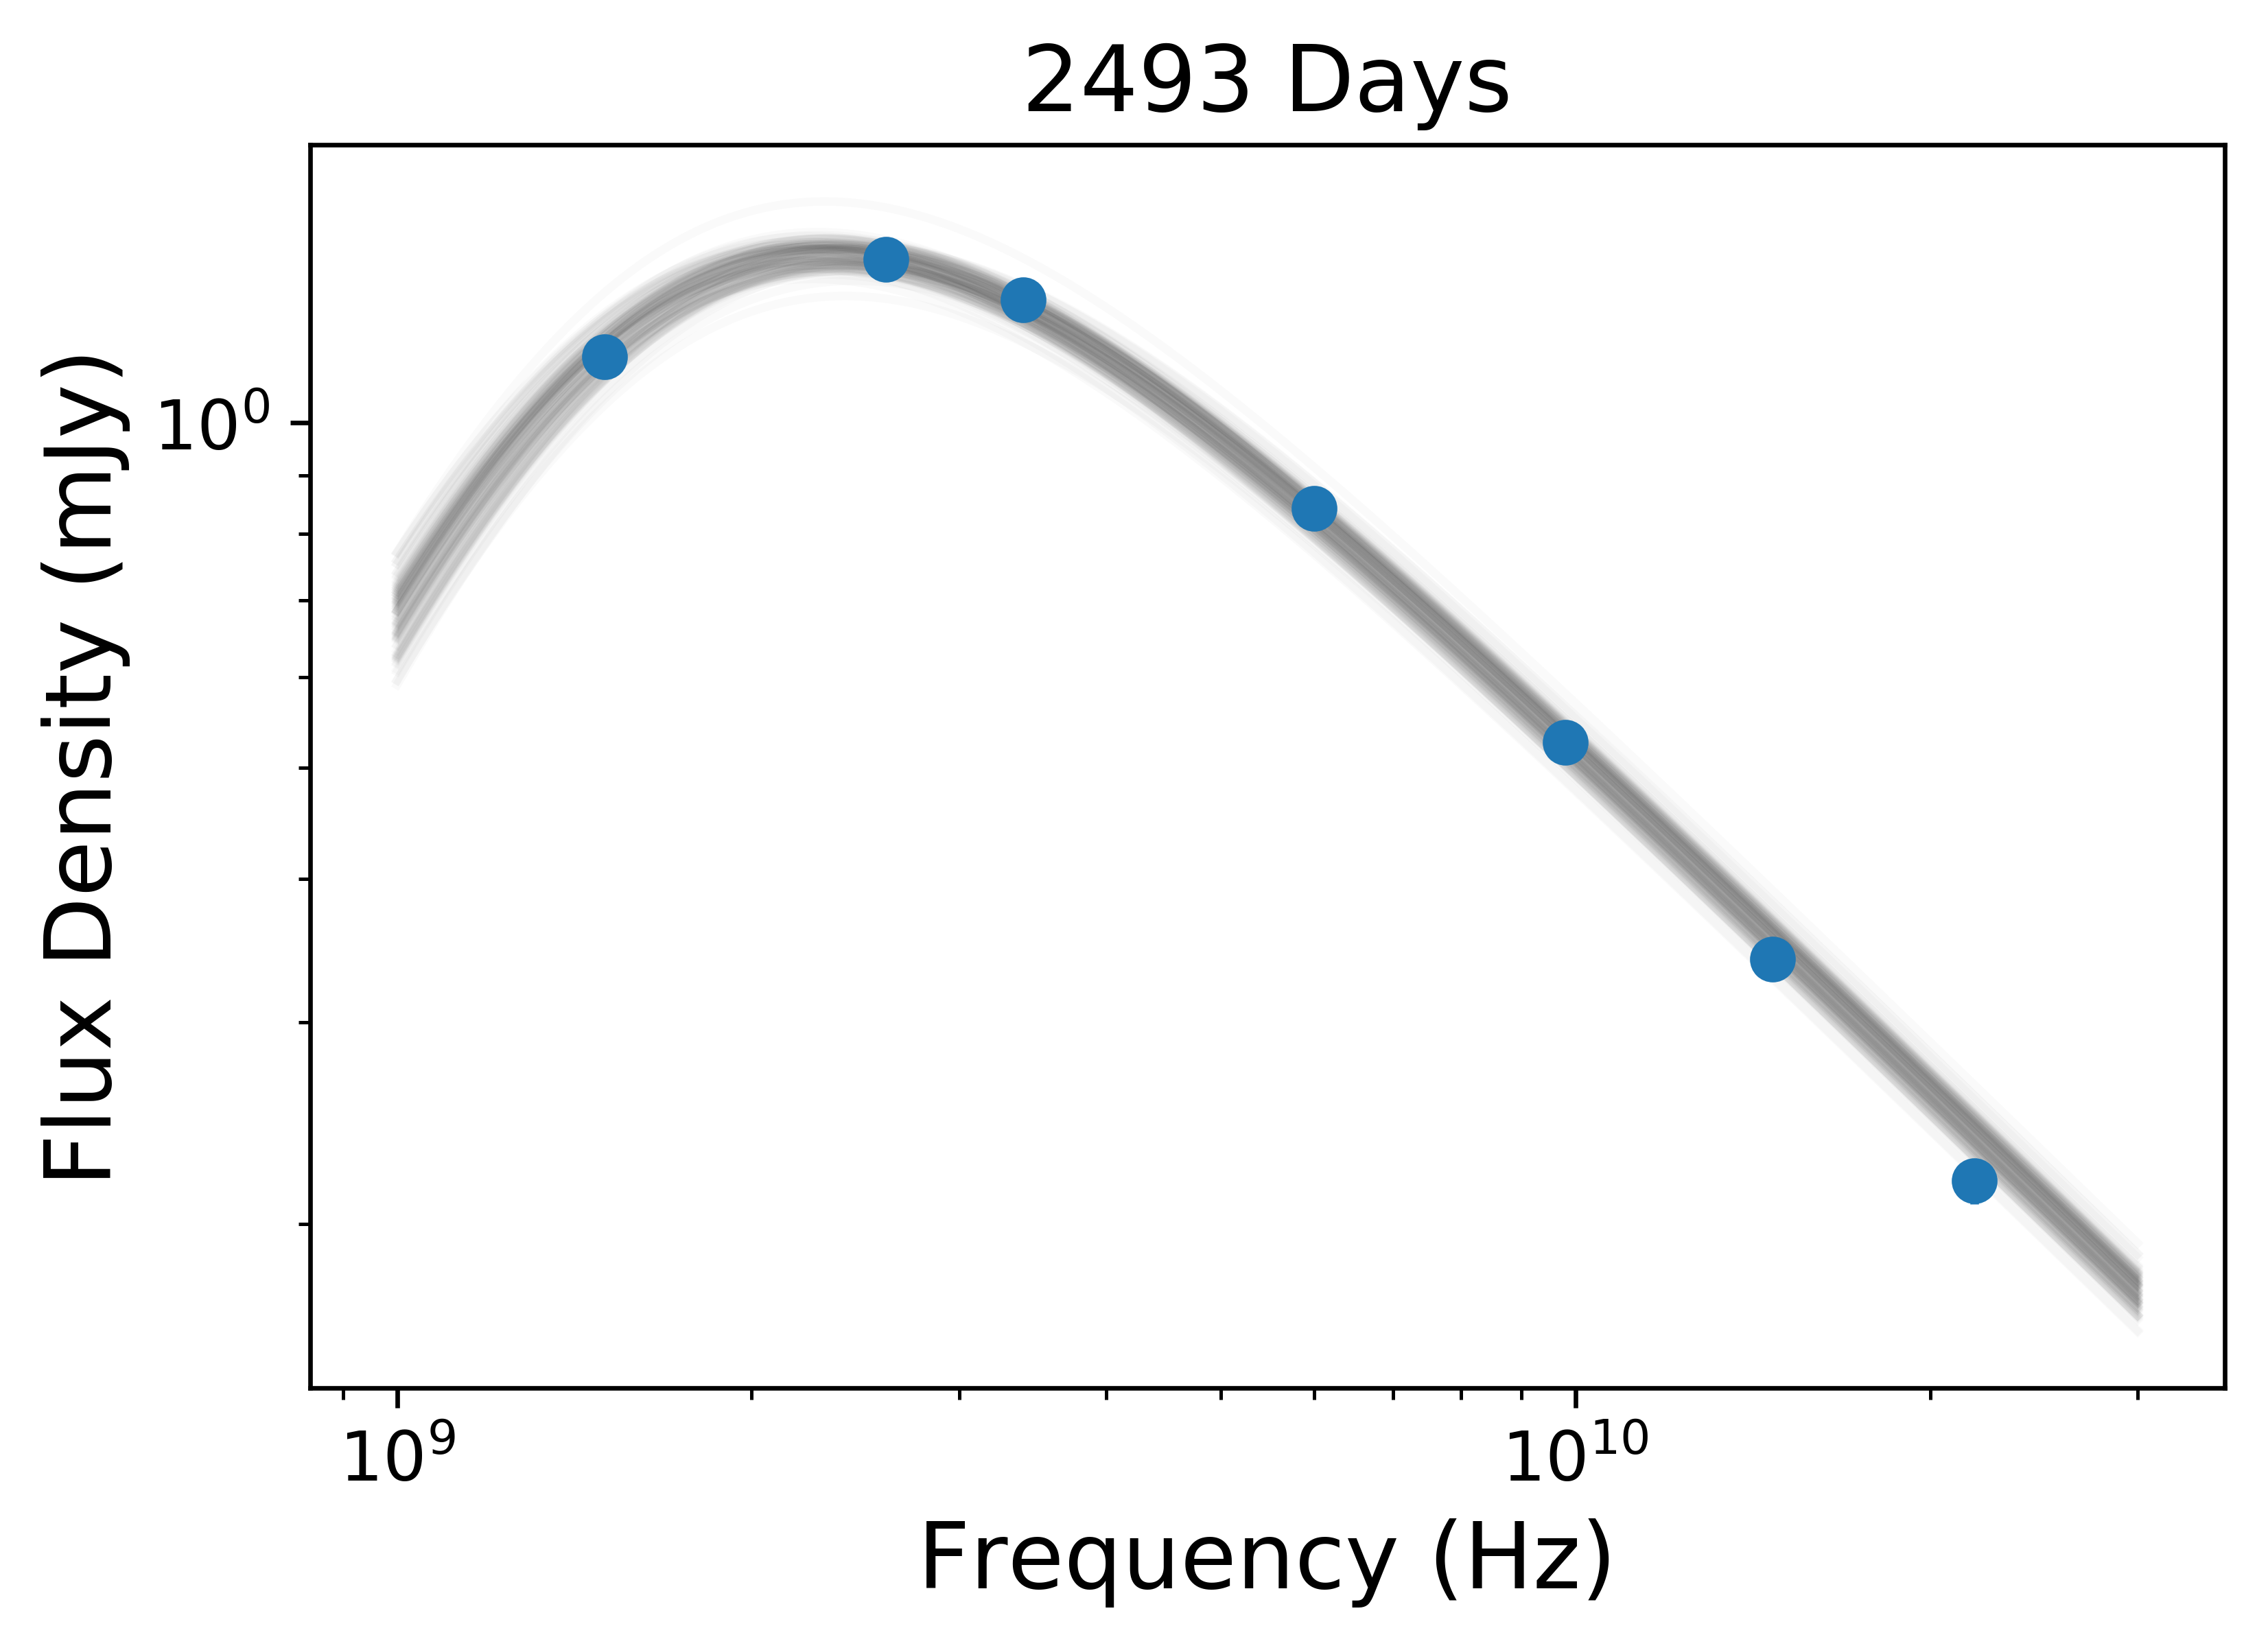
As in our previous analyses of the radio emission from Sw 1644+57, we model the spectral energy distribution (SED) as self-absorbed synchrotron emission in order to determine the physical properties of the outflow and surrounding medium as a function of time. The SEDs at Days 2493 and 2795 are shown in Figure 1. The SEDs are defined by a peak flux density, , at a peak frequency, , and by a power law slope related to the electron energy distribution, . We previously found that at early times is defined by , the frequency associated with the minimum electron Lorentz factor of the electron distribution, , while at later times it is defined by the self-absorption frequency, (Berger et al., 2012; Zauderer et al., 2013; Eftekhari et al., 2018).
Following Eftekhari et al. (2018), we fit the SED with a weighted model that accounts for both possible versions of the peak frequency, using the models developed by Granot & Sari (2002) for synchrotron emission from GRB afterglows. When we have:
| (1) |
where describes the spectral slopes above and below a break, and and are smoothing parameters that describe the shape of the spectrum across each break. Here, , , and . When , the spectrum is instead given by:
| (2) |
where and . To obtain a smooth transition between the two regimes, we employ a weighted spectrum (Equation 3 in Eftekhari et al. 2018):
| (3) |
where and .
We determine the best fit using the Python Markov Chain Monte Carlo (MCMC) module emcee (Foreman-Mackey et al., 2013), assuming a Gaussian likelihood for the parameters , , and . We also included a parameter that accounted for systematic uncertainty for underestimates on the individual data points. Our priors were based on the assumption that all these parameters decrease over time, as seen in Eftekhari et al. (2018), and thus the value from the previous epoch was used as the upper limit for each respective parameter. The posterior distributions were sampled using 100 Markov chains, which were run for 2,000 steps, discarding the first 1,000 steps to ensure the samples have sufficiently converged.
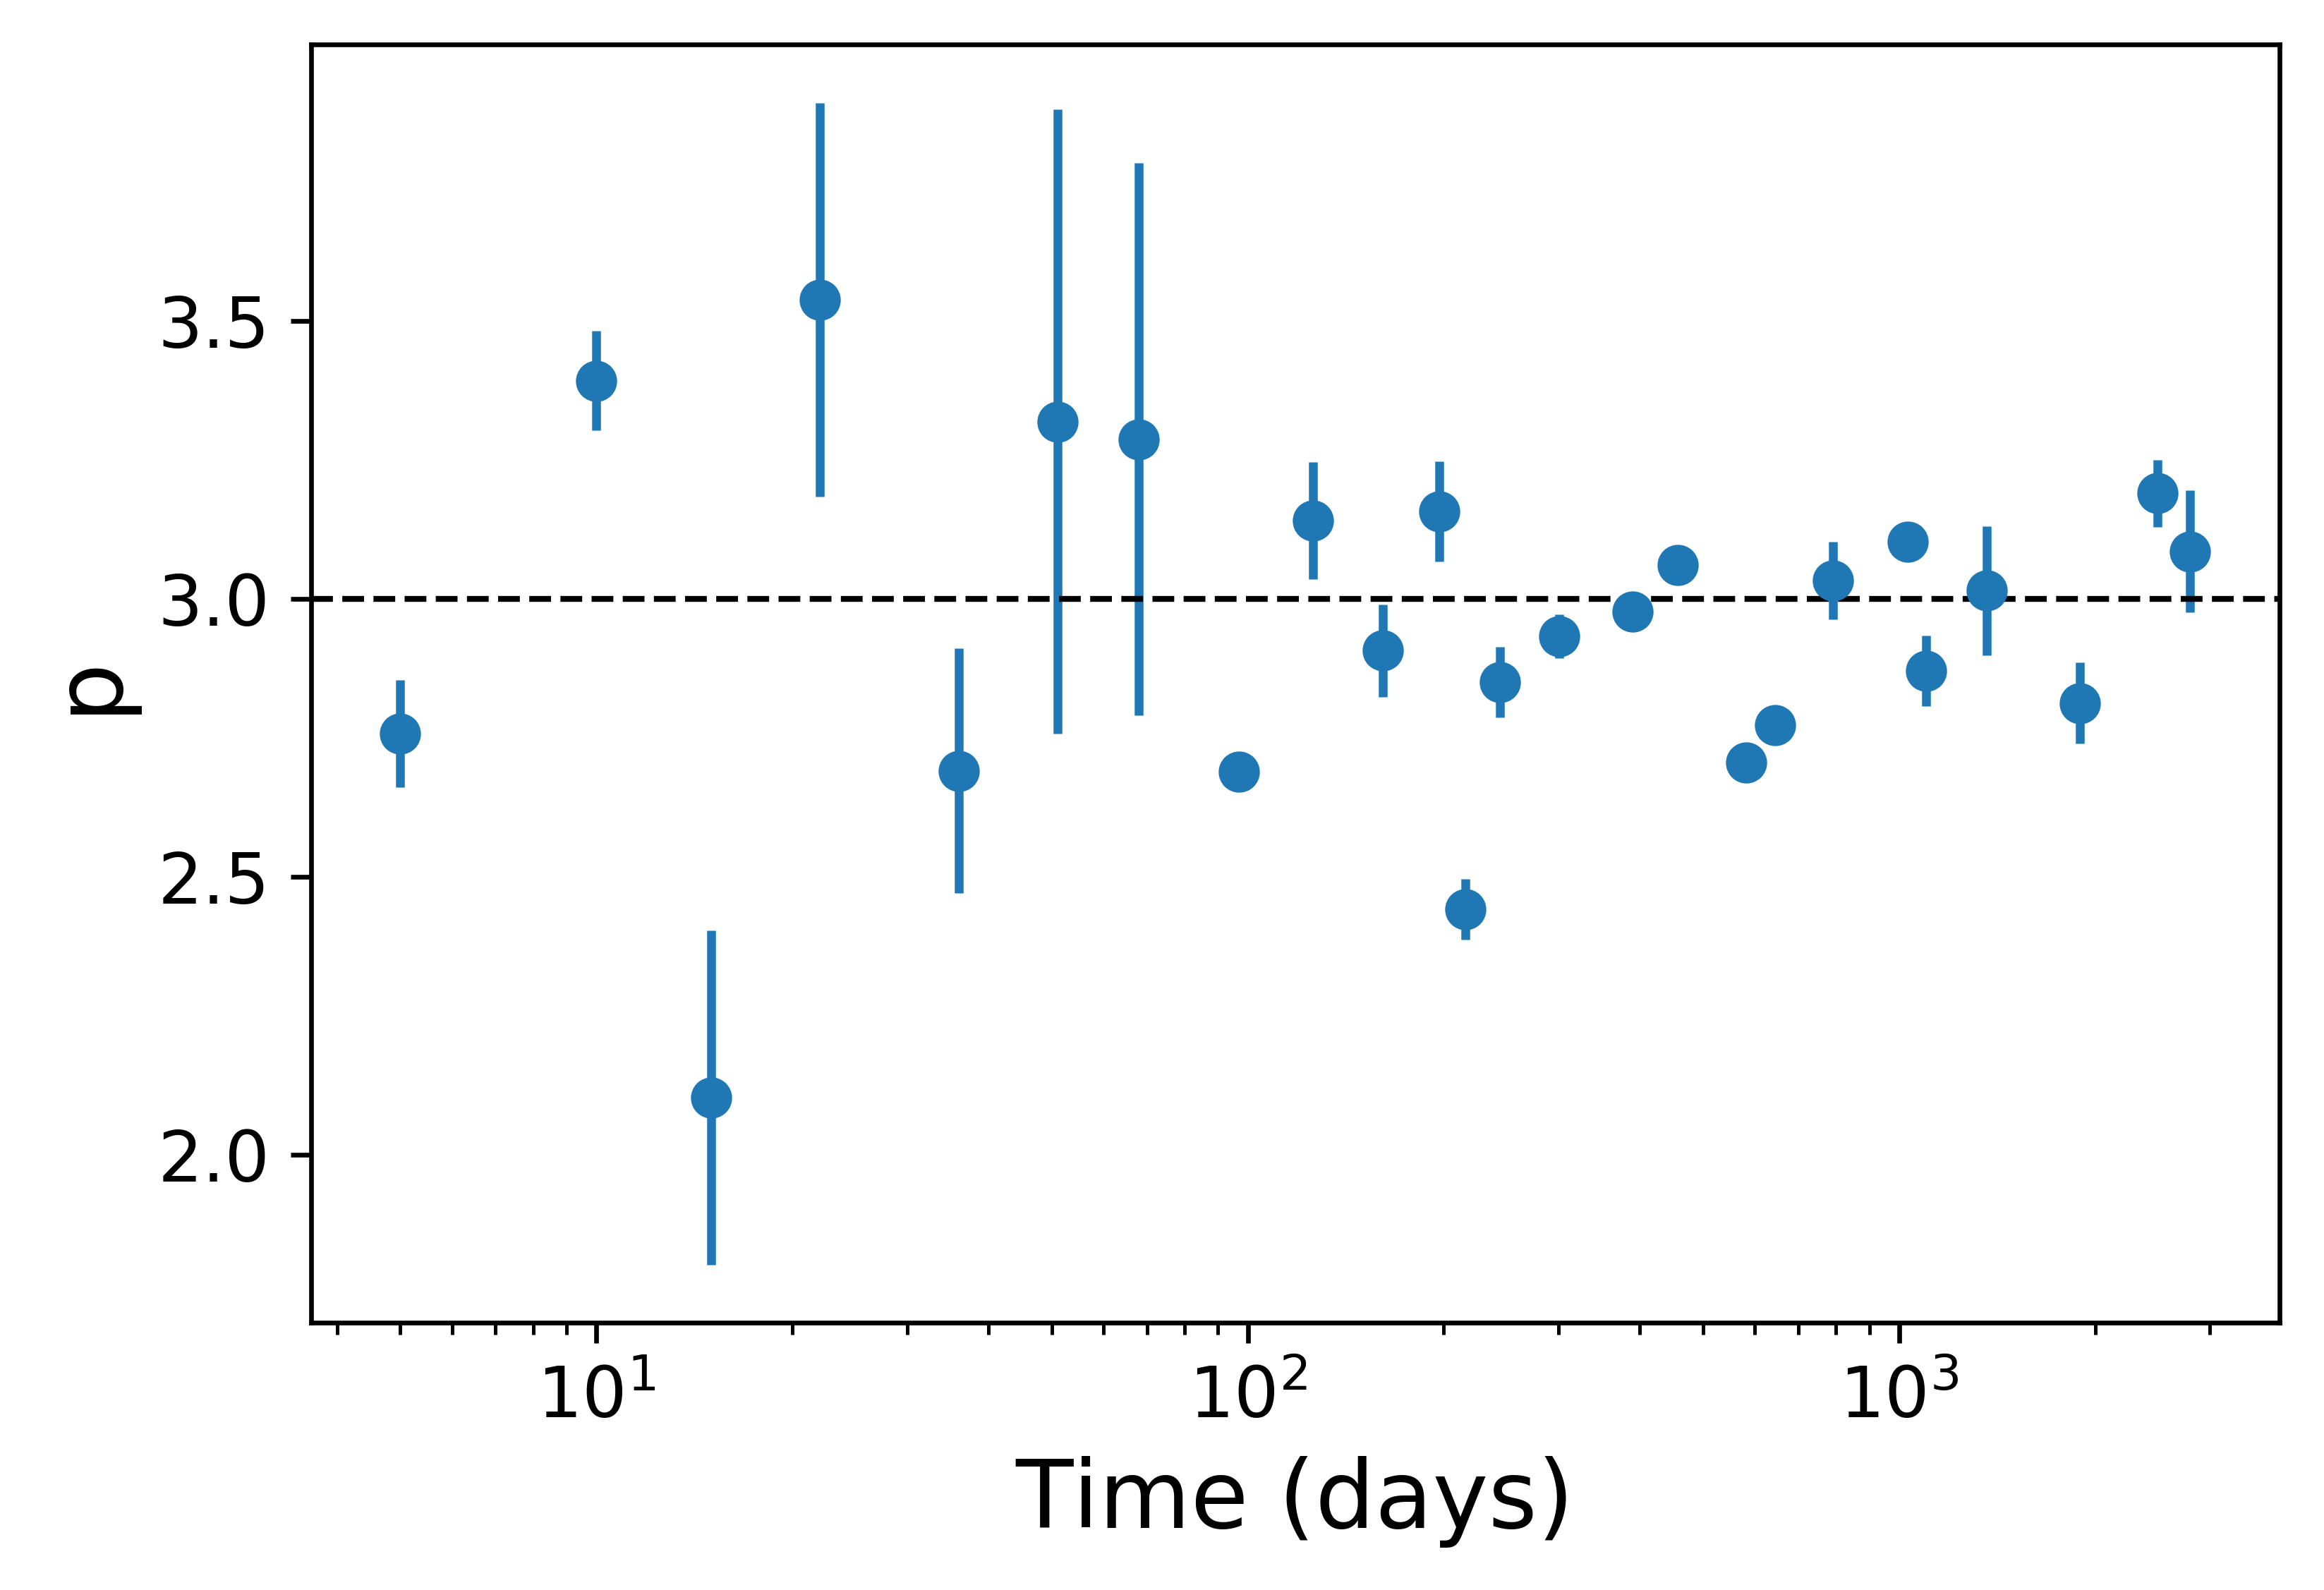
In Berger et al. (2012); Zauderer et al. (2013); Eftekhari et al. (2018), a value of was adopted at earlier epochs, but here we fit for as a free parameter. For this purpose we refit the entire radio data set and show the results for in Figure 2. At early time ( days) the value of exhibits large variations and uncertainty. This is due to the high value of , and hence the paucity of data beyond the peak, as well as to interstellar scintillation, which leads to fluctuations in the observed flux density and hence the model fit (Berger et al., 2012). At later times we still find some scatter in (primarily due to residual scintillation effects) but overall the weighted average after Day 100 is . We therefore adopt in the remainder of our analysis, and refit all of the radio data beyond Day 700 with this value. We note that we explicitly checked the change in by slicing the data to calculate the weighted average of over time, but concluded the change in is not a physical occurrence but instead due to more precise measurements at later times.
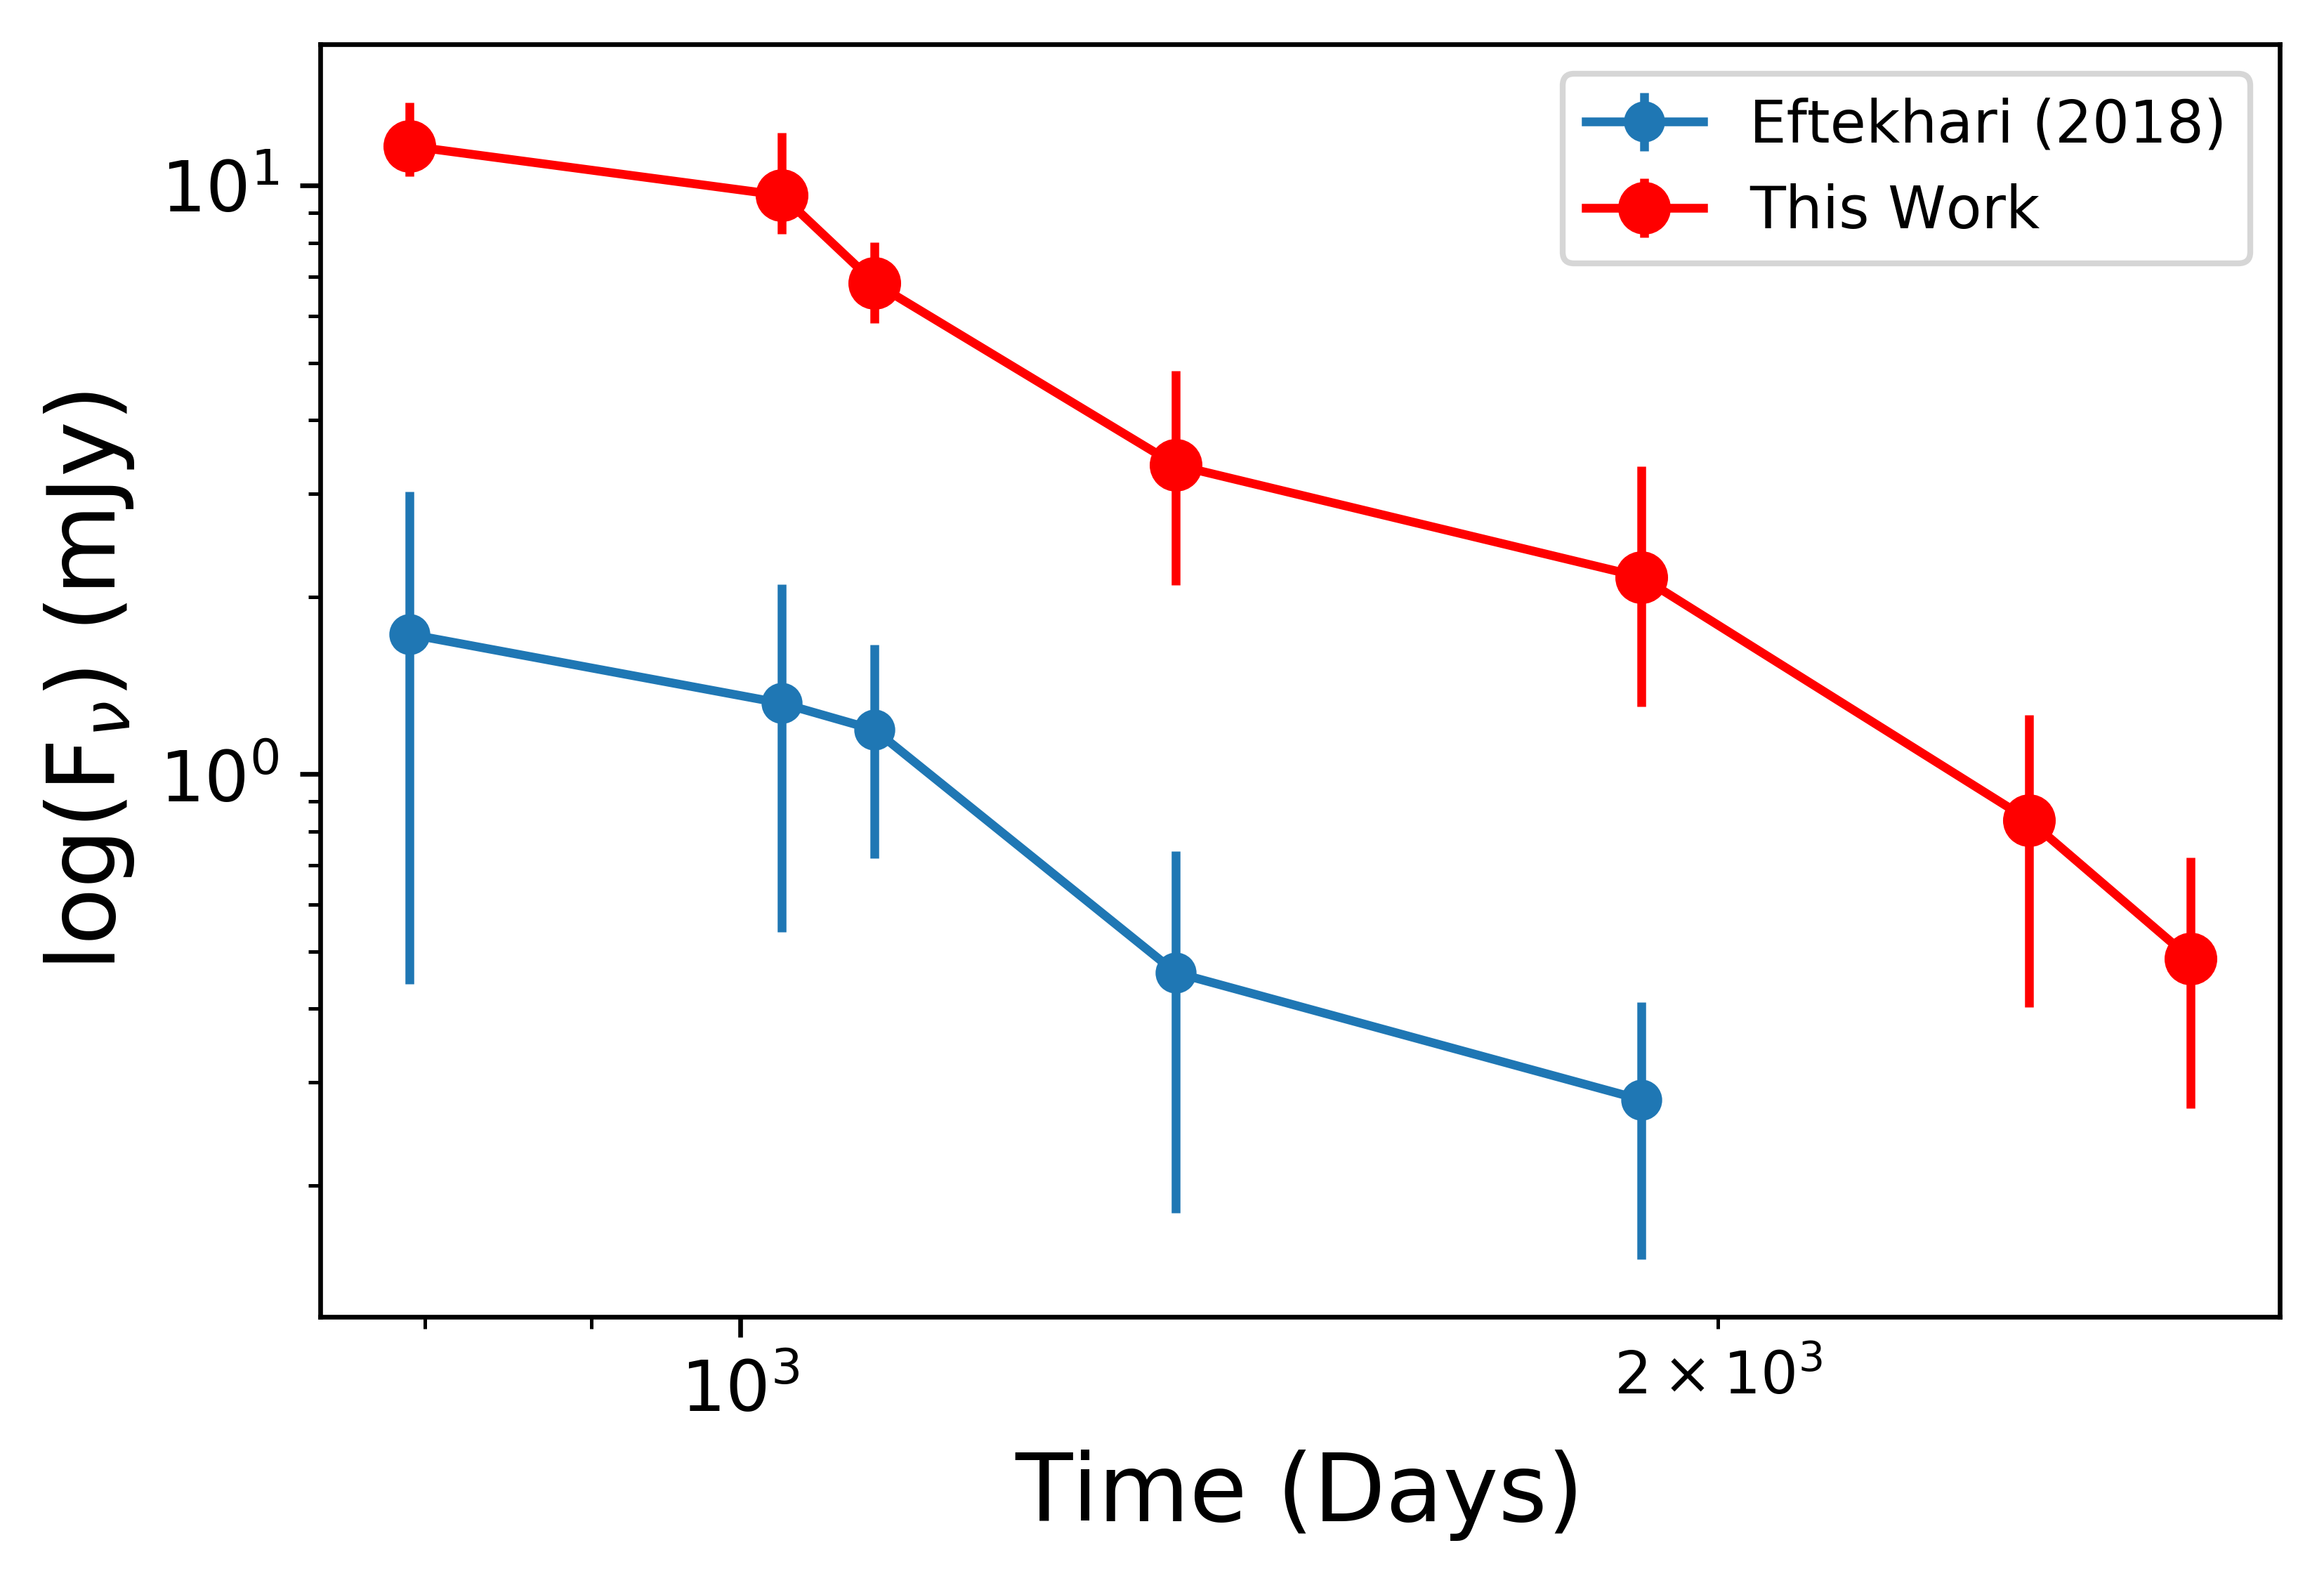
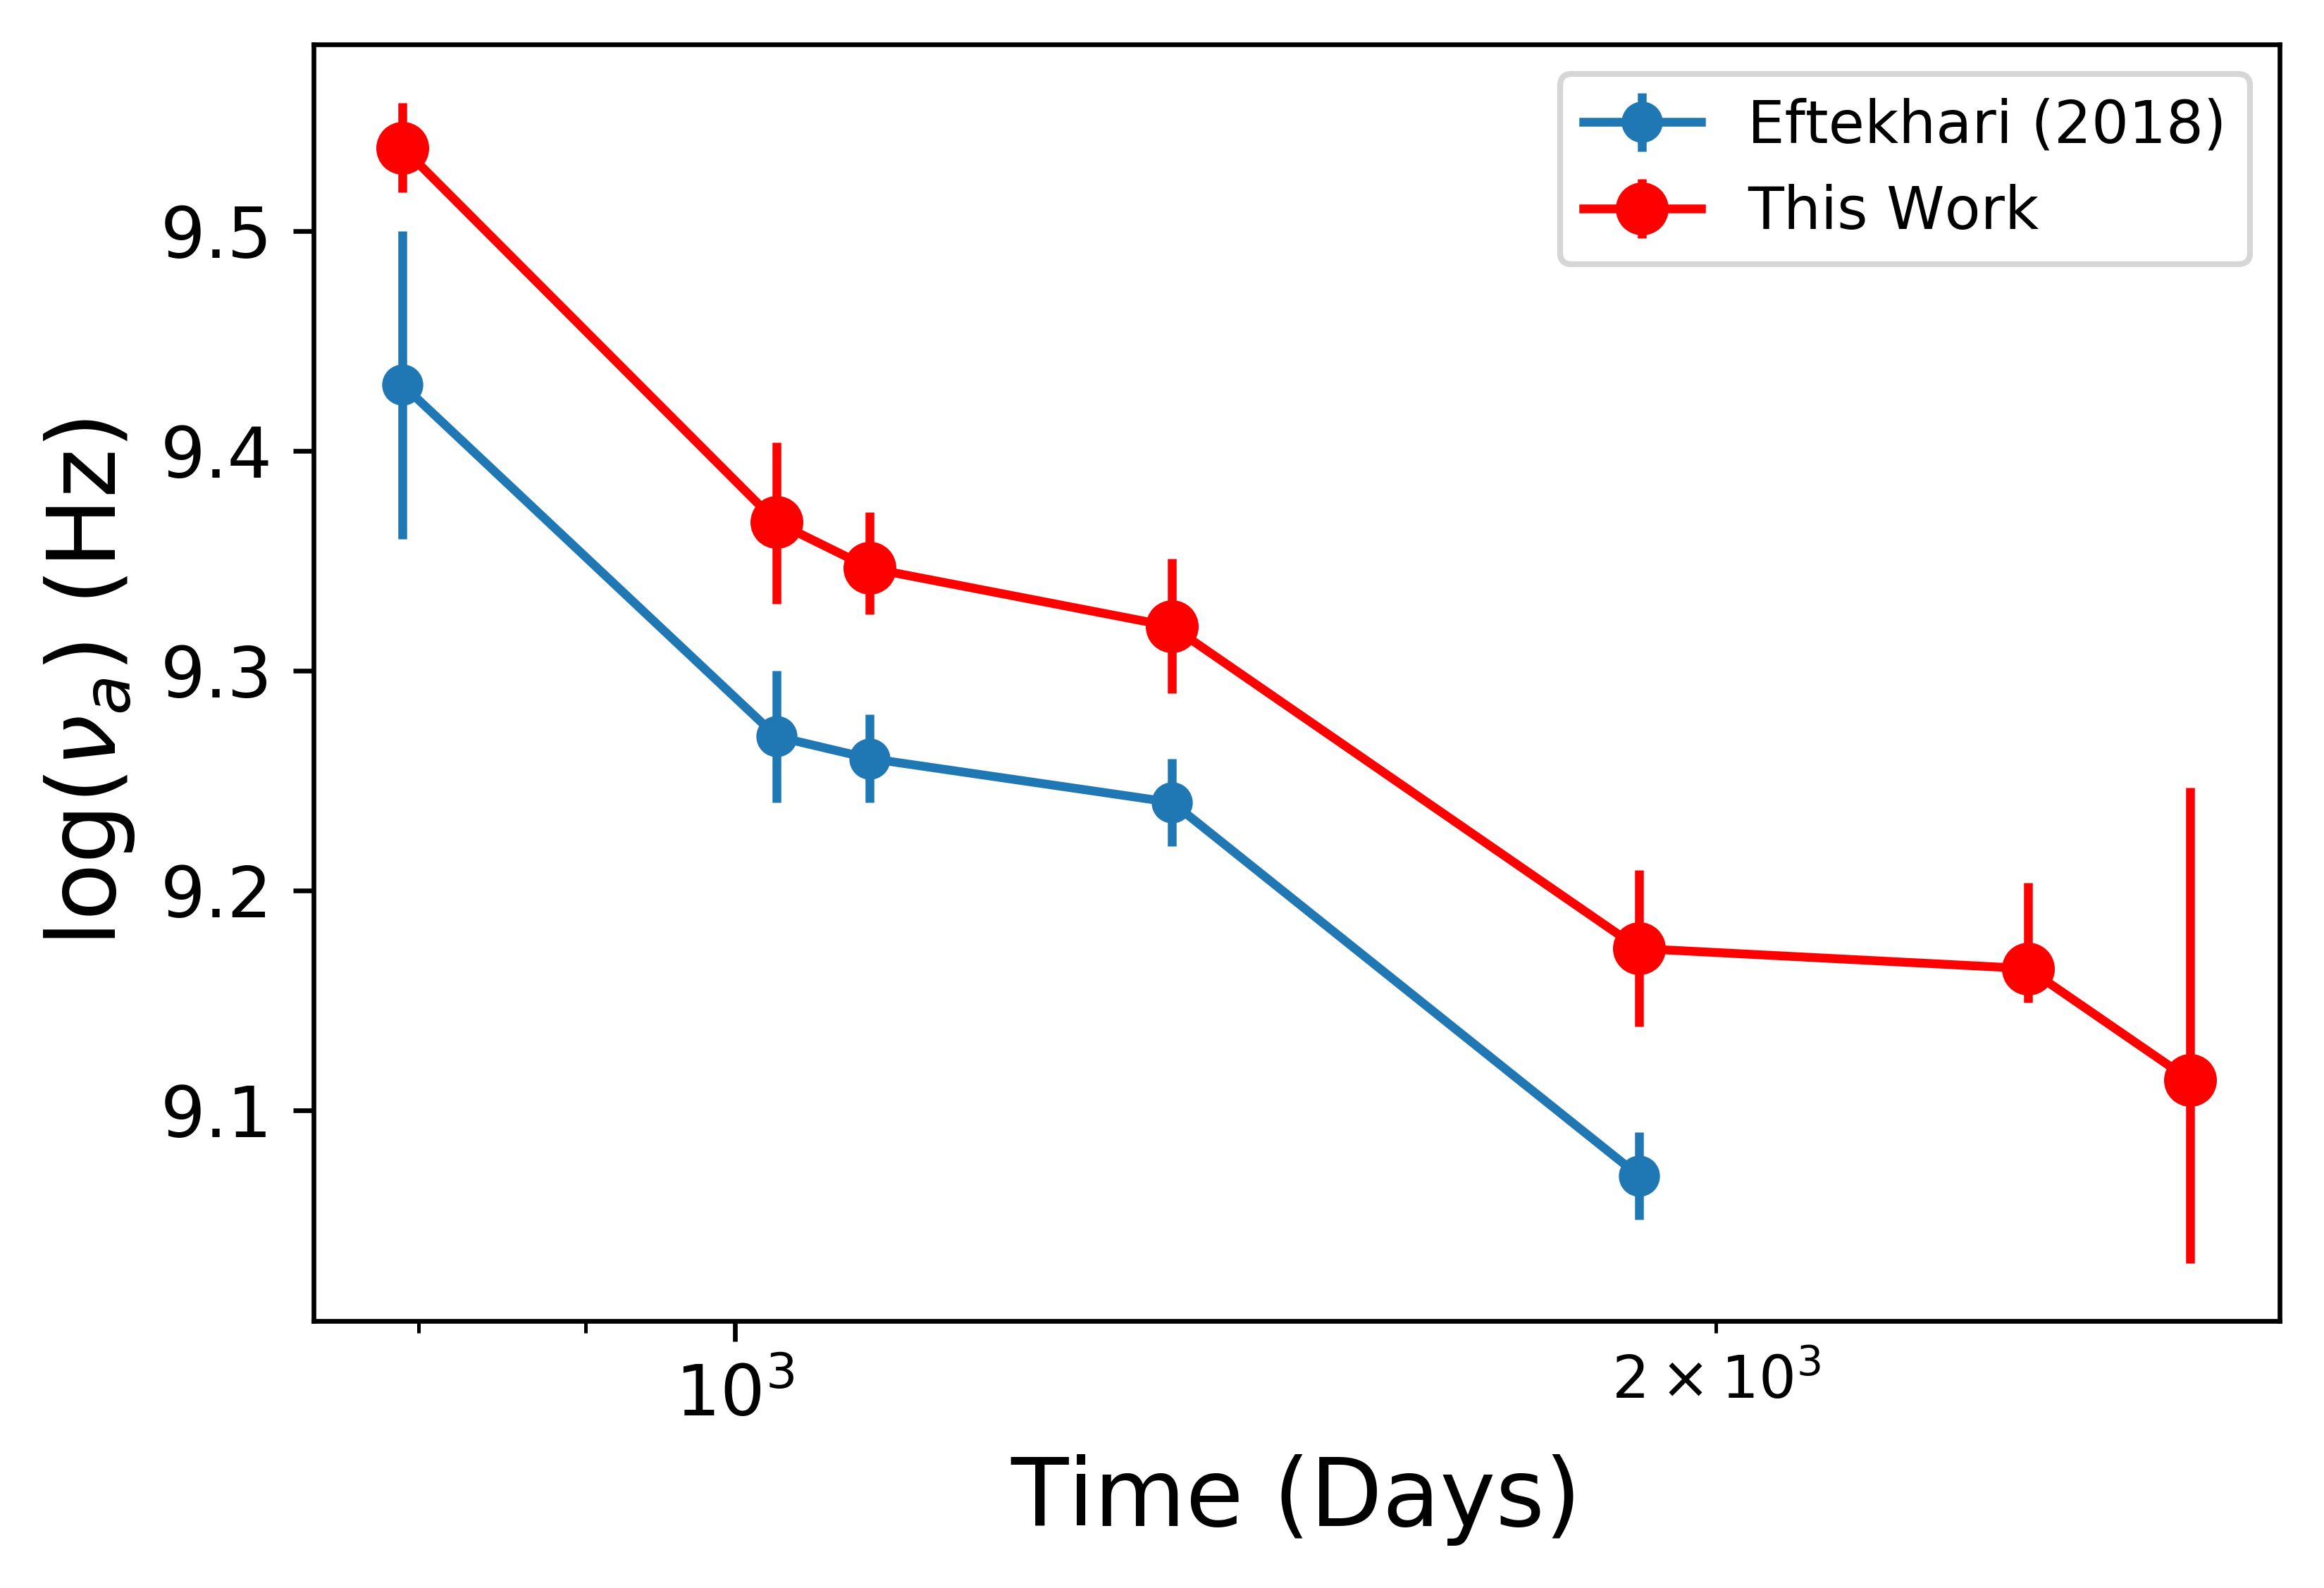
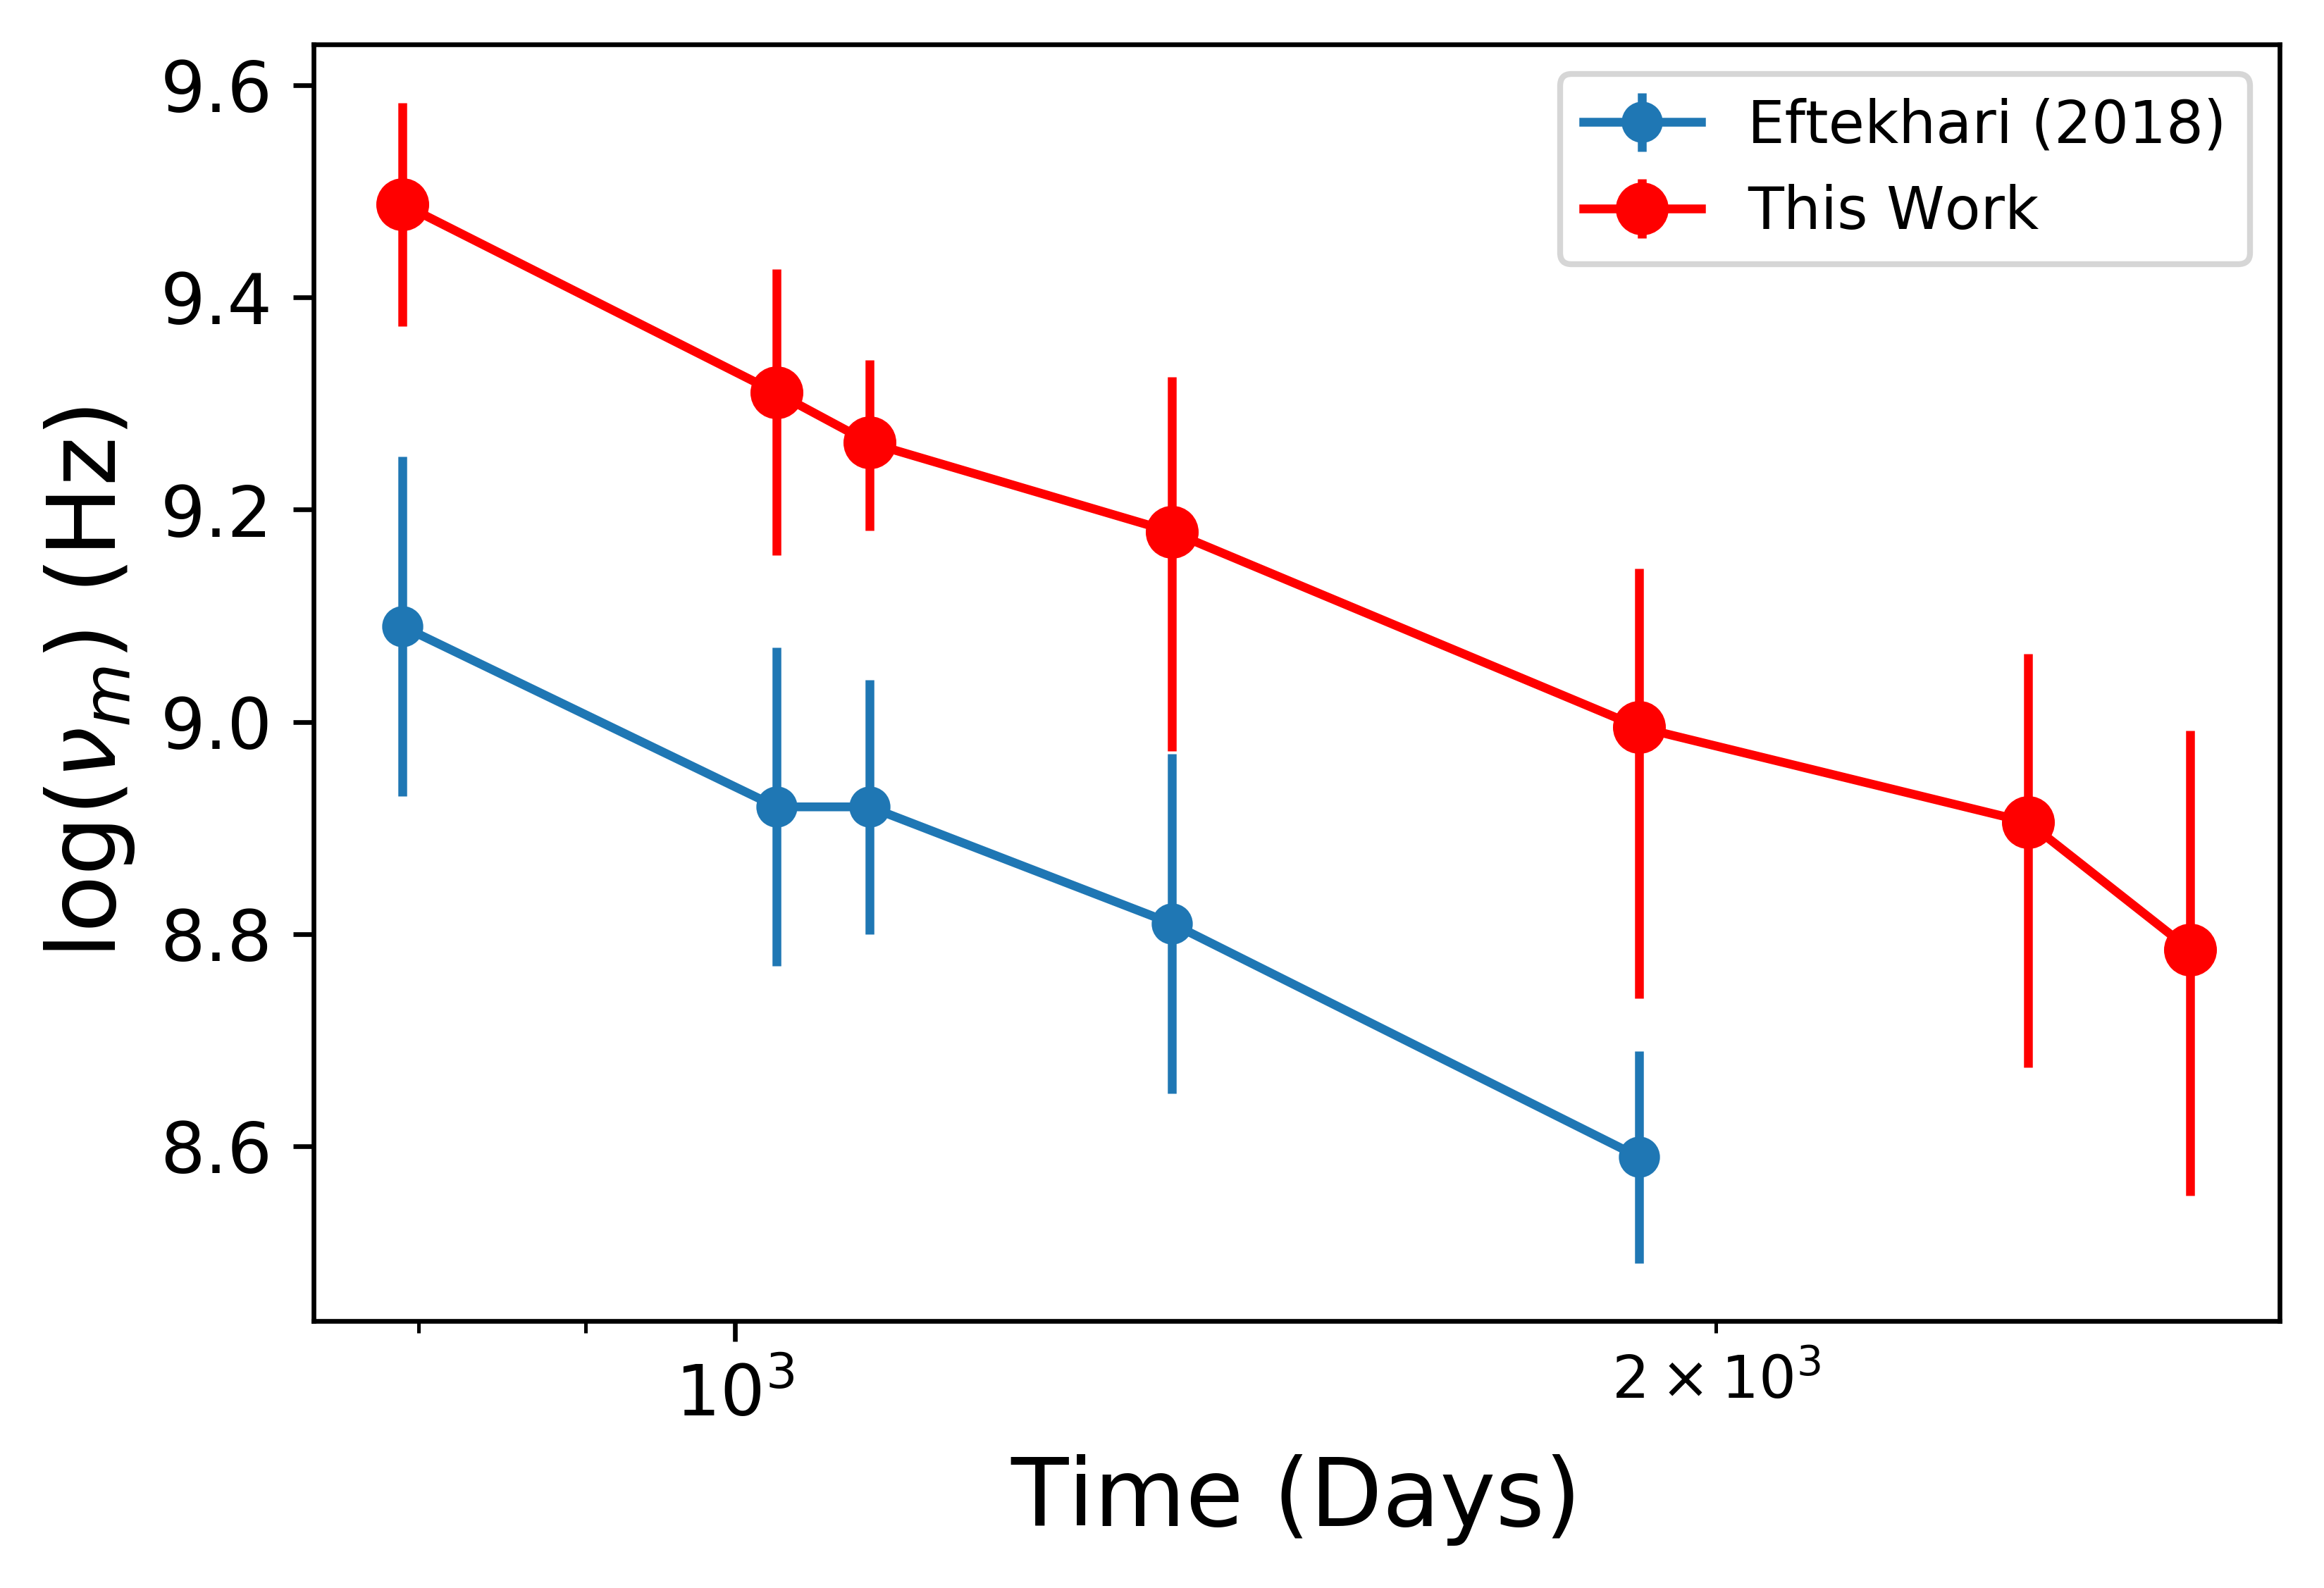
Following fitting with Equation 3, the resulting values for , , and are listed in Table 3 and plotted in Figure 3. We note explicitly that is the fitted flux density, which, due to the smoothing of the SED, is larger than the actual peak flux density, , used in § 3.2. As in Eftekhari et al. (2018) we find an overall steady decline in and , with a corresponding decline in . However, due to the difference in the adopted values of we find systematic offsets of about a factor of 2.5 times higher for , a factor of 1.3 times higher for , and a factor of 7 times higher for .
3.2 Equipartition Analysis
Using the inferred frequency and flux density parameters from the SED fitting in §3.1, we now infer the physical properties of the outflow using an equipartition analysis. In §3.3 we use the X-ray data to determine any deviation from equipartition, as found in our previous work (Eftekhari et al., 2018). In our analysis we follow the prescription of Barniol Duran et al. (2013). As already shown in Eftekhari et al. (2018), the outflow at late times is non-relativistic, leading to the following expressions for the equipartition radius and kinetic energy (see Equations 21 and 25 in Barniol Duran et al., 2013):
| (4) |
| (5) |
where Mpc is the luminosity distance, is the redshift, and and are the area and volume filling factors, respectively, where we use with , and (Berger et al., 2012; Zauderer et al., 2013; Eftekhari et al., 2018). The factors of and for the radius and energy, respectively, arise from corrections to the isotropic number of radiating electrons () in the non-relativistic case. Similarly, since at late times , we include a correction factor of in , which leads to factors of in and in . We further assume that the fraction of post-shock energy in relativistic electrons is , which leads to correction factors of and in and , respectively, where . Finally, we parameterize a deviation from equipartition with a correction factor , where is the fraction of post-shock energy in magnetic fields.
The magnetic field and number of radiating electrons in the non-relativistic case are given by (see Equations 16 and 15 in Barniol Duran et al., 2013):
| (6) |
| (7) |
We calculate the number density of radiating electrons as , where is the volume of the emission region.
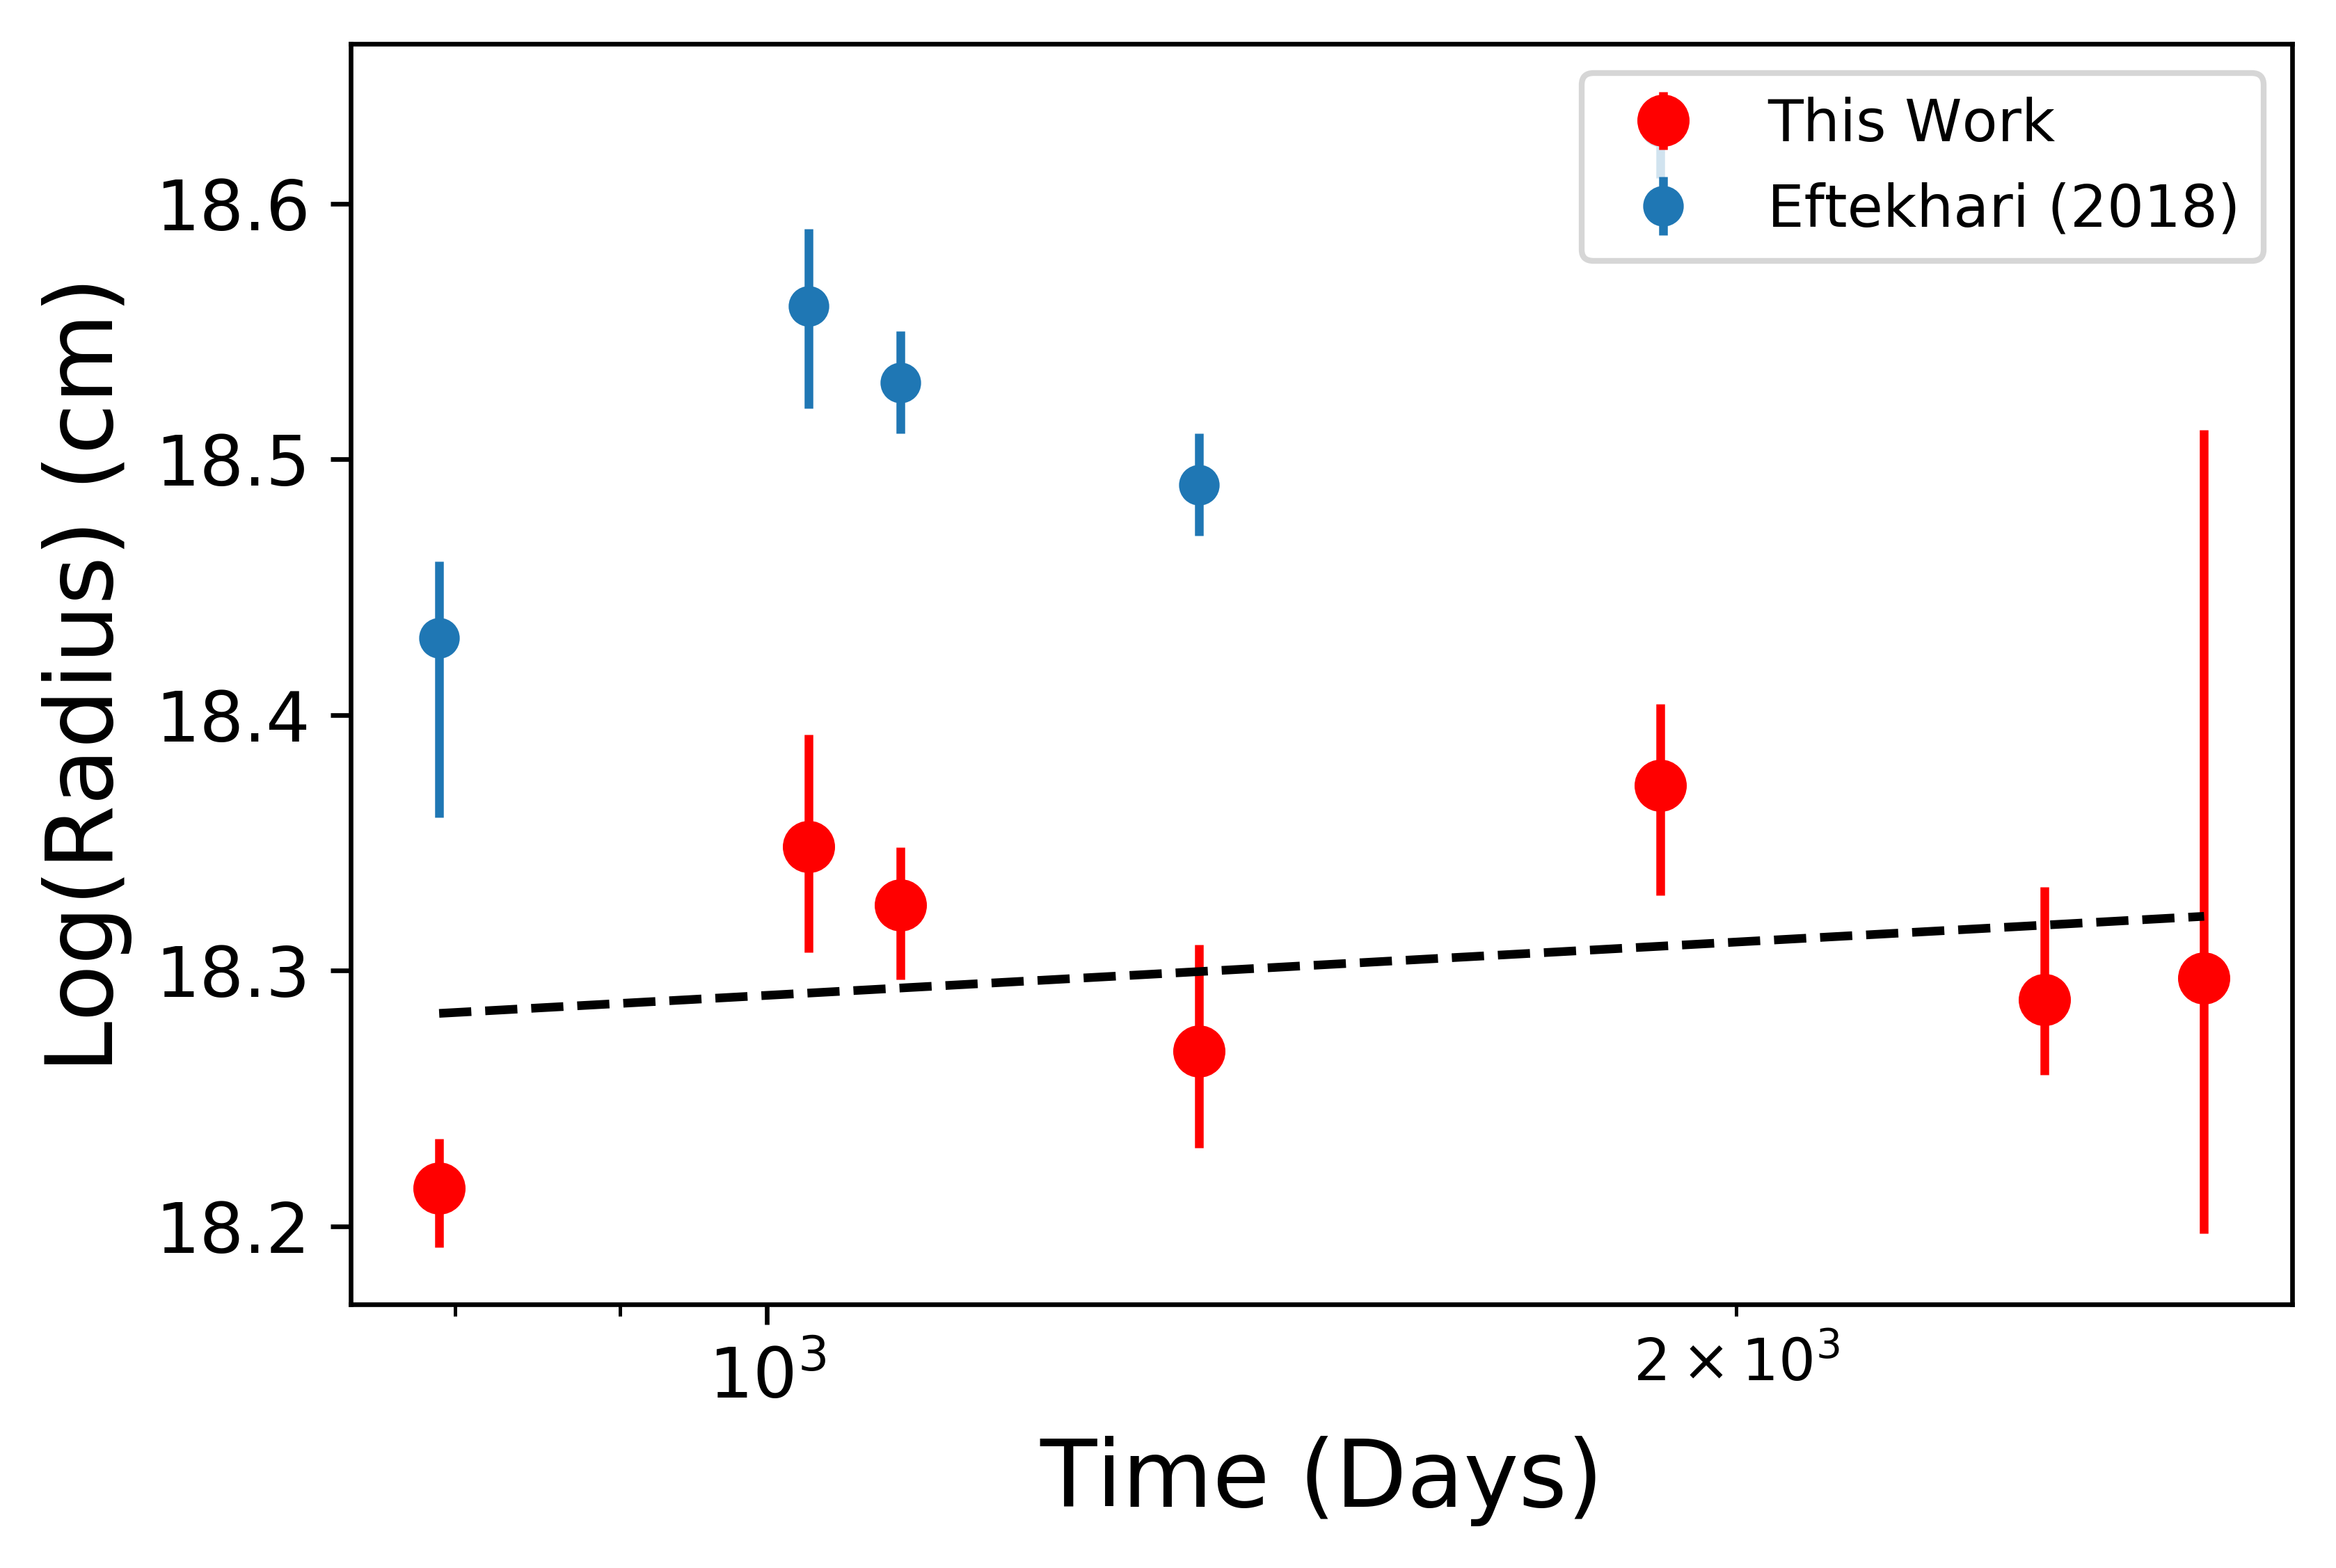
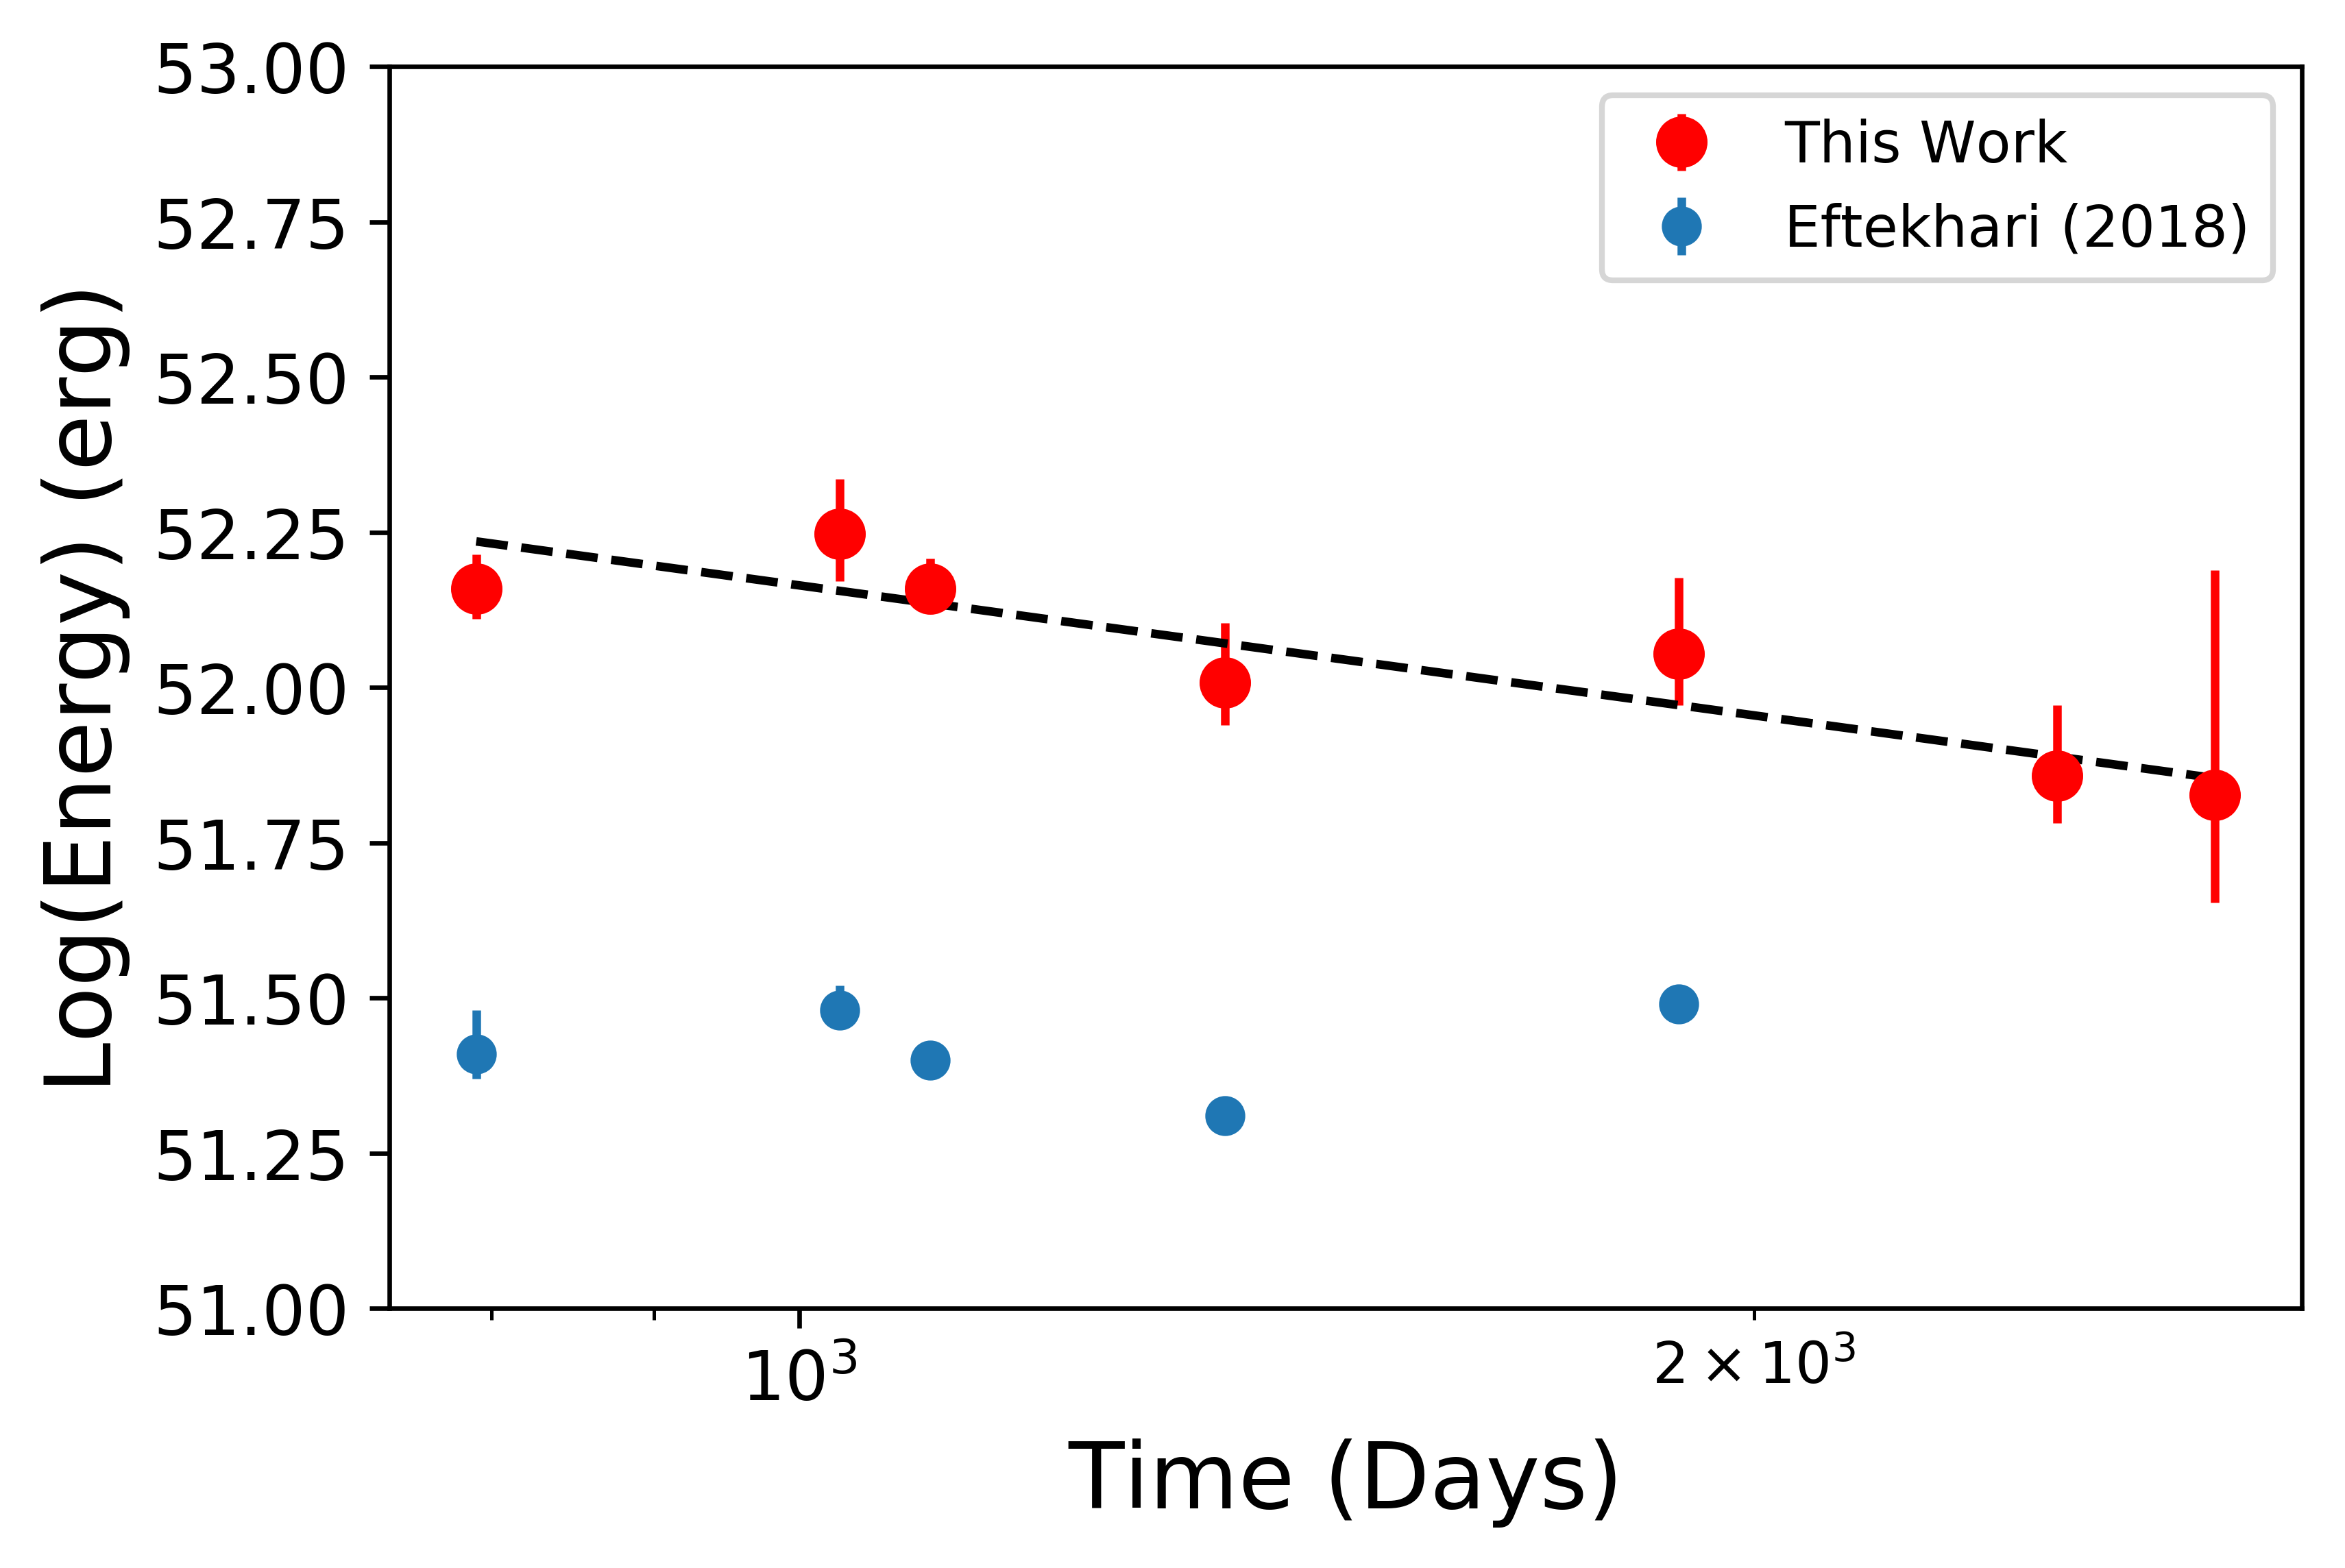
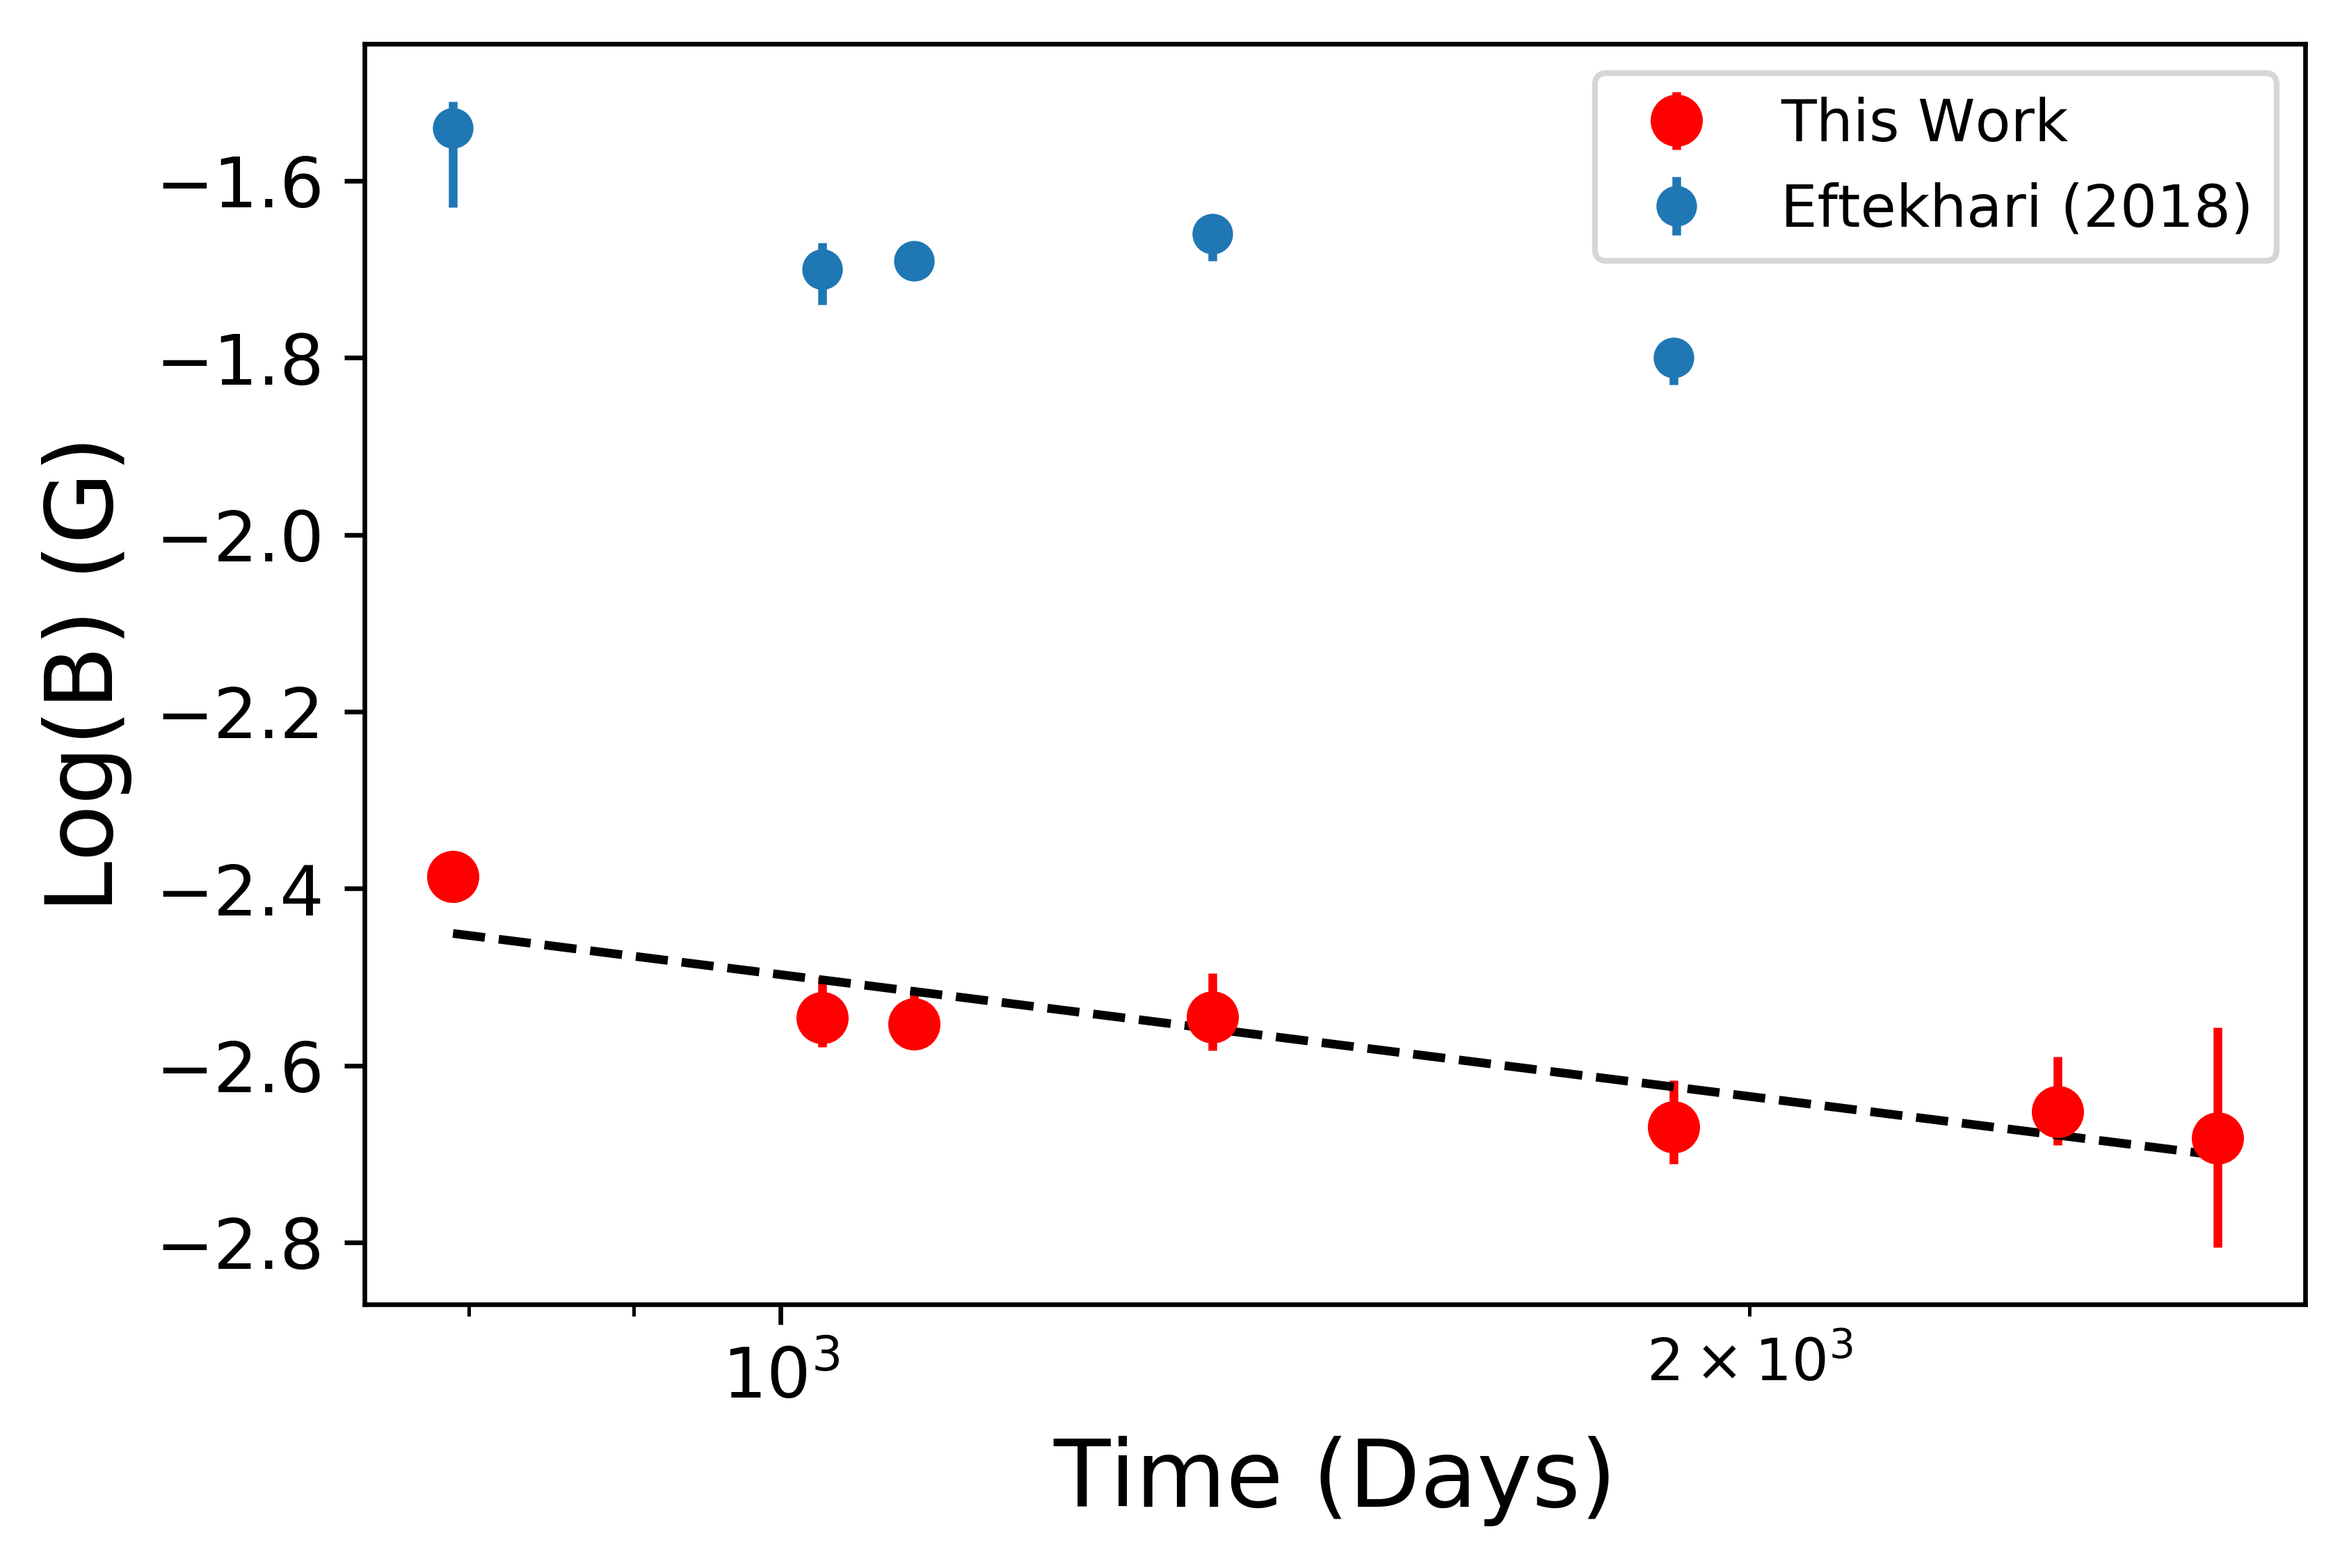
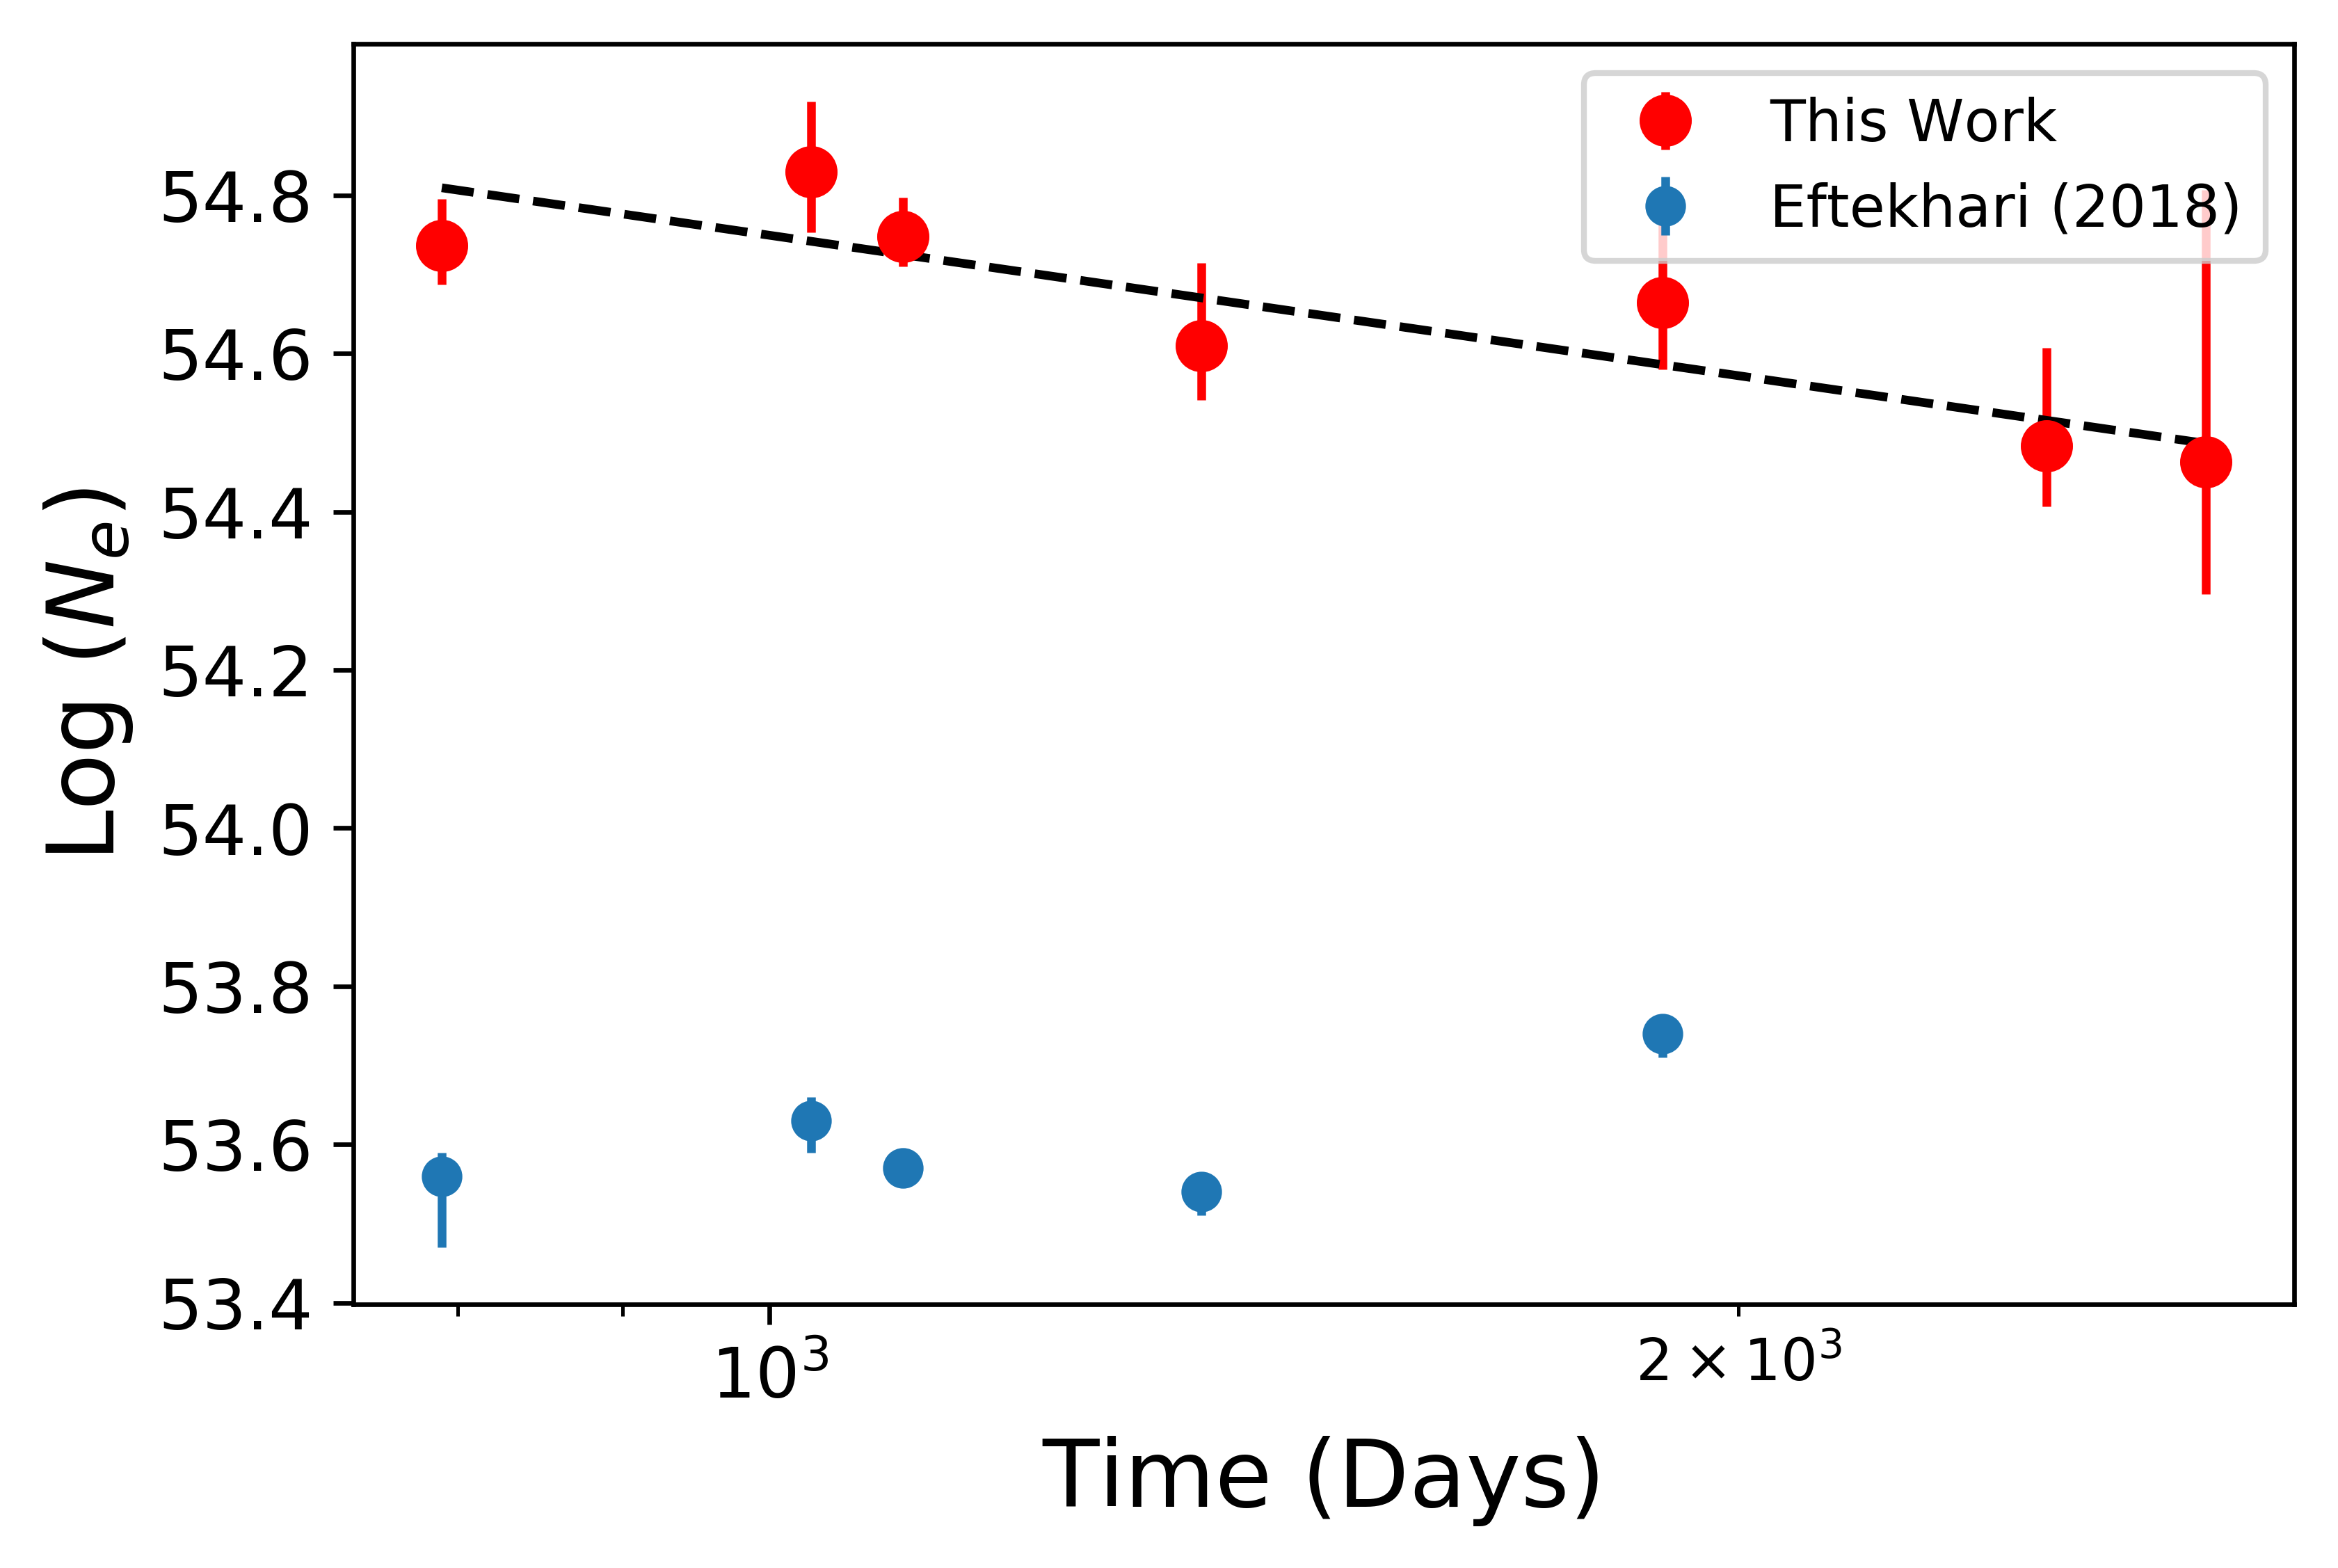
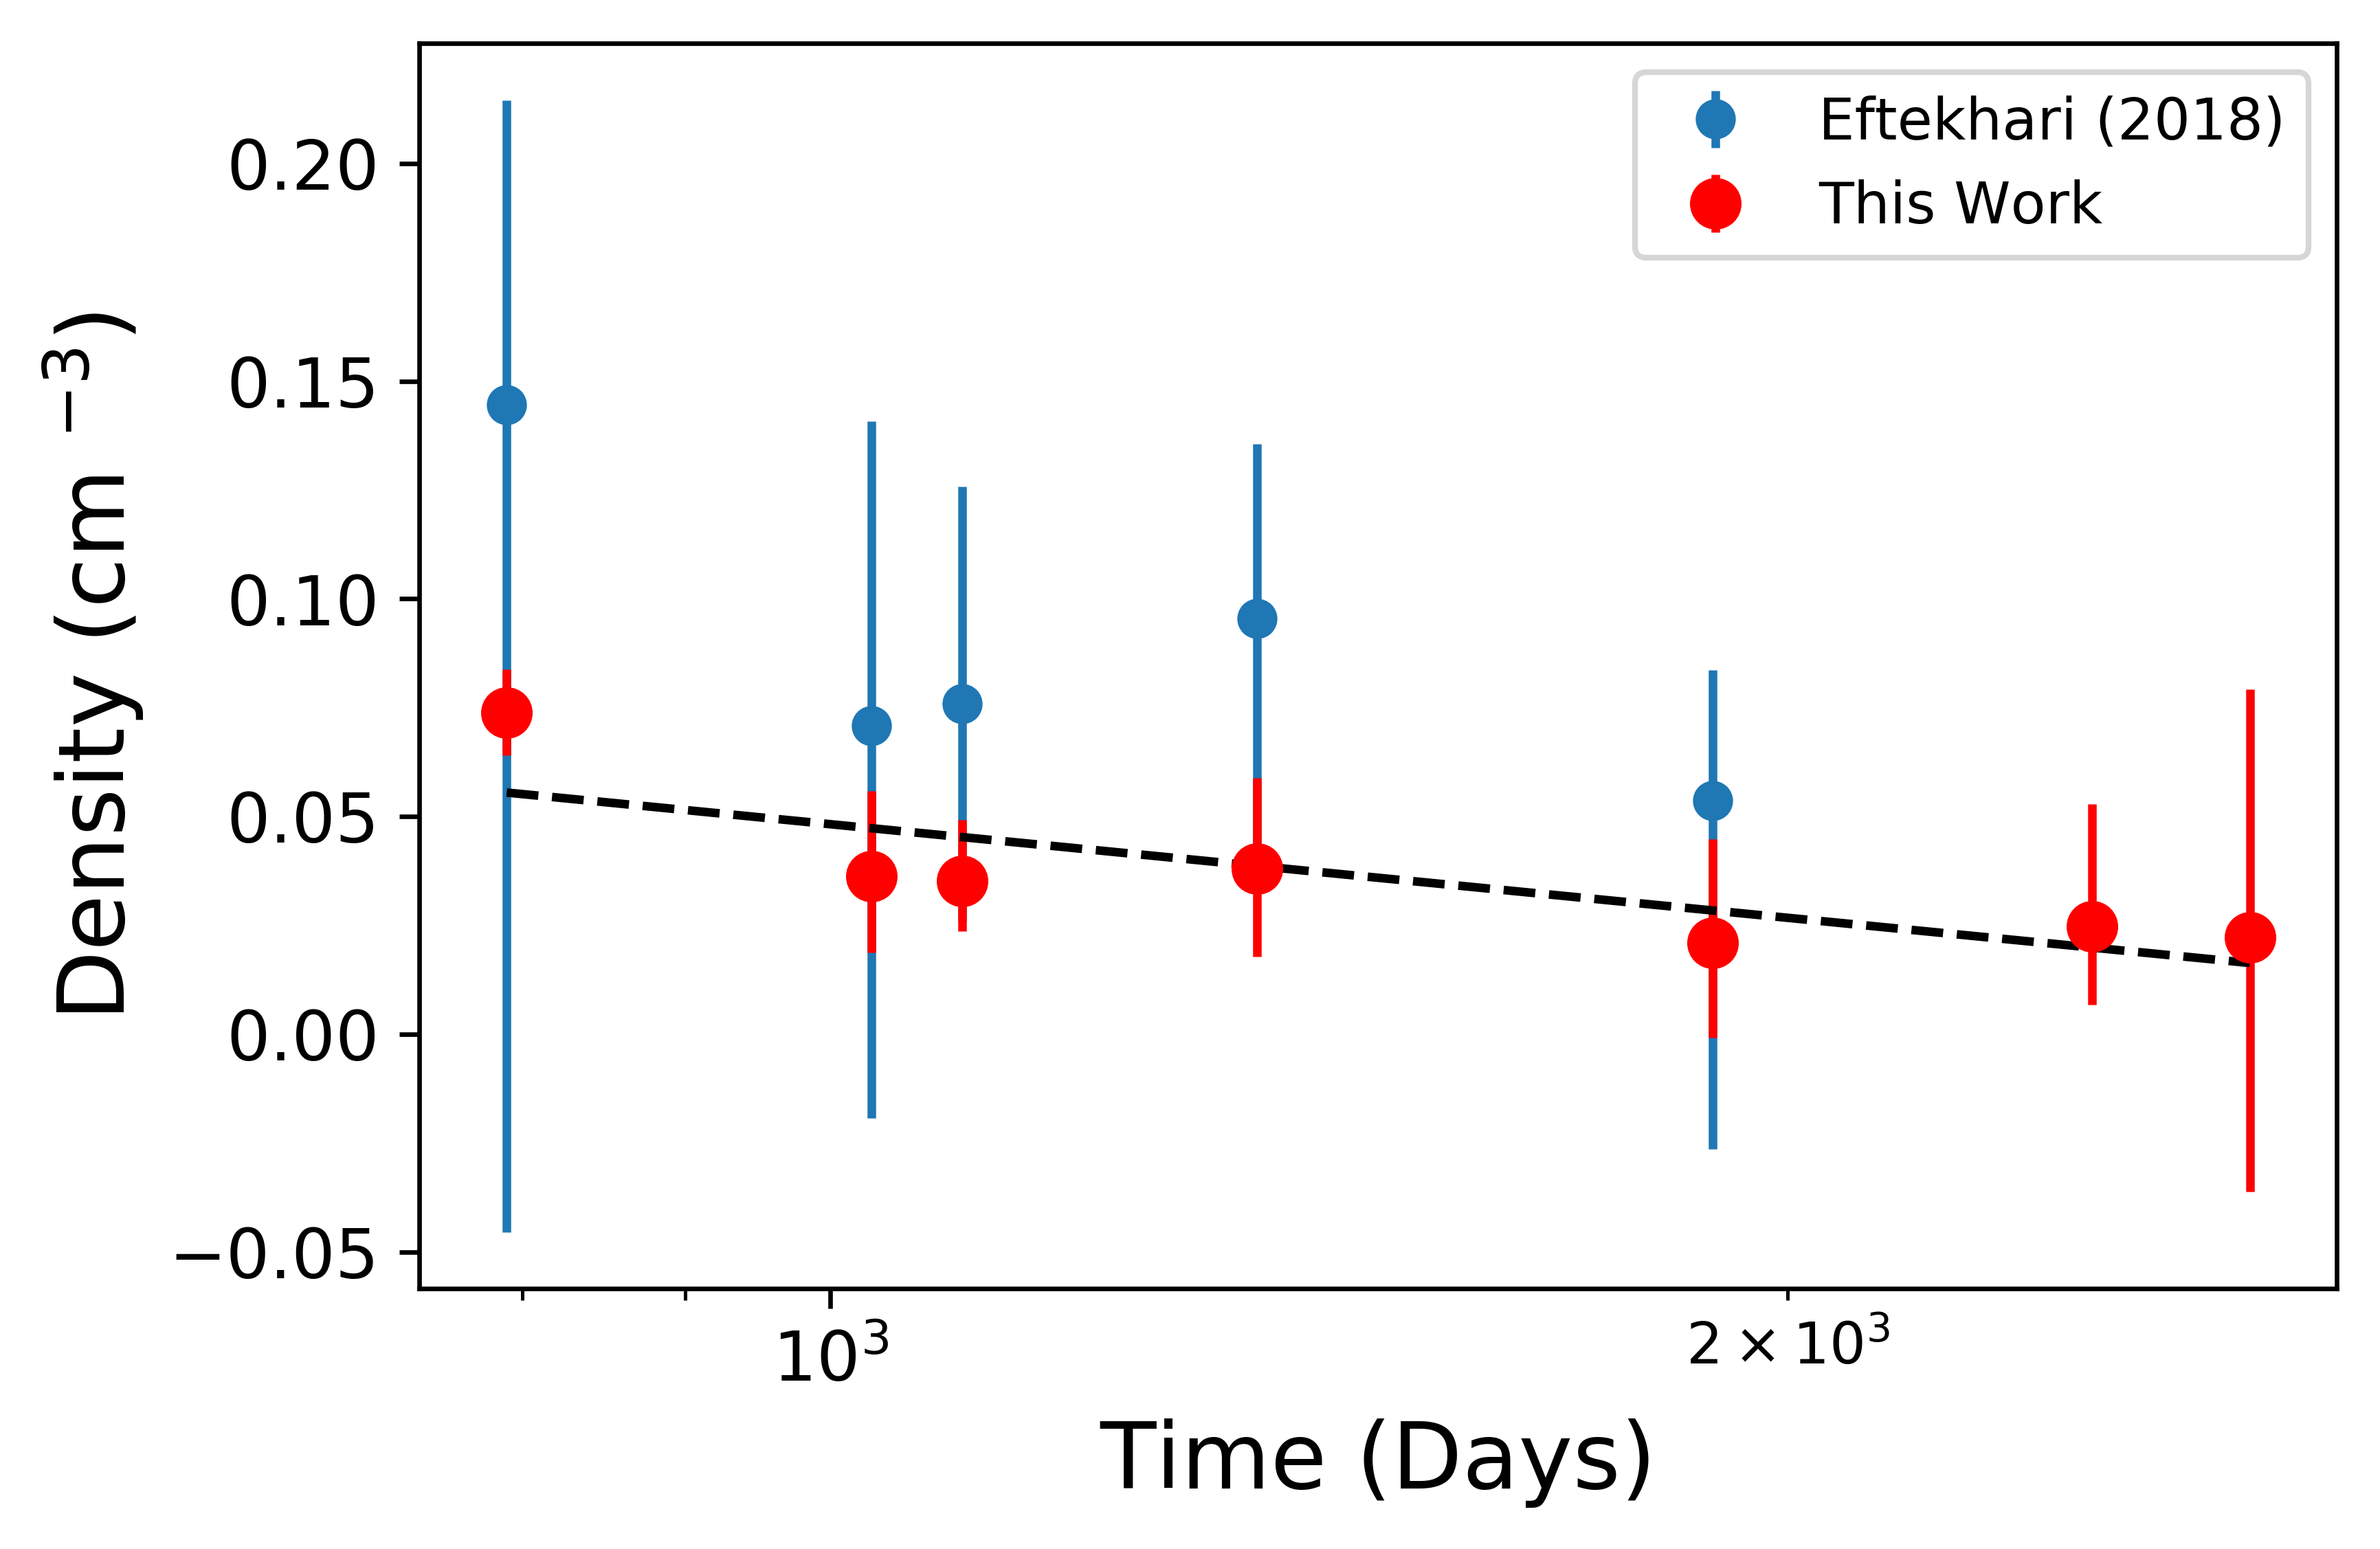
The inferred outflow and external medium parameters as a function of time are plotted in Figure 4, using (see §3.3); we include the values reported in Eftekhari et al. (2018) using for reference. For the radius, we find values that are about a factor of 1.5 times smaller than in Eftekhari et al. (2018), but the trend of , which has decreased when compared to the found by Eftekhari et al. (2018). For the energy, our values are about 5 times larger than in (Eftekhari et al., 2018), due to both the changes and . We find a steady decline in the energy with . The magnetic field strength is about 6 times lower than in Eftekhari et al. (2018), and exhibits a steady decline with . Finally, we find values of are lower than in Eftekhari et al. (2018) by a factor of 2, although within the error bars for that work, and declining with .
3.3 Cooling Frequency and
Eftekhari et al. (2018) reported a deviation from equipartition in by searching for a cooling break using the optical/NIR and late-time ( d) X-ray data. They find , two orders of magnitude lower than expected for equipartition (relative to the assumed value of ). However, because here we use , thereby changing the steepness of the SED slope above , we expect that this will lead to a change in the location of the cooling frequency, , and hence . The cooling frequency is given by (Sari et al., 1998):
| (8) |
where .
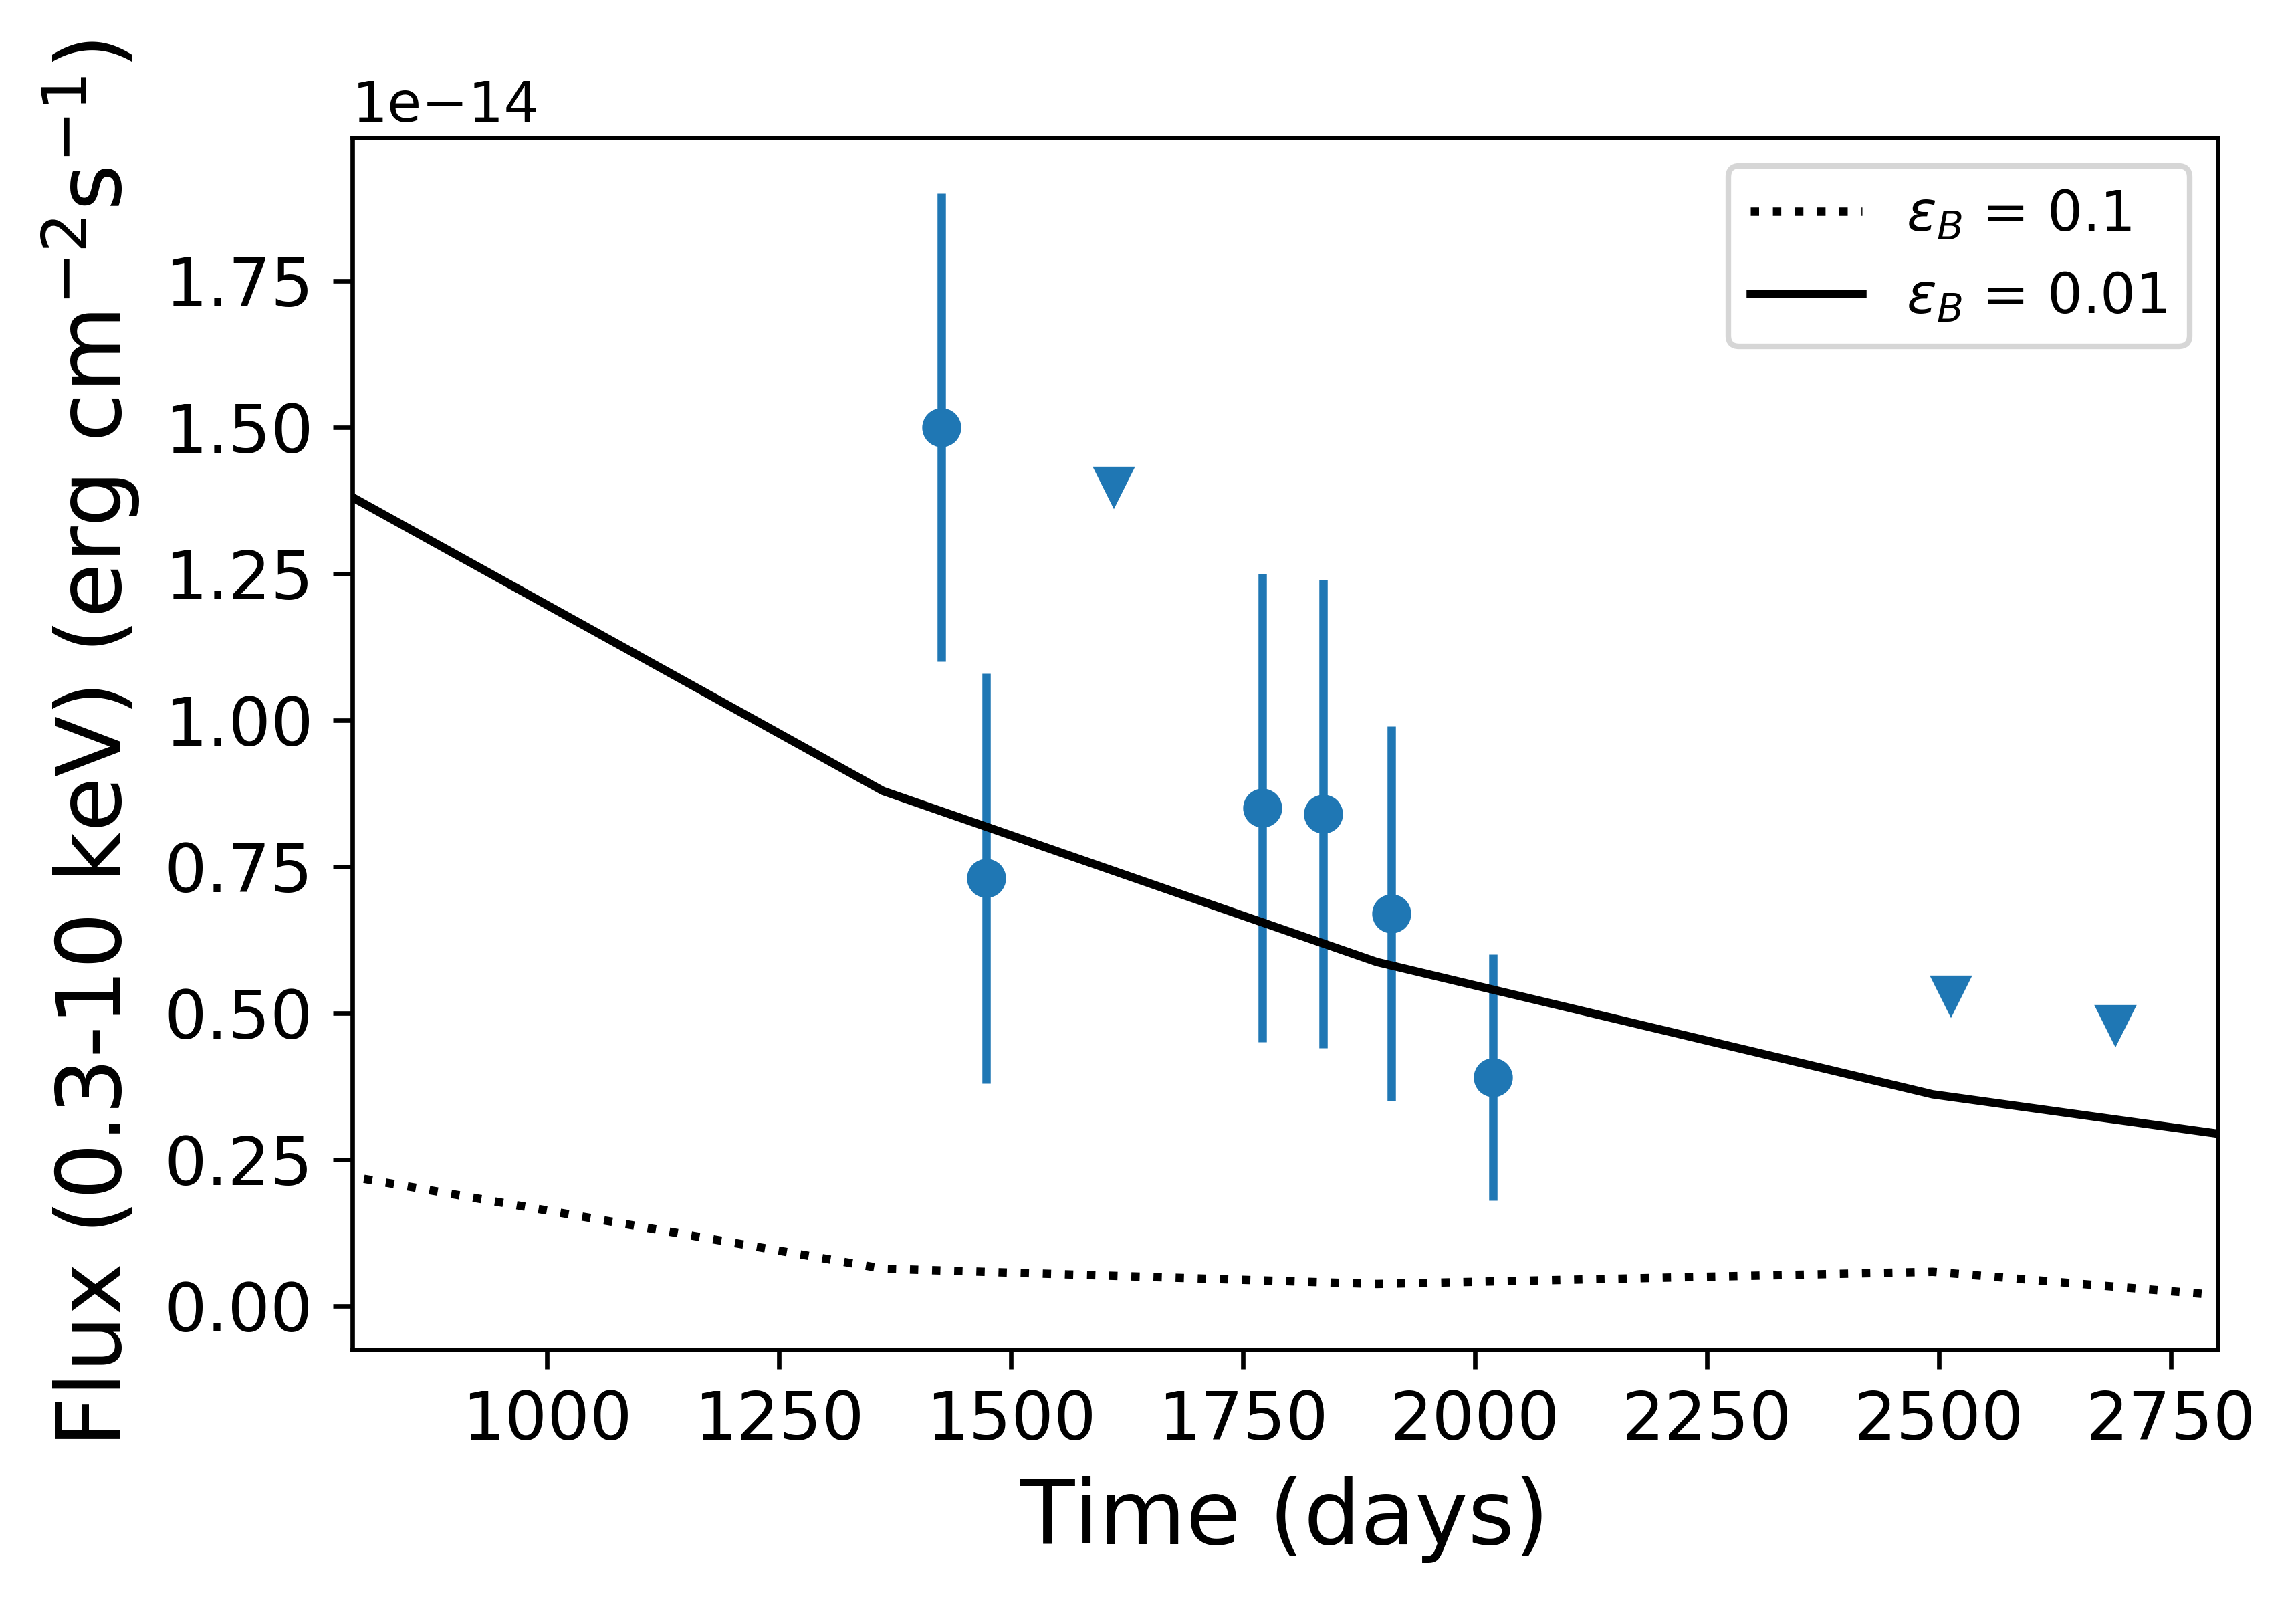
In Figure 5 we show the X-ray data at d along with an extrapolation of the radio models assuming equipartition (). We find that this model underpredicts the observed X-ray flux. Instead, a model with provides an adequate fit to both the amplitude and time evolution of the X-ray flux; see Figure 5. The blastwave and external medium parameters provided in the previous sections adopt this departure from equipartition.
4 Discussion
Sw 1644+57 continues to be the best and longest studied relativistic TDE to date. Below we summarize the on-going evolution of the outflow and the ambient density profile, briefly discuss the implications of the VLASS detections, and cover what we can expect from observations of Sw 1644+57 in the future.
4.1 The Ongoing Evolution of Sw 1644+57
After Day the outflow from Sw 1644+57 transitioned to non-relativistic expansion (Eftekhari et al., 2018). Our most recent observations confirm this trend. The steady energy scale of the outflow on a timescale of days (Figure 4) indicate no significant injection of energy from initially slow ejecta that may have caught up with the blastwave at late times. Similarly, the continued decline in X-ray emission (with the non-detections presented here) indicates that this band is still dominated by forward shock emission, and a jet has not been re-activated.
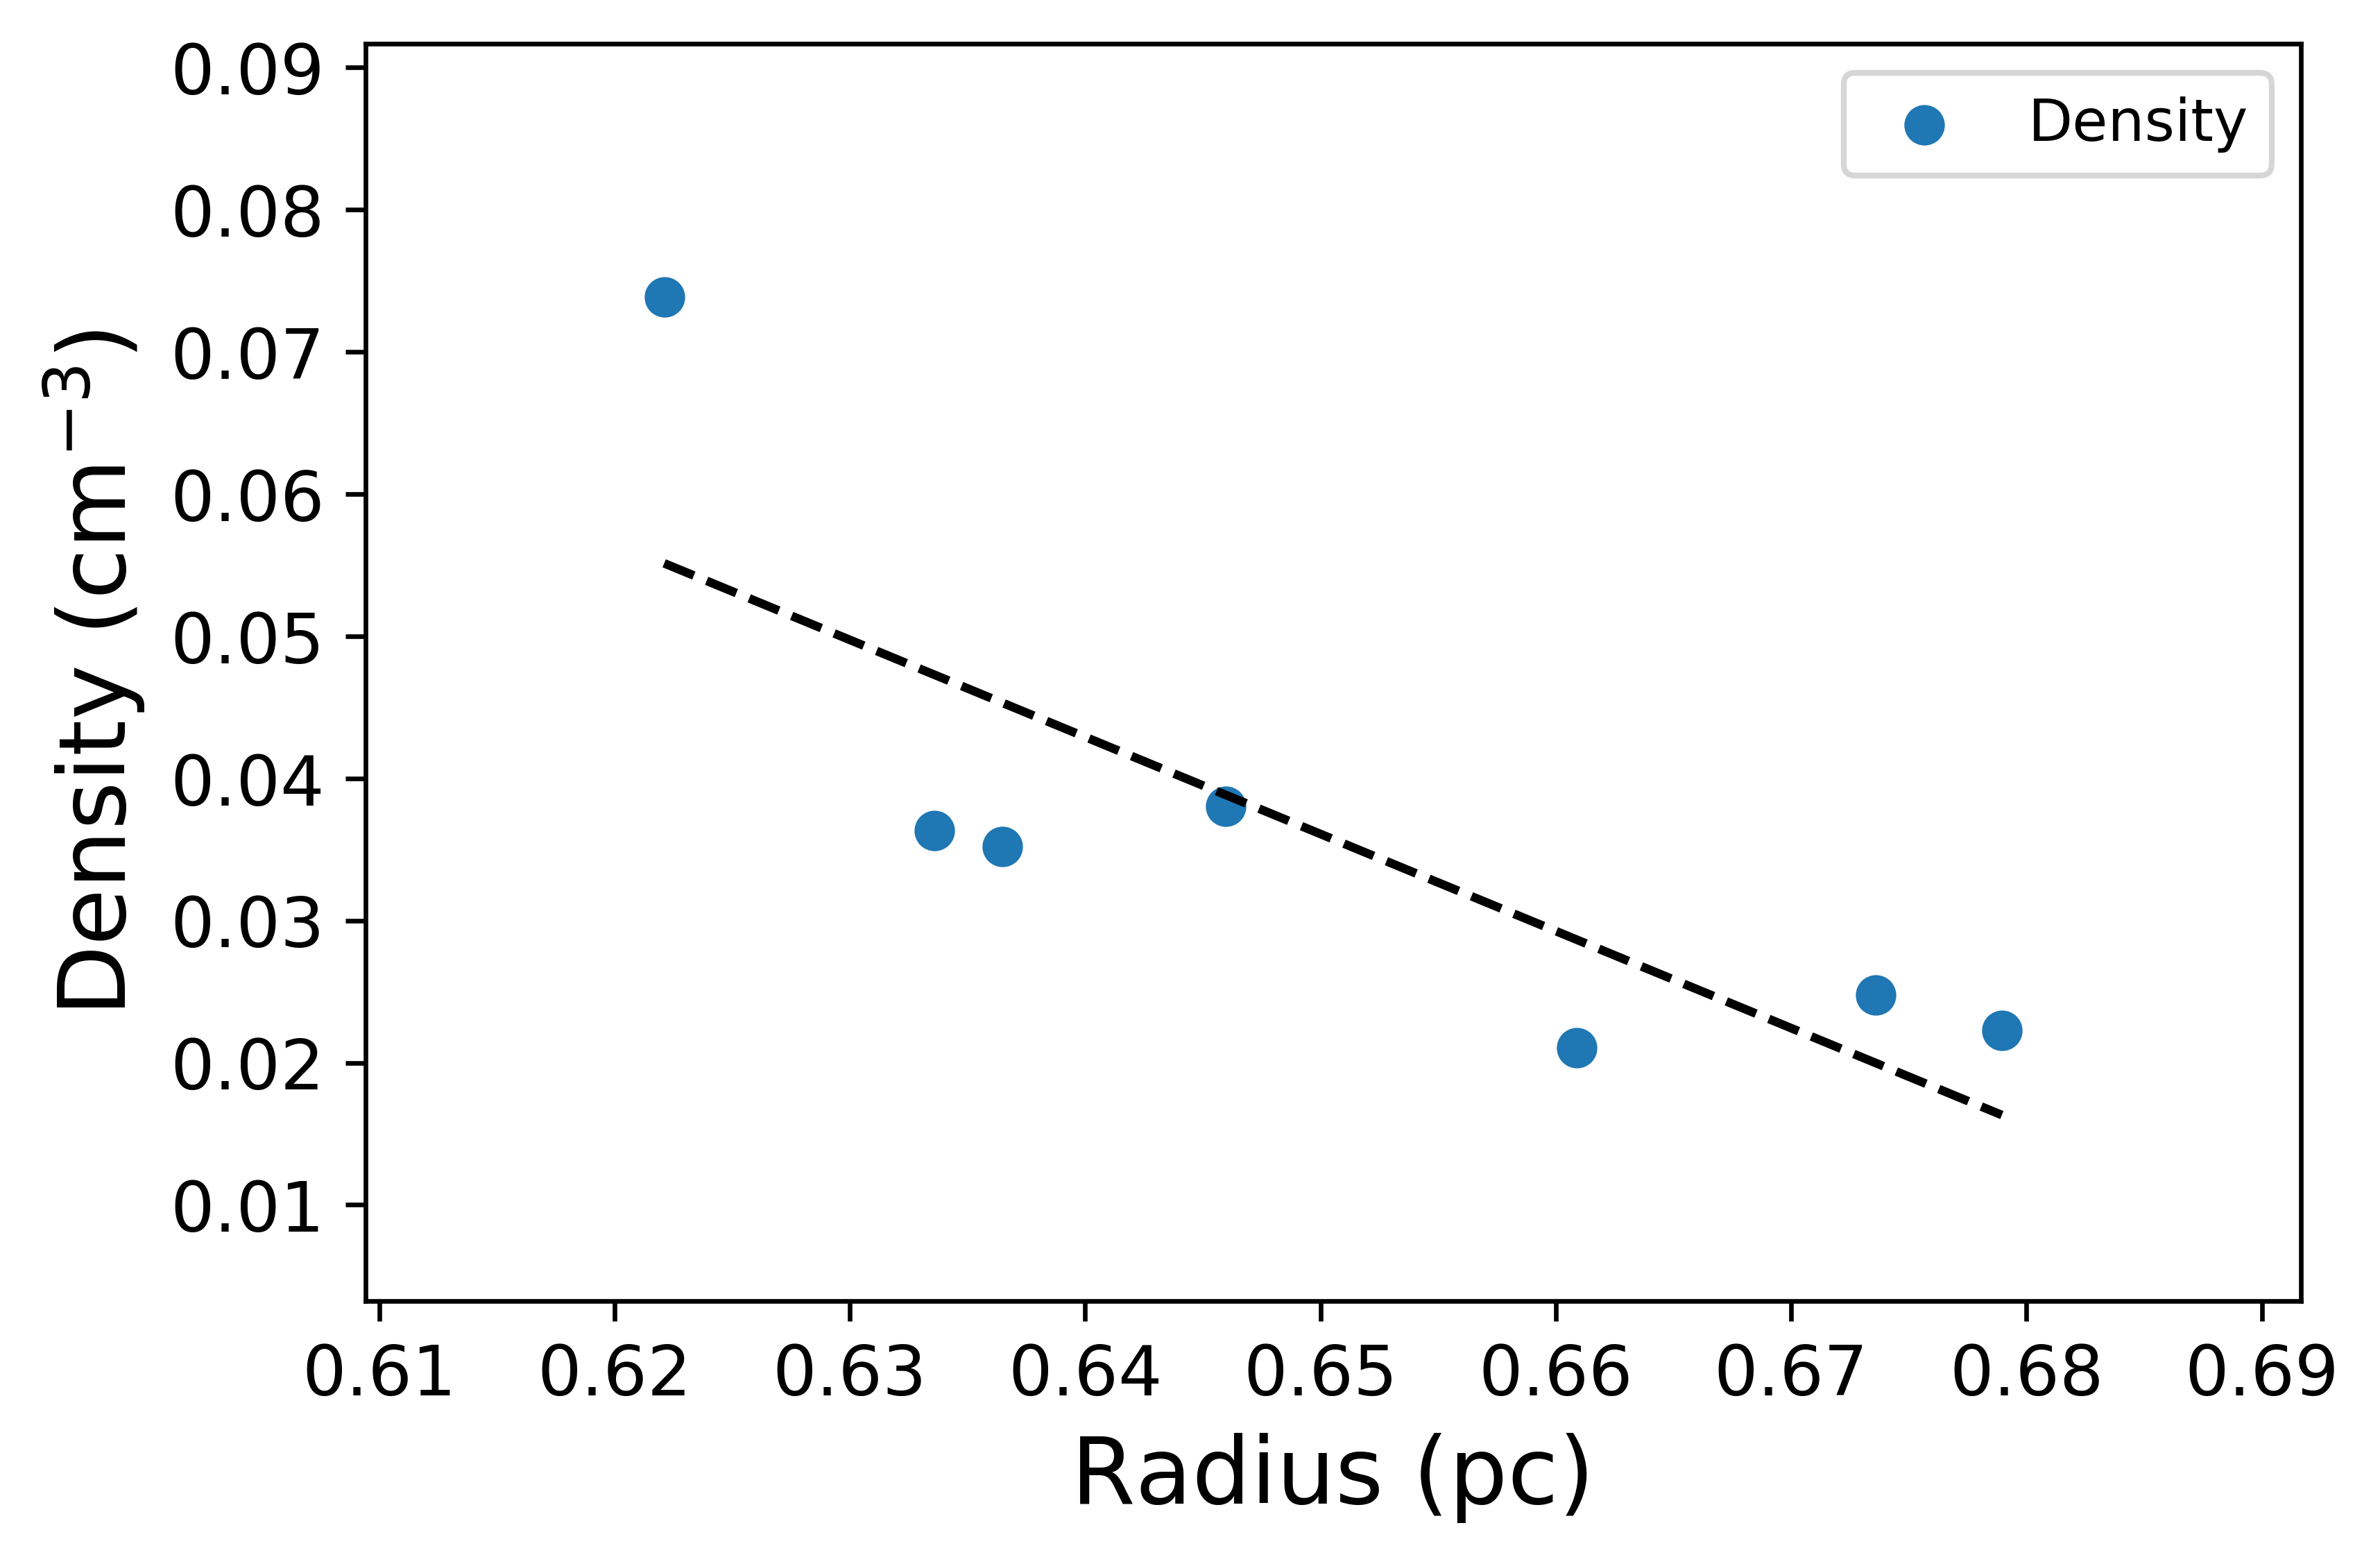

The continued radio observations extend our ability to measure the density profile around the supermassive black hole to a larger radius of about 0.7 pc. Using the time evolution of the blastwave radius and density of emitting particles, we find that the density profile on a scale of pc roughly follows ; see Figure 6 (top). For the purpose of comparison with other supermassive black holes, we also scale the density profile to the Schwarzschild radius of the black hole (Figure 6; bottom). We find that the density in the environment of Sw 1644+57 is about 100 times lower than around Sgr A*, but comparable to that of M87. For reference, we also include two TDEs with non-relativistic outflows, ASASSN-14li (Alexander et al., 2016) and CNSS J0019+00 (Anderson et al., 2019), which overlap with the distances probed by Sw 1644+57 at early times. We find that both of those events occurred in higher density regions than Sw 1644+57.
4.2 VLASS Detection and Implications for Blind TDE Searches
The long-term radio emission from Sw 1644+57 raises the possibility of finding similar relativistic TDEs through their radio emission, even if the jet is initially oriented off-axis. Metzger et al. (2015) discussed the possibility of finding on-axis TDEs like Sw 1644+57 in the VLASS survey and find detectable event assuming a light curve duration of days and a typical off-axis peak luminosity about an order of magnitude lower than for Sw 1644+57. Recently, Anderson et al. (2019) reported the discovery of a radio transient (CNSS J001947.3+003527) in Stripe 82 survey data, which they interpret as an off-axis TDE. This event had a peak luminosity of erg s-1 Hz-1, about three orders of magnitude lower than Sw 1644+57.
Our two VLASS detections of Sw 1644+57, combined with our dedicated observations provide unique insight in the context of TDE blind radio detections. In Figure 7 we shows the light curve of Sw 1644+57 in S-band (3 GHz) and C-band (5 GHz). The spectral luminosity range traced by our observations so far is erg s-1 Hz-1 at a peak time of yr to erg s-1 Hz-1 at about 9.5 yr. The outflow from Sw 1644+57 became non-relativistic on a timescale of yr (Zauderer et al., 2013; Eftekhari et al., 2018), which can be used as a characteristic timescale for when similar events would become detectable even for an initial off-axis orientation; the spectral luminosity on this timescale was erg s-1 Hz-1.
Given the slow cadence of a survey like VLASS ( yr between successive epochs), it is most likely that similar events to Sw 1644+57 will be captured on a timescale of post-disruption. Thus, an event with a similar luminosity will be detectable at ( mJy) to a redshift of for an on-axis event. The radio emission from Sw 1644+57 post-peak evolves roughly as , so over the timescale of 2 VLASS epochs we expect that a similar source will fade by a factor of (depending on the phase of the light curve captured in the first epoch). At an initial detection of , this would be a measurable fading. Thus, we conclude that events like Sw 1644+57 can be captured in VLASS and shown to be fading to . Using the same approach for off-axis events, the lower luminosity means these events will be found in VLASS at .
Updating this distance with the calculation in Metzger et al. (2015), we find that there should be jetted TDE visible in VLASS. In the case of off-axis TDEs, the difference in rate would be lower due to the difference in comoving volumes between and . Assuming a beaming factor of , this yields off-axis TDE events in the VLASS survey. However, we emphasize that our estimate assumes the evolution of Sw 1644+57 is generic, and there may be a more significant difference between peak luminosity for on-axis and off-axis TDEs.
4.3 Future Observations
Sw 1644+57 is continuing to evolve as a non-relativistic outflow with an energy of erg into a ambient medium with a density of cm-3 on a scale of about 0.65 pc from the black hole (Figure 6). As we noted previously (e.g., Eftekhari et al. 2018), the radio emission will continue to be detectable with the VLA for decades. With a flux density of about 1 mJy at 3 GHz and a decline rate of about , the emission should be detectable for an order of magnitude longer in time (i.e., ).
In terms of continued characterization of the outflow, it is essential to capture the peak of the SED, which is evolving to lower frequencies. In our latest multi-frequency observation at 7.7 yr post-disruption, we find that GHz, which is at the lower frequency end of the VLA’s sensitive bands. We expect Sw 1644+57 to be detectable at mJy at P-band (0.35 GHz) in a few hours of dedicated observing with the VLA or hr of commensal observing with VLITE. Another facility with sufficient sensitivity below 1 GHz is the Giant Meterwave Radio Telescope (GMRT), and we will report such follow-up observations in the future. At even lower frequencies, the Low-Frequency Array (LOFAR) is not sensitive enough to detect level emission, and the next generation VLA (ngVLA) proposal does not cover sub-GHz frequencies. We note that Sw 1644+57 is not visible from the future Square Kilometer Array (SKA) sites. As such, while the radio emission at GHz frequencies will continue to be detectable for decades, it is possible that a detailed characterization of the outflow may not be possible. Still, tracking the optically thin portion of the SED will allow us to determine changes in the dynamical evolution of Sw 1644+57, or evolution in the electron power law index, .
Finally, the proposed Lynx X-ray Observatory may be able to detect emission from Sw 1644+57, depending on when (and if) it is launched, as well as whether Sw 1644+57 continues to evolve in X-rays at its present rate.
5 Conclusions
We presented new VLA radio data ( GHz) and Chandra X-ray data extending to about 3400 days post-disruption, and used these observations to determine the continued dynamical evolution of the outflow and the density of the ambient medium. The combination of continued radio detections and X-ray upper limits allow us to characterize the synchrotron spectral energy distribution. We find that, unlike at early time, the electron power law at days index is . The outflow continues to exhibit non-relativistic expansion, with a radius of about cm (0.65 pc) and a kinetic energy of about erg. The circumnuclear density is about cm-3.
We also report two detections of Sw 1644+57 in VLASS data, making it the first TDE detection in this sky survey (albeit not a blind detection). We estimate, based on the long-term evolution of Sw 1644+57, that for events with similar luminosities and durations, on-axis and off-axis TDEs may be present in the VLASS data. We note, however, that Sw 1644+57 remains by far the most luminous TDE at radio frequencies so the detection rate in VLASS may be much lower. In addition, even if TDEs are present in the VLASS data, identifying these sources within the large survey footprint will not be trivial.
As Sw 1644+57 continues its slow fade, it will detectable for decades with the VLA (and its successors), although the peak frequency continues to evolve to sub-GHz frequencies that are challenging to measure at the current brightness of Sw 1644+57. Still, continued observations of this unique event are essential to determine the long-term evolution of the outflow and the structure of the circumnuclear medium on sub-pc scales.
6 Acknowledgements
We thank Kate Alexander and Griffin Hosseinzadeh for conversations and input regarding the manuscript, and Wendy Lane for assistance with VLITE data. Support for this work was provided by the National Aeronautics and Space Administration through Chandra Award Numbers GO8-19087X and GO8-19098X issued by the Chandra X-ray Center, which is operated by the Smithsonian Astrophysical Observatory for and on behalf of the National Aeronautics Space Administration under contract NAS8-03060. The National Radio Astronomy Observatory is a facility of the National Science Foundation operated under cooperative agreement by Associated Universities, Inc. The scientific results reported in this article are based in part on observations made by the Chandra X-ray Observatory.
References
- Alexander et al. (2016) Alexander, K. D., Berger, E., Guillochon, J., Zauderer, B. A., & Williams, P. K. G. 2016, ApJ, 819, L25, doi: 10.3847/2041-8205/819/2/L25
- Alexander et al. (2020) Alexander, K. D., van Velzen, S., Horesh, A., & Zauderer, B. A. 2020, arXiv e-prints, arXiv:2006.01159. https://arxiv.org/abs/2006.01159
- Anderson et al. (2019) Anderson, M. M., Mooley, K. P., Hallinan, G., et al. 2019, arXiv e-prints, arXiv:1910.11912. https://arxiv.org/abs/1910.11912
- Barniol Duran et al. (2013) Barniol Duran, R., Nakar, E., & Piran, T. 2013, ApJ, 772, 78, doi: 10.1088/0004-637X/772/1/78
- Berger et al. (2012) Berger, E., Zauderer, A., Pooley, G. G., et al. 2012, ApJ, 748, 36, doi: 10.1088/0004-637X/748/1/36
- Bloom et al. (2011) Bloom, J. S., Giannios, D., Metzger, B. D., et al. 2011, Science, 333, 203, doi: 10.1126/science.1207150
- Brown et al. (2015) Brown, G. C., Levan, A. J., Stanway, E. R., et al. 2015, MNRAS, 452, 4297, doi: 10.1093/mnras/stv1520
- Burrows et al. (2011) Burrows, D. N., Kennea, J. A., Ghisellini, G., et al. 2011, Nature, 476, 421, doi: 10.1038/nature10374
- Cenko et al. (2012) Cenko, S. B., Krimm, H. A., Horesh, A., et al. 2012, ApJ, 753, 77, doi: 10.1088/0004-637X/753/1/77
- Clarke et al. (2016) Clarke, T. E., Kassim, N. E., Brisken, W., et al. 2016, in Society of Photo-Optical Instrumentation Engineers (SPIE) Conference Series, Vol. 9906, Proc. SPIE, 99065B, doi: 10.1117/12.2233036
- Eftekhari et al. (2018) Eftekhari, T., Berger, E., Zauderer, B. A., Margutti, R., & Alexander, K. D. 2018, ApJ, 854, 86, doi: 10.3847/1538-4357/aaa8e0
- Foreman-Mackey et al. (2013) Foreman-Mackey, D., Hogg, D. W., Lang, D., & Goodman, J. 2013, PASP, 125, 306, doi: 10.1086/670067
- Granot & Sari (2002) Granot, J., & Sari, R. 2002, ApJ, 568, 820, doi: 10.1086/338966
- Lacy et al. (2020) Lacy, M., Baum, S. A., Chandler, C. J., et al. 2020, PASP, 132, 035001, doi: 10.1088/1538-3873/ab63eb
- Levan et al. (2016) Levan, A. J., Tanvir, N. R., Brown, G. C., et al. 2016, ApJ, 819, 51, doi: 10.3847/0004-637X/819/1/51
- Mangano et al. (2016) Mangano, V., Burrows, D. N., Sbarufatti, B., & Cannizzo, J. K. 2016, ApJ, 817, 103, doi: 10.3847/0004-637X/817/2/103
- McMullin et al. (2007) McMullin, J. P., Waters, B., Schiebel, D., Young, W., & Golap, K. 2007, in Astronomical Society of the Pacific Conference Series, Vol. 376, Astronomical Data Analysis Software and Systems XVI, ed. R. A. Shaw, F. Hill, & D. J. Bell, 127
- Metzger et al. (2015) Metzger, B. D., Williams, P. K. G., & Berger, E. 2015, ApJ, 806, 224, doi: 10.1088/0004-637X/806/2/224
- Quataert (2004) Quataert, E. 2004, ApJ, 613, 322, doi: 10.1086/422973
- Russell et al. (2015) Russell, H. R., Fabian, A. C., McNamara, B. R., & Broderick, A. E. 2015, MNRAS, 451, 588, doi: 10.1093/mnras/stv954
- Sari et al. (1998) Sari, R., Piran, T., & Narayan, R. 1998, ApJ, 497, L17, doi: 10.1086/311269
- Williams et al. (2017) Williams, P. K. G., Gizis, J. E., & Berger, E. 2017, ApJ, 834, 117, doi: 10.3847/1538-4357/834/2/117
- Willingale et al. (2013) Willingale, R., Starling, R. L. C., Beardmore, A. P., Tanvir, N. R., & O’Brien, P. T. 2013, MNRAS, 431, 394, doi: 10.1093/mnras/stt175
- Zauderer et al. (2013) Zauderer, B. A., Berger, E., Margutti, R., et al. 2013, ApJ, 767, 152, doi: 10.1088/0004-637X/767/2/152
- Zauderer et al. (2011) Zauderer, B. A., Berger, E., Soderberg, A. M., et al. 2011, Nature, 476, 425, doi: 10.1038/nature10366