Visualizing the multifractal wavefunctions of a disordered two-dimensional electron gas
Abstract
The wavefunctions of a disordered two-dimensional electron gas at the quantum-critical Anderson transition are predicted to exhibit multifractal scaling in their real space amplitude. We experimentally investigate the appearance of these characteristics in the spatially resolved local density of states of the 2D mixed surface alloy BixPb(1-x)/Ag(111), by combining high-resolution scanning tunneling microscopy with spin- and angle-resolved inverse-photoemission experiments. Our detailed knowledge of the surface alloy’s electronic band structure, the exact lattice structure and the atomically resolved local density of states enables us to construct a realistic Anderson tight binding model of the mixed surface alloy, and to directly compare the measured local density of states characteristics with those from our model calculations. The statistical analyses of these two-dimensional local density of states maps reveal their log-normal distributions and multifractal scaling characteristics of the underlying wavefunctions with a finite anomalous scaling exponent. Finally, our experimental results confirm theoretical predictions of an exact scaling symmetry for Anderson quantum phase transitions in the Wigner-Dyson classes.
I Introduction
Multifractality (MF) is an ubiquitous phenomenon in nature that characterizes a variety of physical phenomena from turbulence Sreenivasan (1991) to fluid flow and surface growth Stanley and Meakin (1988). It describes the power-law scaling of fractal quantities with not one but a continuous (infinite) set of anomalous scaling exponents. MF also governs the physics of the Anderson quantum phase transition in disordered systems Abrahams et al. (1979); Wegner (1979), which separates phases with Anderson localized Anderson (1958) and extended wave functions in insulators and metals, respectively. In this sense, Anderson transitions are substantially richer than ordinary quantum phase transitions, where the set of anomalous scaling exponents is finite.
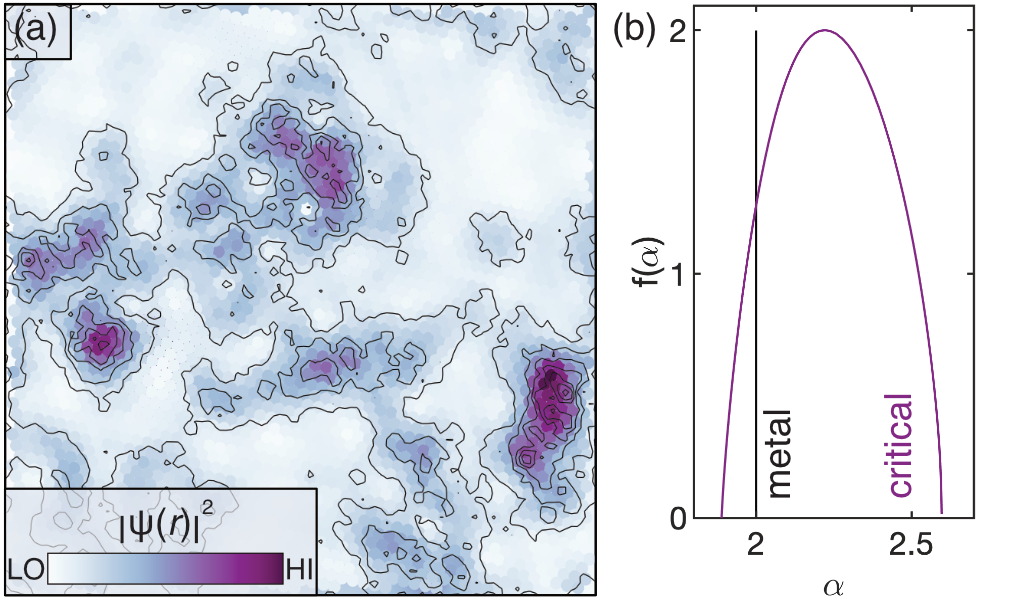
At Anderson criticality, MF characterizes the real space amplitude fluctuations of the underlying quantum mechanical wavefunctions Castellani and Peliti (1986) and thereby the real space distribution of the corresponding local electronic density of states (LDOS) Lerner (1988); Mirlin and Fyodorov (1994). Geometrically, it accounts for the spectrum of fractal dimensions associated with topographic lines in the real space distribution of , as illustrated in Fig. 1(a). Defining such lines by ( is the system size) Halsey et al. (1986); Evers and Mirlin (2008) the probability distribution for the observation of a real space LDOS scaling at a given singularity strength is called the “singularity spectrum”, . Mandelbrot (1974); Hentschel and Procaccia (1983); Halsey et al. (1986); i. e. by changing the system size L, scales with the same exponent along one topographic line. In the presence of MF at the Anderson transition, describes a continuous set of scaling exponents, which, away from the quantum critical point in the metallic phase, collapses onto a line for scaling with a single exponent (Fig. 1(b)).
Scanning Tunneling Microscopy (STM) experiments can probe the LDOS with atomic resolution, and they are particularly useful to study wavefunction multifractality of two-dimensional (2D) systems. Previous STM experiments on disordered two-dimensional quantum Hall systems Morgenstern et al. (2003); Hashimoto et al. (2008), on the surface of bulk GaAsMn Richardella et al. (2010), and on 2D layers of transition metal dichalcogenides Zhao et al. (2019) reported -spectra, calculated from differential tunneling conductance, , maps, whose broadened characteristics were consistent with an interpretation of multifractal scaling at criticality (cf. Fig. 1(b)).
However, such -maps do not necessarily reflect the pure LDOS, but commonly contains contribution from other phenomena such as charge density waves Ugeda et al. (2016), quasiparticle interference Zhao et al. (2019) and electronic correlation Richardella et al. (2010), thereby obscuring the underlying eigenstate distribution characteristics. Without a sufficiently large measurement window Morgenstern et al. (2003) or full access to the wavefunction decay in the 3D bulk Richardella et al. (2010), a complete picture of the eigenstate real space decay cannot be captured either. Since little is known about the underlying local electronic structure in the presence of disorder in most material systems studied to date, experimental results cannot be compared with theoretical expectations, which all together render the interpretation of a multifractal analysis challenging.
In this article, we experimentally investigate the LDOS of the 2D mixed surface alloy BixPb1-xAg and report multifractal wavefunction scaling in a disordered 2D electron gas with strong spin-orbit coupling. To this end, we combine high-resolution STM measurements with inverse-photoemission experiments (IPE). This combined approach provides us with detailed knowledge on the local electronic properties of the surface alloy and the atomic scale lattice structure of the disordered surface alloy with chemical contrast. On this basis, we construct a realistic Anderson tight binding model of the disordered surface alloy, which allows to compare the measured -map characteristics with the calculated LDOS maps. The quantitative analyses of these maps reveal their log-normal distributions and the multifractal scaling of the mixed surface alloy eigenstate density. Finally, our experimental results are in agreement with theoretical expectations of an exact symmetry of the scaling exponents for Anderson quantum phase transitions in the Wigner-Dyson classes.
II Results
The mixed surface alloy is a two-dimensional (2D) alloy of randomly mixed Bi and Pb atoms on the surface of Ag(111) Bihlmayer et al. (2007). The atomically resolved STM topography of the surface alloy is shown in Fig. 2(a). It visualizes the random arrangement of Bi and Pb atoms on the triangular alloy lattice, where they substitute every third Ag atom of the surface layer, leading to strong compositional disorder at any mixing ratio without clustering Ast et al. (2008). The Bi and Pb atoms retain their individual relaxation position outside the plane of the Ag(111) surface plane (Fig. 2(b)) by which they can be distinguished in terms of their topographic height contrast in STM topography maps Gierz et al. (2010). Such analysis applied to the topography of Fig. 2(a) is illustrated by the histogram in Fig. 2(c) and reveals a mixing ratio of the alloy atoms.
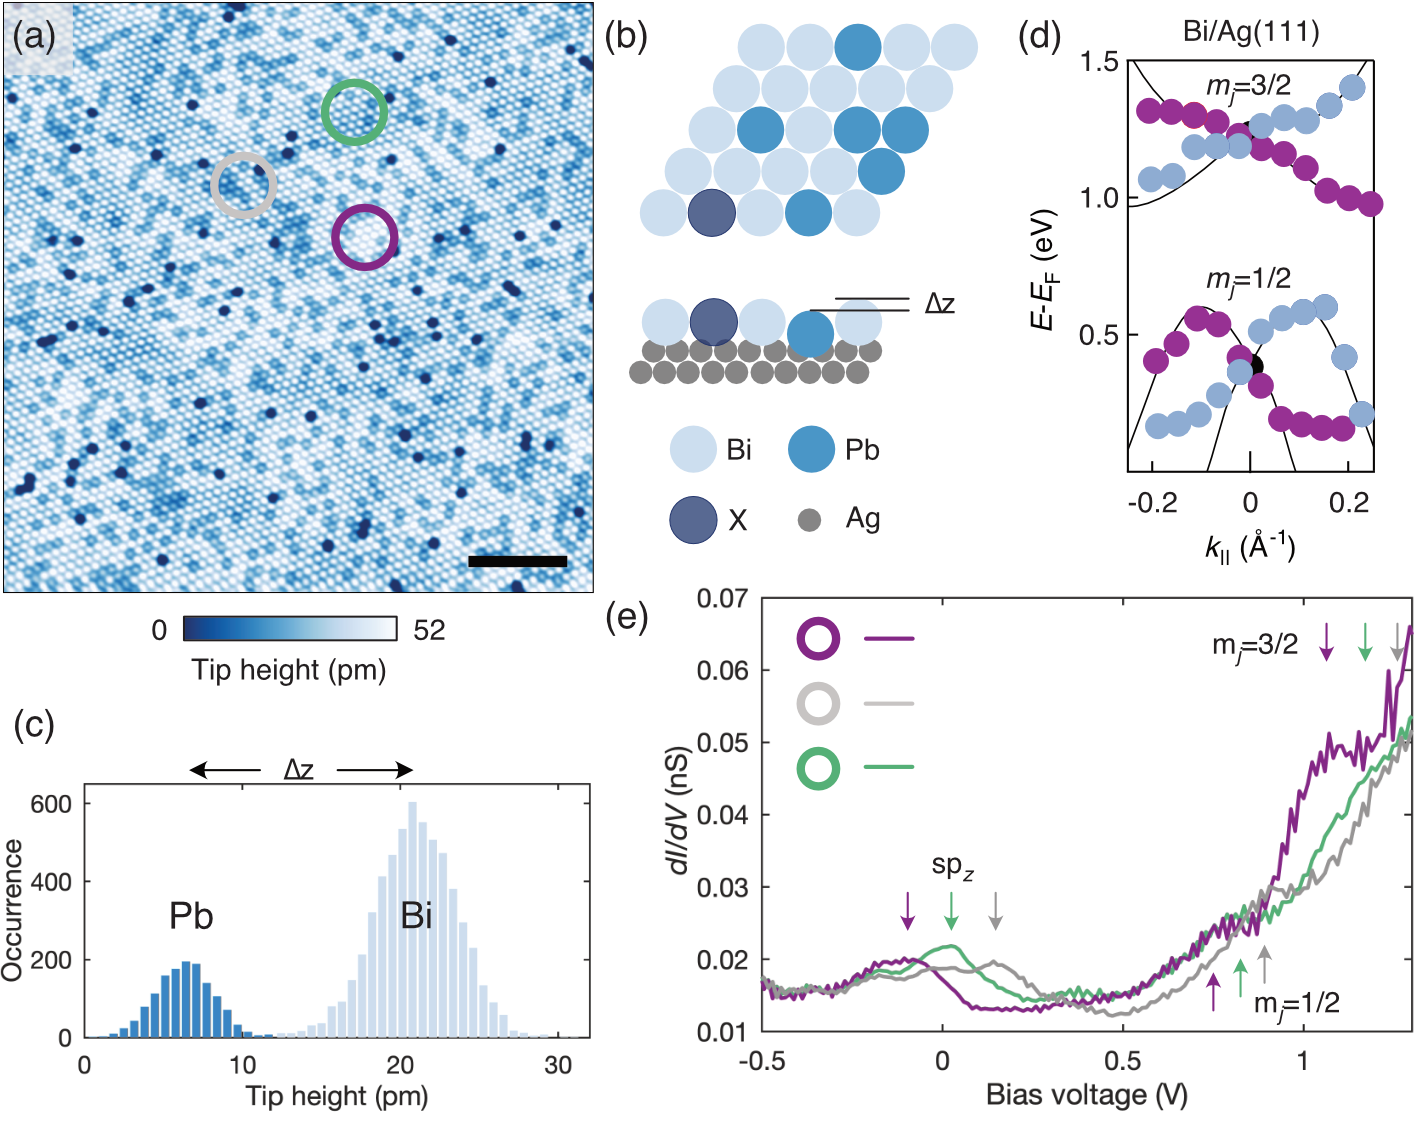
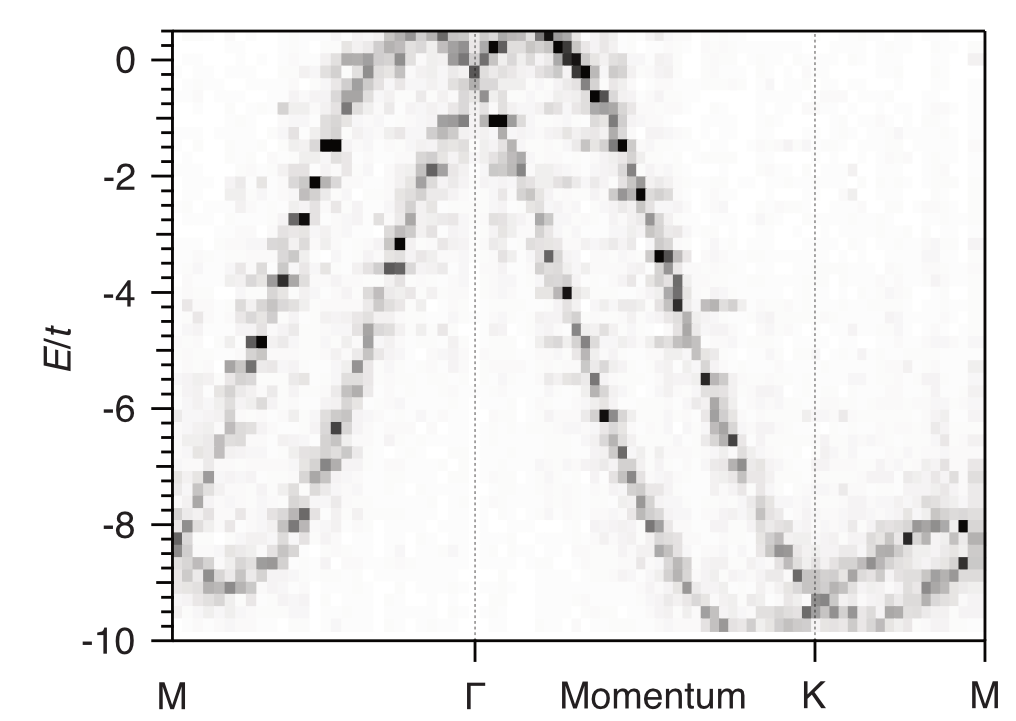
The 2D electronic structure of this type of surface alloys is characterized by a set of three bands, , , and Bihlmayer et al. (2007). We performed inverse-photoemission experiments on the Bi/Ag(111) (, ) surface alloy to characterize the band dispersion along the direction (see Appendix A) Wissing et al. (2014). The measured dispersions of the unoccupied and bands shown in Fig. 2(d) are consistent with results from ab-initio calculations for that platform Bihlmayer et al. (2007); please refer to Ref. Ast et al. (2007a) for the photo-emission data of the occupied -band in previous work. The band structure is visibly affected by strong Rashba spin-orbit coupling (SOC) Ast et al. (2007a), and it is confined within the first atomic layer at the sample surface Ast et al. (2007a), evidencing the 2D character of the surface alloy’s electronic properties.
Complete substitution of Bi atoms by Pb atoms in their lattice sites results in the formation of the pure Pb/Ag(111) surface alloy (, ). Owing to the different number of valence electrons in Bi ( ) and Pb ( ), the bands of a pristine () Pb/Ag(111) alloy (-onset at meV) will shift by about 0.8 eV to lower energy, when going to a pristine () Bi/Ag(111) alloy (-onset at meV) Bihlmayer et al. (2007); Ast et al. (2007b). The partial substitution of Bi by Pb in the mixed surface alloy , therefore, results in a random disorder potential, whose spatial characteristics are determined by the position of the Pb atoms on the alloy lattice (Fig. 2(a)).
Scanning tunneling spectroscopy (STS) measurements can be used to characterize the influence of this random disorder potential on the LDOS. Fig. 2(e) shows selected -spectra, which were recorded in different regions of the mixed surface alloy surface, exhibiting a varying local Bi concentration (cf. Fig. 2(a)). The spectra, all of which were recorded with the STM tip located on top of a Bi atom, exhibit similar spectral features that can be associated with the onsets of the respective electronic bands (cf. Fig. 2(d)). However, we find the energetic position of these peaks to be shifted with respect to each other in the different tunneling spectra; their positions shift from higher to lower energy, when moving from regions of locally high Pb concentration to regions of locally high Bi concentration Ast et al. (2007b), consistent with the presence of a locally varying electrostatic potential. In passing we note that the tunneling spectra also do not exhibit a suppression of spectral weight around the Fermi level typically associated with electron-electron interactions in the presence of disorder Efros and Shklovskii (1975); Altshuler et al. (1980); Imry and Ovadyahu (1982); Bielejec et al. (2001); Richardella et al. (2010).
To capture the real space characteristics of these disorder induced LDOS variations, we have performed spectroscopic imaging measurements with the STM, where we record -maps over a larger surface area highlighted in Fig 3(a) (see Appendix A). The normalized -map measured at the -band onset at meV, Fig. 3(b), exhibits a highly irregular pattern with significant amplitude variations over nanometer length scales. We find that a high signal is predominantly accumulated in areas of high Pb concentration, consistent with the characteristics of the -spectra in Fig. 2(e). Conversely, the corresponding -map measured deep inside the -band at meV, Fig. 3(c), lacks a pronounced spatial structure, which is in agreement with the location-independent appearance of the individual -spectra at this energy. We further find that the -maps do not exhibit periodically ordered real space patterns, indicating the absence of charge density wave formation in the mixed surface alloy.
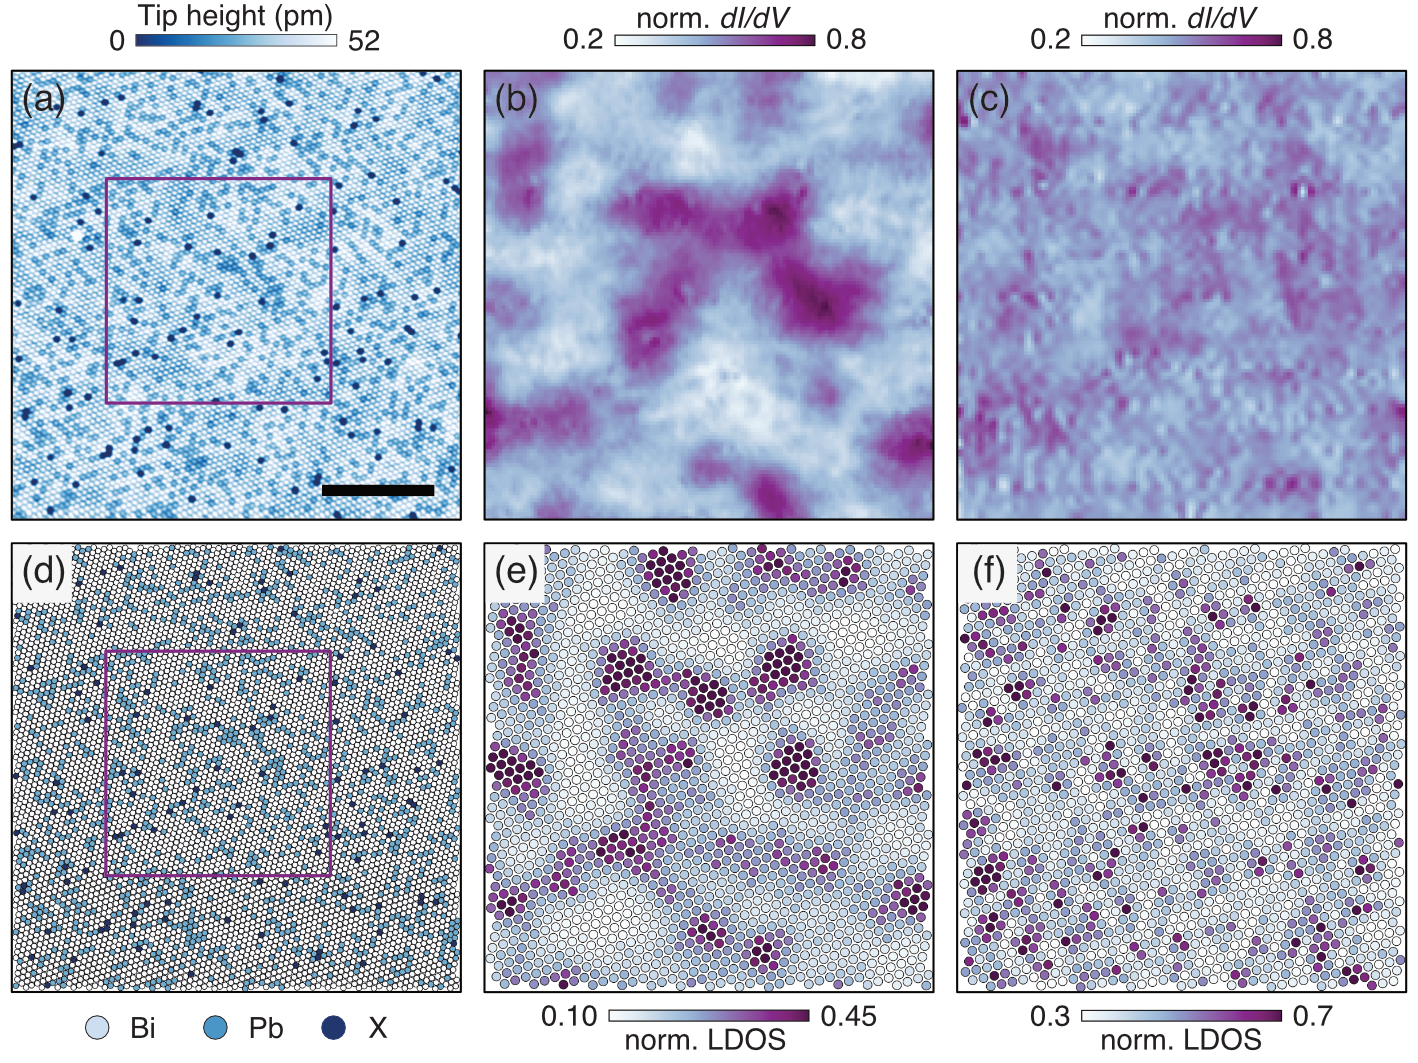
Knowledge of disorder induced LDOS characteristics from model calculations can help to reveal the origin of the irregular -pattern near the -band edge. We have constructed a realistic 2D Anderson tight binding model of the mixed surface alloy to calculate LDOS maps Anderson (1958). Commonly, numerical investigations of the Anderson transition in two dimensions rely on artificial disorder distributions for the calculation of the eigenstates Ando (1989); Mildenberger and Evers (2007). In our study, we create the realistic Anderson model with a binary distribution of onsite disorder potentials, which is based on our detailed knowledge of the electronic properties and the alloy lattice structure from IPE and STM experiments. We obtain the nearest neighbor hopping potentials and Rashba terms from fits to the measured band dispersion in Fig. 2(d). Moreover, our ability to distinguish between Bi and Pb atoms in STM measurements (c.f. Fig. 2(c)) enables us to extract the exact atomic lattice structure of the topography in Fig. 3(a). The reconstructed lattice is shown in Fig. 3(d); we use it as a structural model input to solve for the wave functions and to calculate realistic LDOS maps (see Appendix B). We also included a Rashba term, to account for the effect of strong SOC in the 2D mixed surface alloys. Hikami et al. (1980); Ast et al. (2007a).
The calculated LDOS map near the -band edge is shown in Fig. 3(e). It is in very good agreement with the corresponding -map, Fig. 3(b), down to the very detail. The calculated and measured maps deep inside the -band, Fig. 3(c) and (f), exhibit a comparable amount of agreement despite their rather featureless appearance.
III Discussion
The remarkable agreement between the -map and LDOS-map shows that the measured -signal predominantly reflects the spatial distribution of the 2D mixed surface alloy eigenstates density, i.e. the LDOS, with contributions coming from the Bi and Pb atoms only. This agreement is not least promoted by the absence of signatures of electronic correlations and CDW order in our experimental data in Fig. 2(e) and Fig. 2(b)-(c), respectively. While the absence of these phenomena could be explained by the elevated temperature of our experiment (100 K), it is also consistent with the metallic character and the relatively simple topology of the -band (c.f. Fig. 2(d)) Bihlmayer et al. (2007).
Deviations between the measured and calculated LDOS could result from the simplicity of our Anderson model, which only considers isotropic nearest neighbor hopping, which is based on a single band, and which neglects any effect from the Ag substrate (see Appendix B). The agreement between experiment and theory, therefore, emphasizes the predominant influence of the Pb atom induced random disorder potential on the spatial distribution of the mixed surface alloy’s LDOS. This finding is also highlighted in the individual -spectra in Fig. 2(e), where the local Pb concentration affects the energetic position of the -band edge. Consequently, these spectra miss the sharp Rashba-induced van-Hove singularity at the band onset, which was previously observed for both the pure Bi/Ag(111) and Pb/Ag(111) surface alloys Ast et al. (2007b). Importantly, we emphasize that the characteristic length scale of the measured and calculated LDOS near the band edge, Fig. 3(b,e), is much larger than the atomic length scale of the disorder potential. The LDOS does not merely follow the local potential; instead, its structure emerges from the antagonistic interplay of localizing Pb impurities and delocalizing kinetic energy.
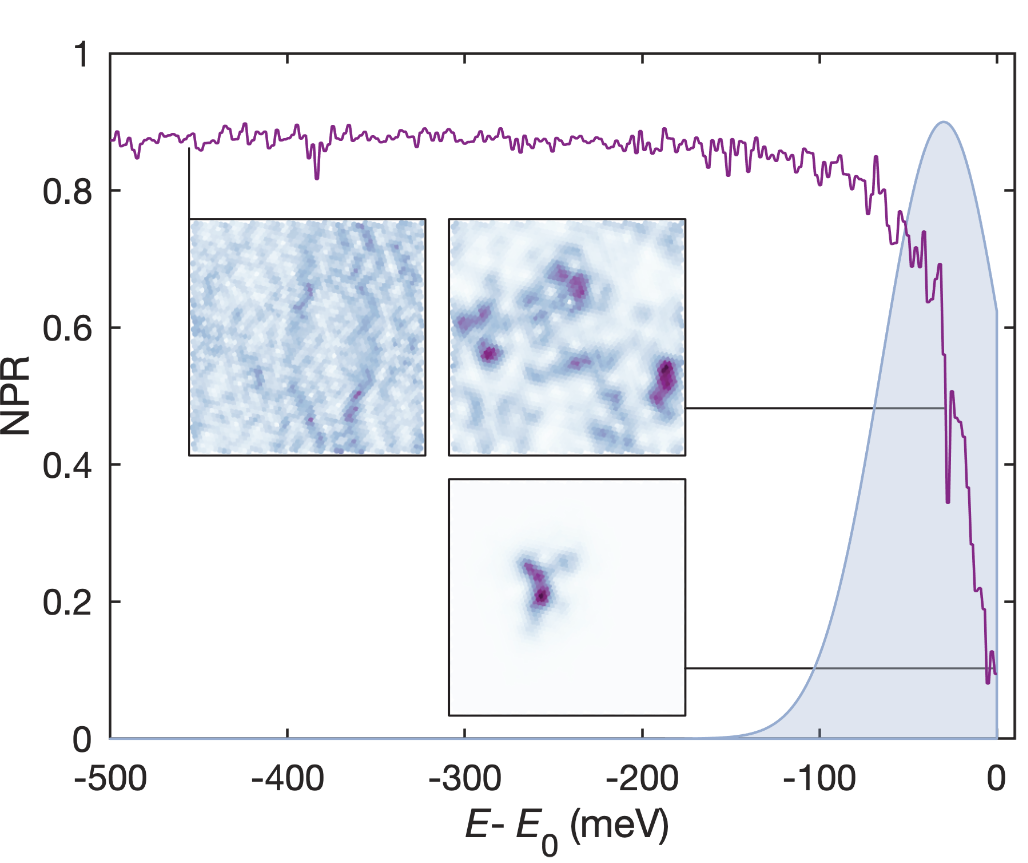
Theoretically, for binary alloys, a disorder induced exponential tail in the average density of states is expected inside the (clean) band gap Lifshitz et al. (1965). This tail is formed by spatially localized impurity states, which (for the present case of a 2D system with spin-orbit coupling) are energetically separated by a sharp mobility edge from extended states far inside the band Mott (1968). This picture is corroborated by our detailed analysis of the wave function decay characteristics based on the normalized partition ratio, NPR Wegner (1980): We find that the average wave function decay length is of atomic scale at the -band edge, and reaches the size of our measurement frame (20 nm) at meV (see Appendix D). The picture of a mobility edge also manifests in the spatial characteristics of the LDOS distributions; while the LDOS inside the localized impurity band and near the mobility edge exhibits a spatially irregular pattern, Fig. 3(b) and (e), the LDOS deep inside the the -band, Fig. 3(c) and (f), appears more homogeneous, characteristic for the extended wave function of a metal.
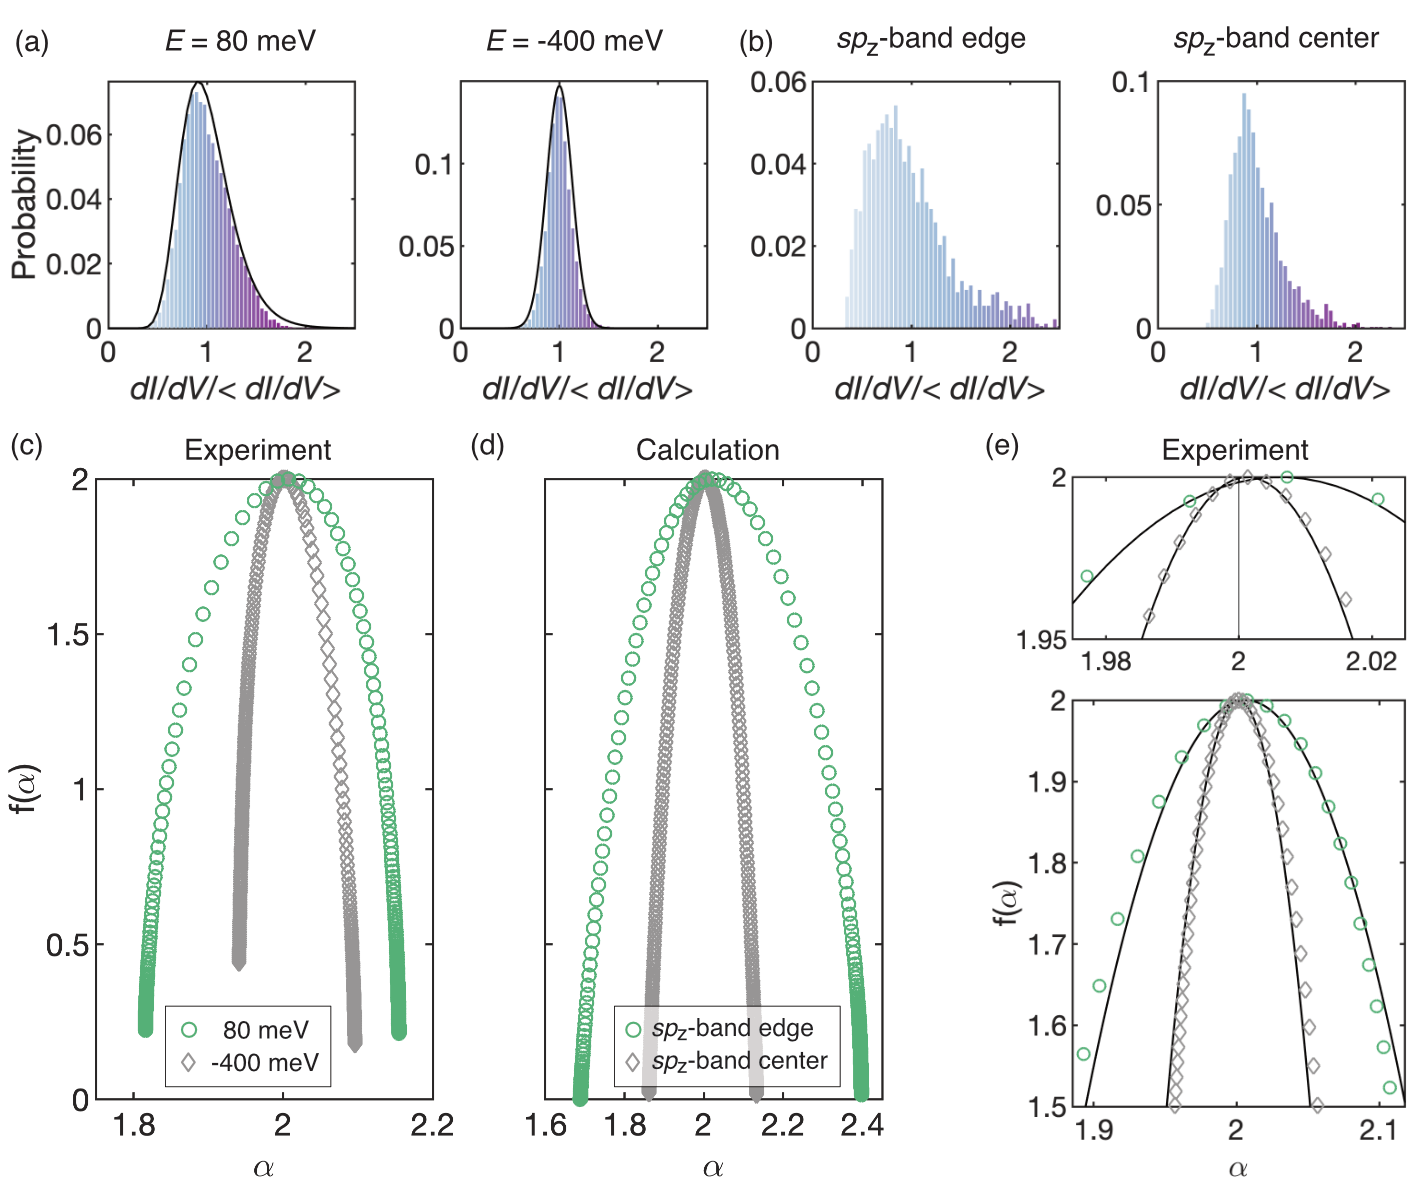
These observations can be further quantified by investigating the LDOS distribution function Lerner (1988); Mirlin and Fyodorov (1994). Whereas the LDOS of extended wavefunctions follows a Gaussian distribution, wavefunction multifractality yields a log-normal LDOS distribution, anticipating the broad distribution of the insulating state Halsey et al. (1986). Applying such analysis to the measured LDOS maps of the band, Fig. 3(b) and (c), reveals their log-normal characteristics near the band edge, and ), and, by contrast, their Gaussian characteristics, , inside the band (Fig. 4(a)). We obtain similar characteristics for the LDOS distribution from model calculations, Fig. 4(c). Even though both LDOS maps follow a log-normal distribution, their skewness is more pronounced near the -band edge as compared to inside the -band, Fig. 4(c).
The corresponding multifractal singularity spectrum, , can be directly calculated from the LDOS maps as a function of the singularity strength , see Appendix C Chhabra and Jensen (1989). In Fig. 4(c) we plot of the measured LDOS maps. The broadened parabolic appearance of , centered at , supports that the mixed surface alloy LDOS exhibits multifractal scaling behavior. of the LDOS map near the -band edge, Fig. 4(c), is significantly wider than the of the LDOS map measured inside the -band. This observation is consistent with the different character of the LDOS distribution functions in Fig. 4(a) and with the highly irregular (homogeneous) real space pattern of the LDOS maps in Fig. 3(b) (Fig. 3(c)). of the calculated LDOS maps, Fig. 4(d), exhibit a wider shape than their experimental counterparts, consistent with the corresponding deviations between the LDOS distributions, Fig. 4(a) and (b), but show overall very good qualitative agreement. The deviations could, on the one hand, be rooted in the discussed simplifications of the Anderson model. On the other hand, the finite temperature of our experiment (100 K) promotes electron-phonon scattering induced quantum decoherence, weakening the eigenstate multifractality in the measured LDOS maps.
The anomalous eigenstate scaling distinguishes the quantum critical wave functions from those in the metallic phase at Evers and Mirlin (2008). It has been theoretically shown that the anomalous scaling of the Wigner-Dyson classes (WDC) exhibits an exact symmetry Mirlin et al. (2006), which, for a 2D system, manifests in the relation, . At weak multifractality, the associated singularity spectrum, , is parabolic, where is a measure for the strength of multifractality and defines both the maximum at and the opening angle of the parabola Evers and Mirlin (2008). We note that the mixed surface alloy, which preserves time-reversal symmetry and whose electronic states are strongly influenced by SOC Bihlmayer et al. (2007); Ast et al. (2007a), falls into the symplectic WDC AII for which numerical calculations predict Evers and Mirlin (2008).
Our quantitative analysis of the experimental in Fig. 4(e) reveals their predominently parabolic characteristics and consistency with the theoretical expectation of an exact anomalous scaling symmetry. Applying a quadratic fit to we obtain () and () for the experimental (calculated) LDOS map near the edge and inside the -band. We note that non-parabolic corrections for , Fig. 4(c) and (d), are in agreement with previous theoretical work on the scaling symmetry Mildenberger and Evers (2007).
The extracted small values of , on the one hand, reflect moderate multifractality below the theoretically expected extent. It is likely that the previously discussed finite experimental temperature (100 K) weakens the multifractal eigenstate characteristics. What is more, our measurement also integrates the eigenstates over a 70 meV window, including those states deeper inside the band, which exhibit extended state characteristics with reduced multifractal character, cf. normalized partition ratio analysis in Appendix D. In particular, the normalized disorder strength in the mixed surface alloy ( is the difference between Bi and Pb onsite potentials, is the nearest neighbor hopping) such that most eigenstates in the mixed surface alloy -band are delocalized and away from the critical point. By comparison, highly accurate model calculations at criticality with show an enhancement of by almost a factor of 10 that manifests in an accordingly larger degree of wavefunction multifractality Ando (1989); Mildenberger and Evers (2007).
Finally, in order to estimate the impact of the mentioned experimental limitations, we analyze the -map measured at eV near the -band onset. Here one would also expect multifractal wavefunction characteristics similar to those observed near the -band edge, Fig. 3(b) and Fig. 4(a), but these characteristics are not detected, Appendix E. Even though the real space pattern of the -map, Fig. 7(a), appears irregular, areas of high and low -amplitude, respectively are found with similar occurrence; this is also reflected in the quasi-Gaussian distribution in Fig. 7(b). This discrepency of observations can be understood in terms of Fermi liquid theory, according to which quasiparticle scattering is strongly enhanced at 1eV away from the Fermi energy, which promotes eigenstate decoherence, detrimental to the observation of MF characteristics. Argumentum a contrario, we take this discussion as evidence for sufficient quantum coherence for the detection of multifractality at the edge.
IV Conclusion
We combined STM and IPE experiments with Anderson model calculations to study the real space LDOS characteristics of the 2D mixed surface alloy . Spectroscopic measurements of the LDOS with the STM reveal a strong influence of a locally varying disorder potential on the electronic states that is induced by the different valency of the Bi and Pb atoms.
The effect of disorder-induced wavefunction localization in the mixed surface alloy is quantified by the statistical analysis of the spatial LDOS distributions . We observe the log-normal characteristics of localized states near the -band edge, and the Gaussian characteristics of metallic states inside the -band, indicating the presence of a mobility edge. The singularity spectra further reveal multifractal scaling of the eigenstate amplitude, which we find to be significant near the -band edge.
We can reproduce these observations with very good agreement through realistic Anderson model calculations, which are based on our detailed knowledge of the electronic properties and the atomic scale lattice structure of the surface alloy. The same analysis further confirms the symmetry of the anomalous eigenstate scaling at criticality in the Wigner-Dyson classes predicted by theory.
Looking ahead, realizing a larger disorder strength in this material system–for instance by moving beyond a binary alloy and by combining suitable elements with enhanced on-site potential differences–would be desirable, because such systems could provide deeper insights into strong multifractal eigenstate scaling Evers and Mirlin (2008); Mildenberger and Evers (2007). We anticipate that performing these and related experiments at much reduced temperatures should suppress scattering-induced eigenstate decoherence and enhance the detection of multifractal characteristics. Recent experiments on 2D films of disordered transition-metal dichalcogenides also suggest the existence of multifractal superconductivity Zhao et al. (2019); Rubio-Verdú et al. (2020). Applying our methodology to these systems could provide unique insights on the underlying normal state eigenstate multifractality electronic states and the correlation with the superconducting critical temperature Feigel´man et al. (2007); Feigel’man et al. (2010); Burmistrov et al. (2012); Mayoh and García-García (2015). In this regard, the actively studied material class of the superconducting high entropy alloys could represent avenues to explore the interplay of wavefunction multifractality at strong compositional disorder with the properties of the superconducting order parameter Koželj et al. (2014); Sun and Cava (2019).
Acknowledgements.
We gratefully acknowledge stimulating discussions with Maurits W. Haverkort, M. Assig, C. Straßer, M. Etzkorn, H. Benia, M. Eltschka, and A. Schnyder. B. J. acknowledges funding from the Alexander-von-Humboldt foundation during the completion of this work. E. J. K. acknowledges support by DOE Basic Energy Sciences grant DE-FG02-99ER45790. C. R. A. acknowledges funding from the Emmy-Noether-Program of the Deutsche Forschungsgemeinschaft (DFG).Appendix A Materials and Methods
Preparation of the mixed surface alloys was done by the co-evaporation of sub-monolayer amounts of Bi and Pb atoms on an atomically clean Ag(111) surface. The Ag substrate was cleaned by subsequent cycles of argon sputtering and thermal annealing. During the alloy deposition, the sample was kept at a temperature of 573 K for optimal mobility of the atoms to form a long range ordered alloy. Sample preparation and measurements were done in the ultra high vacuum environment, mbar, of a home-built scanning tunneling microscope. The temperature of tip and sample during measurements was 100 K. The tunnel conductance spectra and maps were measured at appropriate bias and current setpoints, respectively indicated in the figure captions, using a lock-in modulation amplitude, mV. A flat background was subtracted from the tunnel conductance map to account for the finite and spatially homogeneous background LDOS from the Ag(111) bulk states. The overall energy resolution of our experiment was determined to be about 70 meV.
Spin-resolved IPE was performed at room temperature using spin-polarized electrons emitted from a GaAs photocathode Budke et al. (2007). The photons were detected with a Geiger-Müller counter at eV Thiede et al. (2018). The overall IPE energy resolution was 350 meV and the angular resolution Zumbülte et al. (2015).
Appendix B Anderson tight binding model
We calculate theoretical LDOS maps using a realistic Anderson tight binding model of the 2D mixed surface alloy Alvermann and Fehske (2005); Schubert et al. (2010); Anderson (1958). We use a single -orbital model with on-site potential and a nearest neighbor hopping potential , which is isotropic on the alloy’s two-dimensional hexagonal lattice. To simplify the model calculation, we also assume identical hopping potentials for all different nearest neighbor pairs and we neglect coupling of the alloy atoms to the Ag substrate. Strong SOC in the mixed surface alloy Ast et al. (2007a) is considered by a nearest-neighbor Rashba-type spin-splitting with coupling constant Hikami et al. (1980); Asada et al. (2002):
| (1) |
The angle parentheses in the second sum limits indicate summation over nearest neighbors, is the vector of Pauli matrices, is a unit vector connecting two neighboring atoms, and is the spin index. We use the reconstructed atomic lattice structure in Fig. 3(d) as structural model input to assign the Bi and Pb specific on-site potentials . The tight-binding calculation gives access to the complete set of eigenstates of the mixed surface alloy that can be used to calculate spatially resolved eigenstate density from the eigenstate spinors,
| (2) |
Realistic LDOS maps (cf. Fig. 3(e,f)) are obtained by convolving the spatially resolved eigenstate densities by a Gaussian function (meV) to account for the finite temperature and energy resolution of our experiment.
We obtain realistic values for the Rashba and hopping potentials by fitting the calculated surface alloy bands to the experimentally determined band dispersions (Fig. 1(d)). The band dispersion in momentum space can be calculated by a Fourier transformation of the eigenstates obtained from the Anderson tight-binding model under periodic boundary conditions Ku et al. (2010); Popescu and Zunger (2010); Haverkort et al. (2011). The calculated -band dispersion, which is shown in Fig. 5, is consistent with results from ab-initio calculations Bihlmayer et al. (2007) and from photo-emission experiments Ast et al. (2007a). Finally, we obtain a realistic estimate for the Bi and Pb on-site potential difference from the relative energy shift of the band onsets in the tunneling conductance spectra in Fig. 2(e). The complete parameter set for the Anderson tight binding model is given in Table 1.
| band | ||||||||
|---|---|---|---|---|---|---|---|---|
| 0.08 | 0.14 | 0.14 | 0.32 | 0.4 | 0.3 | 0.06 | 0.07 | |
| 0.40 | 0.14 | 0.14 | 0.32 | 0.4 | 0.3 | 0.6 | 0.07 |
Appendix C Multifractal analysis
The multifractal singularity spectrum can be calculated from 2D maps using a method developed by Chhabra and Jensen Chhabra and Jensen (1989). This analysis is based on the numerical evaluation of the normalized local box probabilities ,
| (3) |
where denotes the box probability of box for the distribution LDOS moment . The square shaped box with edge length, , is characterized by its normalized size, , determining the amount of boxes, , inside a given square shaped LDOS map of edge length . Put into the context of the LDOS maps, denotes the sum of the LDOS spectral weight inside a box of size at position .
Knowledge of enables the direct calculation of ,
| (4) |
and the singularity strength, ,
| (5) |
We used and a moment interval for the calculation of the shown in Fig. 4(c,d).
Appendix D Normalized partition ratio analysis
The normalized partition ratio (NPR) can be used as a measure to quantify eigenstate localization in a given physical system. For a given eigenstate of a tight-binding-model, it is defined as
| (6) |
where denotes the number of lattice sites and Wegner (1980). The NPR describes the fraction of system sites, which contribute to the spectral weight of an eigenstate. For a completely extended state, which exhibits plane wave characteristics, .The more localized the state is, the smaller the NPR becomes. For a fully localized state, . Fig. 6 shows the NPR, which was calculated for the Anderson tight-binding model eigenstates of the -band as a function of the energy separation from the band onset at meV. We also plot the spatially resolved density distribution, , of selected eigenstates in the insets. for the eigenstates near the band onset signals eigenstate localization, consistent with the spatial characteristics of the corresponding . Moving inside the band, the NPR increases, until it plateaus at deep inside the -band, a trend which is also reflected in the real space characteristics of the .
Appendix E Quasiparticle lifetime effects.
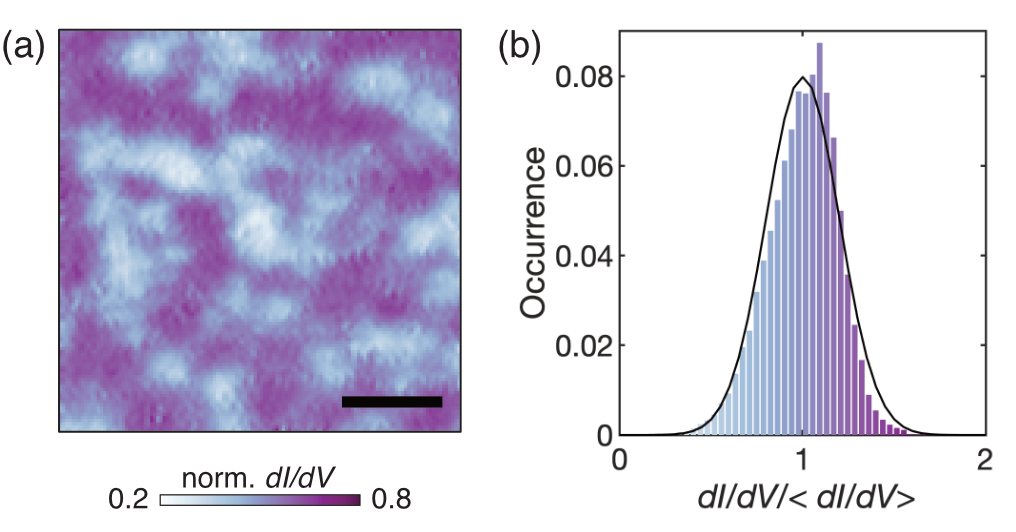
To illustrate the effect of quasiparticle scattering on the real space characteristics of the LDOS away from Fermi energy, we have recorded a tunneling conductance map near the -band edge at eV shown in Fig 7(a)). The corresponding LDOS distribution histogram is shown in Fig 7(b)). It is slightly asymmetric, but it can essentially be described by a Gaussian distribution, indicating the absence of multifractal scaling of the eigenstate real space distribution.
References
- Sreenivasan (1991) K_R Sreenivasan, “Fractals and multifractals in fluid turbulence,” Annual Review of Fluid Mechanics 23, 539–604 (1991).
- Stanley and Meakin (1988) H Eugene Stanley and Paul Meakin, “Multifractal phenomena in physics and chemistry,” Nature 335, 405–409 (1988).
- Abrahams et al. (1979) Elihu Abrahams, PW Anderson, DC Licciardello, and TV Ramakrishnan, “Scaling theory of localization: Absence of quantum diffusion in two dimensions,” Physical Review Letters 42, 673 (1979).
- Wegner (1979) Franz Wegner, “The mobility edge problem: continuous symmetry and a conjecture,” Zeitschrift für Physik B Condensed Matter 35, 207–210 (1979).
- Anderson (1958) Philip W Anderson, “Absence of diffusion in certain random lattices,” Physical Review 109, 1492 (1958).
- Castellani and Peliti (1986) C Castellani and L Peliti, “Multifractal wavefunction at the localisation threshold,” Journal of Physics A: Mathematical and General 19, L429 (1986).
- Lerner (1988) IV Lerner, “Distribution functions of current density and local density of states in disordered quantum conductors,” Physics Letters A 133, 253–259 (1988).
- Mirlin and Fyodorov (1994) Alexander D Mirlin and Yan V Fyodorov, “Distribution of local densities of states, order parameter function, and critical behavior near the anderson transition,” Physical Review Letters 72, 526 (1994).
- Halsey et al. (1986) Thomas C Halsey, Mogens H Jensen, Leo P Kadanoff, Itamar Procaccia, and Boris I Shraiman, “Fractal measures and their singularities: The characterization of strange sets,” Physical Review A 33, 1141 (1986).
- Evers and Mirlin (2008) Ferdinand Evers and Alexander D Mirlin, “Anderson transitions,” Reviews of Modern Physics 80, 1355 (2008).
- Mandelbrot (1974) Benoit B Mandelbrot, “Intermittent turbulence in self-similar cascades: divergence of high moments and dimension of the carrier,” Journal of Fluid Mechanics 62, 331–358 (1974).
- Hentschel and Procaccia (1983) HGE Hentschel and Itamar Procaccia, “The infinite number of generalized dimensions of fractals and strange attractors,” Physica D: Nonlinear Phenomena 8, 435–444 (1983).
- Morgenstern et al. (2003) M Morgenstern, J Klijn, Chr Meyer, and R Wiesendanger, “Real-space observation of drift states in a two-dimensional electron system at high magnetic fields,” Physical Review Letters 90, 056804 (2003).
- Hashimoto et al. (2008) K Hashimoto, C Sohrmann, J Wiebe, T Inaoka, F Meier, Y Hirayama, RA Römer, R Wiesendanger, and M Morgenstern, “Quantum hall transition in real space: from localized to extended states,” Physical Review Letters 101, 256802 (2008).
- Richardella et al. (2010) Anthony Richardella, Pedram Roushan, Shawn Mack, Brian Zhou, David A Huse, David D Awschalom, and Ali Yazdani, “Visualizing critical correlations near the metal-insulator transition in gamnxas,” Science 327, 665–669 (2010).
- Zhao et al. (2019) Kun Zhao, Haicheng Lin, Xiao Xiao, Wantong Huang, Wei Yao, Mingzhe Yan, Ying Xing, Qinghua Zhang, Zi-Xiang Li, Shintaro Hoshino, et al., “Disorder-induced multifractal superconductivity in monolayer niobium dichalcogenides,” Nature Physics 15, 904–910 (2019).
- Ugeda et al. (2016) Miguel M Ugeda, Aaron J Bradley, Yi Zhang, Seita Onishi, Yi Chen, Wei Ruan, Claudia Ojeda-Aristizabal, Hyejin Ryu, Mark T Edmonds, Hsin-Zon Tsai, et al., “Characterization of collective ground states in single-layer nbse2,” Nature Physics 12, 92–97 (2016).
- Bihlmayer et al. (2007) Gustav Bihlmayer, Stefan Blügel, and EV Chulkov, “Enhanced rashba spin-orbit splitting in Bi/ Ag (111) and Pb/ Ag (111) surface alloys from first principles,” Physical Review B 75, 195414 (2007).
- Ast et al. (2008) Christian R Ast, Daniela Pacilé, Luca Moreschini, Mihaela C Falub, Marco Papagno, Klaus Kern, Marco Grioni, Jürgen Henk, Arthur Ernst, Sergey Ostanin, et al., “Spin-orbit split two-dimensional electron gas with tunable rashba and fermi energy,” Physical Review B 77, 081407 (2008).
- Gierz et al. (2010) Isabella Gierz, Benjamin Stadtmüller, Johannes Vuorinen, Matti Lindroos, Fabian Meier, J Hugo Dil, Klaus Kern, and Christian R Ast, “Structural influence on the Rashba-type spin splitting in surface alloys,” Physical Review B 81, 245430 (2010).
- Wissing et al. (2014) S. N. P. Wissing, A. B. Schmidt, H. Mirhosseini, J. Henk, C. R. Ast, and M. Donath, “Ambiguity of experimental spin information from states with mixed orbital symmetries,” Physical Review Letters 113, 116402 (2014).
- Ast et al. (2007a) Christian R Ast, Jürgen Henk, Arthur Ernst, Luca Moreschini, Mihaela C Falub, Daniela Pacilé, Patrick Bruno, Klaus Kern, and Marco Grioni, “Giant spin splitting through surface alloying,” Physical Review Letters 98, 186807 (2007a).
- Ast et al. (2007b) Christian R Ast, Gero Wittich, Peter Wahl, Ralf Vogelgesang, Daniela Pacilé, Mihaela C Falub, Luca Moreschini, Marco Papagno, Marco Grioni, and Klaus Kern, “Local detection of spin-orbit splitting by scanning tunneling spectroscopy,” Physical Review B 75, 201401 (2007b).
- Efros and Shklovskii (1975) AL Efros and Boris I Shklovskii, “Coulomb gap and low temperature conductivity of disordered systems,” Journal of Physics C: Solid State Physics 8, L49 (1975).
- Altshuler et al. (1980) Boris L Altshuler, Arkadi G Aronov, and PA Lee, “Interaction effects in disordered fermi systems in two dimensions,” Physical Review Letters 44, 1288 (1980).
- Imry and Ovadyahu (1982) Yoseph Imry and Zvi Ovadyahu, “Density-of-states anomalies in a disordered conductor: a tunneling study,” Physical Review Letters 49, 841 (1982).
- Bielejec et al. (2001) E Bielejec, J Ruan, and Wenhao Wu, “Hard correlation gap observed in quench-condensed ultrathin beryllium,” Physical Review Letters 87, 036801 (2001).
- Ando (1989) T Ando, “Numerical study of symmetry effects on localization in two dimensions,” Physical Review B 40, 5325 (1989).
- Mildenberger and Evers (2007) A Mildenberger and F Evers, “Wave function statistics at the symplectic two-dimensional anderson transition: Bulk properties,” Physical Review B 75, 041303 (2007).
- Hikami et al. (1980) Shinobu Hikami, Anatoly I Larkin, and Yosuke Nagaoka, “Spin-orbit interaction and magnetoresistance in the two dimensional random system,” Progress of Theoretical Physics 63, 707–710 (1980).
- Lifshitz et al. (1965) Il’ya Mikhailovich Lifshitz et al., “Energy spectrum structure and quantum states of disordered condensed systems,” Soviet Physics Uspekhi 7, 549 (1965).
- Mott (1968) NF Mott, “Metal-insulator transition,” Reviews of Modern Physics 40, 677 (1968).
- Wegner (1980) Franz Wegner, “Inverse participation ratio in 2+ dimensions,” Zeitschrift für Physik B Condensed Matter 36, 209–214 (1980).
- Chhabra and Jensen (1989) Ashvin Chhabra and Roderick V Jensen, “Direct determination of the f () singularity spectrum,” Physical Review Letters 62, 1327 (1989).
- Mirlin et al. (2006) AD Mirlin, Yu V Fyodorov, A Mildenberger, and F Evers, “Exact relations between multifractal exponents at the anderson transition,” Physical Review Letters 97, 046803 (2006).
- Rubio-Verdú et al. (2020) Carmen Rubio-Verdú, Antonio M. García-García, Hyejin Ryu, Deung-Jang Choi, Javier Zaldívar, Shujie Tang, Bo Fan, Zhi-Xun Shen, Sung-Kwan Mo, JoséIgnacio Pascual, and Miguel M. Ugeda, “Visualization of multifractal superconductivity in a two-dimensional transition metal dichalcogenide in the weak-disorder regime,” Nano Letters, Nano Letters 20, 5111–5118 (2020).
- Feigel´man et al. (2007) MV Feigel´man, LB Ioffe, VE Kravtsov, and EA Yuzbashyan, “Eigenfunction fractality and pseudogap state near the superconductor-insulator transition,” Physical Review Letters 98, 027001 (2007).
- Feigel’man et al. (2010) MV Feigel’man, LB Ioffe, VE Kravtsov, and E Cuevas, “Fractal superconductivity near localization threshold,” Annals of Physics 325, 1390–1478 (2010).
- Burmistrov et al. (2012) IS Burmistrov, IV Gornyi, and AD Mirlin, “Enhancement of the critical temperature of superconductors by anderson localization,” Physical Review Letters 108, 017002 (2012).
- Mayoh and García-García (2015) James Mayoh and Antonio M García-García, “Global critical temperature in disordered superconductors with weak multifractality,” Physical Review B 92, 174526 (2015).
- Koželj et al. (2014) Primož Koželj, Stanislav Vrtnik, Andreja Jelen, Simon Jazbec, Zvonko Jagličić, S Maiti, Michael Feuerbacher, Walter Steurer, and Janez Dolinšek, “Discovery of a superconducting high-entropy alloy,” Physical Review Letters 113, 107001 (2014).
- Sun and Cava (2019) Liling Sun and RJ Cava, “High-entropy alloy superconductors: Status, opportunities, and challenges,” Physical Review Materials 3, 090301 (2019).
- Budke et al. (2007) M Budke, V Renken, H Liebl, G Rangelov, and M Donath, “Inverse photoemission with energy resolution better than 200 mev,” Review of Scientific Instruments 78, 083903 (2007).
- Thiede et al. (2018) Christian Thiede, Iris Niehues, Anke B Schmidt, and Markus Donath, “The acetone bandpass detector for inverse photoemission: operation in proportional and geiger–müller modes,” Measurement Science and Technology 29, 065901 (2018).
- Zumbülte et al. (2015) A Zumbülte, AB Schmidt, and M Donath, “Momentum resolution in inverse photoemission,” Review of Scientific Instruments 86, 013908 (2015).
- Alvermann and Fehske (2005) Andreas Alvermann and Holger Fehske, “Local distribution approach to disordered binary alloys,” The European Physical Journal B-Condensed Matter and Complex Systems 48, 295–303 (2005).
- Schubert et al. (2010) Gerald Schubert, Jens Schleede, Krzysztof Byczuk, Holger Fehske, and Dieter Vollhardt, “Distribution of the local density of states as a criterion for anderson localization: Numerically exact results for various lattices in two and three dimensions,” Physical Review B 81, 155106 (2010).
- Asada et al. (2002) Yoichi Asada, Keith Slevin, and Tomi Ohtsuki, “Anderson transition in two-dimensional systems with spin-orbit coupling,” Physical Review Letters 89, 256601 (2002).
- Ku et al. (2010) Wei Ku, Tom Berlijn, Chi-Cheng Lee, et al., “Unfolding first-principles band structures,” Physical Review Letters 104, 216401 (2010).
- Popescu and Zunger (2010) Voicu Popescu and Alex Zunger, “Effective band structure of random alloys,” Physical Review Letters 104, 236403 (2010).
- Haverkort et al. (2011) MW Haverkort, IS Elfimov, and GA Sawatzky, “Electronic structure and self energies of randomly substituted solids using density functional theory and model calculations,” arXiv preprint arXiv:1109.4036 (2011).