Laboratoire d’Astrophysique de Bordeaux, CNRS and Université de Bordeaux, Allée Geoffroy St. Hilaire, 33165 Pessac, France
Université Côte d’Azur / Observatoire de la Côte d’Azur — Lagrange (UMR 7293), Boulevard de l’Observatoire, CS 34229, 06300 Nice, France
Influence of planetary gas accretion on the shape and depth of gaps in protoplanetary discs
It is widely known that giant planets have the capacity to open deep gaps in their natal gaseous protoplanetary discs. It is unclear, however, how gas accretion onto growing planets influences the shape and depth of their growing gaps. We performed isothermal hydrodynamical simulations with the Fargo-2D1D code, which assumes planets accreting gas within full discs that range from 0.1 to 260 AU. The gas accretion routine uses a sink cell approach, in which different accretion rates are used to cope with the broad range of gas accretion rates cited in the literature. We find that the planetary gas accretion rate increases for larger disc aspect ratios and greater viscosities. Our main results show that gas accretion has an important impact on the gap-opening mass: we find that when the disc responds slowly to a change in planetary mass (i.e., at low viscosity), the gap-opening mass scales with the planetary accretion rate, with a higher gas accretion rate resulting in a larger gap-opening mass. On the other hand, if the disc response time is short (i.e., at high viscosity), then gas accretion helps the planet carve a deep gap. As a consequence, higher planetary gas accretion rates result in smaller gap-opening masses. Our results have important implications for the derivation of planet masses from disc observations: depending on the planetary gas accretion rate, the derived masses from ALMA observations might be off by up to a factor of two. We discuss the consequences of the change in the gap-opening mass on the evolution of planetary systems based on the example of the grand tack scenario. Planetary gas accretion also impacts stellar gas accretion, where the influence is minimal due to the presence of a gas-accreting planet.
Key Words.:
giant planet formation – gas accretion – gap opening mass1 Introduction
Recent ALMA observations have revealed protoplanetary discs with many diverse features in the gas (Teague et al., 2018; Pinte et al., 2020) or in the dust (Andrews et al., 2018). An important question considers whether these features can be explained by the presence of planets. Recent exoplanet statistics show that most stars host planets around them (Mayor et al., 2011; Howard et al., 2012; Suzuki et al., 2016; Mulders et al., 2018), but it can be difficult to observe them directly as they might be extinct in the disc itself (Sanchis et al., 2020). A viable recourse is to rely on the impact of the presence of these planets on the disc. A number of studies have shown that planets are capable of producing the features observed in these discs (Pinilla et al., 2012). For example, Zhang et al. (2018) shows that the gaps and rings seen in the DSHARP survey could be explained by the presence of gap-opening planets in the disc.
The formation of gaps by giant planets in protoplanetary discs in the dust (Paardekooper & Mellema, 2006) and in the gas (Lin & Papaloizou, 1986; Crida et al., 2006; Fung et al., 2014; Kanagawa et al., 2015) has been studied in the past via hydrodynamical simulations. Different criteria for the gap-opening mass (i.e., planetary mass needed to open a gap of a given depth) have been derived as a function of disc parameters. The main motivation for these studies has, in fact, been the migration of the giant planets that have the capacity to open these deep gaps. However, it is only recently that these migration studies have started to factor in planetary gas accretion (Dürmann & Kley, 2015; Crida & Bitsch, 2017; Robert et al., 2018).
Gas accretion is a complicated problem that requires 3D high resolution hydrodynamical simulations. The core accretion model (Pollack et al., 1996) suggests that after forming a solid core, a gaseous envelope is slowly accreted until the planet reaches a critical mass where the mass of the gas envelope is equal to the mass of the core. The planet then enters a runaway growth phase of gas accretion during which we can assume that only gas is accreted (Hubickyj et al., 2005; Lissauer et al., 2009). Previous studies have described how gas accretion can be modeled in different frameworks: in 2D with and without migration (Crida & Bitsch, 2017; Kley, 1999) or in 3D (Ayliffe & Bate, 2009; Machida et al., 2010; D’Angelo & Bodenheimer, 2013; Lambrechts et al., 2019; Schulik et al., 2019). These complex hydrodynamical simulations are needed to understand each phase of gas accretion. Due to their high computational cost, they are often integrated over short timescales. In fact, a lot of these recent simulations can only cover 100 planetary orbits (or less), making it impossible to study the long-term evolution of these systems within the 3D high resolution framework with the current computing systems.
As gas accretion requires a computationally expensive resolution, previous studies on gap-opening by giant planets neglected planetary gas accretion. Our goal in this paper is to apply established gas accretion rates (Kley, 1999; Machida et al., 2010) in a 2D isothermal disc framework to study the long-term behavior of the growth of the planet and its influence on the shape and depth of the created gap.
This work is structured as follows. In Sect. 2, we describe our numerical set-up with the description of the FARGO-2D1D code (Crida et al., 2007) and our gas accretion routine. In Sect. 3, we study the difference between an accreting planet and non-accreting planets, the impact that different accretion rate can have on the gap shape and on the accretion onto the star. We then explore different disc parameters ( and ) in Sect. 4, as well as the impact of gas accretion on the gap-opening mass and migration of other planets that could form in these discs. We summarize our findings with a discussion of the consequences for observation and planetary system structures in Sect. 5 and present our conclusions in Sect. 6.
2 Numerical setup
2.1 The FARGO-2D1D code
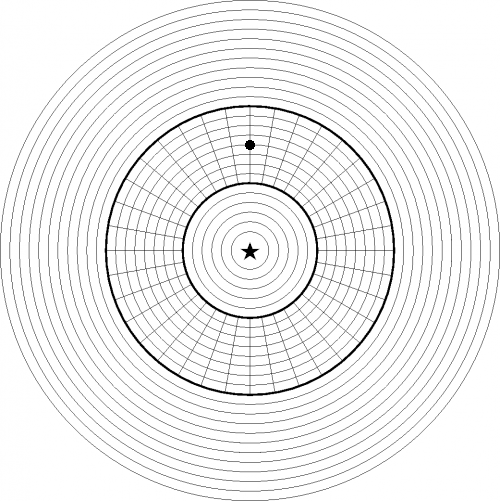
In this paper, we simulate an accreting planet on a fixed circular orbit embedded in a viscous disc with the hydrodynamical code FARGO-2D1D (Crida et al., 2007). This code allows us to simulate the whole viscous evolution of a protoplanetary disc for a reasonable computational cost by surrounding a 2D grid (), where the planet is located, with two 1D grids that are azimuthally symmetric, as shown in figure 1. The extent of the grids is chosen so that the 1D grids are far enough from the planet that we can consider the disc to be axisymmetric. The 1D inner disc spans from AU to AU. The 2D grid then ranges from AU to AU, with a 1D outer disc from AU to AU. The resolution is such that there are five cells per Hill radius of the planet at t=0, which leads to and (). Considering that the resolution is fixed in time, the Hill sphere region will become more and more resolved as the planet grows ().
For computational accuracy, the code uses dimensionless units. We normalized masses with the mass of the central star, and lengths with the position of the planet, AU and we set the gravitational constant as . We end up with a time normalized by the orbital time at , , meaning that the orbital period of the planet is .
The disc is locally isothermal and its aspect ratio is constant. We investigate three different values for this ratio in Sect. 4.1, , and . The density profile is defined by , where at . Its value is chosen such that the total mass of the disc is , corresponding to a heavy disc with a large radius (Baillié et al., 2019). This large radial extent allows us to neglect self-gravity. The disc is subject to an -viscosity as described by Shakura & Sunyaev (1973). We investigate the influence of the viscosity in Sect. 4.2 by taking different values for = , , , and . Our fiducial setup is shown in the first row of Table 1, where we summarize the parameters of the different simulations we compare in this paper.
The accreting planet starts with a mass of or , depending on the aspect ratio (see Table 1). With this initial mass, we can assume that the planet will be directly in the runaway gas accretion regime (Pollack et al., 1996). The accreting planet is introduced into the disc with a mass-taper function, making the planet grow from 0 to its initial mass in orbits. The mass taper function is written as:
| (1) |
In order to let the disc adapt to the planet, we wait until the initial mass creates a steady gap. We define the equilibrium by a change of gap depth of less than within 100 orbits. The times needed to reach the steady state and steady gap depth are summarized in Table 2 as a function of the disc parameters. In principle, the introduction of the planet in the simulation can change the resulting structure of the disc depending on the length of the ramp-up time (Hammer et al., 2017). However, this applies mostly for giant planets and low viscosities. For our initially small planets, we found no significant difference if we let gas accretion onto the planet start after a longer wait time.
| Section | |||
|---|---|---|---|
| 3.X | 0.05 | ||
| 0.03 | |||
| 4.1 | 0.05 | ||
| 0.07 | |||
| 4.2 | 0.05 | ; ; ; | |
| 0.05 | ; ; ; | ||
| 4.3; 4.4 | 0.07 | ; ; ; | |
| 0.03 | ; ; |
2.2 Gas accretion routine
Gas accretion is modeled using the Machida et al. (2010) and Kley (1999) principles, as in Crida & Bitsch (2017). The Kley (1999) principle is an arbitrary accretion rate, but it is limited by how much gas is available within the hill sphere of the planet. The Machida et al. (2010) accretion rate is based on 3D isothermal shearing box simulations and represents the accretion rate of the planet in the runaway gas accretion phase. The accretion rate is different than in the contraction phase, as predicted by the core accretion model (Piso & Youdin, 2014).
Crida & Bitsch (2017) used Machida’s accretion rate without reducing the gas surface density from its initial value when computing the accretion rate. To make sure that they were limited to what the disc can provide, they limited the accretion rate to the minimum between Machida’s and Kley’s accretion rates. As planets create gaps, the surface density profile around the planet is reduced compared to the initial profile. Therefore, in our study, we use the local surface density, defined as the average of the surface density from the position of the planet to . Our accretion routine is written as follows:
| (2) |
where is the disc surface, the disc scale height, the keplerian orbital period of the planet, the distance from the planet, is the Hill sphere of the planet, and is the inverse timescale upon which the accretion rate of Kley (1999) is occurring. Here, to determine which of the accretion rate is the smallest. is a smooth reduction function used to predict what fraction of gas must be accreted on the planet as a function of the distance to the planet. It is defined as:
| (3) |
This function is based on Robert et al. (2018), where the authors assume that close to the planet gas accretion is efficient (). However, it seems that efficiency is not realistic in such a case. Schulik et al. (2019) showed that gas accretion does not start from the full Hill sphere but only from a fraction of it. The accreted mass fraction increases closer to the planet but it does not accrete of the gas in the vicinity. Thus, we chose to limit our study to a maximum value of 2/3.
As Machida’s formula only provides information on the amount of mass that should be accreted, we remove the gas in this regime with the same formalism as for the Kley (1999) method. This means that if the planet is accreting in the regime of Machida et al. (2010), the total amount of gas it accretes is given by Eq.2 and the distribution for where the gas is removed is given by Eq.3.
This way, the removal scheme of the gas is the same for both regimes, but the mass that can be accreted is either limited by the derived accretion rates of Machida et al. (2010) or by the maximum amount the disc can provide, given by the Kley (1999) method. Unless specified, we remain in the regime where throughout, meaning that we always remove the amount of mass suggested in Machida et al. (2010).
3 Influence of gas accretion
In this section, we first investigate the difference in gap shape between accreting and non-accreting planets. Then we focus on the influence of different gas accretion rates to explore the variety of gas accretion rates found in the literature. We conclude this section by studying the influence of planetary accretion on stellar accretion.
3.1 Accretion versus non-accretion
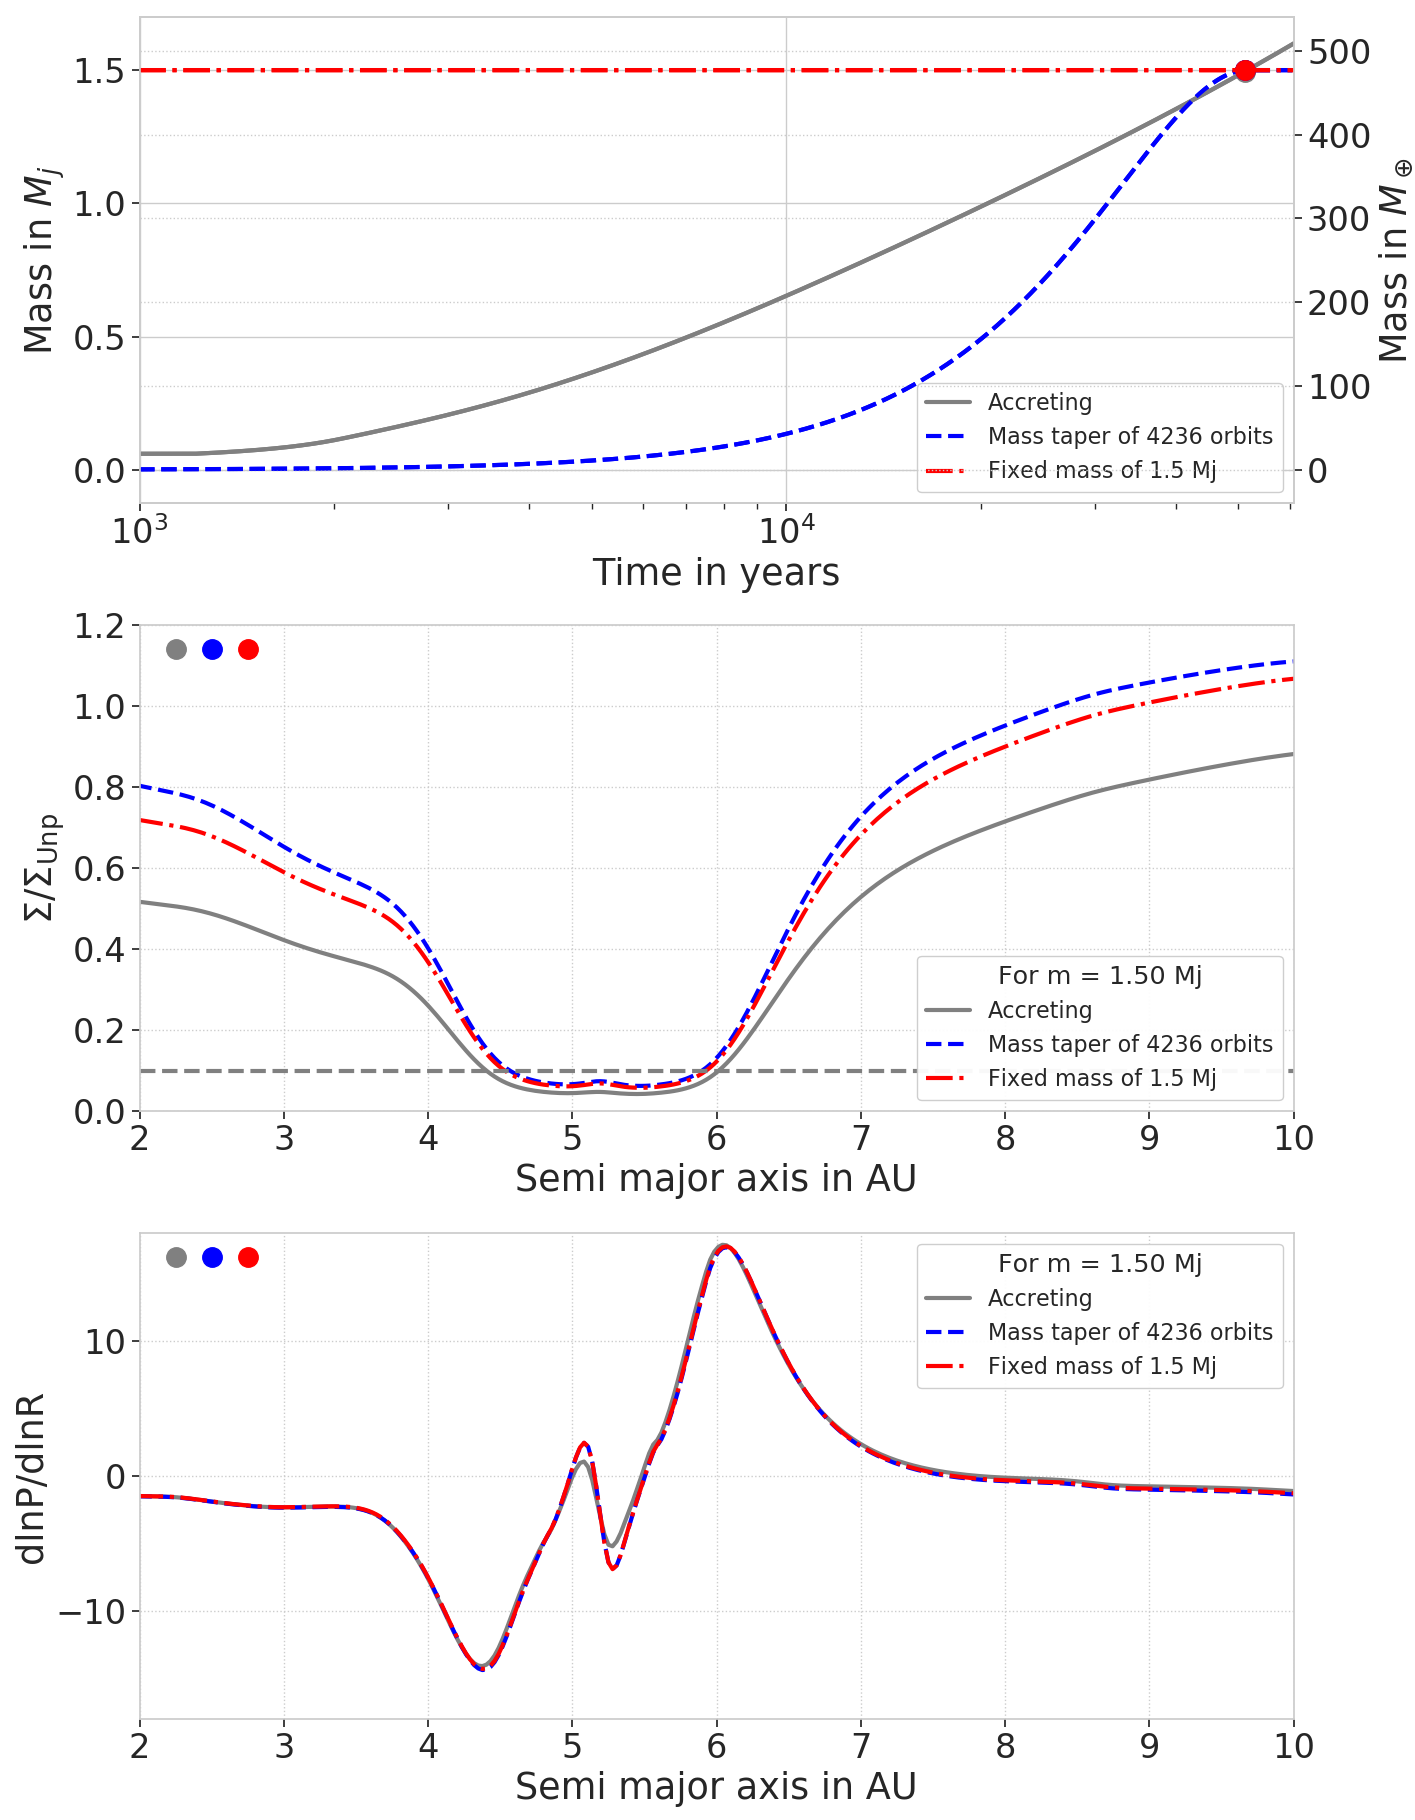
In this section, we investigate the effect of gas accretion on the gap shape and the pressure bumps generated by the planet exterior to its orbit. We compare three different simulations: (i) a planet accreting gas following the recipe presented in Sect. 2.2, where the mass is removed from the disc and added to the planet (solid gray line in the following plots); (ii) a mass-tapered planet where the mass of the planet is changed via the mass-taper function given by Eq. 1 and no mass is removed from the disc (dashed blue line); and (iii) a planet with its mass fixed to the value where the comparison is made (dotted dashed red line). Each simulation is compared at the moment when the planets reach the same mass . For the mass-tapered planet, is chosen so that the planet grows from 0 to over the same number of orbits that the accreting planet needs to reach this mass. We chose to make the comparison before and after reaching the gap-opening mass for and , where the gap-opening mass is the mass needed to open a gap of a depth of , as in Crida et al. (2006). We compare the structure of the disc for planets of masses equal to (Fig. 2) and (Fig. 3). Within these parameters, is equal to 580 orbits for and to 4236 orbits for .
On the top panel of Fig. 2, we show the time evolution of the planetary masses in the three different cases for = 0.5 . The mass evolution of the planet growing via the mass taper is very similar to that of the accreting planet. The dots show the mass and time given for the comparison. In the second panel, we show the gap profiles at the time when the accreting planet reaches (marked by the dots in Fig. 2). The surface density profile has been normalized to the surface density of a disc without a planet at the same time () in order to get rid of the effect of natural viscous evolution of the disc. Our simulations show that the accreting planet generates a slightly deeper gap than the planet with a fixed mass, which is in line with the results of Dürmann & Kley (2015).
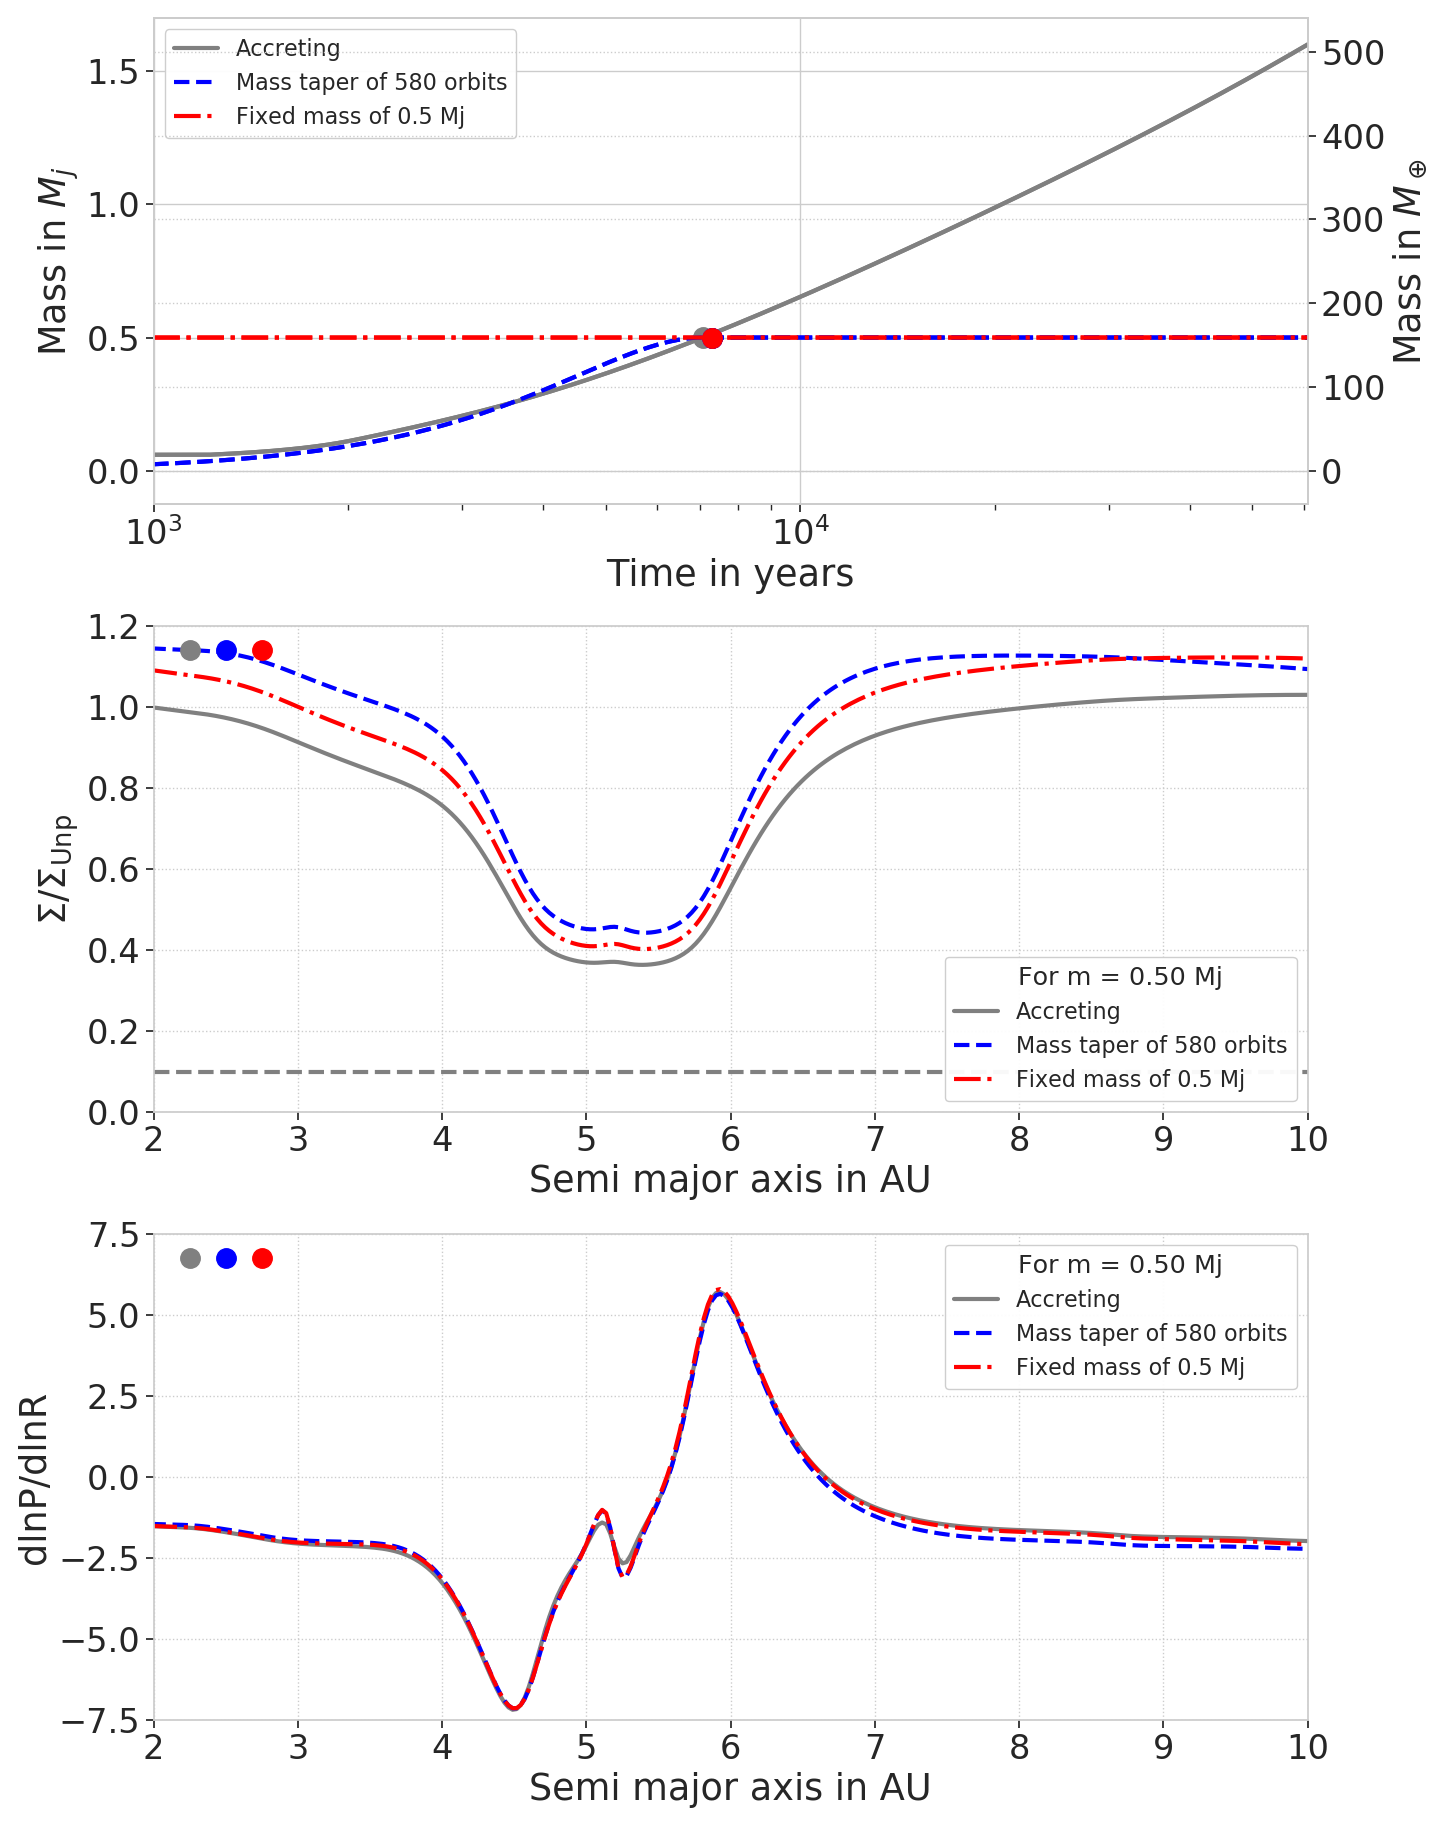
To create a gap, a planet needs to have a strong enough gravitational torque to overcome the pressure torque and viscous spreading that tend to close the gap (Crida et al., 2006). The accreting planet presents a deeper gap as material is removed from the disc as compared to the other two simulations. The difference in surface density at the bottom of the gap is very similar to the difference in surface density in the inner disc due to the fact that mass is removed partially from the inner disc. This will impact the stellar accretion, as we discuss in Sect. 3.3. For these disc parameters (), Dürmann & Kley (2015) found the same behavior (their Fig. 2). Therefore, relative to the edges of the gap, the gaps have similar depths, but when compared to a disc without a planet, the accreting planet produces a deeper gap, as the non-accreting planets only push material away from their orbit, enhancing the surface density in the inner disc while the accreting planet is removing material. On the other hand, the fixed mass planet is opening a deeper gap than the mass-tapered planet, because the fixed-mass planet exerts a stronger torque on the disc material due to its larger mass up until the time of comparison. At later time, when the mass taper fixes the mass of the planet to and the disc has time to adjust to this planetary mass, the shape of the gaps of the fixed-mass and mass-tapered planets is the same.
At later time, when the planet becomes heavier (), we can also see on the middle panel of Fig. 3 that the inner disc is more depleted for the accreting planet. Gas accretion plays, therefore, an important role in the depletion of the inner disc. One of the consequences of this behavior is discussed in Sect. 3.3. The gap depth is only slightly influenced by gas accretion in this case.
The difference in the gap depth can lead to a difference in the torques acting on the planet and, thus, impacting its migration behavior. Kanagawa et al. (2018) found that when the planet creates a deep-enough gap (), then the total torque felt by the planet is proportional to the gap depth. Thus, the difference in gap depth between the accreting and the planet with fixed mass should lead to an equivalent difference in total torque. The difference in gap depth for is of about 24 while the difference in the total torques measured in our simulations is . Using the approach by Kanagawa et al. (2018) regarding the migration behavior and comparing it to our simulations indicate a deviation of between the torques actually measured and the difference that should occur because of the difference in gap depth. This deviation might lie within the errorbars of the fit derived by Kanagawa et al. (2018). On the other hand, for the more massive case plotted in Fig. 3, the difference in gap depth is 38 and the difference in the total measured torques is . Here, the differences match and our simulations confirm the results from Kanagawa et al. (2018). Additional simulations with planets confirm this trend. Therefore, the differences in torques between an accreting planet and a planet with fixed mass can be explained by their difference in gap depth, as long as the gap is deep enough.
The difference in gap depth and shape will have an influence on the drift of dust particles in the disc. Observations (Teague et al., 2018; Andrews et al., 2018) often show rings and gaps in the dust profile of discs, which could be explained by the presence of planets (Pinilla et al., 2012; Zhang et al., 2018) that generate pressure bumps exterior to their orbits where dust can accumulate (Paardekooper & Mellema, 2006). We show in the lower panels of Figs. 2 and 3 the pressure gradients obtained in the three different cases. As expected from the surface density profiles, the pressure gradients are too similar to display the differences seen through observation.
In the following sections, we investigate different levels of gas accretion strength and other disc parameters that influence the depth and shape of gaps.
3.2 Influence of different gas accretion rates
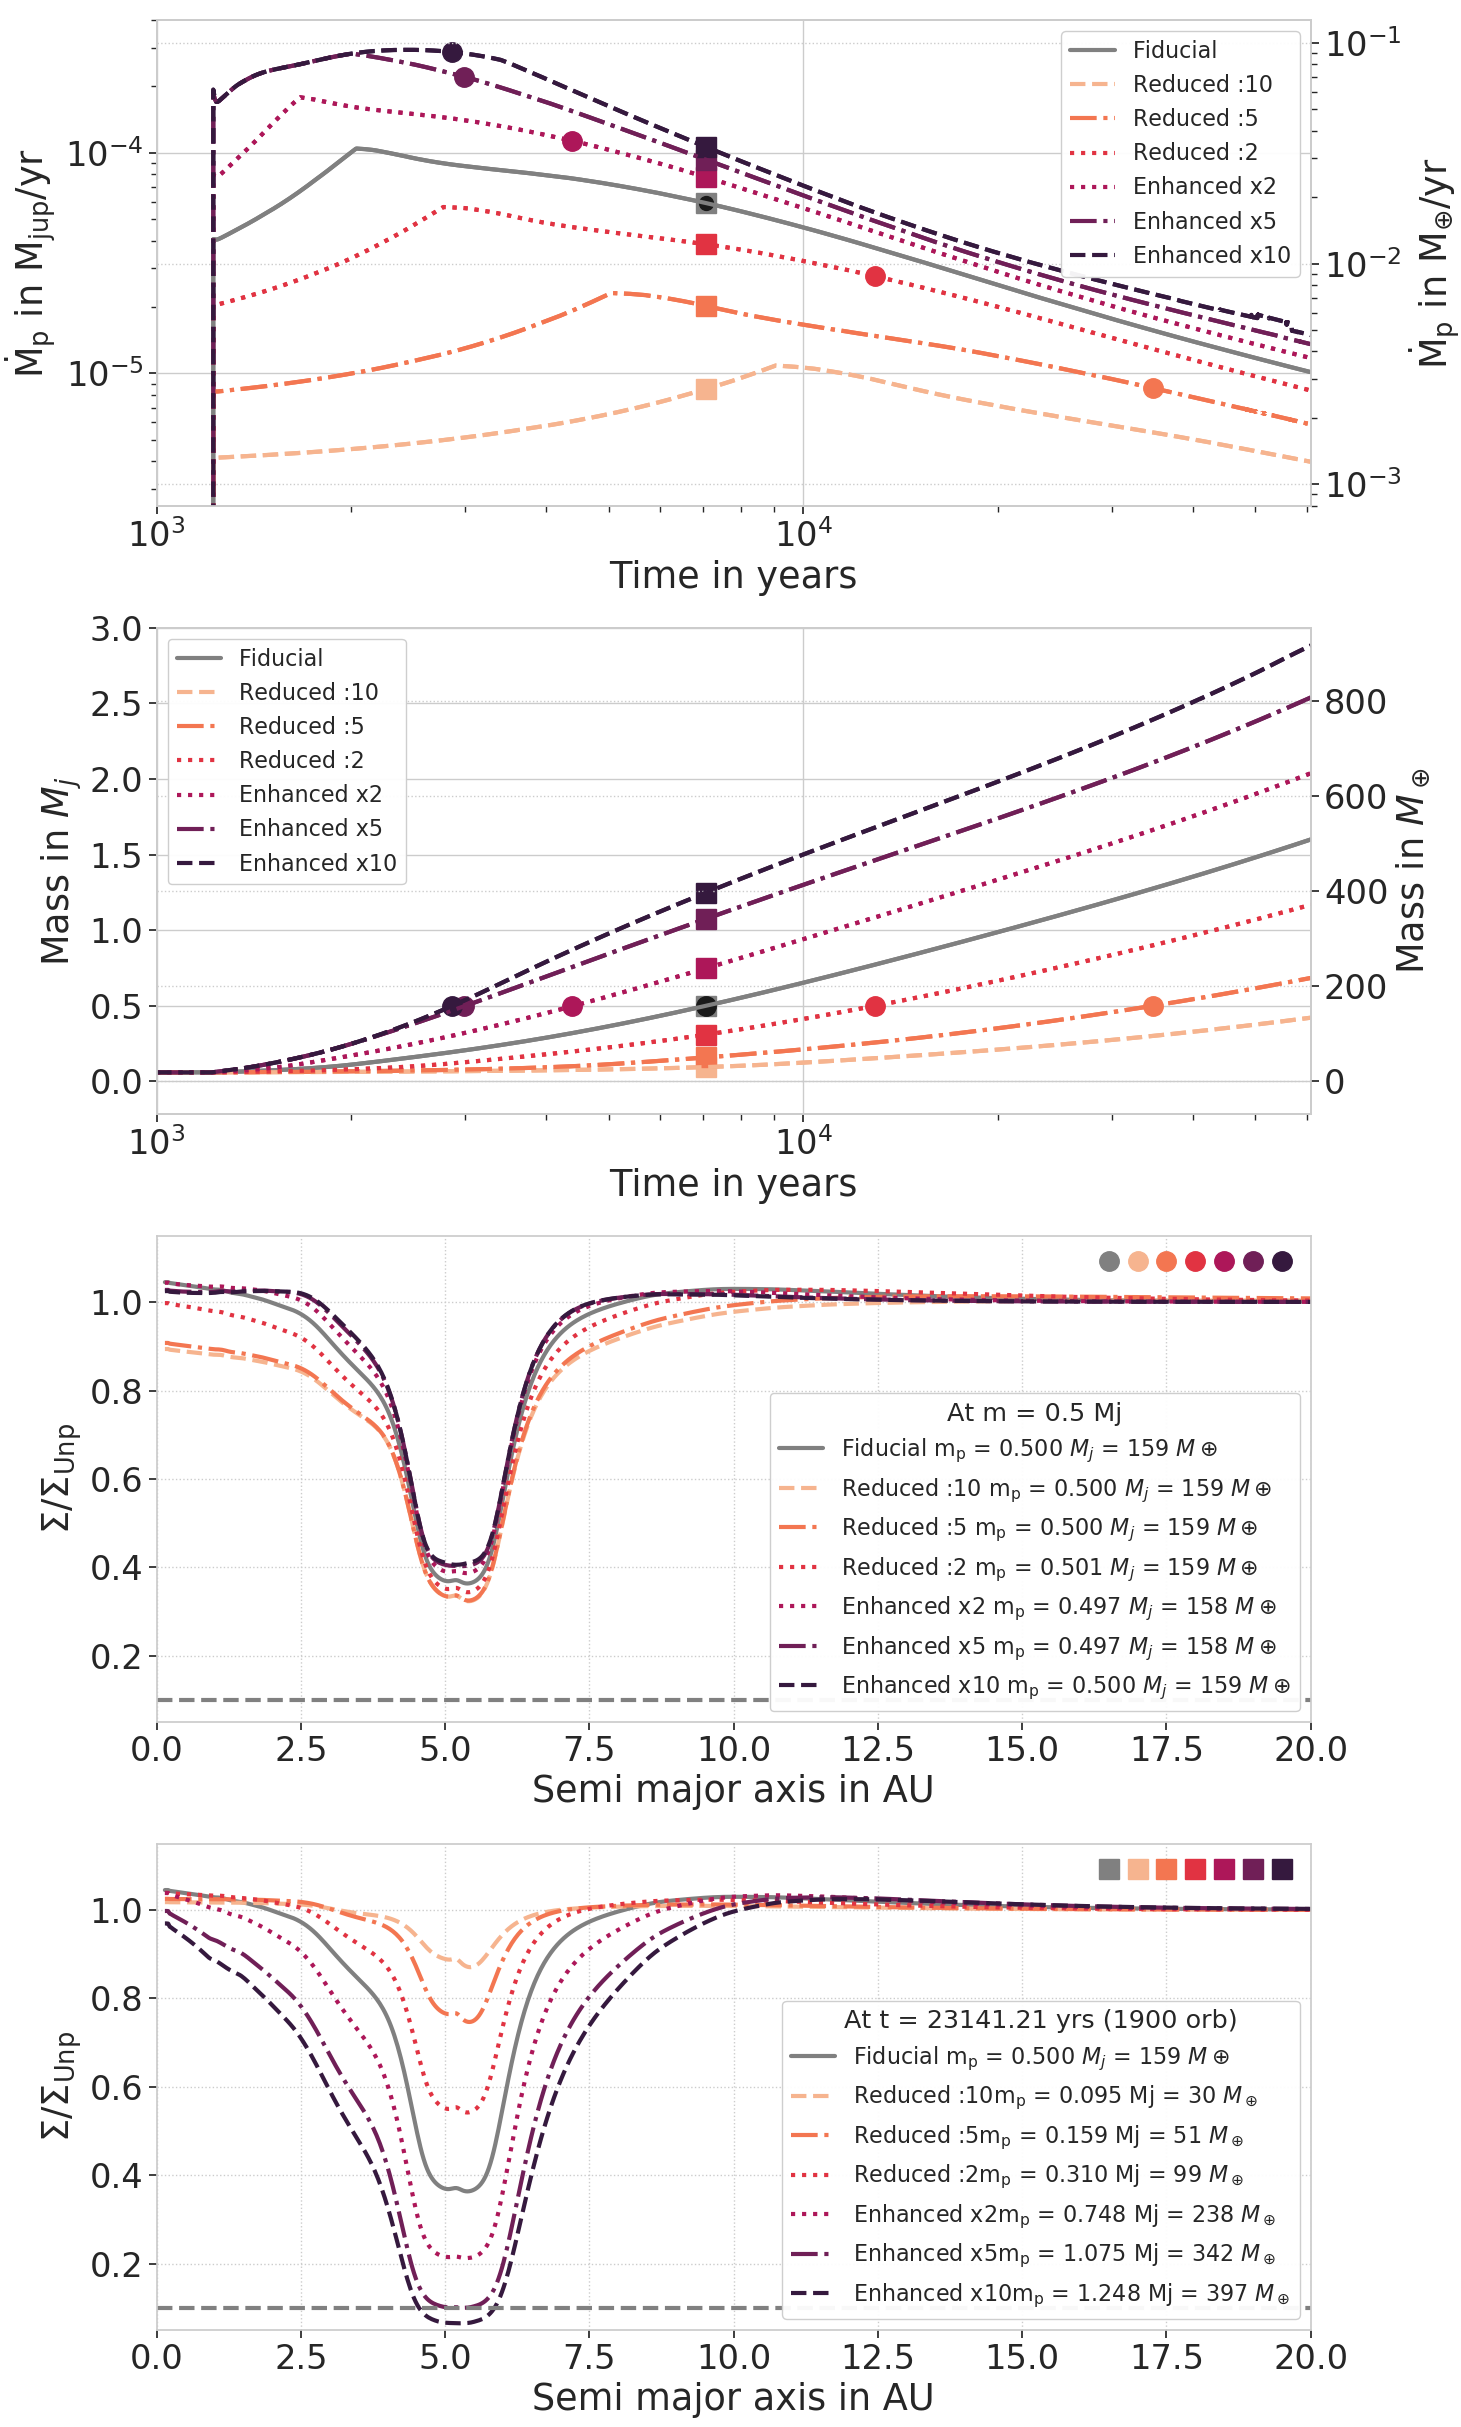
Gas accretion rates onto planets are not very precisely constrained. In the runaway gas-accretion phase accretion, rates range from to (D’Angelo et al., 2003; Ayliffe & Bate, 2009; Machida et al., 2010; Schulik et al., 2019). Recent studies claim that the accretion rates could be even smaller; Lambrechts et al. (2019) found that the mass flux through the envelope is different from the gas accretion rate, therefore, even if the mass flux is on the order of , the gas accretion rate is actually 10 to 100 times smaller. Tanigawa & Tanaka (2016) derived an even smaller accretion rate when accounting for the gap-opening (). In order to reflect this discrepancy, we investigate different accretion rates in this subsection by scaling our nominal Machida accretion rates (Eq.2) by a factor of between 0.1 to 10.
In the top panel of Fig. 4, we show the seven different accretion rates obtained when we scale the Machida accretion rate by a factor of 0.1, 0.2, 0.5, 1, 2, 5, and 10. The darker color represents a higher accretion rate. The maximum of the accretion rate is shifted to later time if the accretion rate is reduced. This maximum is reached when the accretion rate (Eq.2) switches from a regime dominated by the Hill sphere to a regime proportional to 0.14. The critical mass that is needed for this switch in accretion rate is reached at later times for reduced accretion rates.
As gas accretion is limited by what the disc can provide, the accretion rates in the case of an enhancement by 5 and 10 are the same at the beginning of the simulation: they start in the Kley accretion regime (eq. 2). Both simulations switch to the Machida accretion regime and become different after a certain time. This indicates that most of the time the planet is accreting less than what the disc can provide. The values of the accretion rates range from to , corresponding to the different values reported in the literature (D’Angelo et al., 2003; Ayliffe & Bate, 2009; Machida et al., 2010; Tanigawa & Tanaka, 2016; Schulik et al., 2019; Lambrechts et al., 2019). We note, however, that the accretion rates are reduced over time, where at later stages, our measured accretion rates are below . This indicates that the gap-opening process of planets plays a role in setting the accretion rate.
In the second panel, we show the time evolution of the planetary mass in the seven different cases. The biggest planet formed after years is slightly less than , obviously, this is the case of the highest accretion rate. In addition to the assumptions of our simulation setup, time evolution plays a crucial role. A longer integration time would lead to a larger planetary mass. In reality, a planet would also migrate to the inner disc, where the gas surface density is larger and thus the accretion rate could be higher, even if the Hill sphere of the planet shrinks while getting closer to the central star, depending on the surface density profile slope (Crida & Bitsch, 2017).
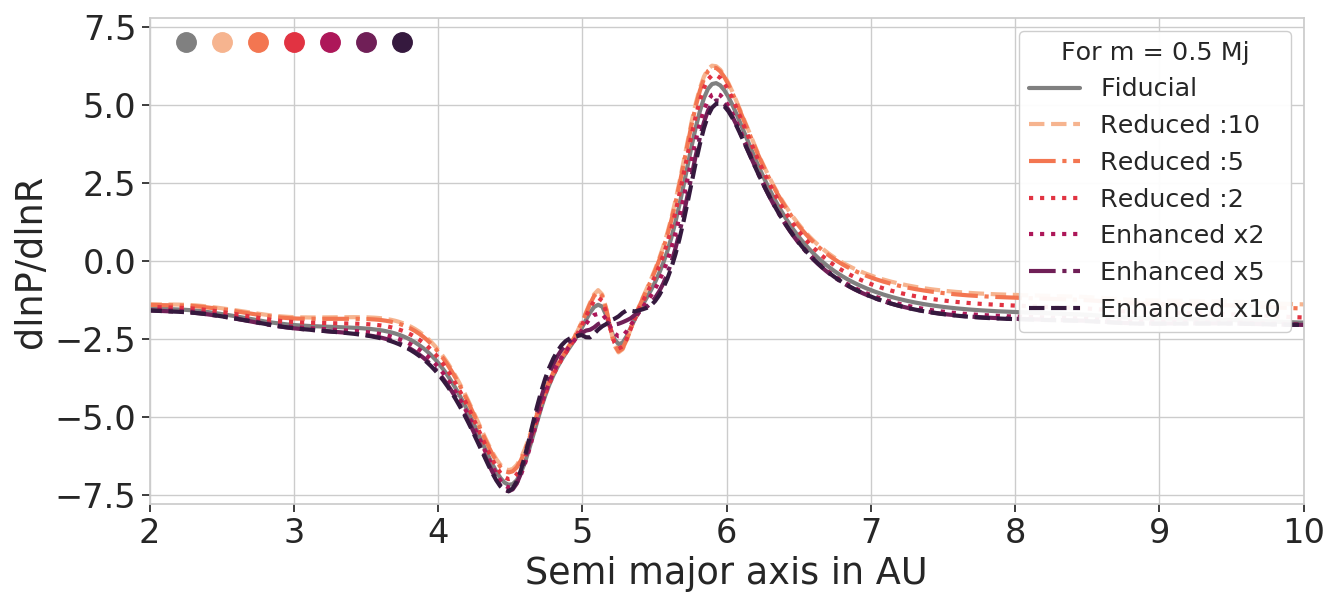
In the third and fourth panels of Fig. 4, we show the azimuthally averaged surface density profiles. We normalized the profiles to the profile of a disc without a planet as explained in Sect. 3.1. This way we compare the actual shape of the gap. For this viscosity and aspect ratio, and , gas accretion seems to have only a small effect on the gap shape, resulting in a slightly deeper gap for the most reduced accretion rate. The difference in gap depth is due to the depletion of the inner disc: for the reduced accretion rate, the planet reaches at a later time, giving time to the inner disc to be depleted via viscous spreading towards the star. We discuss this in more detail in the next section. As the gap shapes are only slightly influenced by gas accretion, one can expect the pressure bumps to be similar, which is shown in Fig. 5. The difference in the disc pressure profiles for planets with different accretion rates are very small, making it indistinguishable via observation, in contrast to migrating planets (Meru et al., 2019; Weber et al., 2019). However, in the next section, we investigate the influence of planetary gas accretion on another observable: gas accretion onto the star.
3.3 Influence on the stellar accretion rate
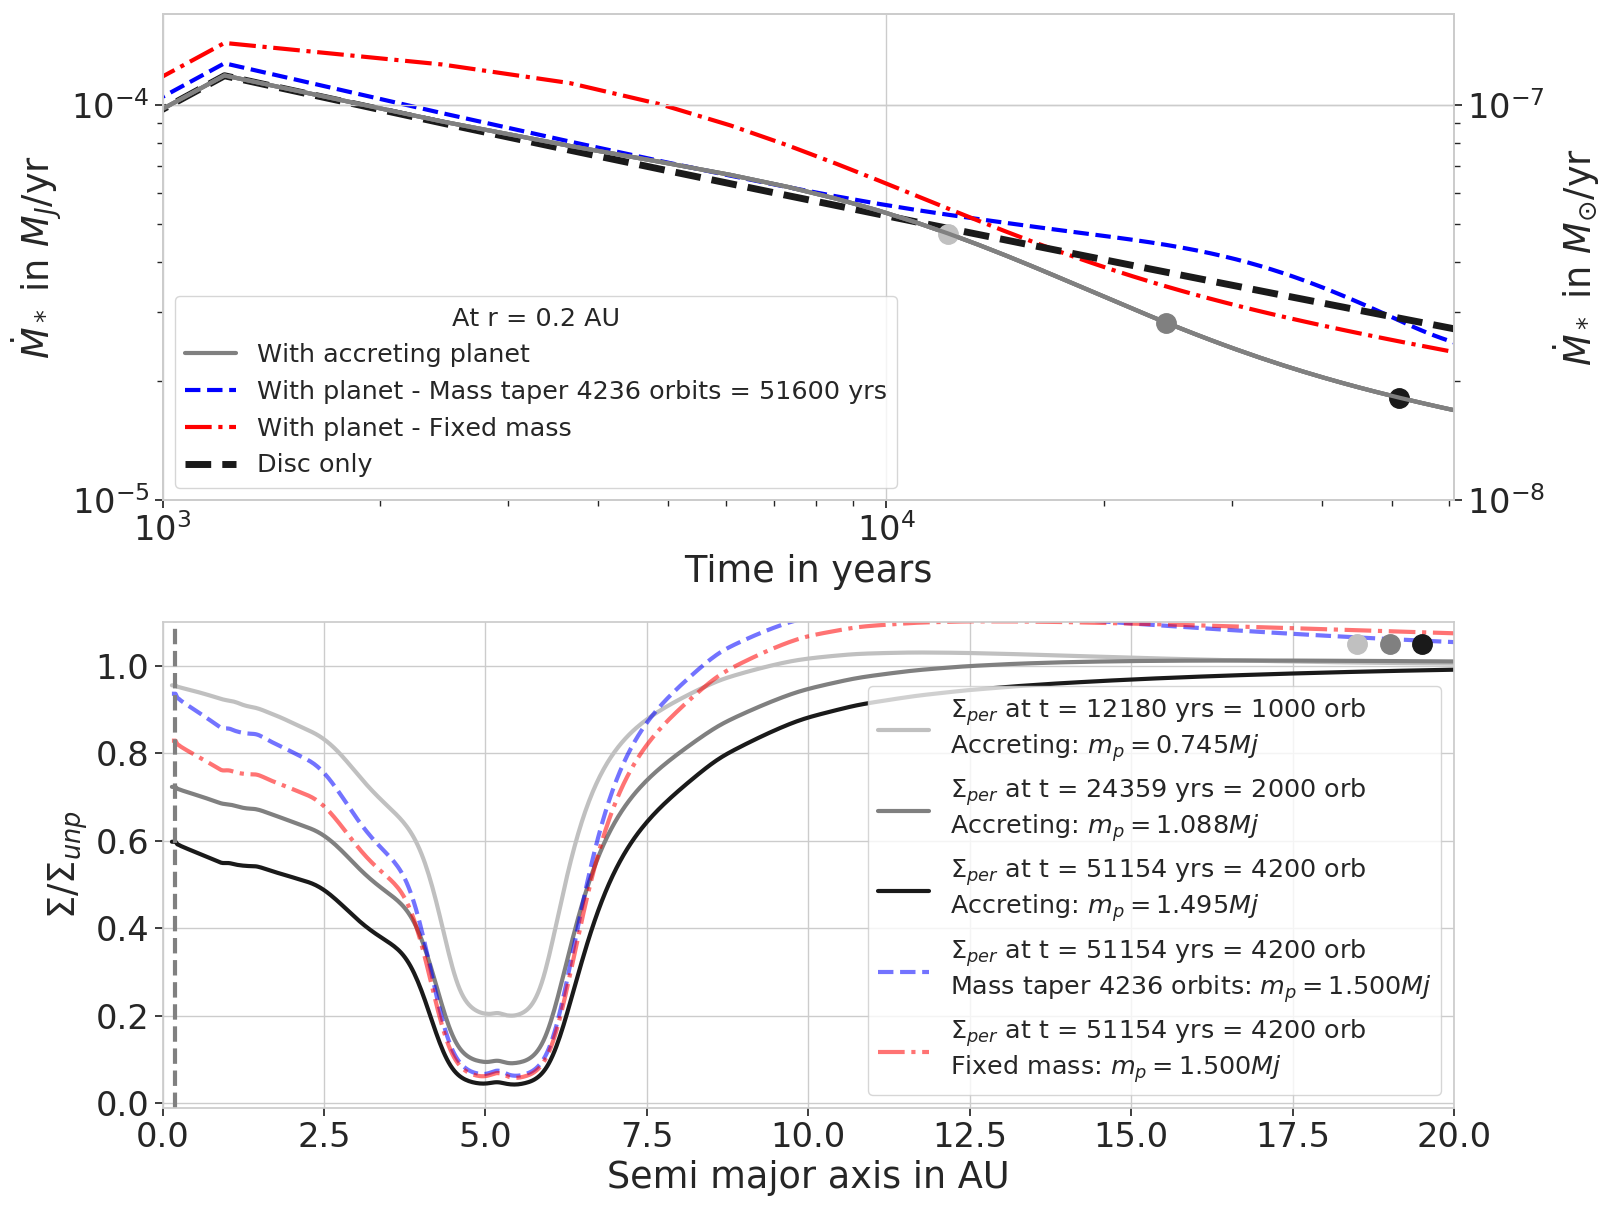
Gas accretion onto the star is an observable feature that can be measured via the UV excess in a star SED (Hartmann et al., 1994; Calvet & Gullbring, 1998). Here, we study the influence that a gas-accreting planet has on stellar gas accretion compared to a disc without a planet. We define the stellar gas accretion rate as the mass flux through the inner boundary of the disc: where AU and and are the radial velocity and surface density at , respectively. We compare in Fig. 6, the stellar gas accretion of a disc with an accreting planet (solid gray line), a fixed-mass planet (dotted dashed red), a mass-tapered planet (dashed blue), and a disc without a planet (bold dashed black). The two non-accreting planets have a mass of , as in Fig. 3, leading to a mass taper of .
At the start of the simulations, only the fixed-mass planet shows a significantly higher stellar accretion rate than the others. This is due to the fact that a massive planet of 1.5 was introduced into the disc in only three orbits. Therefore, the disc is highly perturbed and the planet pushes a significant quantity of material in the inner disc. As , the stellar gas accretion is then enhanced. At the same time, the mass-tapered and accreting planets are slowly growing into the disc, pushing less material to the inner disc at the beginning of the simulation.
Even though Rafikov (2016) showed that spiral arms can drive accretion via depositing angular momentum, these spiral arms are too weak at this location to make a difference. They also showed that such accretion may occur at the end of the lifetime of the disc, as it corresponds to very short accretion timescales. In consequence, the stellar accretion rates for the mass-tapered planet, the fixed-mass planet, and the disc without a planet are all similar.
On the other hand, we see that after years, the accretion rate differs from one simulation to another. First, the fixed-mass planet shows an accretion rate that is slightly lower than the disc without a planet. Even though the gap might prevent some material from reaching the inner disc, there is still a large flow of material through the gap to keep the inner disc from becoming significantly depleted. This can be seen in the middle panel of Fig. 3, where the surface density in the inner disc of the fixed mass case is only slightly affected by the presence of the planet. This is due to the high viscosity of this simulations (). Before the end of the simulation, the stellar accretion rate in the case of the mass-tapered planet becomes slightly higher than the accretion of the disc without a planet. In the top panel of Fig. 3, we see that the mass taper function makes the planet grow rapidly after years, resulting in the same effect as for the fixed-mass planet: as the planet grows rapidly, it pushes a large quantity of material into the inner disc, enhancing the stellar accretion rate, and as the gap profile tends to reach an equilibrium at this stage, it will reach the same flow through the gap as the fixed mass planet.
On the other hand, the presence of the accreting planet decreases the stellar accretion rate. This is due to the fact that the planet, besides accreting material from the outer disc and therefore preventing a large amount of gas to flow through the disc, accretes gas from the inner disc as well. This helps deplete the inner disc quicker than through the viscous accretion naturally present in the disc. The depletion of the inner disc by planetary gas accretion can be seen in the lower panel of Fig. 6, with the surface density profiles of the accreting planet shown at different times: , as is defined to be the surface density of the empty disc. As in Figs. 2 and 3 (middle panels), we also see that the depletion is enhanced by the accretion onto the planet compared to the two non-accreting planets.
However, we notice that the accretion rate onto the planet can be higher than the stellar accretion rate (top panels of Figs. 4 and 7). The planet can accrete more than what the disc can supply only at the very beginning of the simulation as it is emptying its horseshoe region. Then it accretes material from the inner and outer parts of its orbit: this is where planetary accretion is limited to what the disc can provide. The reason the stellar gas accretion rate is smaller than the planetary accretion rate after a longer time is that the stellar accretion rate is measured at the inner edge of the disc (mass flux at r = 0.2 AU), whereas the planet is accreting material from the inner and the outer disc (inside and outside r = 5.2 AU). We compared the stellar flux at a radius located beside the planet (i.e., at 7.5 AU while the planets is located at 5.2 AU) and we observed that the planet’s accretion rate becomes limited by the mass flux at this location after a certain time: the time needed to empty its horseshoe region and a large part of the inner disc. In conclusion, planetary accretion is limited to what the outer disc can provide as the inner disc is depleted by the planet and the viscous accretion towards the star.
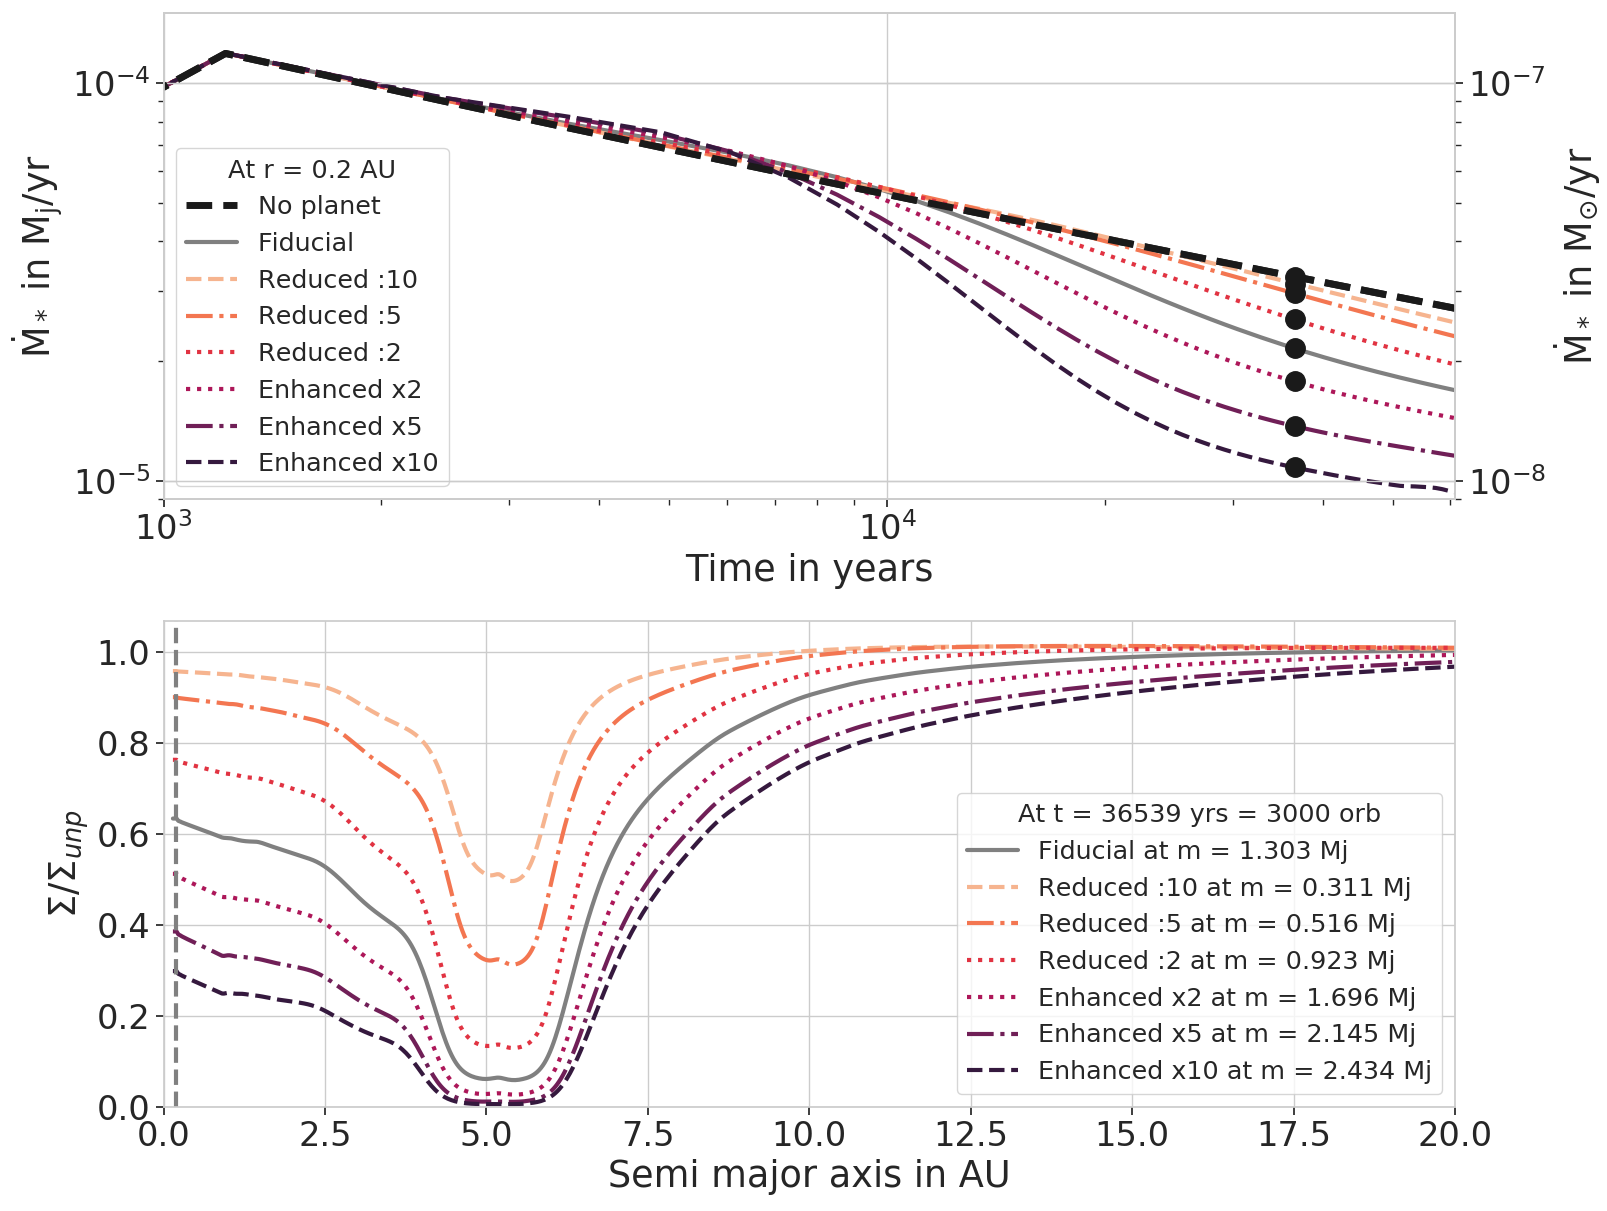
To investigate the influence of planetary gas accretion into the depletion of the inner disc, we show in Fig. 7, the stellar accretion rate for all our enhanced and reduced planetary accretion rates. The top panel shows that larger planetary accretion rates result in lower stellar accretion rates. As the planet accretes more gas, it depletes the inner disc faster, reducing the stellar accretion rate. At orbits, the time shown with the black dots on the top panel, the lowest stellar accretion rate is roughly three times lower than the highest rate. However, the corresponding planetary accretion rates differ by a factor of four (Fig. 4). This means that the stellar accretion does not directly scale with the planetary accretion. This is due to the fact that the depletion of the inner disc also highly depends on the viscosity of the disc. Here, the viscosity is high: with , planetary gas accretion and viscous spreading through the gap act together to deplete the inner disc. Therefore, if the planetary gas accretion rate is not high enough, then the inner disc is replenished by viscously spreading gas, whereas when the planetary accretion rate is high, the inner disc does not have time to be replenished by viscous spreading. In Sect. 4.2, we study the influence of the viscosity on the stellar accretion and discuss its consequences in Sect. 5.1.
In conclusion, at high viscosity, the planetary gas accretion rate has a strong influence on stellar accretion. In the following section, we investigate the influence of two disc parameters: the aspect ratio and the viscosity, which can have an influence on the accretion onto the planet and onto the star.
4 Influence of disc parameters
Disc parameters have a strong impact on how a planet carves a gap (Lin & Papaloizou, 1986; Crida et al., 2006; Fung et al., 2014; Kanagawa et al., 2015). Therefore, we can expect them to have a strong influence on gas accretion as well. Here, we study the influence of the aspect ratio and the viscosity on the planetary gas accretion rate before studying the influence on the gap-opening mass. Finally, as migration depends on the disc parameters too, we investigate how planetary gas accretion can alter the migration of outer planets in the disc by studying migration maps.
4.1 Different aspect ratios
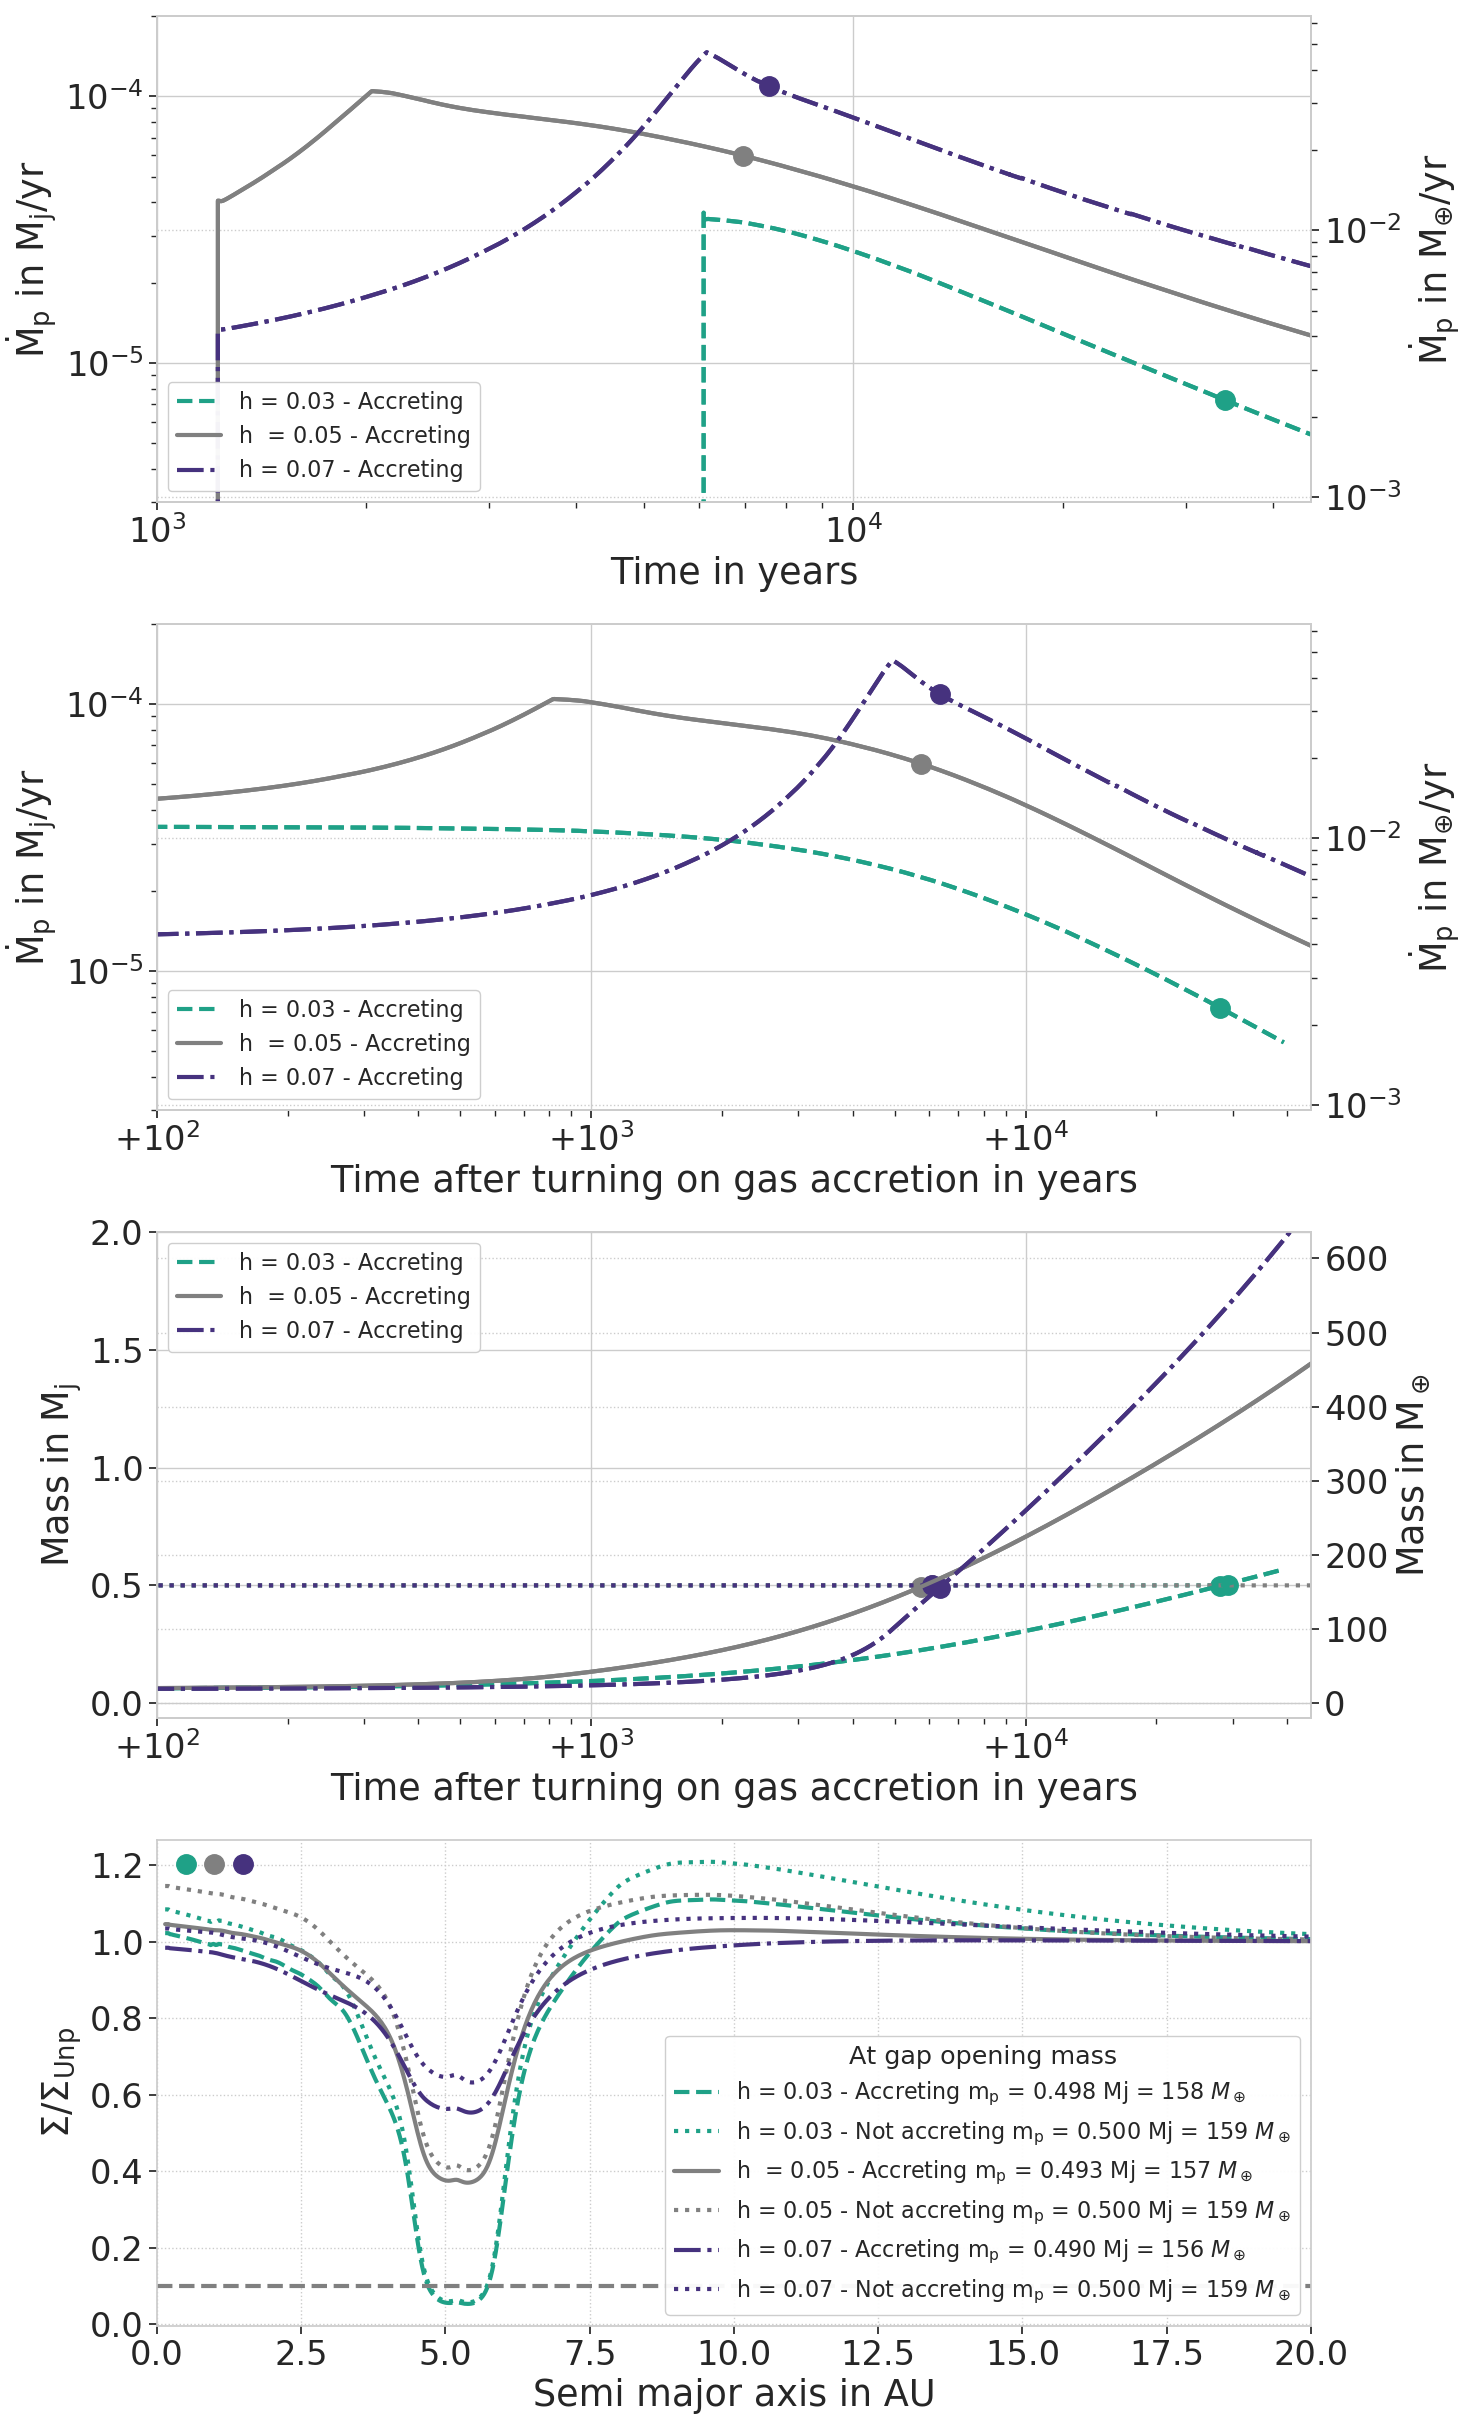
The aspect ratio of the disc impacts accretion in two ways. The first is related to gas accretion (Eq. 2), which is, to some extent, proportional to . At the beginning of the simulation, the planet remains in this regime until the Hill sphere reaches 2/3 of the disc scale height and then switches to the regime where . In Machida et al. (2010), the different regimes are explained by the switch from a regime regulated by Bondi accretion to a regime governed by Hill accretion. This switch is visible in our work in the time evolution of the gas accretion rates in Figs. 4, 6, 8, and 9. The aspect ratio has a direct influence on the mass at which the switch occurs. In top panels of Fig. 8, we show the resulting planetary accretion rates for different aspect ratios, with and . As the aspect ratio increases, the switch occurs at higher masses and therefore at later time. For , the simulation directly starts in the regime (Eq. 2) as the mass at which is smaller than our initial mass of ().
We show in the lower panel of Fig. 8, the perturbed gas surface density profiles for the different aspect ratios and compare accreting planets with planets that have a fixed planetary mass of . Gas accretion has a different impact on the gas surface density profile depending on the aspect ratio. For , the gap is deeper with accretion than without accretion. For , we find back the same result from Sect. 3.1, where gas accretion has only a slight impact on the gap depth. Finally, for , the planet has reached its gap-opening mass, which shows a similar-looking for both the accreting and non-accreting cases. Comparing a planet with a fixed mass of for (below the gap opening mass defined by Crida et al. 2006) with an accreting planet of the same mass (not shown) reveals a deeper gap in the case of the fixed mass planet. Our results show three different behaviors depending on the aspect ratio: 1) gas accretion helps creating a deeper gap (large h); 2) it has almost no impact (); or 3) it prevents the creation of a deeper gap (low h). These three behaviors are explained in Sect. 4.3, where we explore the impact of gas accretion on the gap-opening mass. In the case of a low aspect ratio, one should note that a mass planet already creates a deep gap at low viscosities. We chose to keep this initial mass in this section in order to compare it with the higher aspect ratios as the comparison is made at high viscosity. However, we reduce the initial mass down to in Sect. 4.3 to study the impact on the gap-opening mass as a function of the disc parameters.
As the accretion rates are very different from one aspect ratio to the other, the planet masses are diverse as well. The middle panel of Fig. 8 shows that a later switch in accretion rates results in more massive planets. As a result, our simulations indicate that planetary gas accretion is more efficient in hotter discs. As it is harder to create a deep gap in hotter discs, the surface density at the location of the planet is larger (lower panel of figure 8) and allows for a more efficient planetary gas accretion. On the other hand, if the disc is hotter, it is harder for a planet to reach the pebble isolation mass (Lambrechts et al., 2014; Bitsch et al., 2018; Ataiee et al., 2018), where the planet generates a small pressure bump exterior to its orbit preventing solid accretion. In addition, if the disc is hotter, it is more difficult to accrete pebbles efficiently because they are less concentrated in the disc’s midplane (Youdin & Lithwick, 2007), resulting in a less efficient formation of planetary cores (Ndugu et al., 2018). Therefore, it is easier to form giant planets via runaway gas accretion when their core is already formed but it is harder to initially form these cores in hotter discs.
| Parameters | in orbits | ||
|---|---|---|---|
| 0.7414 | 500 | ||
| 0.9823 | 100 | ||
| 0.9678 | 100 | ||
| 0.7317 | 900 | ||
| 0.2949 | 3300 | ||
| 0.9953 | 100 | ||
| 0.9923 | 100 | ||
| 0.9644 | 300 | ||
| 0.7795 | 1700 | ||
| 0.8912 | 300 | ||
| 0.4859 | 1300 | ||
| 0.3408 | 1900 |
4.2 Different viscosities
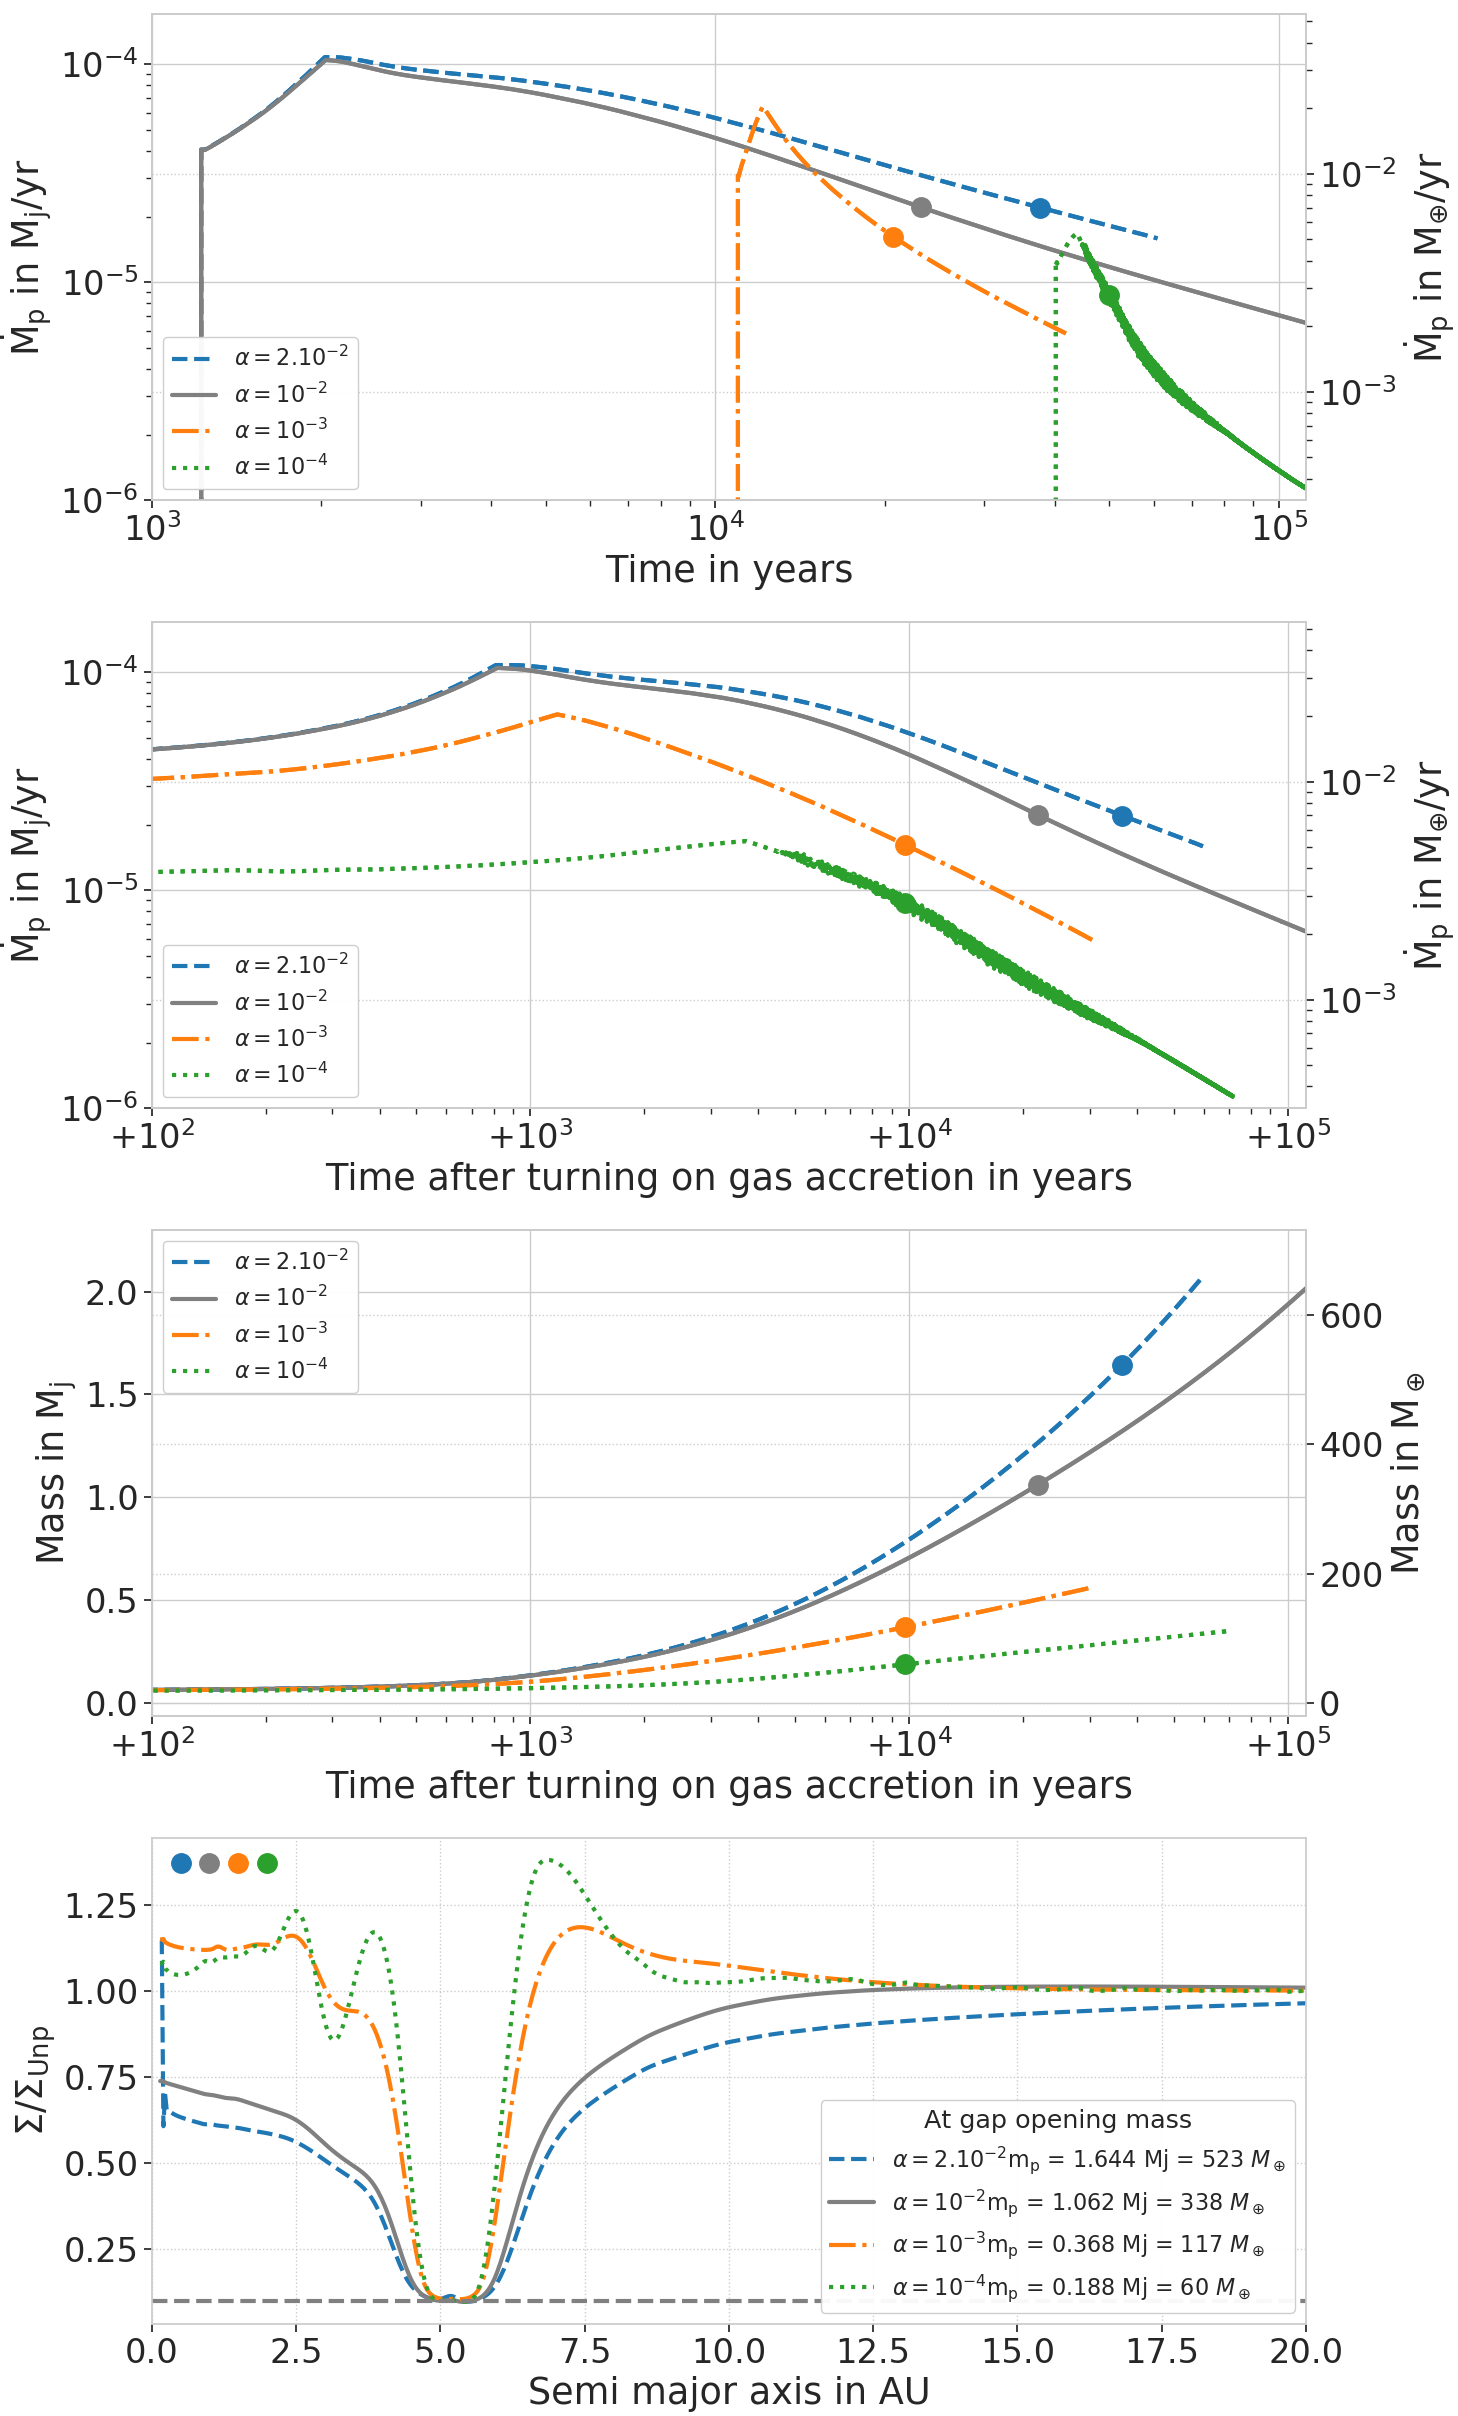
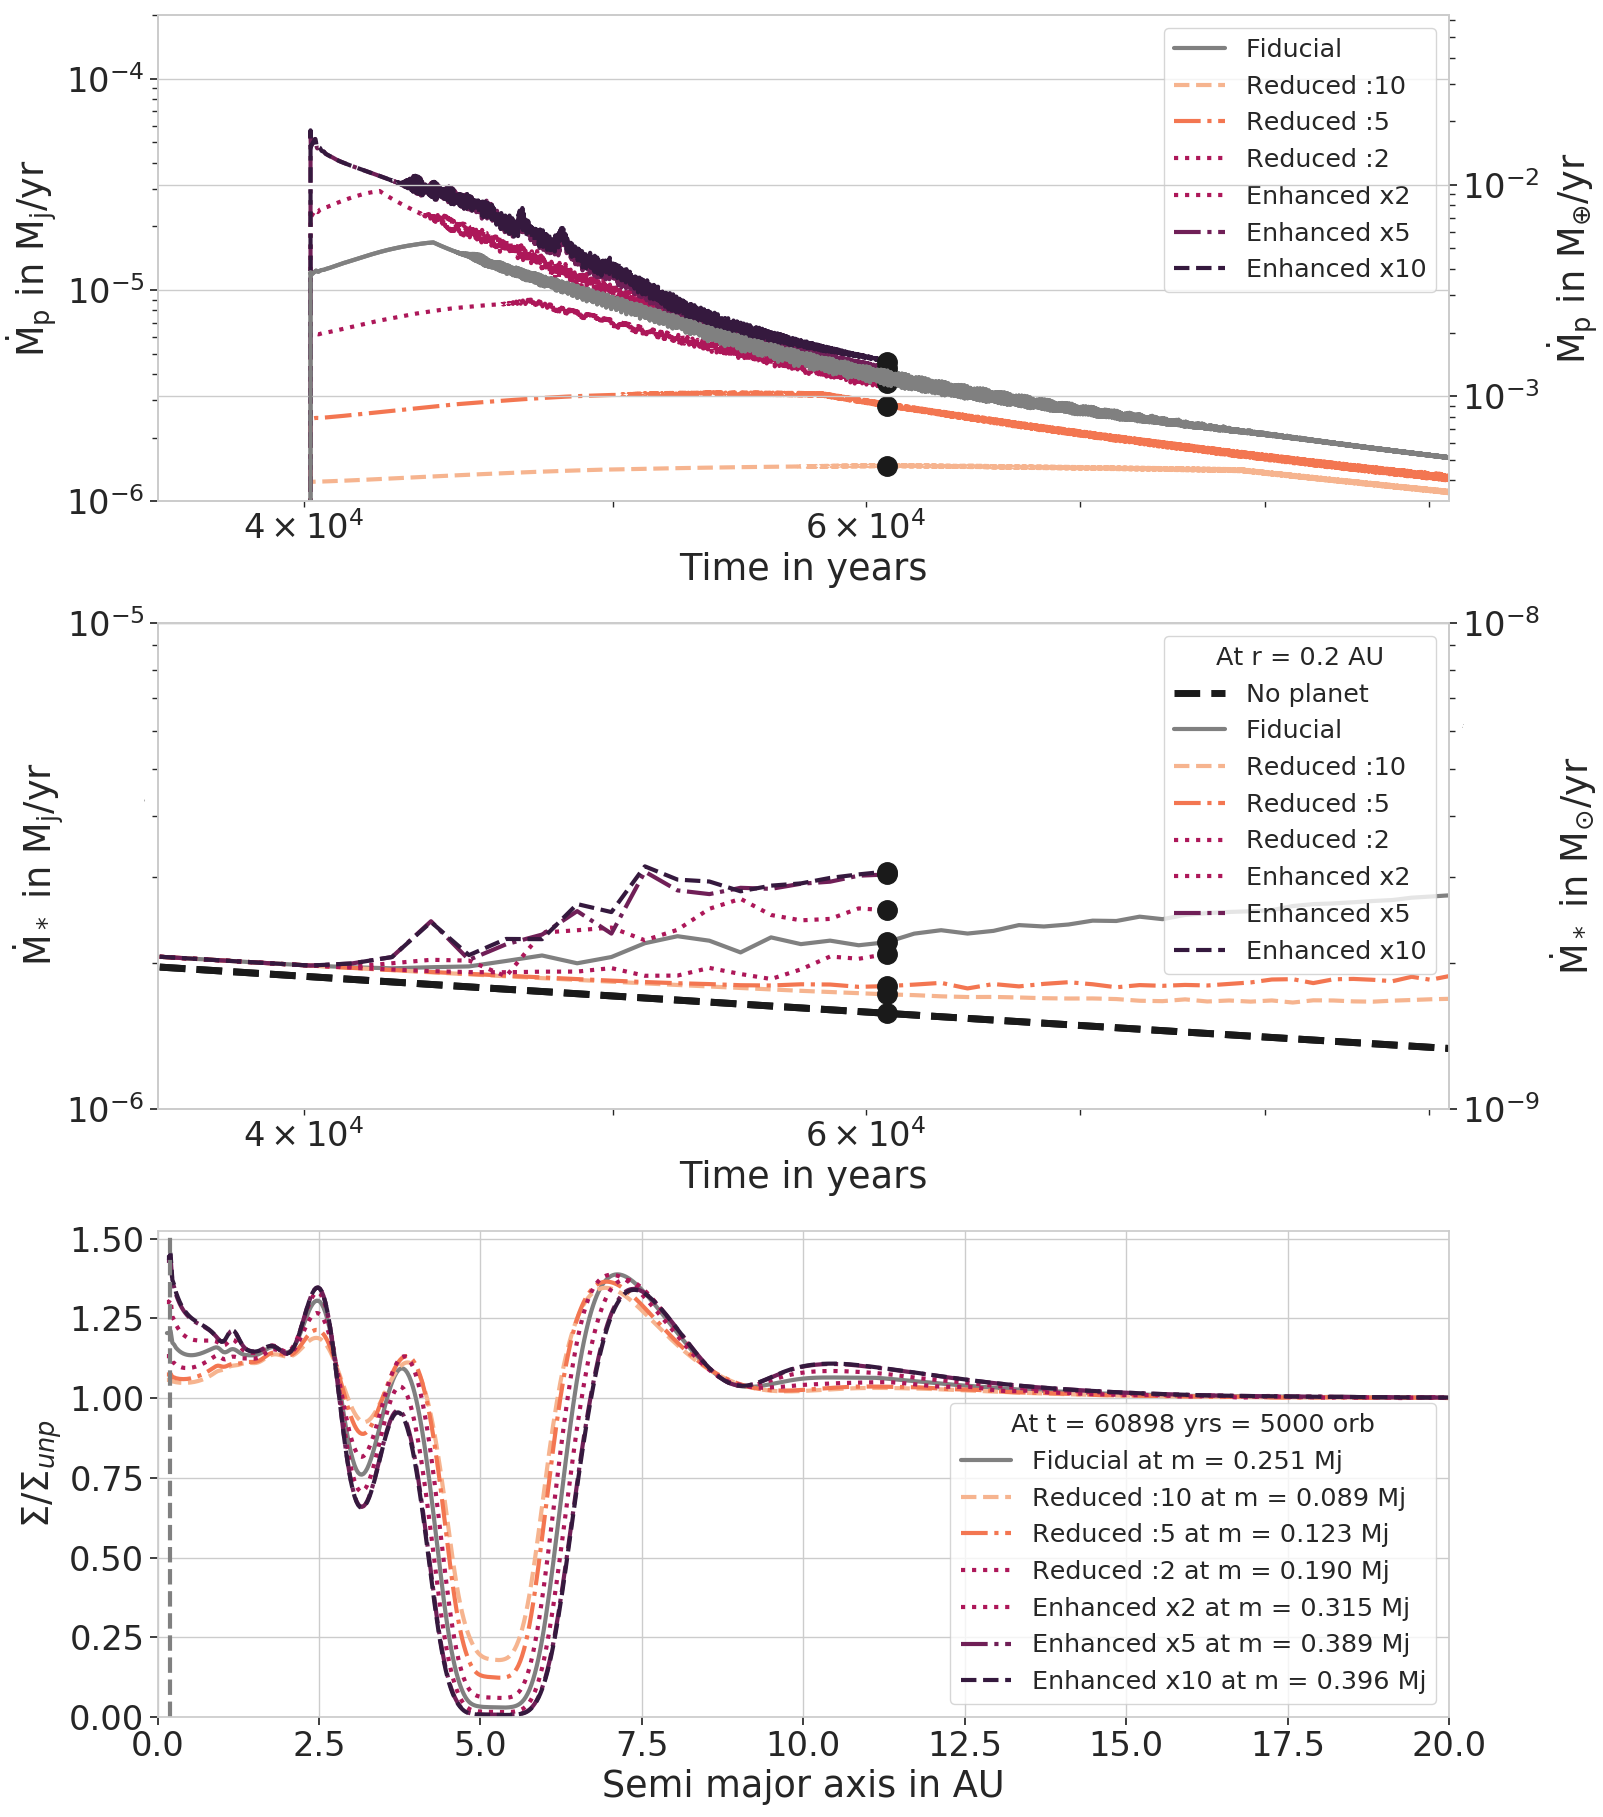
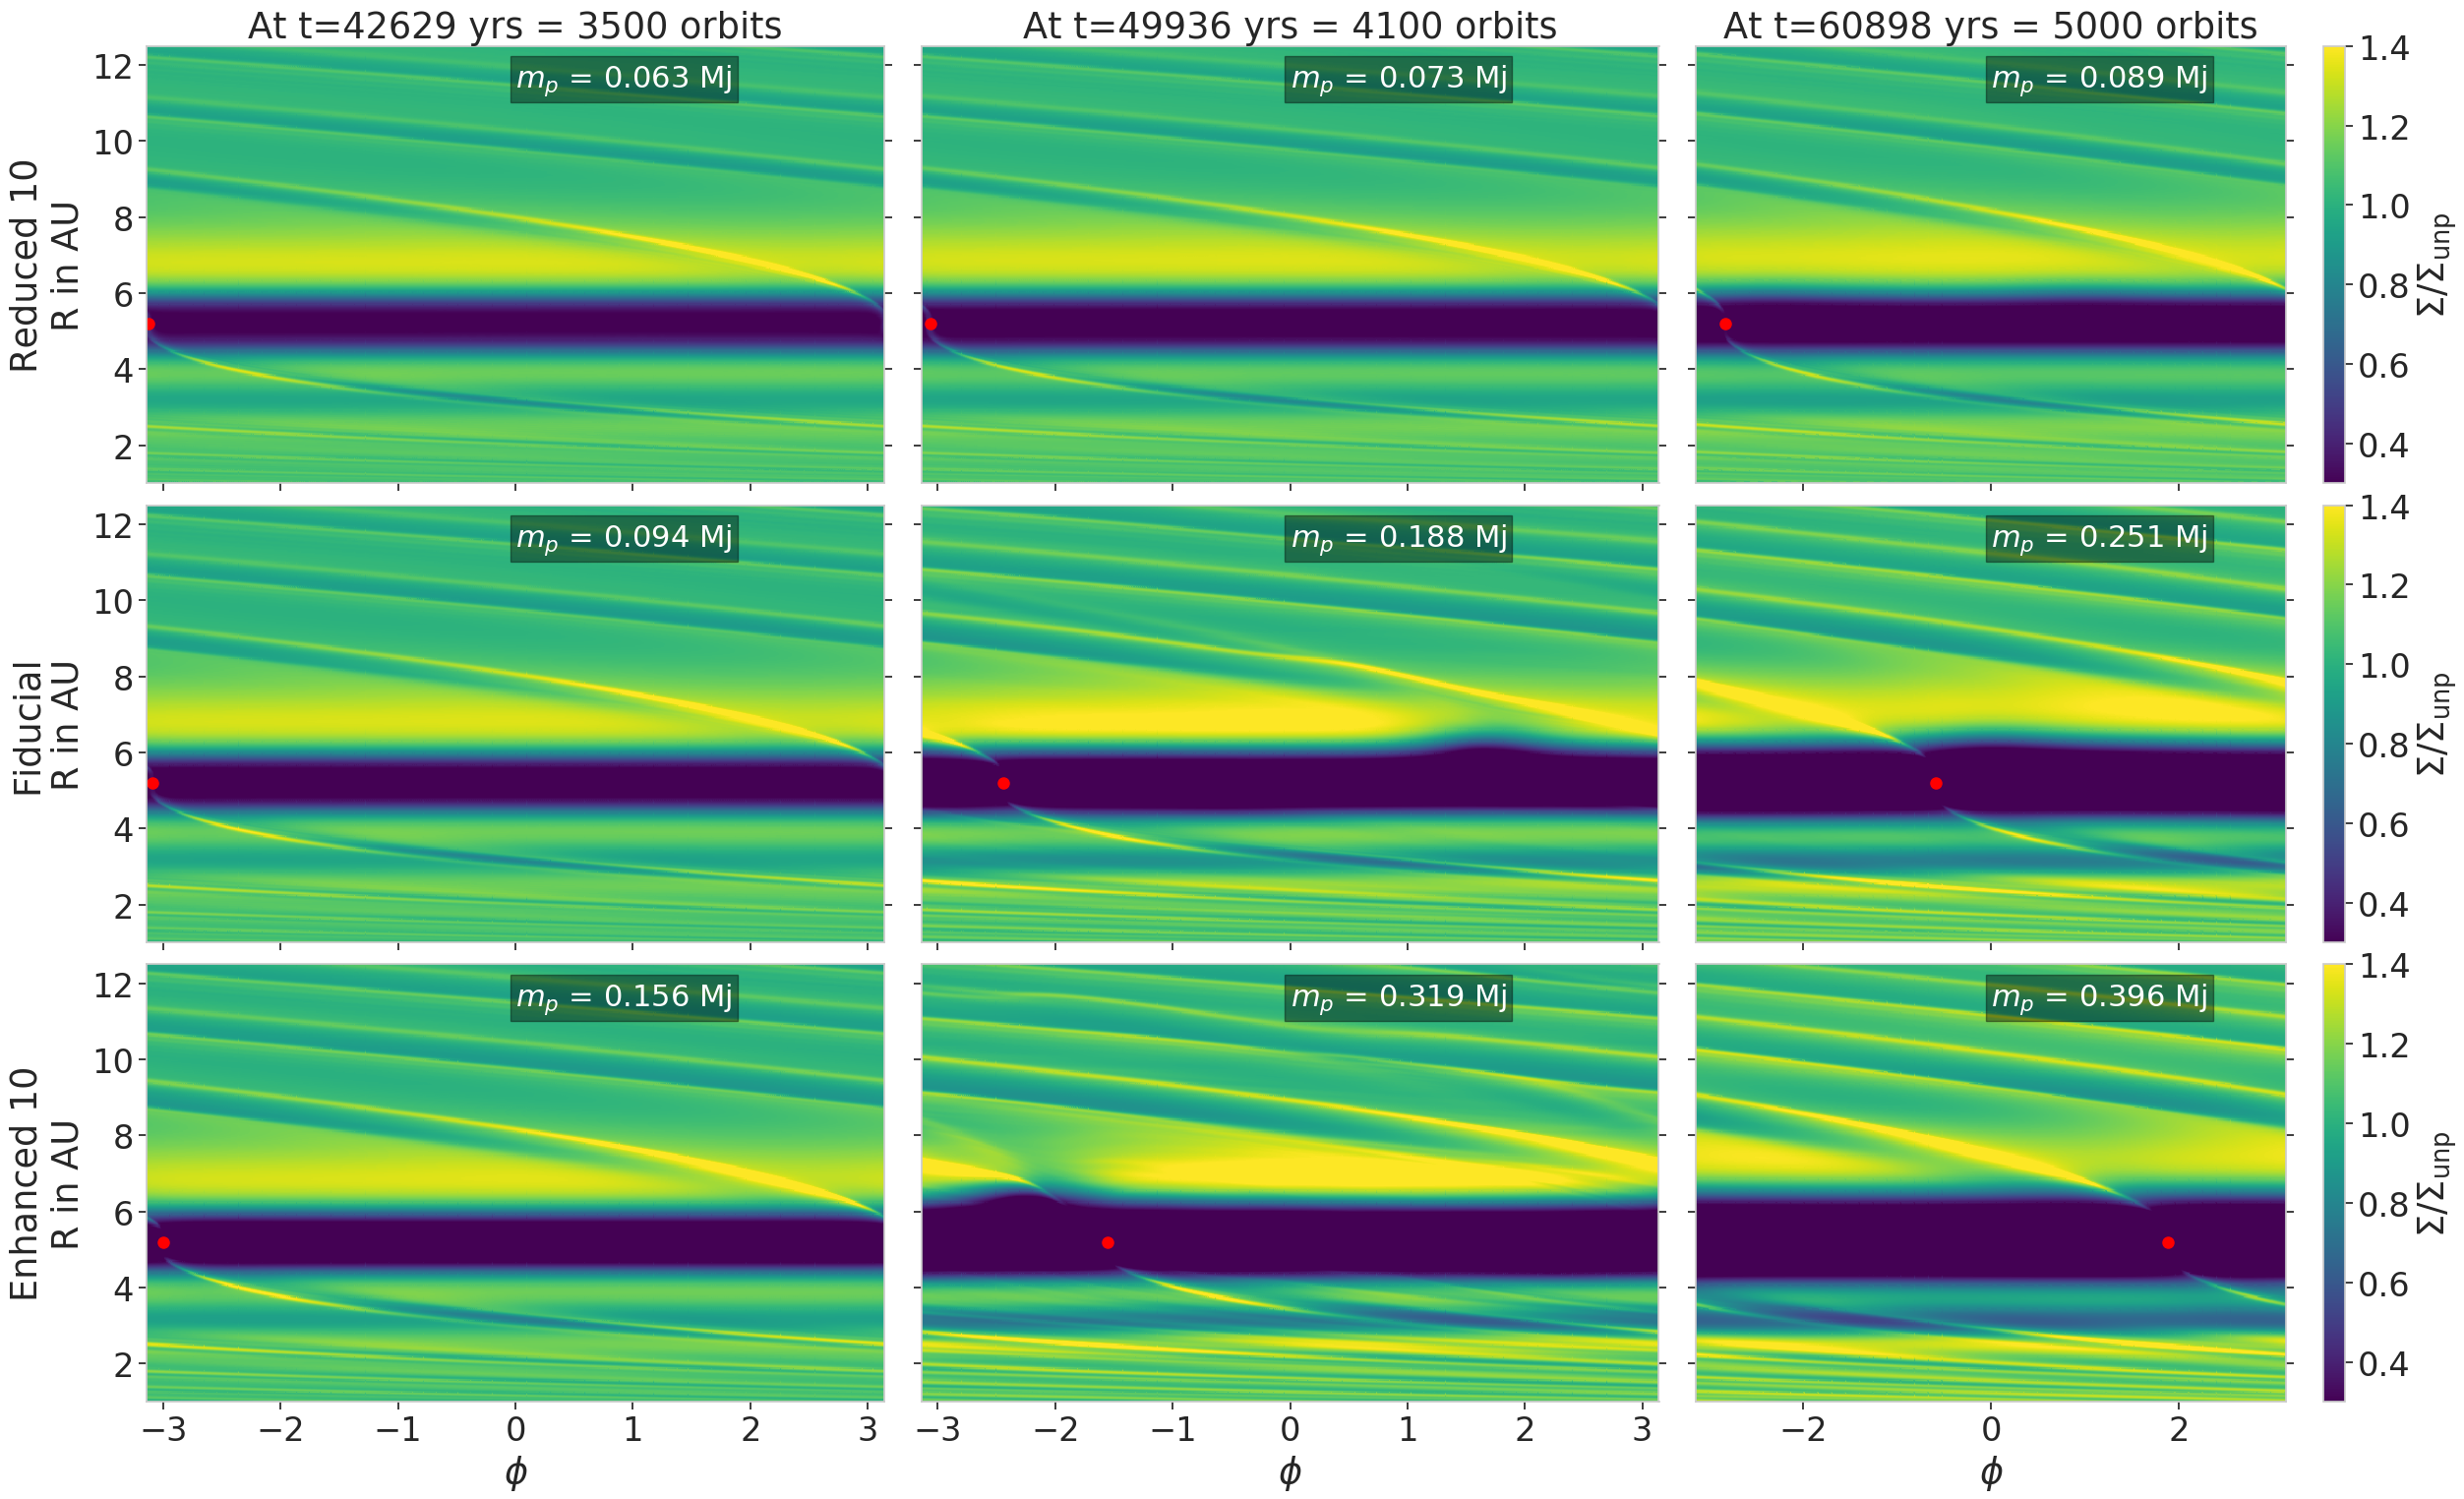
Another important disc parameter is the viscosity of the disc, which determines how a planet opens a gap (Crida et al., 2006; Fung et al., 2014; Kanagawa et al., 2015) and dictates how gas flows in the vicinity of the planet. Both have a strong impact on gas accretion. In order to determine the influence of viscosity, we run five different simulations with the following alpha parameters: , , and (Table 1). As mentioned in Sect. 2.1, we need to wait until the initial mass of creates a steady gap, defined as a change of less than of the gap depth within 100 planetary orbits. This waiting time is dependent on the disc parameters and is summarized in Table 2.
We can expect the planetary accretion rate to decrease with decreasing viscosity because viscosity dictates how fast gas removed by accretion can be replenished from the viscously spreading disc. This behavior can be seen on the top panels of Fig 9: in the first panel, the gas accretion rates are plotted as a function of time. We can see that at lower viscosities, the initial mass needs a longer time to reach a steady gap. This means that at lower viscosity, gas accretion starts later. In the second panel the accretion rates are shifted so that they are plotted as a function of the time after gas accretion is turned on. The accretion rates plotted here show that a lower viscosity results in a lower planetary accretion rate.
At low viscosity, instabilities in the disc are generated (Klahr & Bodenheimer, 2003; Fu et al., 2014), resulting in a threshold value for the gas surface density in the vicinity of the planet. If this threshold exists, we would expect a limit of the planetary accretion rate as well. However, in order to resolve these instabilities adequately, high-resolution simulations are needed, which are computationally very expensive. Thus we limit our study to .
For , Rossby wave instability is triggered (Lovelace et al., 1999; Li et al., 2001). This instability generates vortices at the location of steep density gradients. Such steep gradients are induced by planetary gaps formed at low viscosity (Hammer et al., 2017; Pierens et al., 2019), as we can see on the radial density profiles in the lower panel of Fig. 9. Vortices will modify the flow of material into the gap, changing the amount of gas available for accretion by the planet. Such impact can be seen in the accretion rates. In the top panel of Fig. 9, for , the accretion rate is oscillating due to the presence of a vortex at the outer edge of the gap. We show in Fig. 11, the 2D () surface densities at three different times. The fiducial case is plotted in the middle row. The asymmetrical overdensity (in yellow) located at the outer edge of the gap is characteristic of the presence of the vortex. At later times, the vortex vanishes. In the fiducial case, it completely vanishes after years, inhibiting the oscillations in the accretion rate (top panel of Fig. 9).
As the presence of vortices is linked to the steepness of the density gradient, the characteristics of the created vortices depend on how fast the planet grows and creates its gap. Hammer et al. (2017) find that a slowly growing planet will create a weak vortex at the outer edge of the planet gap. We find a similar result when we apply our different accretion rates to simulations with . In Fig. 11 we show the 2D surface density snapshots for three different accretion rates (reduced by 10, fiducial, and enhanced by 10 – from top to bottom) at three different times. The overdensity characteristic of the vortex evolves differently whether the planet is accreting quickly or not. We can see that the created vortex at the outer edge of the gap is stronger when the planet features a higher gas accretion rate. As stated previously, we expect to see oscillations in the gas accretion rate, with higher oscillations for the enhanced case as the vortex that is created is stronger.
In the top panel of Fig. 10, we show the accretion rates reached with the enhanced and reduced accretion rates presented in Sect. 3.2 for . As in the fiducial case, all accretion rates show oscillations, with different amplitudes and duration times. As expected, larger accretion rates result in stronger oscillations. The small increase that can be seen on the time evolution of the enhanced accretion rates from years to years, is also due to the presence of vortices. It corresponds to the moment when the vortices are the strongest. Once they vanish after years, the oscillations in the accretion rates vanish too. Our results are, therefore, in agreement with Hammer et al. (2017), with the vortices pushing material into the vicinity of the planet and their presence demonstrating a link to an enhancement in the gas accretion rate.
The presence of these vortices has a strong impact on the density profiles of the disc. The large viscous timescale at low viscosity results in a long period of time for the disc to adjust to the presence of the planet, resulting in an highly perturbed disc structure. The perturbed density profiles are shown in the lower panel of Fig. 10. Perturbations are particularly high in the inner disc. This has a strong influence on the stellar accretion, shown on the middle panel of Fig. 10. Compared to what we describe in Sect. 3.3, the scaling of the stellar accretion with the planetary accretion is reversed here: a more efficiently accreting planet results in a larger stellar accretion rate. We expect this effect to flip at later time, when the inner disc gets depleted by the viscosity: the viscous time at is 100 times longer than for , requiring for material to move from the position of the planet to the inner disc, which is too long for computational integration. Therefore, the depletion of the inner disc is less affected by smaller viscosities: instead the inner disc is mostly influenced by the presence of the growing planet. Larger planets induce larger perturbations: the enhancement 111We note that we plot the perturbed surface density, therefore the ”bump” shown here is not present in the actual gas surface density profile. This enhancement in density is caused by the growing planet that pushes material from its orbit. created by the planet in the inner disc, at AU as shown in the lower panel of Fig. 10, is larger for the largest planet, that is, in the case of enhancement by 10. The presence of this enhancement at the inner disc is the reason the stellar accretion is higher compared to the disc without a planet. As soon as the disc starts to deplete its inner disc via viscous spreading, the accretion rate onto the star behaves as displayed in Fig. 7, where we observe a higher decrease in stellar accretion rate with quickly accreting planets. This behavior was confirmed by investigating the evolution of the stellar accretion rate for an intermediate viscosity: for (not shown), the stellar accretion rate is larger compared to a disc without a planet at the beginning of the simulation, but it then becomes smaller when the inner disc starts to deplete via viscous spreading.
Viscosity has an impact on how the planet will open a gap, as can be seen on the lower panel of Fig. 9: depending on the viscosity, a gap is opened at a different mass and the gap has a different shape. In the next section, we investigate the impact of gas accretion on the gap-opening mass.
4.3 Gap-opening mass
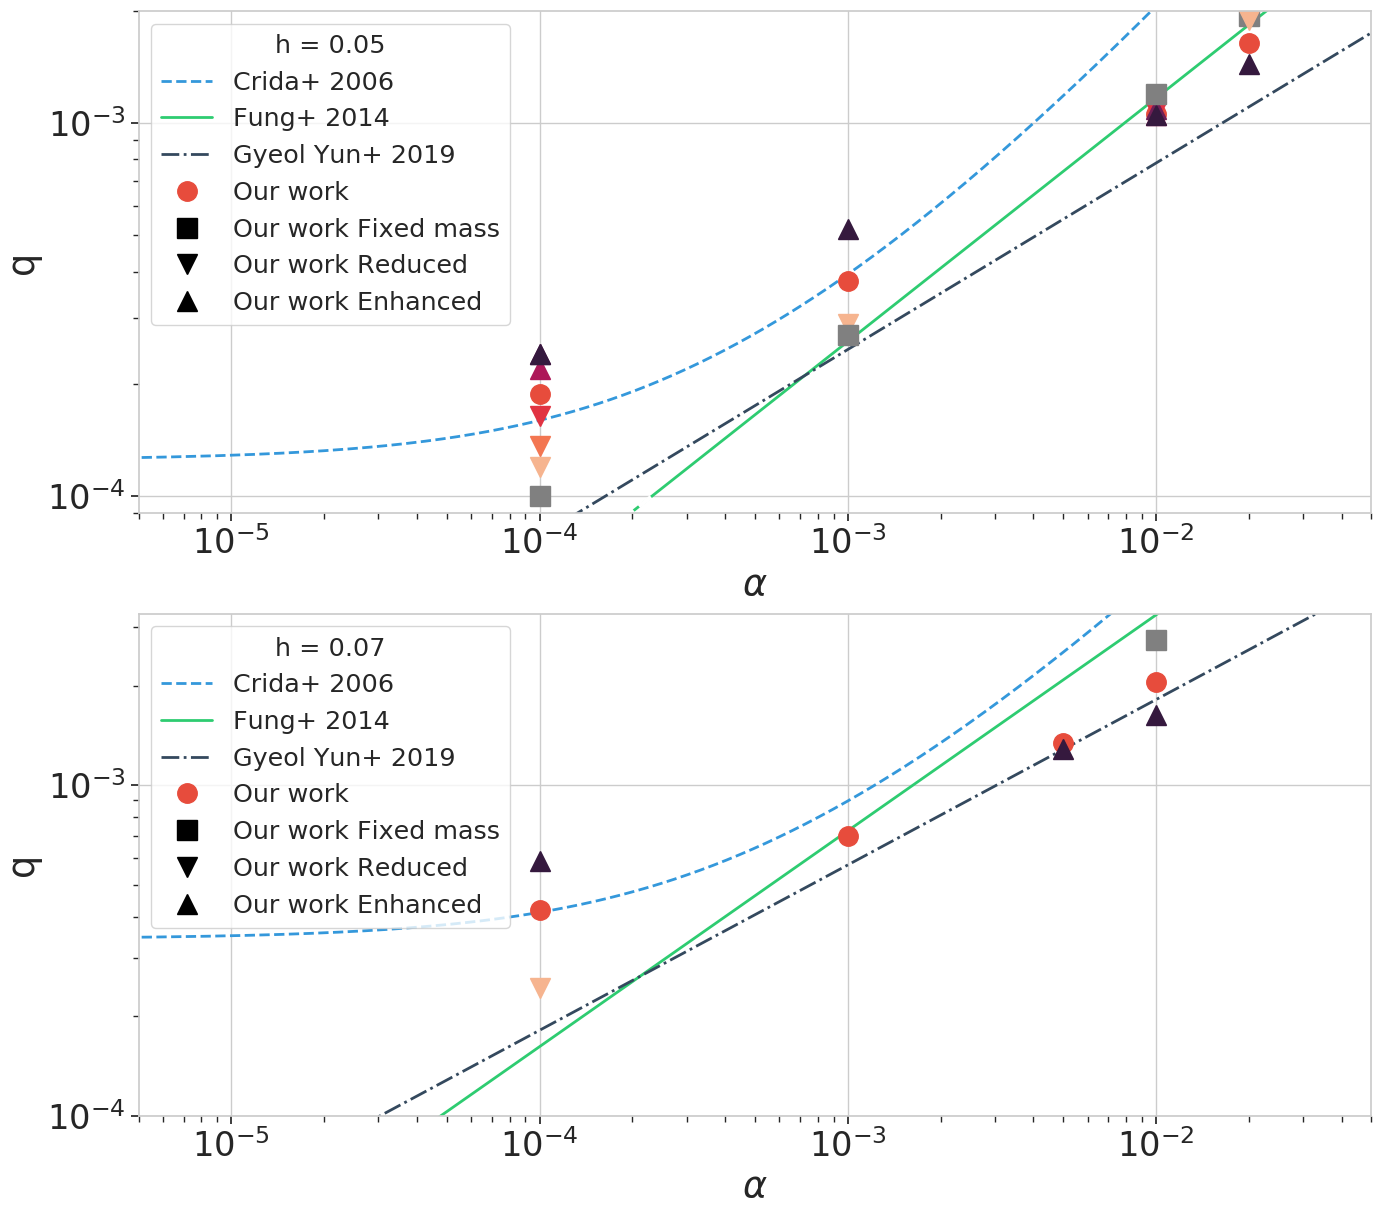
The criteria for gap-opening mass have been derived in several previous studies. In Crida et al. (2006), they defined the gap-opening mass as the mass at which , which we also use in our work. The derived gap-opening criterion depends on the aspect ratio and viscosity:
| (4) |
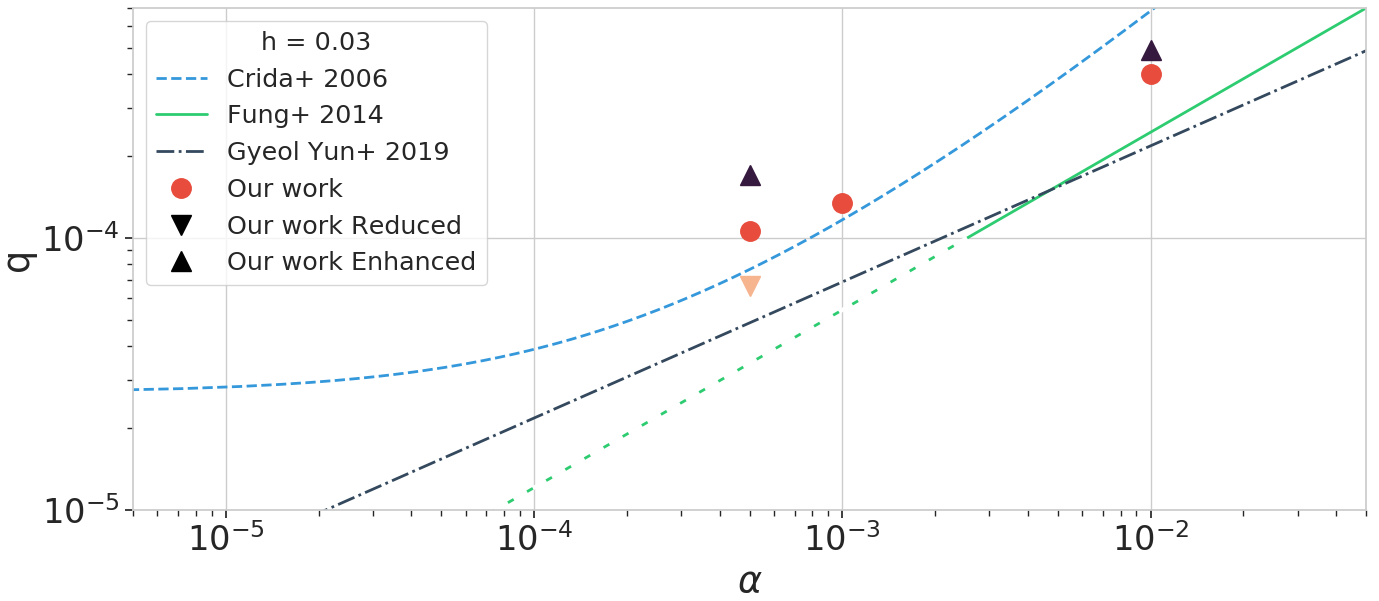
where q is the planet to star mass ratio and a planet opens a gap when . This criterion has been tested for viscosities of and aspect ratios of by Crida et al. (2006). Here we focus on the gap-opening mass, that is, the mass at which q we satisfy as a function of the viscosity and aspect ratio. We plot this formula in the q- space in Figs. 12 and 13 for the three different aspect ratios studied in this work.
In other studies, equations for were derived. In Kanagawa et al. (2015), the depth of the gap is given as:
| (5) |
where . This criterion is valid for . For the mass range given on each axis, this gives a validity range from to for and from to for , which is, therefore, valid for the low viscosities given here. This was derived for a uniform disk, meaning that the initial surface density was constant in radial direction. Gyeol Yun et al. (2019) added a correction to this work by studying gap opening in a non-uniform disk, having a power law initial surface density profile with an exponential cutoff. They found a very similar result as that found by Kanagawa et al. (2015), with . To be able to compare this corrected criterion with Crida’s, we looked for the mass at which . We plot this as a function of the viscosity for different aspect ratios in Fig. 12.
Fung et al. (2014) also derived a gap-opening criterion for planetary masses in the range of , for and for :
| (6) |
In Fig. 12, we see that Fung and Kanagawa’s criteria show a linear evolution for the gap-opening mass as a function of the viscosity, unlike Crida’s criterion that levels off at low viscosity. This leveling off is caused by the fact that even when the viscosity vanishes, the planet is still in competition with the pressure of the disc to create a gap, creating a lower threshold for the gap-opening mass. Moreover, there should be a threshold at low viscosity as the presence of vortices generates a certain background level of turbulence, independently of the prescribed alpha viscosity.
In order to determine the influence of planetary gas accretion on the gap-opening mass within our simulations, we investigated the gap-opening masses of fixed mass planets in our simulations (squares in Fig. 12). Our planets with fixed mass seem to be opening gaps following Fung’s criterion for and high viscosity only. For the other aspect ratios, all gap-opening criteria seem to be failing. We suspect that our simulations do not match any criteria directly as they are all derived from fits to simulations and, a a result, inducing errors. Using the gap-opening masses derived from the Crida et al. (2006) criterion (Eq.4) we actually find deeper gaps than . It is also important to note that we are investigating gap-opening mass in non-equilibrium discs: the mass accretion rate onto the star is evolving over time as material is accreted onto the planet and the star. Earlier studies (Crida et al., 2006; Fung et al., 2014; Kanagawa et al., 2015) were made on the basis of equilibrium discs, meaning that the stellar accretion rate is constant over time. Having a viscously evolving disc may change the gap-opening mass because the accretion onto the star leads to depletion in the inner disc, influencing the material around the planet and therefore influencing how the gap is opened (especially at high viscosities). To maintain consistency, we therefore compare gap-opening masses within our simulations.
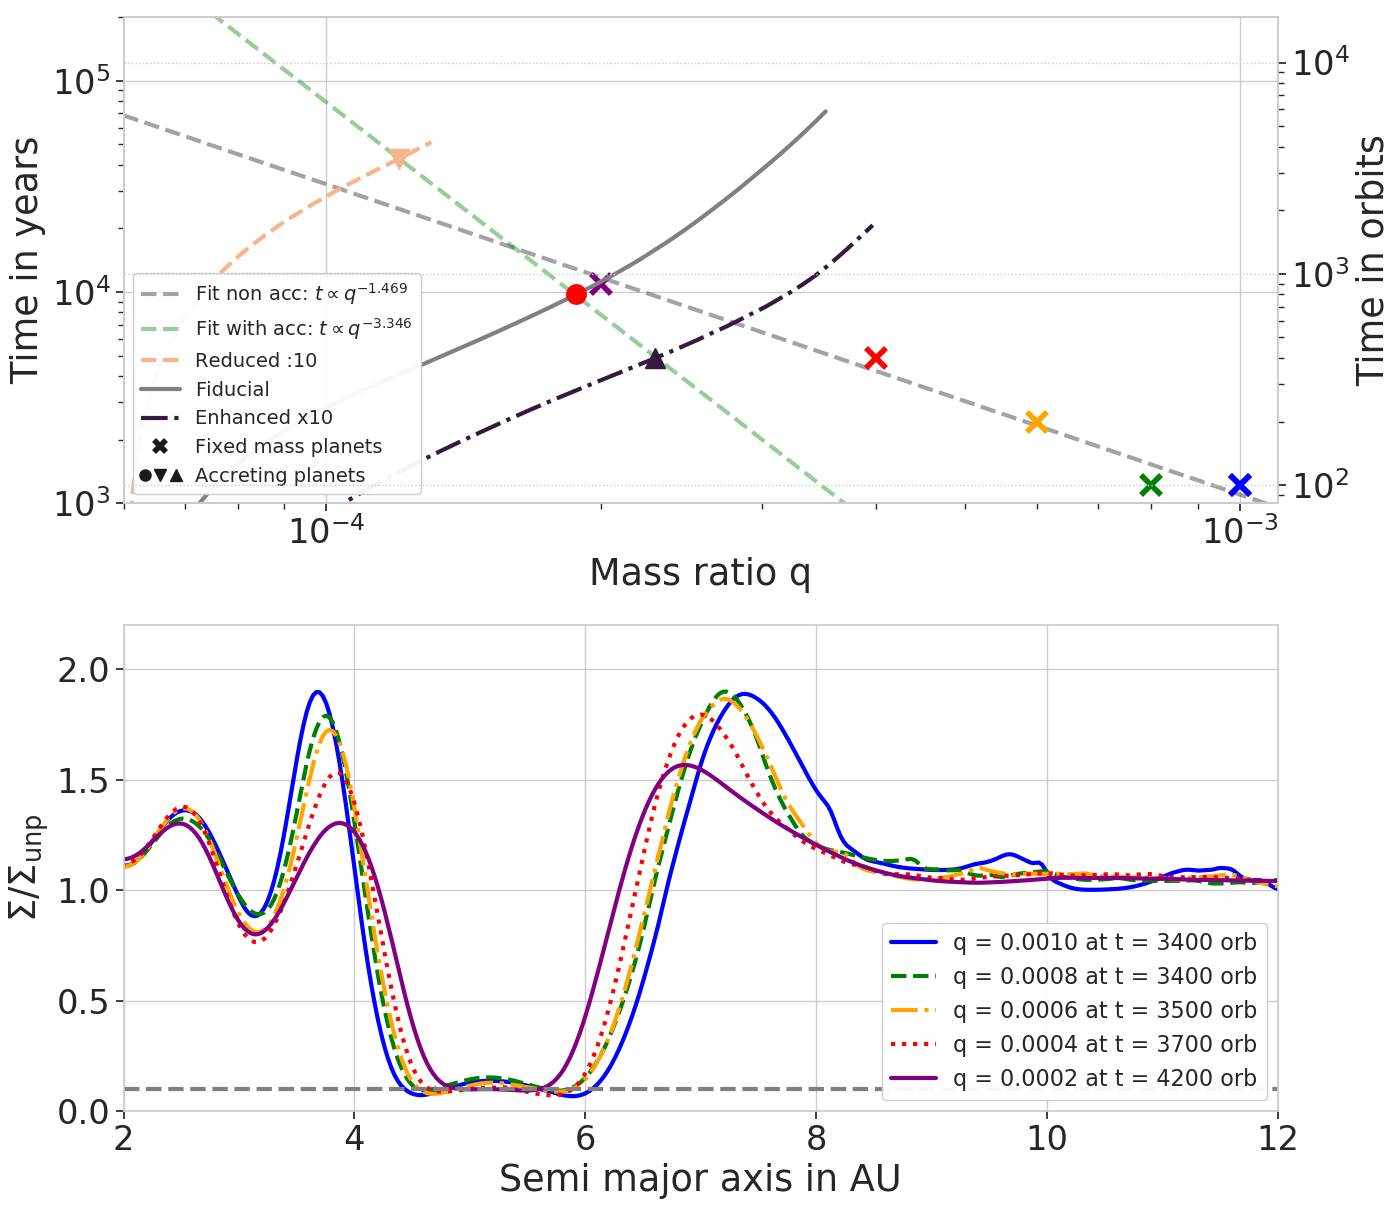
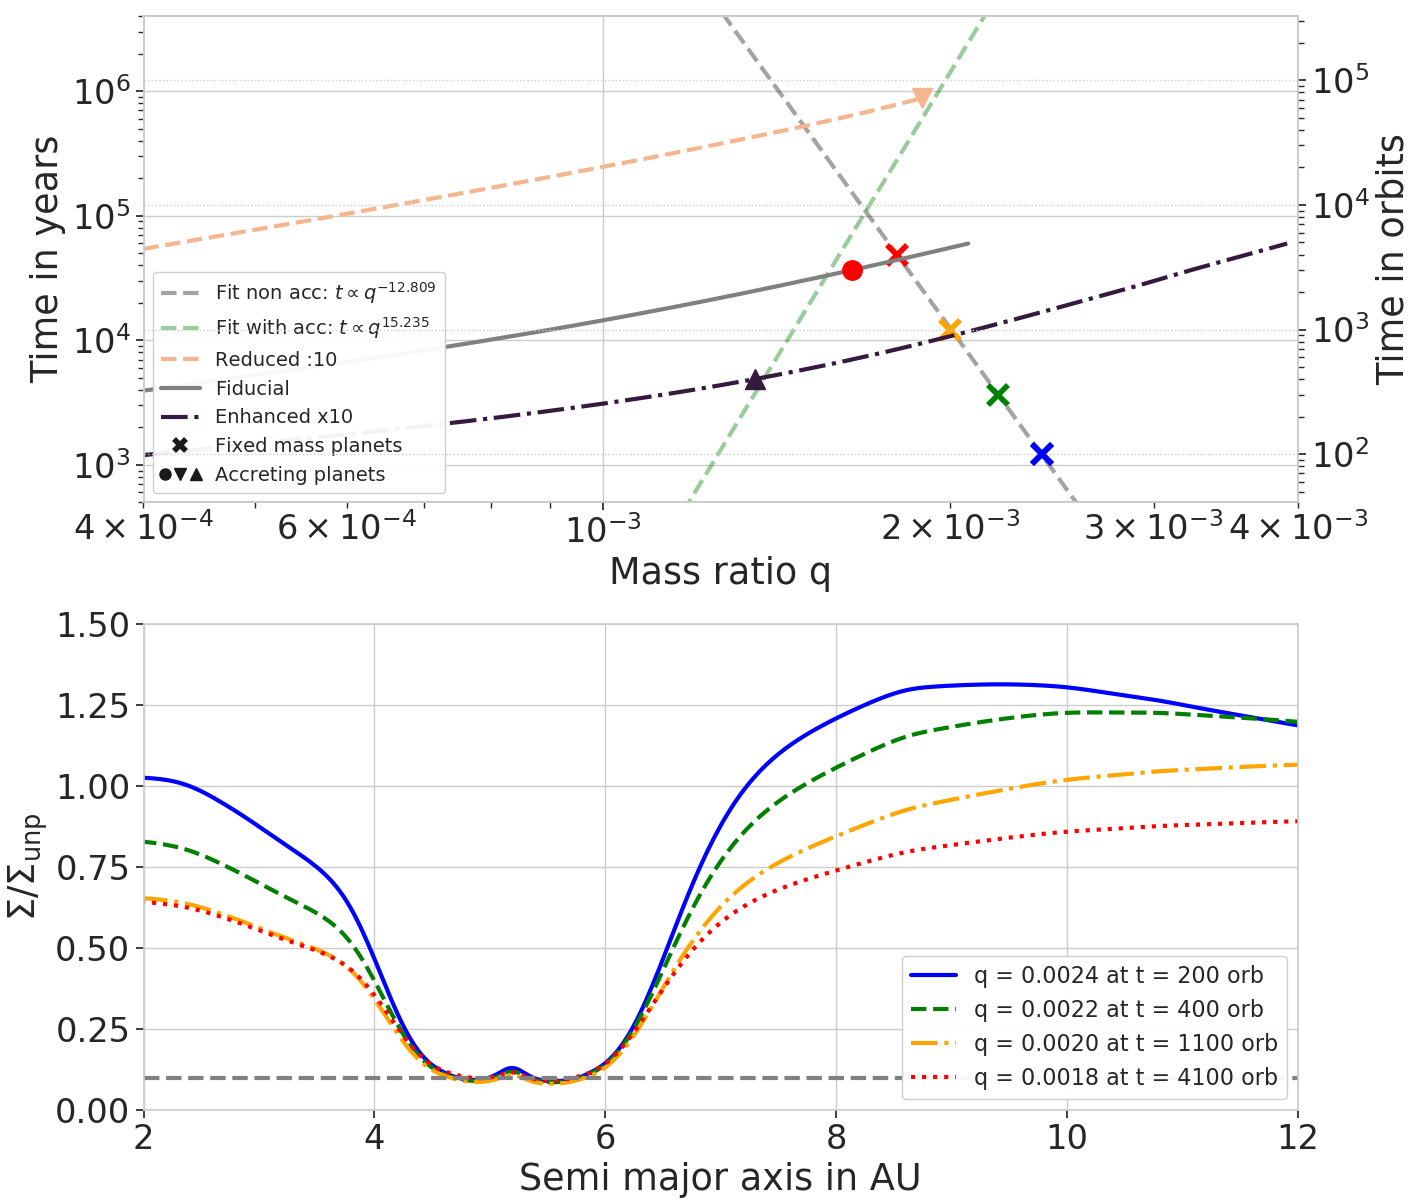
At this point in the study, we can identify three behaviors depending on the level of viscosity: 1) at low viscosity (e.g., at for ), the gap-opening mass is highly dependent on the gas accretion rate. Simulations with faster accreting planets result in larger gap-opening masses, while simulations with slower accreting planets result in smaller gap-opening masses; 2) at high viscosity (for example at for ), we find the opposite behavior. A simulation with a high accretion rate will open a gap at a smaller mass than a slowly accreting planet; 3) as the behavior flips between high and low viscosity, a peculiar viscosity exists, for example at for , for which the gap-opening mass is insensitive to the different gas accretion rates. For the seven simulations, the gap opening mass is nearly the same: .
In order to explain these behaviors, we investigate the time needed for a fixed mass planet to open a gap as a function of its mass, at low and high viscosities. Our results are shown in Figs. 14 and 15 for low () and high () viscosities, respectively. The crosses represent the time needed for fixed-mass planets of different masses to open a gap. To be consistent with regard to the comparison, in this case, the fixed-mass planets are introduced in exactly the same way as the accreting planets: after the core is introduced and its initial gap has been created, the mass of the planet is switched to the final mass of interest. The time needed to open a gap corresponds then to the time needed to reach the threshold after the planet mass is switched to its final mass.
As expected, we see that more massive planets open gaps more rapidly than low-mass planets (Lin & Papaloizou, 1986). In consequence, the way the planet is introduced in the disc has a strong influence on the gap-opening mass (more precisely, on the time at which the threshold is reached). To make a comparison with accreting planets, we show, using the same figures, the time evolution of the masses of the accreting planets. The dots and triangles represent the time and mass at which each accreting planet is observed to open a gap (same dots and triangles of Fig. 12). On the lower panels of Figs. 14 and 15, we show the surface density profiles of the non-accreting planets at the time and mass used for the gap definition. We observe two different behaviors at low and high viscosities that can explain the gap-opening masses of our accreting planets (Fig. 12). First, at low viscosity (Fig. 14), the gap-opening masses of the accreting planets and the one of the fixed-mass planets are both inversely proportional to the planet mass (). In this case, the gap-opening phenomenon is governed by the disc response to the change in the mass of the planet. Gas accretion only changes the value of the slope compared to the fixed-mass planets ( for the fixed-mass planets and for the accreting planets). This means that the process of gas accretion is dominated by the disc response time, that is, the time needed for the disc to react to a change of planetary mass. In this case, when the planet is slowly introduced in the disc, it opens a gap at a lower mass than a planet that is rapidly introduced. This explains the behavior seen in Figs. 14 and 12 at low viscosity: slowly accreting planets are slowly changing in mass, resulting in smaller gap-opening masses. On the other hand, at high viscosity (Fig. 15), the behavior is completely different. The gap-opening masses of the fixed-mass planets is still inversely proportional to the planet mass () but the gap-opening mass of the accreting planets is proportional to (). In this case, the disc response is quick enough for planetary gas accretion to help carve a deeper gap. Gap opening is, therefore, dominated by gas accretion and not by the disc response time.
The key parameter here is the disc response time to a change of planetary mass. A formula for the gap opening time in an inviscid disc was derived by Lin & Papaloizou (1986). They found that . As plotted in Figs. 14 and 15, we find for and for , meaning that at higher viscosity, the gap opening time is more dependent on the planetary mass. It is important to mention that the discrepancy between our result and that of Lin & Papaloizou (1986) comes from the importance of viscosity in the gap-opening process and the definition for the gap opening time. Indeed, we define the gap-opening mass as the mass needed to create a gap of a certain depth (), whereas they define it on the basis of when the forces applied by the planet on the disc are equilibrated and vice versa.
In conclusion, gas accretion has a different impact on the gap-opening mass depending on the disc response time. It is a dominating phenomenon at high viscosities. These differences in gap-opening mass can have an important impact on the transition to type II migration, which is investigated in the next section.

4.4 Migration maps
Planets embedded in discs interact with the gas by exchanging angular momentum, which results in planet migration (for recent reviews see Kley & Nelson 2012; Baruteau et al. 2014). Migration is a robust phenomenon and a central ingredient in global models of planet formation that attempt to reproduce known exoplanet systems as well as our own Solar System (for a review, see Raymond et al. 2018). In order to study the type I migration of planets that could be present in the same disc as our gas-accreting planets, we employ the formulae from Paardekooper et al. (2011) to estimate the torque acting on the smaller bodies. In their work, they derived a formula based on the temperature gradient and surface density gradient . The total torque is composed of five components coming respectively from the Lindblad torque, the barotropic and entropic horseshoe drag torques and the barotropic and entropic linear corotation torque:
| (7) |
where is the adiabatic index and is the normalizing torque depending on (the mass ratio between the planet and the star), is the aspect ratio, is the surface density at the location of the planet, is the distance star-planet, and is the planet’s angular velocity. The total torque is a linear combination of these torques where the coefficients , and depend on the saturation parameters and :
| (8) |
where is the viscous saturation parameter depending on the horseshoe half width as described in Masset et al. (2006) and the viscosity, , at the location of the planet and is the thermal saturation parameter depending on the thermal diffusion, , which depends on the opacities in the disc, where we use the Bell & Lin (1994) opacities. This torque formula from Paardekooper et al. (2011) has been compared to 3D radiation hydrodynamic simulations (Bitsch & Kley, 2011; Lega et al., 2015) and found to be a good match.
A negative torque would result in an inward migration, towards the star. On the other hand, a positive torque reflects outward migration, toward the outer parts of the disc. Inward migration is mostly due to the Lindblad component of the torque. In order to have outward migration in our locally isothermal case, where the temperature gradients are quite shallow, sharp positive radial gradients in the surface density are needed Masset et al. (2006). These gradients appear at the outer edge of the gap created by the accreting planet.
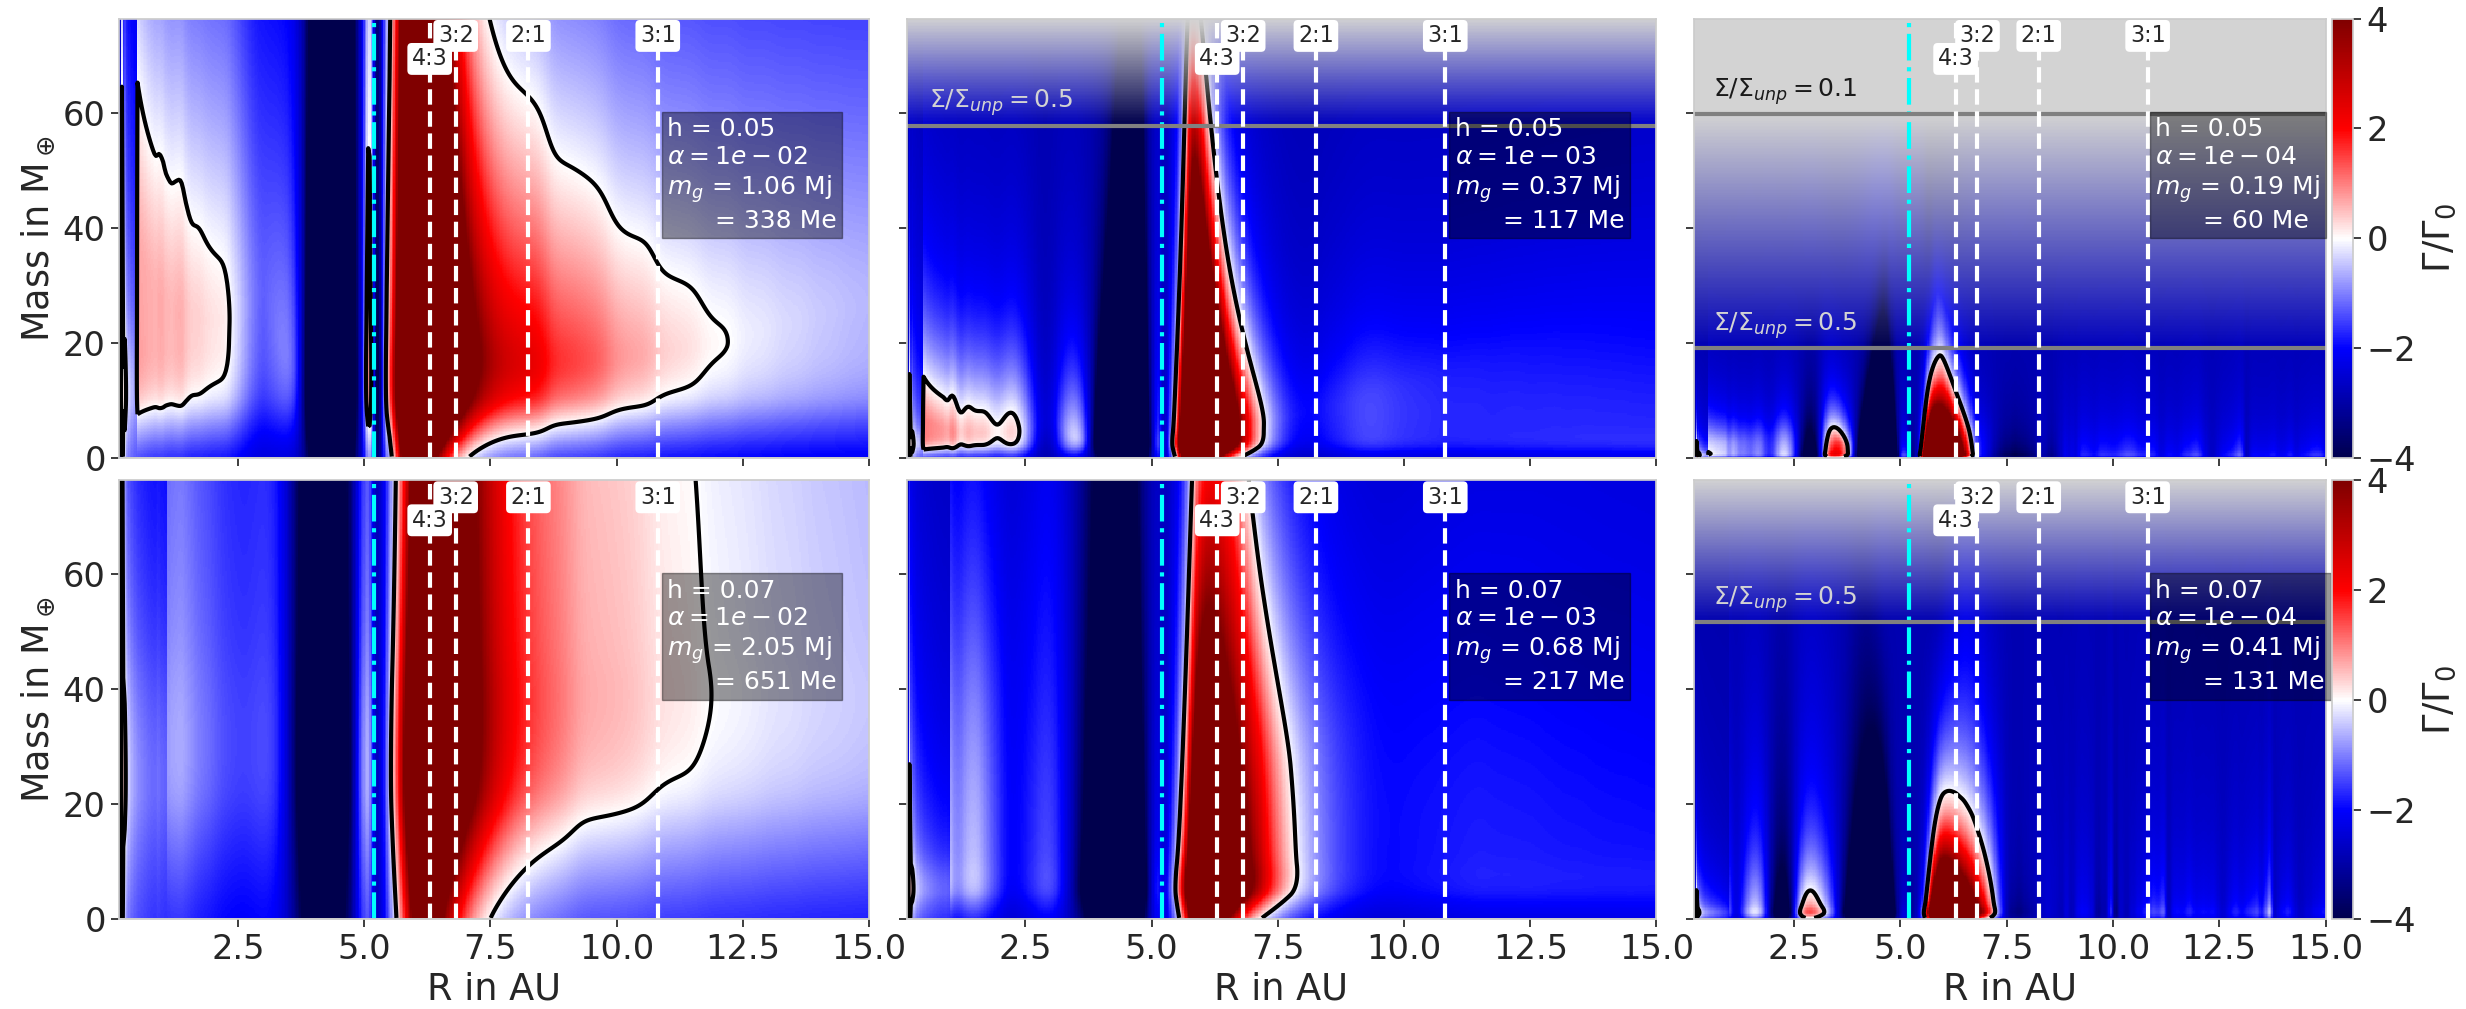
In Figs. 16 and 17, we show the migration maps for different viscosities and different aspect ratios when the accreting planet has reached its gap-opening mass. Regions of inward (blue) and outward (red) migration are represented as well as the potential equilibrium position of the low mass migrating planet: the zero-torque position (black line) and the resonances (dashed white vertical lines) with the accreting giant planet, whose position is marked by the dashed blue line.
An outer lower mass planet would stop migrating either at the zero-torque location or if it is trapped in resonance with the inner planet, depending on its migration speed (Thommes, 2005; Pierens & Nelson, 2008). In our simulations, if an inward migrating planet can jump the 2:1 resonance and continue to migrate further in, it would reach the position of the 3:2 resonance for the lowest viscosities, when the torques saturate. At high viscosity, for all aspect ratios, the outward migration zone is wide enough to overlap over the 3:2 resonances positions and the 2:1 resonances positions if the mass of the second planet is small enough. It these cases, the migrating planet is prevented to be locked in 3:2 resonance by the zero torque line, specifically for low-mass planets. When the planet mass is small enough, the 2:1 resonance is also unreachable due to the extend of the outward migration zone. Depending on the shape of the gap created and the migration speed of the low-mass planet, the capture in certain resonances might therefore be avoided. The capture in resonance is important for the grand tack scenario (Walsh et al., 2011), where Jupiter and Saturn get locked in 3:2 or 2:1 resonance and start migrating outward (Masset & Snellgrove, 2001; Morbidelli & Crida, 2007; Pierens & Nelson, 2008; Raymond et al., 2011; Pierens et al., 2014; Chametla et al., 2020). We discuss, in Sect. 5.3, the impact of resonance capture on the structure of our Solar System.
Pierens et al. (2014) investigate which disc parameters ( and ) and capture in resonance are needed to allow outward migration of Jupiter and Saturn. For h=0.05 (middle row in Fig. 16) and our surface density ()222Note that their surface density profile is different from our setup: as opposed to in this work. Therefore the outcome of planet migration in our case might be different from their results. with , outward migration for the Jupiter-Saturn pair would happen in the 3:2 resonance. Still, according to Pierens et al. (2014), the Jupiter-Saturn system would show divergent migration for and be captured in the stable 2:1 configuration for . In Fig. 16, we see that the capture in the 3:2 resonance is possible for and for these disc parameters, Saturn would not open a deep gap (). Therefore, our migration maps agree with the results found in (Pierens et al., 2014), assuming that Saturn’s migration speed allows it to be locked in the 3:2 resonance. In addition, our results show that N-body simulations of growing planets should take the disc profile into account to correctly assess the migration behavior of the planets.

As a planet grows and carves a deep gap, it is transitioning from type I to type II migration. In Fig. 18, we show the migration maps for and for the fiducial, the enhanced, and the reduced by 10 rates for planetary gas accretion. If the planet accretes slowly, a gap is opened at a smaller mass than when the planet accretes quickly for these disc parameters (see Sect. 4.3). The mass at which the planet is expected switch from type I to type II migration (depicted by the gray area in Figs. 16, 17, and 18) is, therefore, dependent on the planetary accretion rate, assuming that the second potential planet in the system accretes at the same rate and would thus have the same gap-opening mass. At these disc parameters, the difference in gap-opening mass does not have an impact on the capture in resonance: the region of outward migration is small and does not overlap with resonances for planets more massive than . The dynamics of multiple planetary systems can be highly impacted by planetary gas accretion via the influence on the migration type and on the potential trapping in resonance.
5 Discussion
5.1 Accretion onto the star
In this work, we study the influence of planetary gas accretion on the stellar accretion (Sects. 3.3 and 4.2). We show that the stellar accretion is reduced with increasing planetary accretion rates. Even though, at low viscosity, our results show an enhancement of the stellar gas accretion rate, we expect this trend to flip and follow the high viscosity case after reaching the viscous time needed for material to reach the inner disc from the planet position.
In both previous cases, the stellar accretion was only decreased or increased by a factor of up to three compared to the case of a disc without any planet. These results are quite different from what Manara et al. (2019) find. In their models, they find that stellar gas accretion rate can be reduced by over two orders of magnitude due to the presence of giant planets. In our simulations, these large spreads of stellar accretions could only be achieved by changing the disc viscosity over orders of magnitude, however, this parameter is fixed in the simulations used in Manara et al. (2019). The difference might come from the difference in gas flow between a 2D and a 1D disc: indeed, in the approach of Manara et al. (2019), gas accretion onto the star is derived from the viscous spreading of a 1D disc containing a giant planet. As Lubow & D’Angelo (2006) conclude in their work, in a 2D disc, mass can flow through the gap even in the presence of a giant planet. Moreover, in Manara et al. (2019), the planetary gas accretion rates are higher than ours as theirs are proportional to the unperturbed surface density in their accretion routine (Mordasini et al., 2012). Therefore, the 1D model from Manara et al. (2019) might be overestimating the efficiency of the planet in blocking material from the inner disc.
In addition, Lubow & D’Angelo (2006) showed that the modeling of the inner disc and the process whereby gas is accreted onto the planet is of crucial importance for calculating the stellar accretion rate. Our simulations indicate that planetary gas accretion might have a smaller impact than expected on the stellar gas accretion rates.
5.2 Implications for observations
Observations of protoplanetary discs have revealed structures in the dust distribution (Pinilla et al., 2012; Andrews et al., 2018; Zhang et al., 2018). However, these dust structures are ultimately caused by the drifting dust grains trapped at pressure bumps in the gas discs. Therefore, as mentioned in previous sections, looking at the pressure bumps created by planets in the gas can give us an insight into how the dust is trapped and how gas accreting planets might influence the interpretation of the observations. When we compared the pressure bumps in Sects. 3.1 and 3.2 for our simulations with the fiducial parameters, we found that the pressure bumps were too similar to show distinguishable features. This result is expected, as in Sect. 4.3 we showed that for these disc parameters, gas accretion has almost no influence on the gap depth. On the other hand, at low viscosity the gap-opening mass changed dramatically with the planetary accretion rate.
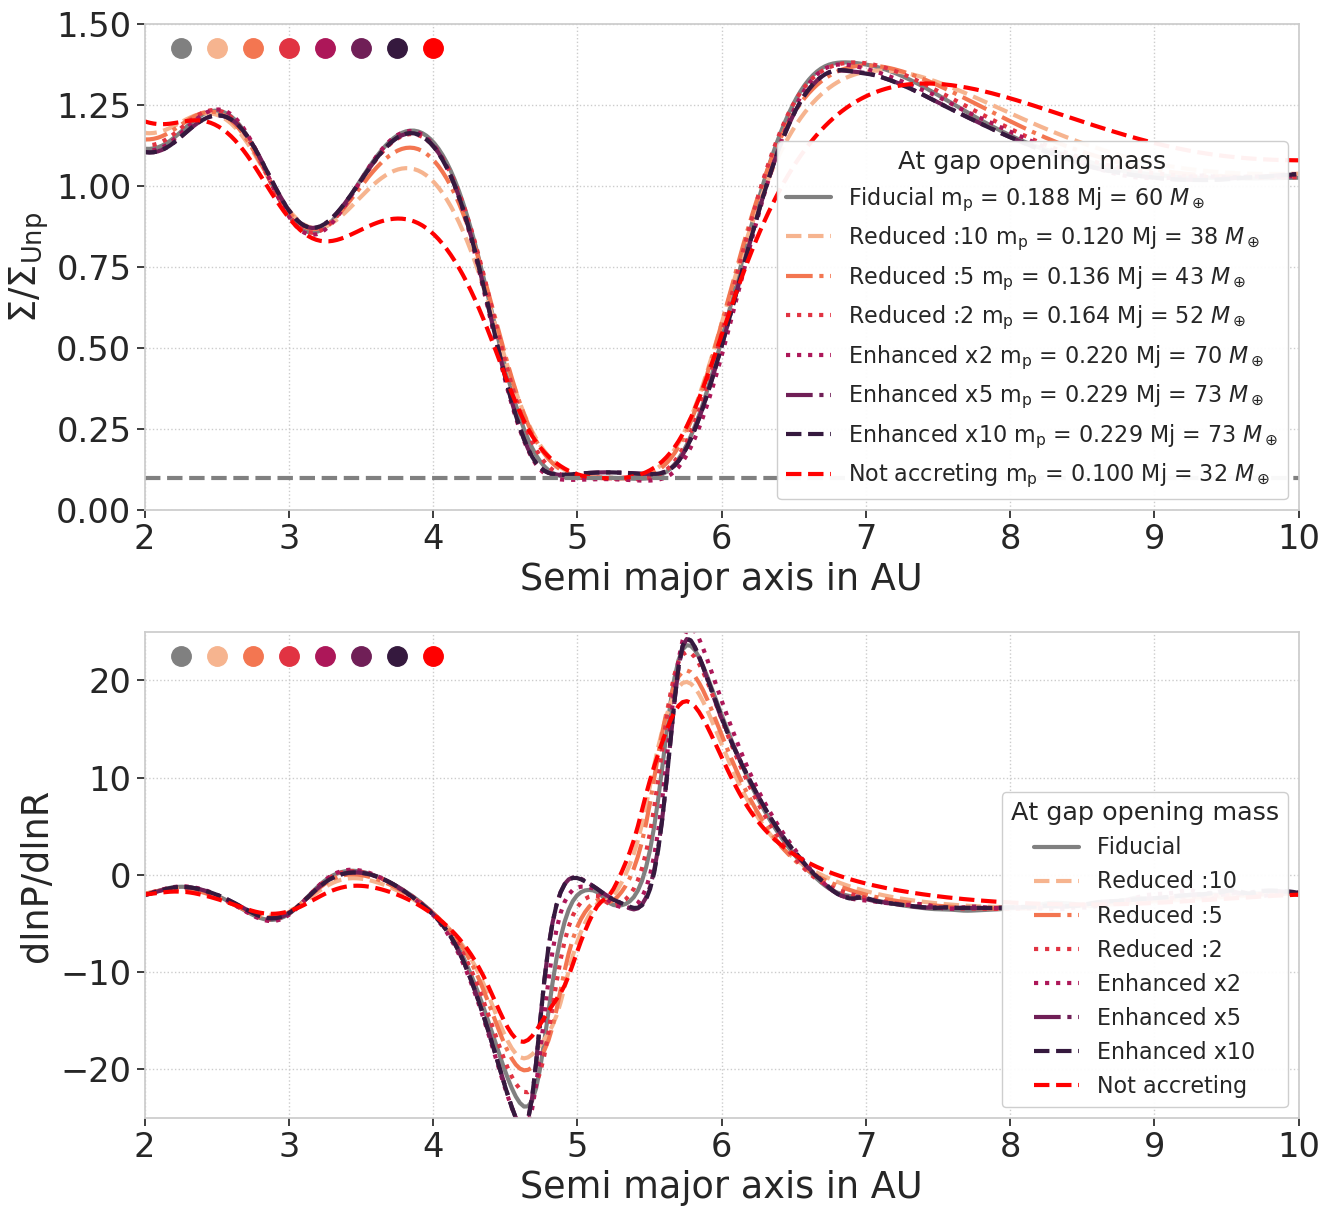
In Fig. 19 we show the surface density profiles of discs containing accreting planets at gap-opening mass and the corresponding pressure bumps for and and for the different planetary accretion rates studied. Profiles plotted in the top panel show similar gap width for the same gap depth. The pressure bumps created here are, thus, very similar. Even if the difference in planetary mass is of almost a factor of two, the created gaps are too similar to show features that can be distinguished by observations. Our simulations thus indicate that for the same gap depth, gas accretion has a negligible impact on the gap width. However, it does have an impact on the mass creating such a gap: depending on the gas accretion rate, a very similar gap can be created by planets of different masses, as we can see in Fig. 19. This implies that the planetary masses derived from 2D simulations designed to match the observations might be off by up to a factor of two for and . This factor is dependent on the viscosity, and is larger for lower viscosities, as we can see in Fig. 13, where .
Recent studies (Teague et al., 2018; Pinte et al., 2020) have shown that CO velocity field observations can be used to observe planets in discs. As gas accretion has an impact on how the gap is formed, it also has an impact on the velocity field of the gas around the planet. In Teague et al. (2018), hydrosimulations with non-accreting planets were run in 2D. The planetary masses were derived by comparing the deviation to the rotational velocity in the simulations and the observations. Their derived masses can be altered by gas accretion if the disc parameters make the gap formation sensitive to gas accretion.
5.3 Implications for the grand tack scenario
The gap-opening mass is an important parameter for the structure of planetary systems. When multiple planets are taken into account, as in the grand tack scenario with Jupiter and Saturn (Walsh et al., 2011) or in recent N-body planet formation simulations (Bitsch et al., 2019), the timescales for gas accretion and migration become important. Indeed, if Saturn is accreting rapidly in a disc where and , then it will reach a high mass before opening a gap. In our case, the gap-opening mass is with the highest gas accretion rate. It means that if there is a mechanism that stops planetary gas accretion (like photoevaporation (Rosotti et al., 2015)), then Saturn () would not open a gap and it would thus migrate through type I migration towards Jupiter and be captured in resonance or at a zero-torque location. As type I migration is fast, we can imagine that some resonances might be jumped and Saturn and Jupiter would end up in close relative final positions. On the other hand, if Saturn would be accreting very slowly, then it would switch to type II migration when reaching a gap-opening mass of . The growing body of Saturn would then slowly arrive towards Jupiter and would be less likely to jump into the first resonance positions encountered. Therefore, depending on the gas accretion rate, the migration speed will be different, leading to different configurations for the relative positions of Jupiter and Saturn.
As discussed in Sect. 4.4, the capture in resonance, as well as the order of the resonance if the capture occurs, would then trigger (or not) the outward migration of Jupiter and Saturn that is needed to explain the formation of our solar system within this scenario. We plan on studying this impact in more details in a future project. The influence of relative migration speed on the capture in resonance was investigated by Kanagawa & Szuszkiewicz (2020). They found that because of gap formation, a planet pair can break the resonant configuration they had been locked in. It confirms the assumption that gap formation is a key process in understanding planetary systems structures and that the impact of gas accretion on gap formation is an important parameter that should be taken into account.
6 Conclusions
In this paper, we study the influence of gas accretion on a planet embedded in its gaseous protoplanetary disc. Our main results are as follows:
-
1.
Planetary gas accretion has a non-negligible impact on stellar gas accretion. The depletion of the inner disc by planetary accretion and the creation of a gap effectively reduces the stellar accretion. Even though our study is focused on extreme cases of planetary gas accretion, we find that stellar accretion is impacted by less than one order of magnitude compared to discs evolving purely through viscous spreading, which stands in contrast to earlier results derived from 1D disc evolution models (Manara et al., 2019). We attribute this difference in part to the higher planetary gas accretion rates in Manara et al. (2019), which are up to one order of magnitude higher than in our simulations333We believe these high accretion rates are caused by the usage of the unperturbed gas surface density to calculate the planetary gas accretion rates in the work of Mordasini et al. (2012), used in Manara et al. (2019).
-
2.
Disc parameters have a strong impact on planetary gas accretion. The aspect ratio changes the accretion rate evolution as the gas accretion rate formula depends on directly and on : as it is more difficult for planets to create gaps in discs with larger aspect ratios, the gas surface density in the gap is larger, resulting in larger accretion rates. On the other hand, the viscosity is a key parameter as it dictates how much gas is refilled around the planet: lower viscosities imply lower planetary gas accretion rates.
-
3.
Planetary gas accretion has a strong impact on the gap-opening mass, depending on the disc parameters and assuming that the gap-opening mass is defined by the mass needed to reach . The impact will be stronger when the disc response time is large (low viscosity), as it does not have time to adapt to a change in planetary mass. It results in higher gap-opening masses for the planets that quickly change their mass (i.e., for the quickly accreting planets described here). On the other hand, gas accretion becomes a dominant phenomenon when the disc time response is small (high viscosity): planetary gas accretion can help carve a deeper gap in this case, resulting in smaller gap-opening masses when the accretion rate is larger.
In addition we discuss the implications of our results on the planetary interpretation of observed rings and gaps. Indeed, similar pressure bumps are produced by planets of different masses depending on the gas accretion rate used, meaning that we should also take gas accretion into account in order to be able to constrain the mass of a planet that is in the process of creating a gap in the observed disc.
The gap-opening mass is also an important parameter for the study of the formation of multiple planets in discs. We discuss the impact of gas accretion on migration, concluding that a major impact is linked to the gap-opening mass as it dictates when the planet is expected to switch its migration type (from type I to type II). This switch in migration type then changes the migration speed of the planets, which determines the possibility of capture in resonances. The structure of such systems can, therefore, be highly impacted by planetary gas accretion. Even though our results rely on assumptions based on disc evolution and gas accretion rates, we identify important trends for planet formation simulations. In particular, the change of the gap-opening mass for accreting planets at low viscosity has important implications for simulations of planet population synthesis. In addition, our results are important when investigating the growth and migration of multiple planets in the same disc, as required by the grand tack scenario. Our study supports the fact that gas accretion is an important factor not only for planetary growth, but also for the migration behavior of other planets and the gap shape. Thus, it should be taken into account in future simulations and interpretations with regard to observations of protoplanetary discs where planets are suspected.
Acknowledgements.
C. Bergez-Casalou and B. Bitsch thank the European Research Council (ERC Starting Grant 757448-PAMDORA) for their financial support. C. Bergez-Casalou is a fellow of the International Max Planck Research School for Astronomy and Cosmic Physics at the University of Heidelberg (IMPRS-HD).References
- Andrews et al. (2018) Andrews, S. M., Huang, J., Pérez, L. M., et al. 2018, ApJ, 869, L41
- Ataiee et al. (2018) Ataiee, S., Baruteau, C., Alibert, Y., & Benz, W. 2018, A&A, 615, A110
- Ayliffe & Bate (2009) Ayliffe, B. A. & Bate, M. R. 2009, MNRAS, 393, 49
- Baillié et al. (2019) Baillié, K., Marques, J., & Piau, L. 2019, A&A, 624, A93
- Baruteau et al. (2014) Baruteau, C., Crida, A., Paardekooper, S. J., et al. 2014, in Protostars and Planets VI, ed. H. Beuther, R. S. Klessen, C. P. Dullemond, & T. Henning, 667
- Bell & Lin (1994) Bell, K. R. & Lin, D. N. C. 1994, ApJ, 427, 987
- Bitsch et al. (2019) Bitsch, B., Izidoro, A., Johansen, A., et al. 2019, A&A, 623, A88
- Bitsch & Kley (2011) Bitsch, B. & Kley, W. 2011, A&A, 536, A77
- Bitsch et al. (2018) Bitsch, B., Morbidelli, A., Johansen, A., et al. 2018, A&A, 612, A30
- Calvet & Gullbring (1998) Calvet, N. & Gullbring, E. 1998, ApJ, 509, 802
- Chametla et al. (2020) Chametla, R. O., D’Angelo, G., Reyes-Ruiz, M., & Sánchez-Salcedo, F. J. 2020, MNRAS, 243
- Crida & Bitsch (2017) Crida, A. & Bitsch, B. 2017, Icarus, 285, 145
- Crida et al. (2006) Crida, A., Morbidelli, A., & Masset, F. 2006, Icarus, 181, 587
- Crida et al. (2007) Crida, A., Morbidelli, A., & Masset, F. 2007, A&A, 461, 1173
- D’Angelo & Bodenheimer (2013) D’Angelo, G. & Bodenheimer, P. 2013, ApJ, 778, 77
- D’Angelo et al. (2003) D’Angelo, G., Kley, W., & Henning, T. 2003, The Astrophysical Journal, 586, 540
- Dürmann & Kley (2015) Dürmann, C. & Kley, W. 2015, A&A, 574, A52
- Fu et al. (2014) Fu, W., Li, H., Lubow, S., & Li, S. 2014, ApJ, 788, L41
- Fung et al. (2014) Fung, J., Shi, J.-M., & Chiang, E. 2014, ApJ, 782, 88
- Gyeol Yun et al. (2019) Gyeol Yun, H., Kim, W.-T., Bae, J., & Han, C. 2019, ApJ, 884, 142
- Hammer et al. (2017) Hammer, M., Kratter, K. M., & Lin, M.-K. 2017, MNRAS, 466, 3533
- Hartmann et al. (1994) Hartmann, L., Hewett, R., & Calvet, N. 1994, ApJ, 426, 669
- Howard et al. (2012) Howard, A. W., Marcy, G. W., Bryson, S. T., et al. 2012, ApJS, 201, 15
- Hubickyj et al. (2005) Hubickyj, O., Bodenheimer, P., & Lissauer, J. J. 2005, Icarus, 179, 415
- Kanagawa & Szuszkiewicz (2020) Kanagawa, K. D. & Szuszkiewicz, E. 2020, arXiv e-prints, arXiv:2004.01063
- Kanagawa et al. (2015) Kanagawa, K. D., Tanaka, H., Muto, T., Tanigawa, T., & Takeuchi, T. 2015, MNRAS, 448, 994
- Kanagawa et al. (2018) Kanagawa, K. D., Tanaka, H., & Szuszkiewicz, E. 2018, ApJ, 861, 140
- Klahr & Bodenheimer (2003) Klahr, H. H. & Bodenheimer, P. 2003, ApJ, 582, 869
- Kley (1999) Kley, W. 1999, MNRAS, 303, 696
- Kley & Nelson (2012) Kley, W. & Nelson, R. P. 2012, ARA&A, 50, 211
- Lambrechts et al. (2014) Lambrechts, M., Johansen, A., & Morbidelli, A. 2014, A&A, 572, A35
- Lambrechts et al. (2019) Lambrechts, M., Lega, E., Nelson, R. P., Crida, A., & Morbidelli, A. 2019, A&A, 630, A82
- Lega et al. (2015) Lega, E., Morbidelli, A., Bitsch, B., Crida, A., & Szulágyi, J. 2015, MNRAS, 452, 1717
- Li et al. (2001) Li, H., Colgate, S. A., Wendroff, B., & Liska, R. 2001, ApJ, 551, 874
- Lin & Papaloizou (1986) Lin, D. N. C. & Papaloizou, J. 1986, ApJ, 309, 846
- Lissauer et al. (2009) Lissauer, J. J., Hubickyj, O., D’Angelo, G., & Bodenheimer, P. 2009, Icarus, 199, 338
- Lovelace et al. (1999) Lovelace, R. V. E., Li, H., Colgate, S. A., & Nelson, A. F. 1999, ApJ, 513, 805
- Lubow & D’Angelo (2006) Lubow, S. H. & D’Angelo, G. 2006, ApJ, 641, 526
- Machida et al. (2010) Machida, M. N., Kokubo, E., Inutsuka, S.-I., & Matsumoto, T. 2010, MNRAS, 405, 1227
- Manara et al. (2019) Manara, C. F., Mordasini, C., Testi, L., et al. 2019, A&A, 631, L2
- Masset & Snellgrove (2001) Masset, F. & Snellgrove, M. 2001, MNRAS, 320, L55
- Masset et al. (2006) Masset, F. S., D’Angelo, G., & Kley, W. 2006, ApJ, 652, 730
- Mayor et al. (2011) Mayor, M., Marmier, M., Lovis, C., et al. 2011, arXiv e-prints, arXiv:1109.2497
- Meru et al. (2019) Meru, F., Rosotti, G. P., Booth, R. A., Nazari, P., & Clarke, C. J. 2019, MNRAS, 482, 3678
- Morbidelli & Crida (2007) Morbidelli, A. & Crida, A. 2007, Icarus, 191, 158
- Mordasini et al. (2012) Mordasini, C., Alibert, Y., Klahr, H., & Henning, T. 2012, A&A, 547, A111
- Mulders et al. (2018) Mulders, G. D., Pascucci, I., Apai, D., & Ciesla, F. J. 2018, AJ, 156, 24
- Ndugu et al. (2018) Ndugu, N., Bitsch, B., & Jurua, E. 2018, MNRAS, 474, 886
- Paardekooper et al. (2011) Paardekooper, S. J., Baruteau, C., & Kley, W. 2011, MNRAS, 410, 293
- Paardekooper & Mellema (2006) Paardekooper, S. J. & Mellema, G. 2006, A&A, 453, 1129
- Pierens et al. (2019) Pierens, A., Lin, M. K., & Raymond, S. N. 2019, MNRAS, 488, 645
- Pierens & Nelson (2008) Pierens, A. & Nelson, R. P. 2008, A&A, 482, 333
- Pierens et al. (2014) Pierens, A., Raymond, S. N., Nesvorny, D., & Morbidelli, A. 2014, ApJ, 795, L11
- Pinilla et al. (2012) Pinilla, P., Benisty, M., & Birnstiel, T. 2012, A&A, 545, A81
- Pinte et al. (2020) Pinte, C., Price, D. J., Ménard, F., et al. 2020, ApJ, 890, L9
- Piso & Youdin (2014) Piso, A.-M. A. & Youdin, A. N. 2014, ApJ, 786, 21
- Pollack et al. (1996) Pollack, J. B., Hubickyj, O., Bodenheimer, P., et al. 1996, Icarus, 124, 62
- Rafikov (2016) Rafikov, R. R. 2016, ApJ, 831, 122
- Raymond et al. (2011) Raymond, S. N., Armitage, P. J., Moro-Martín, A., et al. 2011, A&A, 530, A62
- Raymond et al. (2018) Raymond, S. N., Izidoro, A., & Morbidelli, A. 2018, arXiv e-prints, arXiv:1812.01033
- Robert et al. (2018) Robert, C. M. T., Crida, A., Lega, E., Méheut, H., & Morbidelli, A. 2018, A&A, 617, A98
- Rosotti et al. (2015) Rosotti, G. P., Ercolano, B., & Owen, J. E. 2015, MNRAS, 454, 2173
- Sanchis et al. (2020) Sanchis, E., Picogna, G., Ercolano, B., Testi, L., & Rosotti, G. 2020, MNRAS, 492, 3440
- Schulik et al. (2019) Schulik, M., Johansen, A., Bitsch, B., & Lega, E. 2019, A&A, 632, A118
- Shakura & Sunyaev (1973) Shakura, N. I. & Sunyaev, R. A. 1973, in IAU Symposium, Vol. 55, X- and Gamma-Ray Astronomy, ed. H. Bradt & R. Giacconi, 155
- Suzuki et al. (2016) Suzuki, D., Bennett, D. P., Sumi, T., et al. 2016, ApJ, 833, 145
- Tanigawa & Tanaka (2016) Tanigawa, T. & Tanaka, H. 2016, ApJ, 823, 48
- Teague et al. (2018) Teague, R., Bae, J., Bergin, E. A., Birnstiel, T., & Foreman-Mackey, D. 2018, ApJ, 860, L12
- Thommes (2005) Thommes, E. W. 2005, ApJ, 626, 1033
- Walsh et al. (2011) Walsh, K. J., Morbidelli, A., Raymond, S. N., O’Brien, D. P., & Mandell, A. M. 2011, Nature, 475, 206
- Weber et al. (2019) Weber, P., Pérez, S., Benítez-Llambay, P., et al. 2019, ApJ, 884, 178
- Youdin & Lithwick (2007) Youdin, A. N. & Lithwick, Y. 2007, Icarus, 192, 588
- Zhang et al. (2018) Zhang, S., Zhu, Z., Huang, J., et al. 2018, ApJ, 869, L47