The Array of Long Baseline Antennas for Taking Radio Observations from the Sub-Antarctic
Abstract
Measurements of redshifted 21-cm emission of neutral hydrogen at MHz have the potential to probe the cosmic “dark ages,” a period of the universe’s history that remains unobserved to date. Observations at these frequencies are exceptionally challenging because of bright Galactic foregrounds, ionospheric contamination, and terrestrial radio-frequency interference. Very few sky maps exist at MHz, and most have modest resolution. We introduce the Array of Long Baseline Antennas for Taking Radio Observations from the Sub-Antarctic (ALBATROS), a new experiment that aims to image low-frequency Galactic emission with an order-of-magnitude improvement in resolution over existing data. The ALBATROS array will consist of antenna stations that operate autonomously, each recording baseband data that will be interferometrically combined offline. The array will be installed on Marion Island and will ultimately comprise 10 stations, with an operating frequency range of 1.2–125 MHz and maximum baseline lengths of km. We present the ALBATROS instrument design and discuss pathfinder observations that were taken from Marion Island during 2018–2019.
keywords:
cosmology: observations; dark ages; instrumentation: interferometers†Corresponding author: hsin.chiang@mcgill.ca
; ; ;
1 Introduction
Measurements of redshifted emission of neutral hydrogen across a wide range of radio frequencies have the potential to elucidate the universe’s history from the cosmic “dark ages” up to the formation of large-scale structures (e.g., Pritchard & Loeb, 2012). The dark ages, which occurred after recombination and correspond to a period when the universe was filled with neutral hydrogen, are unexplored to date and represent one of the final observational frontiers in cosmology. The number of independent modes that are contained in the matter power spectrum in this epoch is orders of magnitude greater than the corresponding number for cosmic microwave background (CMB) measurements (Loeb & Zaldarriaga, 2004). Redshifted 21-cm measurements of the dark ages therefore hold the potential to significantly improve cosmological parameter constraints over those currently derived from the CMB; however, the required observational frequencies of MHz are exceptionally difficult to access. The primary experimental challenges include Galactic foreground emission, ionospheric interference, and terrestrial radio-frequency interference (RFI).
Very few experiments have surveyed the radio sky at MHz, and here, we highlight only a subset. At the very lowest frequencies, the state of the art among ground-based measurements dates from the 1950s, when Reber and Ellis caught brief glimpses of the MHz sky at ° resolution, using an array of 192 dipoles (Reber & Ellis, 1956). A few space-based missions have also performed measurements at similarly low frequency ranges; for example, the Radio Astronomy Explorer-2 operated at with ° resolution at (Alexander et al., 1975). Subsequent ground-based experiments include the Dominion Radio Astrophysical Observatory (DRAO) surveys of the northern sky at 10 MHz and 22 MHz, with ° and 1.1–1.7° resolution, respectively (Caswell, 1976; Roger et al., 1999). Low-frequency imaging experiments that are currently operational or under construction include the Ukranian T-shaped Radio telescope (Zakharenko et al., 2016), with 0.5° resolution at the center of its 8–32 MHz operating range, and the New extension in Nançay upgrading LOFAR (Zarka et al., 2015), which operates at 10–85 MHz with 1.5° resolution in standalone mode, and improved resolution at MHz when combined with LOFAR. Existing measurements with finer resolution are mainly at higher frequencies; for example, the Owens Valley Long Wavelength Array mapped the sky with resolution between 36.528 MHz and 73.152 MHz (Eastwood et al., 2018). The dearth of information about the MHz sky, particularly in the southern hemisphere, is illustrated by the Global Sky Model (Zheng et al., 2017), which incorporates the DRAO 10 MHz and 22 MHz data as the only two inputs at these low frequencies with sufficiently meaningful sky coverage and resolution.
The first step toward laying the groundwork for possible measurements of the dark ages is obtaining an improved map of Galactic foregrounds at MHz. In addition to serving as a stepping stone for future cosmological constraints from the dark ages, maps at these frequencies can also shed new light on Galactic astrophysics. Above MHz, synchrotron emission from the Galaxy follows a power law with a frequency dependence of . At lower frequencies, synchrotron self-absorption becomes non-negligible, and the spectrum transitions to dependence. Since self-absorption causes the optical depth along the line of sight to depend on frequency, observations at MHz have the potential to probe the three-dimensional cosmic ray structure of the Galaxy (Peterson & Webber, 2002). Low-frequency observations can also be used to image radio recombination lines (RRLs), which provide a means for studying cool, low-density regions of the interstellar medium (ISM). These absorption lines arise from Rydberg atoms and are highly sensitive to the surrounding environment. The RRL spectrum and absorption profiles can therefore constrain the detailed properties of the ISM regions in which the Rydberg atoms are formed (Gnedin et al., 2009; Stepkin et al., 2007). Finally, observations at MHz may provide new views of Earth’s ionosphere, which absorbs and refracts at radio frequencies and becomes completely opaque below the plasma cutoff frequency. The cutoff frequency and the levels of absorption and refraction are time-varying and spatially dependent. Experiments that image the radio sky at multiple frequencies bracketing the plasma cutoff can therefore simultaneously image the ionosphere and provide spectral riometry data for space weather studies (Kero et al., 2014).
There are proposed efforts to perform new low-frequency measurements from space, where there is no contamination from the ionosphere, and the lunar farside can potentially block RFI from the Earth (Chen et al., 2019; Koopmans et al., 2019). Although the combination of ionosphere and RFI significantly impedes low-frequency radio observations from most locations on Earth, preliminary observations from Marion Island (Philip et al., 2019) suggest that such observations may still be accessible from carefully selected locations and with new technology developments. In this paper, we present the Array of Long Baseline Antennas for Taking Radio Observations from the Sub-Antarctic (ALBATROS), a new experimental effort that aims to map the low-frequency sky using an array of autonomous antenna stations. We describe the overall instrument design and preliminary measurements from engineering runs that were performed on Marion Island during 2018–2019.
2 ALBATROS overview
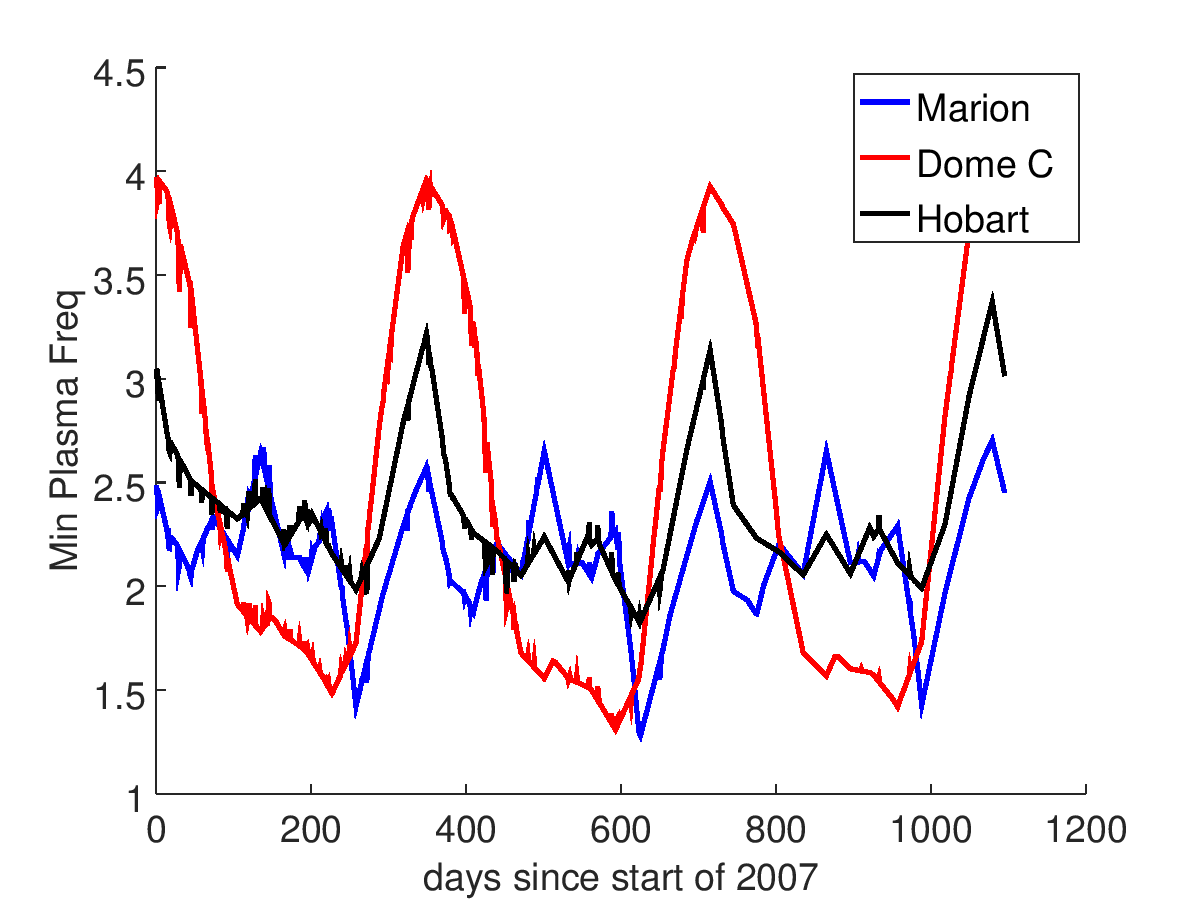
The primary requirements that drive the design for a low-frequency imaging experiment are 1) desired resolution, 2) low RFI, and 3) quiet ionospheric conditions. As a benchmark, an interferometer operating at 30 MHz requires baseline lengths of –1 km to achieve a resolution of °. This length scales inversely with frequency, and therefore -km lengths are required at few-MHz frequencies to improve substantially upon the resolutions achieved to date. The experiment installation site must be remote to keep RFI to a minimum, and polar or near-polar latitudes generally have lower ionospheric plasma frequency cutoffs relative to other locations on Earth. Figure 1 illustrates predictions from the International Reference Ionosphere model (Bilitza, 2018) for the minimum plasma frequency during the last solar minimum, which started in approximately 2007. Three locations are shown: Marion Island, the focus of this work; Dome C in Antarctica, which is another isolated location used for astronomical observations; and Hobart, Tasmania, where Reber performed his MHz observations. The model predictions illustrate that the ionospheric plasma cutoff frequency at Marion Island may drop as low as MHz during solar minima. Since we are currently experiencing another solar minimum (Bhowmik & Nandy, 2018), the timing is opportune for new low-frequency observations.
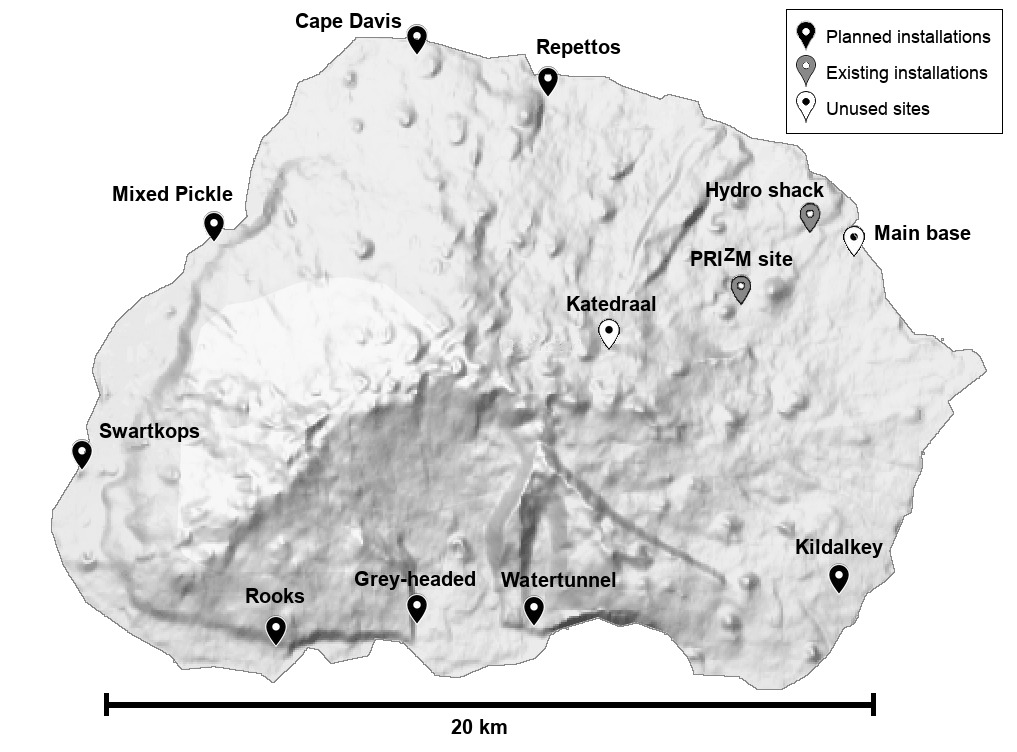
Marion Island is a research base that is located in the southern Indian Ocean at S, E and is operated by the South African National Antarctic Programme. The island lies roughly from the nearest continental landmasses and has an exceptionally quiet RFI environment (Philip et al., 2019). As illustrated in 2(a), Marion has an area of 335 km2 and can therefore support antenna installations with -km baseline lengths. The main Marion base is located on the northeast side of the island, and there are eight rest huts along the coast (Cape Davis, Grey-headed, Kildalkey, Mixed Pickle, Repettos, Rooks, Swartkops, Watertunnel) and one in the interior (Katedraal) that can serve as existing infrastructure points for antenna installations. The planned ALBATROS installation sites include the coastal huts, but exclude the main base and Katedraal for RFI and accessibility reasons, respectively. 2(a) also shows the locations of the ALBATROS pathfinder antennas that are currently installed at the PRIZM site and at the hydro shack.
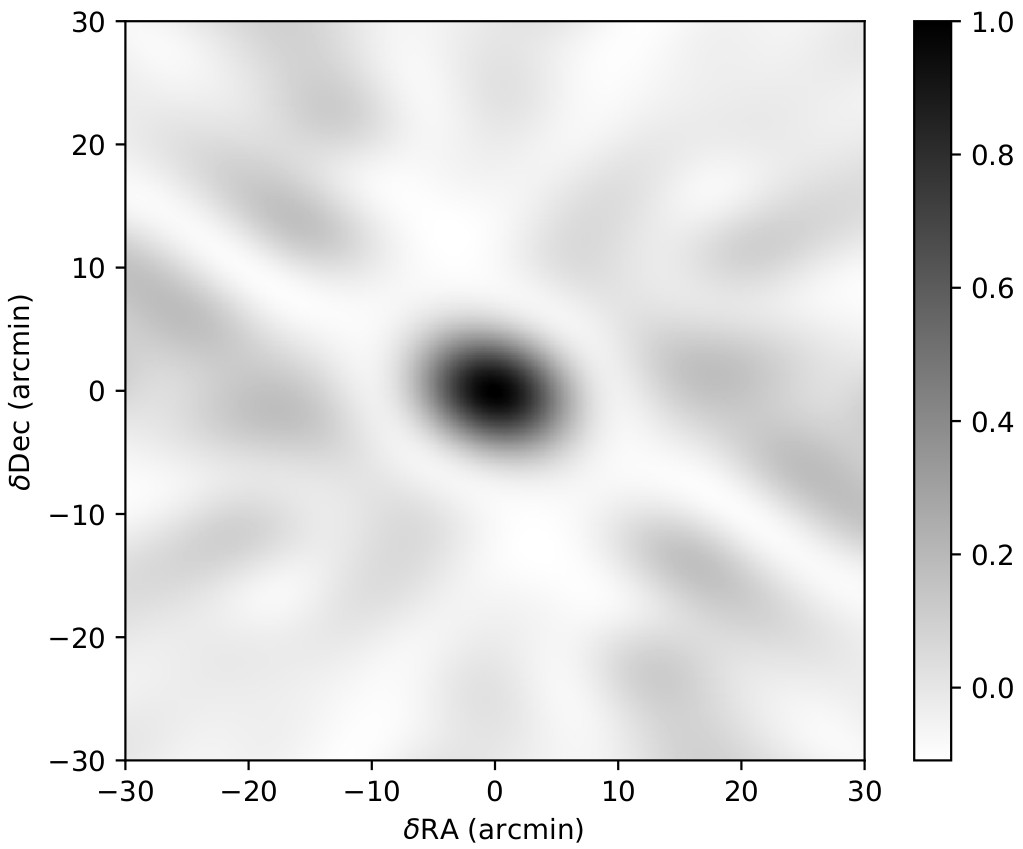
Using the eight coastal huts, the PRIZM site, and the hydro shack as the nominal ALBATROS installation locations, the computed synthesized beam is shown in 2(b). The beam width at 5 MHz is roughly , which represents over an order of magnitude improvement in resolution over other existing measurements. One of the challenges in constructing an interferometer array on Marion Island is that the rugged terrain precludes the possibility of directly cabling and correlating antennas across large distances. The final ALBATROS antenna stations will therefore operate autonomously, recording baseband data over extended periods of time for subsequent offline correlation. We have conducted two engineering runs: 1) a two-element, directly correlated pathfinder to qualitatively understand the sky signal, and 2) a single station to test the readout and power handling technology that are required for autonomous operation.

3 Two-element pathfinder

The first exploratory ALBATROS measurements were conducted with a two-element pathfinder that used direct correlation (without autonomous operation). Figure 3 illustrates this pathfinder, which was installed at the PRIZM site (S, E) in April 2018. The system block diagram is shown in Figure 4, and each of the subsystems is described in detail below.
3.1 Antenna
We employ two dual-polarization Long Wavelength Array (LWA) dipole antennas (Elingson & Kramer, 2004). The LWA antennas have a long development history, are well characterized, and are simple to install and physically robust. The antennas form an east–west baseline with a separation of , and the polarizations are aligned with the cardinal directions. Welded wire mesh screens, roughly 3 m on a side, are installed on the ground below the antennas. The beam pattern is roughly omnidirectional with a solid angle that varies between 2.2 and 2.7 steradians over 5–100 MHz. Although the LWA antenna is not optimized for observations below 10 MHz, using this standard antenna allowed an initial test of the site and of the interferometer systems. For the final ALBATROS array, we are exploring alternative antenna designs that will cover the full frequency range.
3.2 Front-end active balun
The LWA active-balun front-end electronics (FEE) circuit uses a Mini-Circuits GALI-74+ MMIC to amplify each dipole leg against ground, presenting each leg with a 50 impedance and providing a nominal gain of 25 dB. The two GALI-74+ outputs are differenced using a passive 180° hybrid coupler. The coupler output is filtered by a 150 MHz lowpass and receives an additional 12 dB of gain from a Mini-Circuits GALI-6+ MMIC. This last amplifier drives the output signal onto a 100-m 50 coaxial cable. Thus, neglecting mismatch loss between the dipoles (electrically small in the frequency range of interest) and the 100Ω input impedance, as well as the hybrid insertion loss (1dB), the front-end electronics provide a gain of 37 dB (Hicks et al., 2012). Each FEE circuit is powered by 16 V, which is fed on the coaxial cable through a bias tee. The lengths of the coaxial cables are the same for both antennas, thus placing the phase center at zenith.
3.3 Back-end electronics
The back-end readout electronics are housed in a Faraday cage located 100 m away from the antennas to mitigate possible self-generated RFI. Each of the four antenna signals is passed to a second-stage electronics chain consisting of an amplifier (Mini-Circuits ZX60-V63+), and a pair of high- and low-pass filters (Mini-Circuits ZFHP-1R2+ and SLP-90+) that together band-limit the signal to 1.2–. The amplifier has a nominal gain of 20 dB, and the high- and low-pass filters contribute nominal insertion losses of 0.2 dB and 0.14 dB, respectively.
A Smart Network ADC Processor (SNAP; Hickish et al., 2016) board digitizes the RF signals at 250 Msamp/s and uses a Xilinx Kintex 7111http://www.xilinx.com/products/silicon-devices/fpga/kintex-7.html FPGA to calculate full cross-correlations of the four inputs, producing four auto- and six cross-spectra as outputs, over 2048 channels spanning the frequency range 0–125 MHz. The channelization is performed with a CASPER222https://casper.berkeley.edu/-based polyphase filter bank, and the spectra are accumulated over -s intervals. A Valon 5007 frequency synthesizer module provides the clock signal for the SNAP board. A Raspberry Pi (RPi) 3B+ single board computer controls the SNAP board and receives the spectra via GPIO connections. The data rate of the averaged spectra is roughly 400 MB/day (with compression), and this low volume allows the spectra to be saved to the RPi on-board SD card. An Adafruit Ultimate GPS module333https://www.adafruit.com/product/746, connected to an active external GPS antenna, provides absolute timing for the RPi.
3.4 Power
A bank of four 12-V, 200-Ah AGM batteries, connected in parallel, powers the two-element pathfinder system. The batteries are manually charged with a Honda EU30is generator that is housed on site. The total power draw of the two-element pathfinder is W, and when fully charged, the battery bank can power the system for about a week. The raw battery voltage is passed to several DC/DC converters that supply regulated voltages to the SNAP board, FEE, amplifiers and the clock.
4 Single autonomous station pathfinder
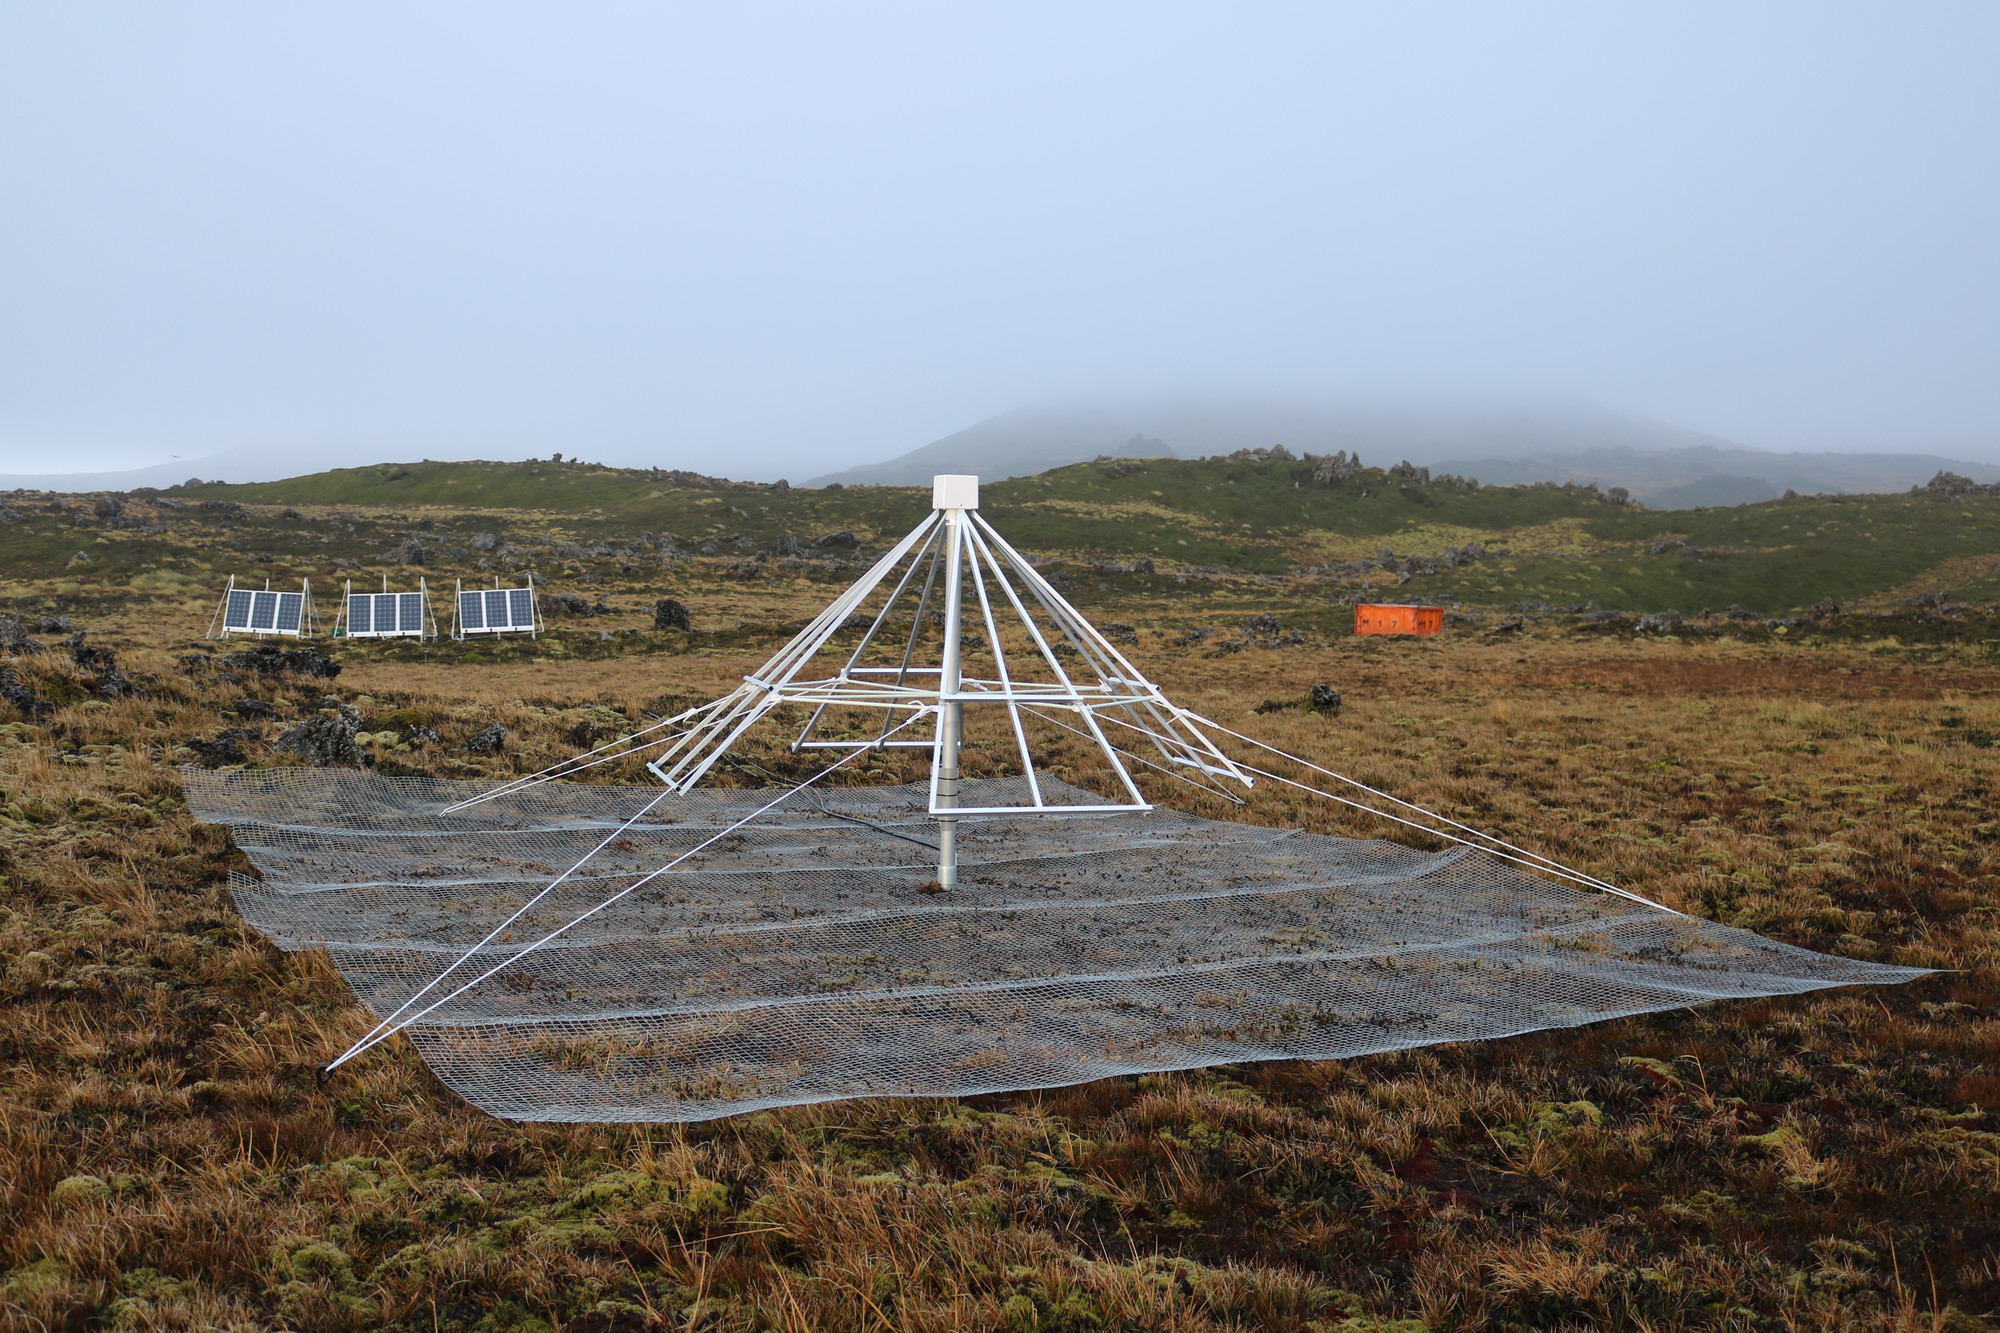
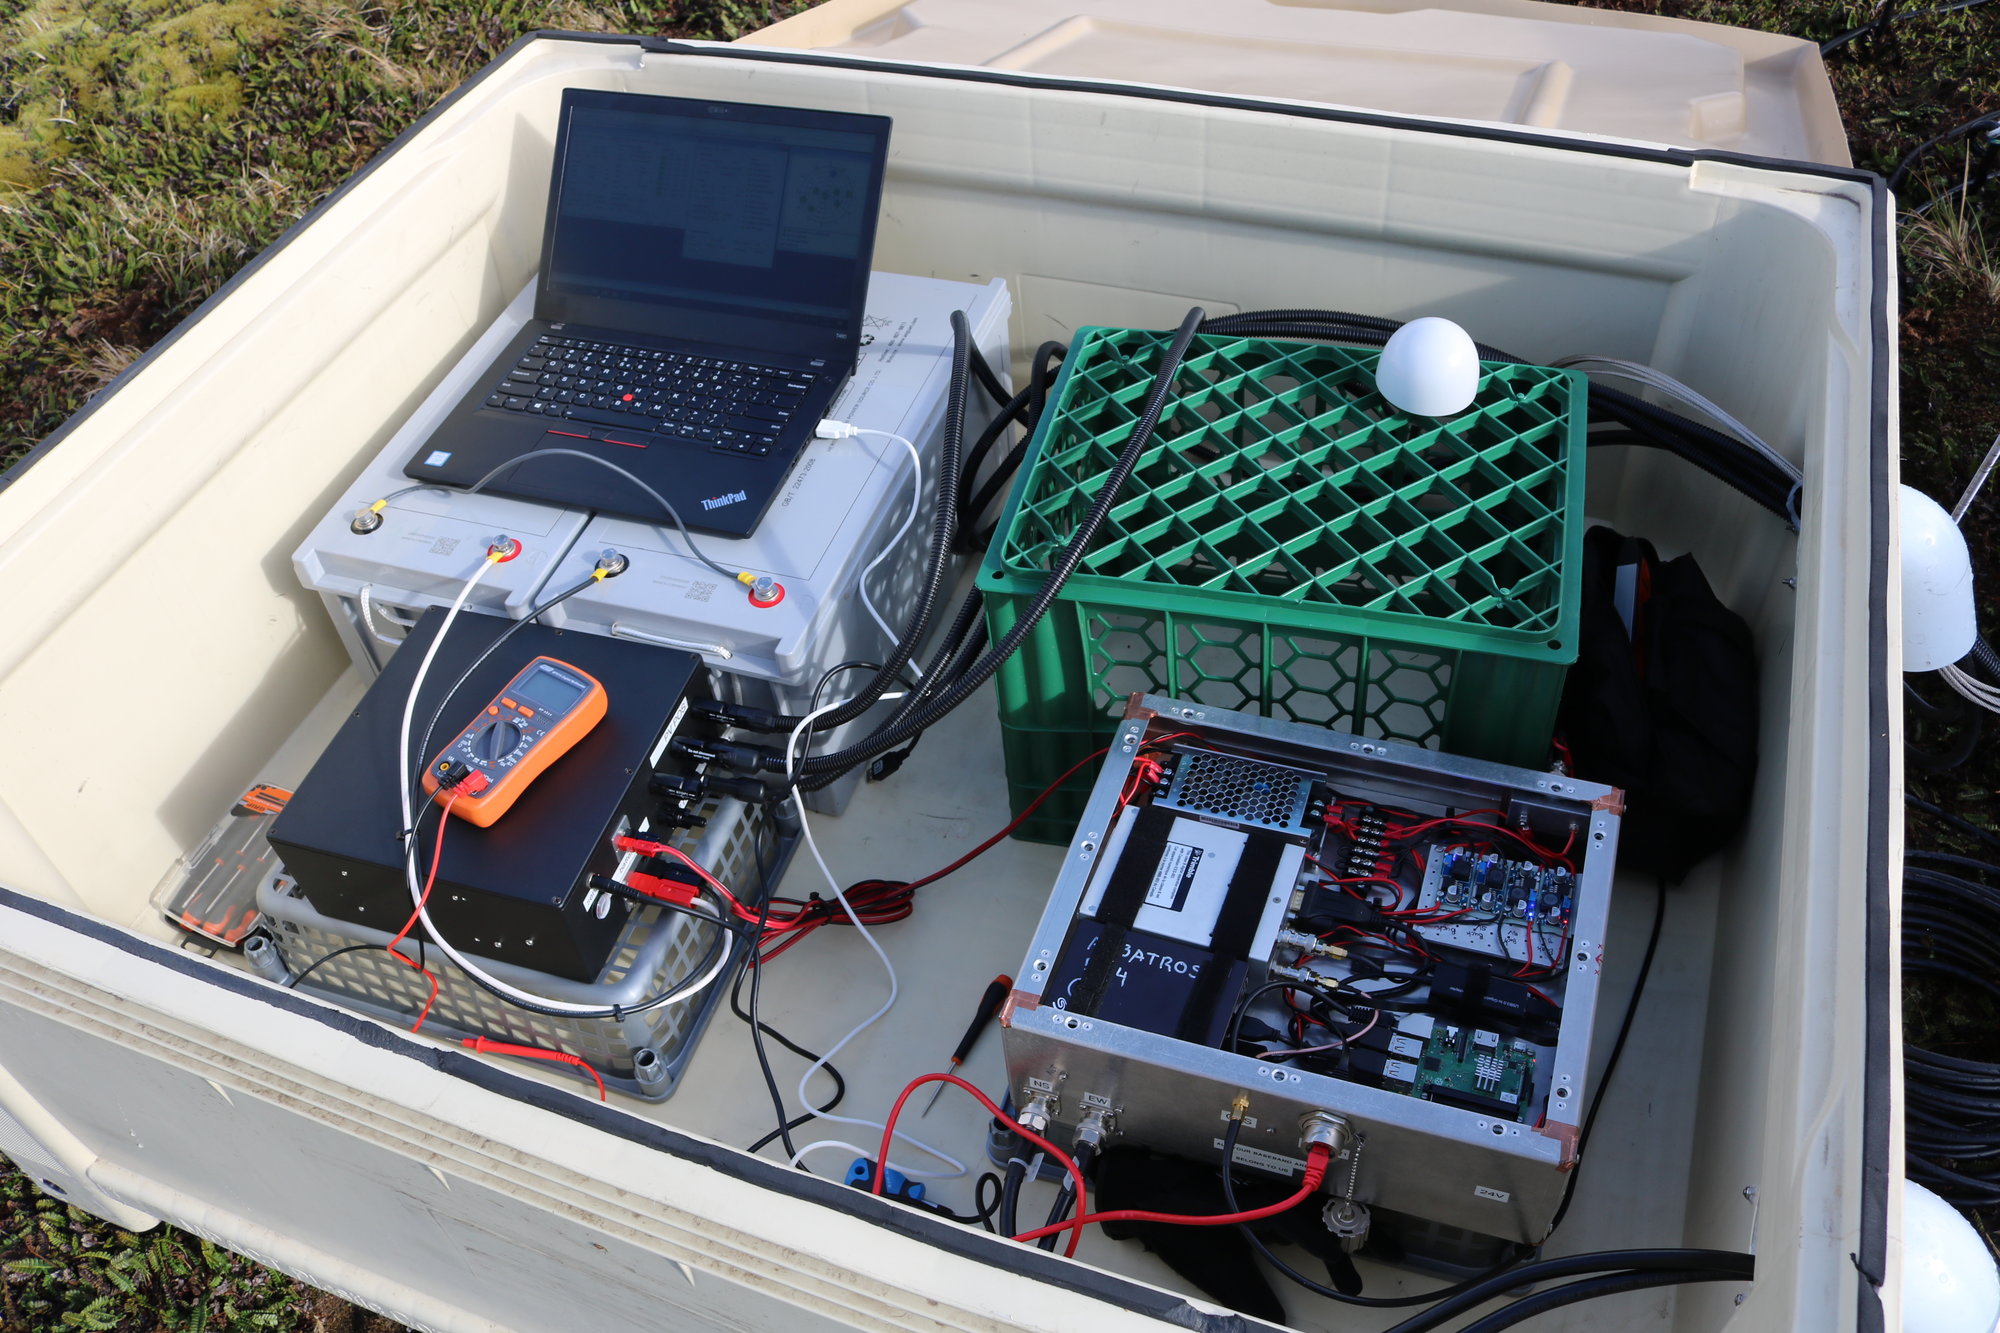

The full ALBATROS configuration will comprise an array of 10 autonomous antenna stations, each recording baseband over tunable frequency windows (with 10–20 MHz total bandwidth) within the full 0–125 MHz operating range. Baseband data will be periodically physically retrieved from each station and subsequently correlated offline. The ALBATROS stations, located at the eight coastal hut sites plus the hydro shack and PRIZM site, will be separated by baselines of km as shown in Figure 2. One fully autonomous ALBATROS station, shown in Figure 5, was deployed in April 2019 at the hydro shack location (S, E) on Marion Island as a first step in testing the technology needed to establish the full array. The system block diagram is shown in Figure 6. The antenna and front-end active balun in the single autonomous station are identical to those used in the two-element pathfinder (§3.1 and §3.2), and the back-end electronics and power system are described in detail below.
4.1 Back-end electronics
The back-end readout electronics are housed in a Faraday cage located 50 m away from the antennas. The analog signal chain consists of a pair of high- and low-pass filters (Mini-Circuits ZFHP-1R2+ and SLP-150+) that together band-limit the signal to 1.2–140 MHz, and the filters are followed by a Mini-Circuits ZFL-500+ amplifier. In contrast to the two-element pathfinder, the low-pass cutoff is increased from 81 MHz to 140 MHz to capture downlink signals at 137–138 MHz from the ORBCOMM satellite constellation. For the final ALBATROS array, the ORBCOMM signals provide a convenient means for synchronization across the antenna stations, serving as a backup to the GPS timing discussed below. Preliminary lab tests suggest that on time scales of s, relative timing between different antenna stations can be measured to an accuracy of better than a few tenths of a nanosecond using a single satellite. The corresponding phase error at 10 MHz is . With publicly available orbits and multiple satellites typically within the field of view, we expect that ORBCOMM baseband data saved at the same time as the astronomical data can provide offline synchronization of the ALBATROS stations. Because the ORBCOMM and science data are recorded at the same time by the same system, improvements to the timing calibration can be applied in post-processing.
As with the two-element pathfinder, a SNAP board digitizes each of the two RF signals at 250 Msamp/s. In the autonomous station configuration, the SNAP board ADCs are locked to a 10-MHz reference produced by a Trimble Thunderbolt E GPS-disciplined clock module. The SNAP board FPGA computes two data products: 1) channelized baseband data for each polarization over tunable frequency windows within the 0–125 MHz operating range, with the options of 1-, 2-, or 4-bit compression, and 2) auto- and cross-spectra from the two polarizations over the full 0–125 MHz span, accumulated over few-second intervals. The reduction in bit depth happens only after the SNAP board has channelized the baseband, and the cross-channel leakage (due to, e.g., RFI and slopes in RF power as seen by the ADCs) is therefore unaffected by the low bit depth. An RPi 3B+ controls the SNAP board and and receives the auto- and cross-spectra via GPIO connections, and the spectra are saved to an on-board SD card. The baseband data are passed from the SNAP board to the RPi via ethernet and written to external hard drives. The introduction of gigabit ethernet with the RPi 3B+ model has enabled the high data throughput associated with writing baseband. As a benchmark, 1-bit baseband recording of two polarizations over 10 MHz of bandwidth yields an approximate data rate of 5 MB/s, or 0.4 TB/day.
4.2 Correlation
The autonomous station can be configured to record 1-, 2-, or 4-bit baseband. Signal fidelity improves with higher numbers of bits, but the penalty is increased data volume. Here we discuss the prospects of employing 1-bit correlation for the final ALBATROS array to keep the baseband data volume to a minimum. While the basics of 1-bit correlation are well known in the limit where the signal level is much lower than the noise, ALBATROS may be in a regime where the signal level is non-negligible. The fundamental output of a 1-bit correlator for real data is
| (1) |
Here is the quantized version of the underlying electric field for antenna index :
| (2) |
Complex data can be handled as the combination of real components. The output is nonlinear in the underlying true signal and noise levels; in the limit of perfectly correlated electric fields, saturates at unity. Recovering the true sky signals requires inverting this nonlinear relation using the Van Vleck corrections (Van Vleck & Middleton, 1966). For a 2-level correlator, the relationship between and the sky signals is (D’Addario, 1989)
| (3) |
where is the true sky visibility, and and are the total, signal-plus-noise, power levels measured by antennas and , respectively. Inverting this relation to obtain requires knowing the total power levels, which cannot be determined from 1-bit data alone. However, as described in §4.1, the SNAP board calculates and records auto-spectrum data products, which provide power level information on few-second time scales. Changes in the power levels occur on significantly longer time scales, so the true sky visibilities can be derived by combining cross-correlation data between different antenna stations and the auto-spectrum data from each individual station.
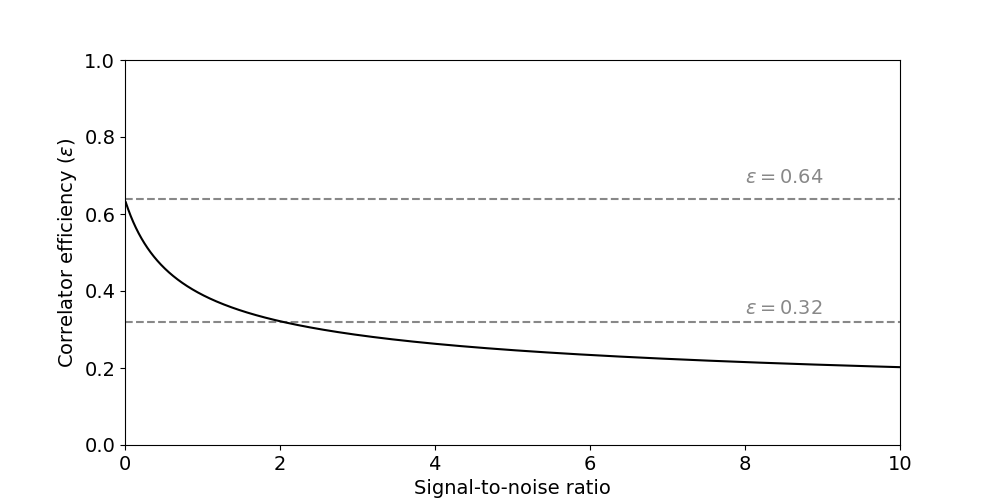
To assess the loss of sensitivity as the signal level increases, we use Equation 3 to derive the correlator efficiency , which is the ratio of measured signal-to-noise ratio (SNR) to the ideal, infinite-precision SNR. Figure 7 illustrates that the decrease in as a function of SNR is relatively shallow. When the SNR is near zero, approaches , and if the signal level increases to two times the noise level, decreases by only a factor of . The final ALBATROS array will have baselines that are long relative to the observing wavelength, and the correlated component of the electric field (which sets the relevant signal level) is likely a small fraction of the total received power. This qualitative argument can by made by considering antennas in the plane in the flat-sky approximation. Any individual antenna receives all power present in the plane (plus system noise), but the correlated contribution comes only from the portion of the plane that is encompassed by the primary beam at the antenna’s -space coordinate. Assuming that the sky can be described as a Gaussian random field, the maximum correlated signal between two antennas is determined by the aperture filling factor of that pair. For the case of dipole antennas, the filling factor is the square of the wavelength divided by the baseline length. Therefore, in the long-baseline limit, the correlated signal is small in comparison to the total power received, and the correlator efficiency is unlikely to decrease significantly from the ideal value. This efficiency behavior remains true even when the brightest radio sources are visible, since the primary beam encompasses more than a steradian solid angle (the sun is irrelevant since ionospheric effects restrict ALBATROS to night-time observing). Centaurus A (Slee & Higgins, 1973) and M1 (Braude et al., 1969) affect the total power expected from the Global Sky Model (de Oliveira-Costa et al., 2008) at only the 10% level. Additionally, as will be shown in §5, preliminary ALBATROS data demonstrate that the visibilities are only a few percent of the total power amplitude, thus indicating that diffuse emission dominates even the brightest sources over the large primary beam.
4.3 Solar power system
Although the first-deployed two-element pathfinder is located at a reasonable walking distance from the main base and uses a manually operated generator to periodically recharge batteries, the bulk of the antenna stations that will comprise the full array will be located at points farther removed from the main base and will therefore require fully autonomous energy sources. For the autonomous station pathfinder, we developed a solar charging system to power the station, and we are investigating small wind turbines for future ALBATROS stations.
The autonomous station is powered by two series-connected, 12 V, deep cycle, lead acid batteries, charged by an array of nine SunPower SPE-E-Flex-110 solar panels. These panels each have a standard test capacity of 110 W. Although only 50 W is required to run the station, the 1 kW charging capacity is intentionally oversized to account for the frequent overcast conditions on Marion. The generous power margin allows the charge level to recover quickly on a short sunny day in winter in the event of charge loss over several consecutive overcast days. The nine solar panels are distributed between three custom designed structures built from aluminum extrusion, with rigid metalized plastic panels backing the semi-flexible solar cells. The structures are oriented due north and are designed to incline the solar panels at a relatively steep angle to maximize performance under winter conditions, when sunlight hours are at their minimum. The solar panel mounts have been designed to withstand frequent gale-force winds on Marion. While the mounting structures themselves appear to be strong enough, the greatest challenge in deployment has been to find adequate anchoring in the volcanic ground. Each group of three panels is wired in series, and the three series strings are connected in parallel to a Victron BlueSolar MPPT 5035 charge controller, which optimizes power transfer from the solar array when charging is required, and also monitors charge level, reducing output current when the battery bank is fully charged.
The power logging and control system runs on an Arduino, which logs information received from the Victron charge controller to an SD card, and switches power on and off to the readout electronics box. Logged power data will be used to refine power system requirements for future autonomous station deployments. The on/off control is necessary to prevent battery system damage from overly deep discharge. The system can also be configured to conserve battery power by running on a schedule between particular hours, typically overnight, when ionospheric conditions are more favorable. The power logging and control system, along with the Victron charge controller and an EMI filter, are housed together in an aluminum box. The EMI filter reduces conducted emissions on the photovoltaic side of the solar charge controller, which could radiate from the solar array and connecting wires. (Data collected during the night are not at risk of solar charge controller EMI contamination.)
5 Preliminary observations
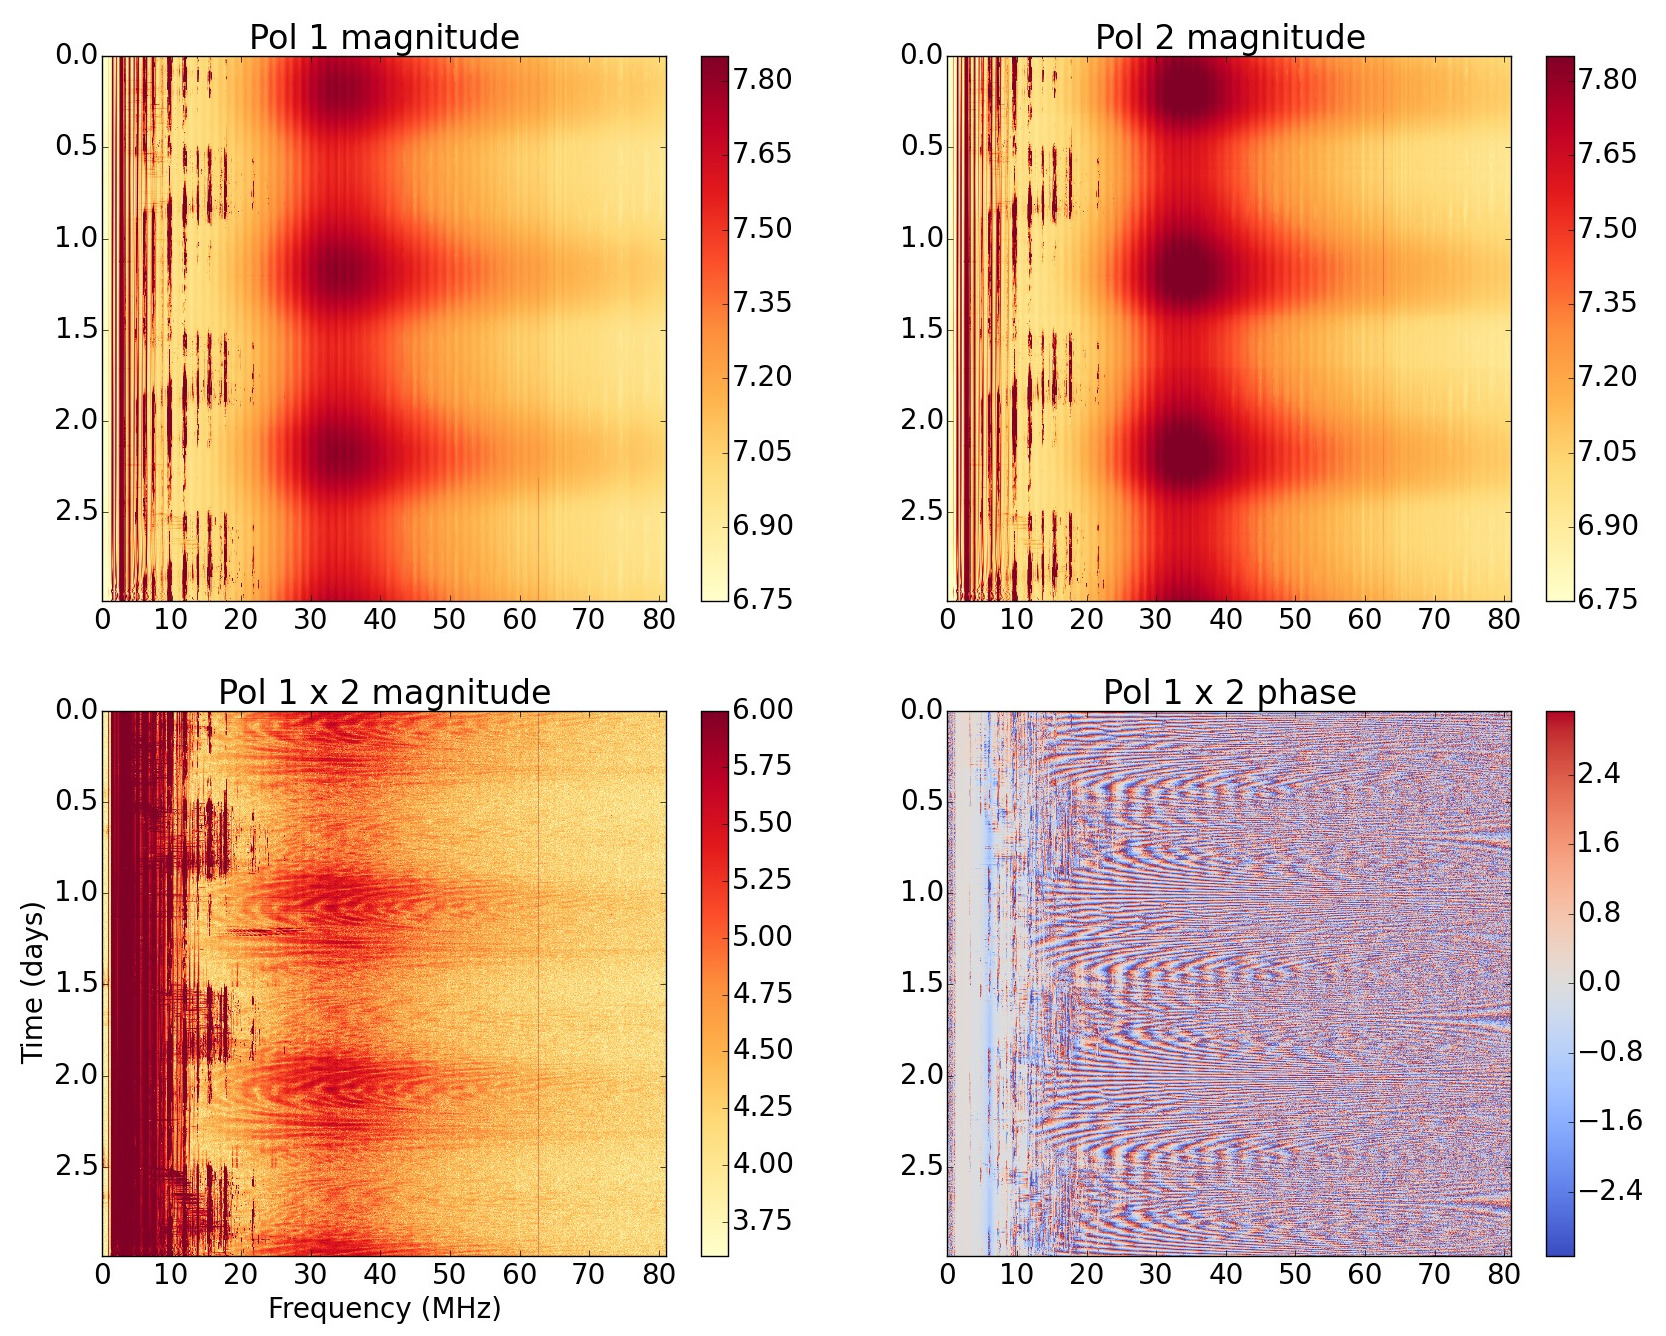
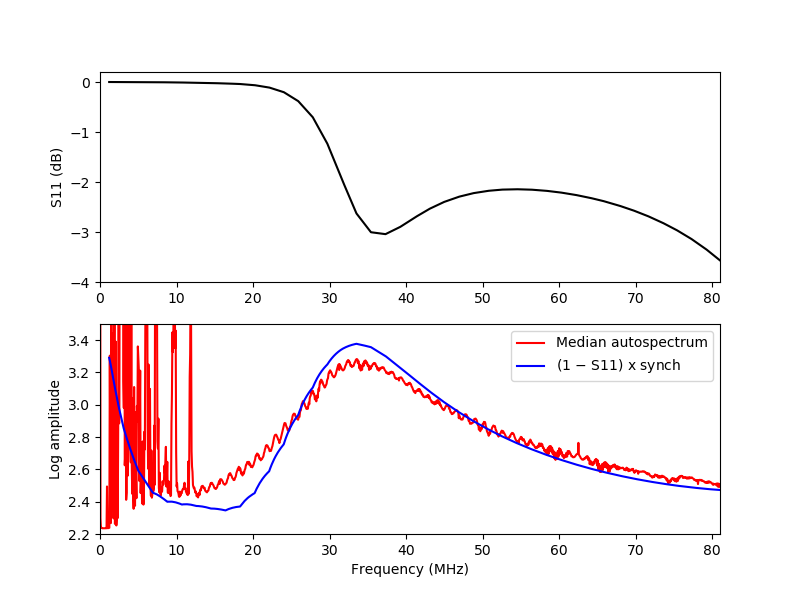
The primary goal of the two-element pathfinder described in §3 was to qualitatively assess the level of RFI and ionospheric contamination at low frequencies. Figure 8 illustrates auto- and cross-spectra from one of the co-aligned polarization pairs from the two antennas. The data are shown over a three-day period (June 18–21, 2018), and no calibration or cuts have been applied. The rising and setting of the Galaxy is visible in all of the spectrum magnitudes, and repeatable fringes are visible in the phases of the cross-spectra. The signal drop-off below MHz in the autospectra is caused largely by the combined response of the LWA antenna and FEE, as illustrated in Figure 9. Although the LWA antenna is not optimized for the lowest ALBATROS observing frequencies, as described in §3.1, it is sufficient for these initial, exploratory measurements. The RFI lines at MHz arise primarily from shortwave radio transmission reflecting off the ionosphere and are roughly a factor of two fainter in the cross-spectrum magnitude in comparison to the autospectrum. During the night, when the ionospheric plasma cutoff frequency drops, the maximum frequency of the RFI contamination falls to MHz.
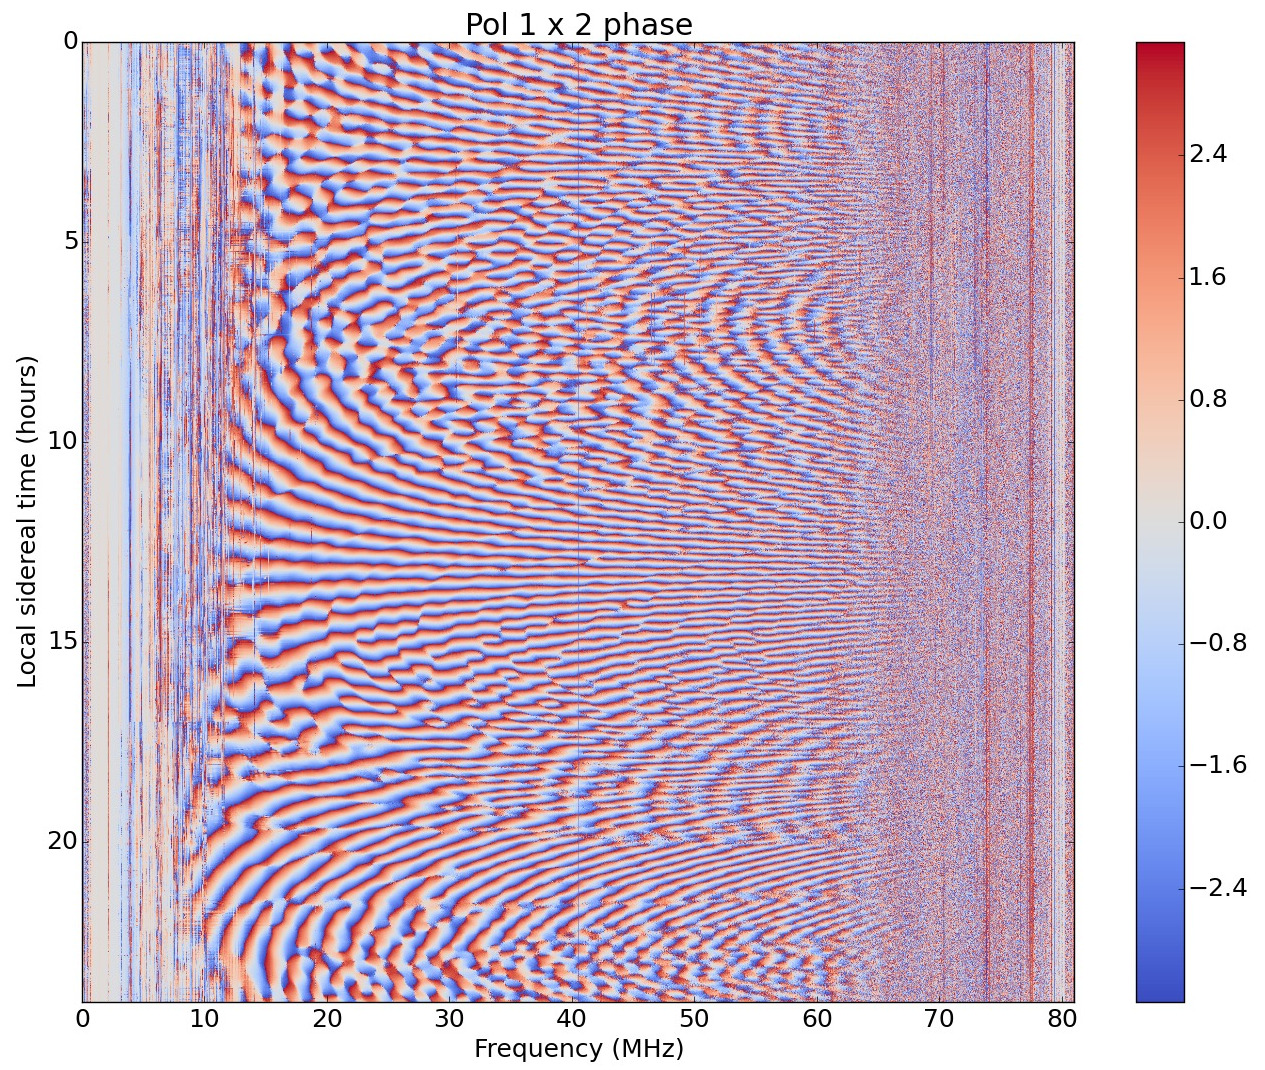
We can estimate the instrumental gain stability by comparing the total power between the different days shown in Figure 8. We find that the RMS gain fluctuations between 30 and 40 MHz (where the Galactic signal peaks in the data) are less than 1%. The typical noise on 3-second time scales is roughly 0.04% of the power. The low noise suggests that relative calibration, using autospectra recorded by each autonomous station, can yield sub-percent accuracy. (Absolute calibration in the future will be derived by comparing autospectra against PRIZM, which is co-located and absolutely calibrated, or the Global Sky Model.) As a qualitative illustration of the sky signal repeatability on smaller scales, Figure 10 shows the phases of the cross-spectra binned in local sidereal time. About 372 hours of data are averaged into this plot, and no RFI excision has been performed. A more detailed analysis of signal repeatability will be presented in a future paper, but the high signal-to-noise fringe pattern, which is even visible slightly below MHz, demonstrates the proof of concept for building the expanded ALBATROS array.
We have been unable to retrieve data from the single autonomous station pathfinder on Marion (§4) because of COVID-19 restrictions and limited bandwidth to the island, although we have confirmed that the solar power system has successfully met the power demands of the antenna station. To demonstrate baseband writing capability in the absence of Marion data, we instead present a short observation that was taken by a separate, single-element ALBATROS pathfinder station that operated from the McGill Arctic Research Station (MARS; N, W) on Axel Heiberg Island, Nunavut, during July 2019. The RF signal chain of the MARS installation had the same architecture as that shown in Figure 6, but the power was supplied by manually charged batteries, rather than a solar power system. The MARS RFI environment is somewhat noisier than that of Marion Island, and because the data were taken during the height of Arctic summer, the ionospheric plasma cutoff frequency is higher than the typical cutoff reflected in the Marion data. Despite the differences in the power configuration and RFI environment, the MARS installation is suitable for illustrating baseband data writing.
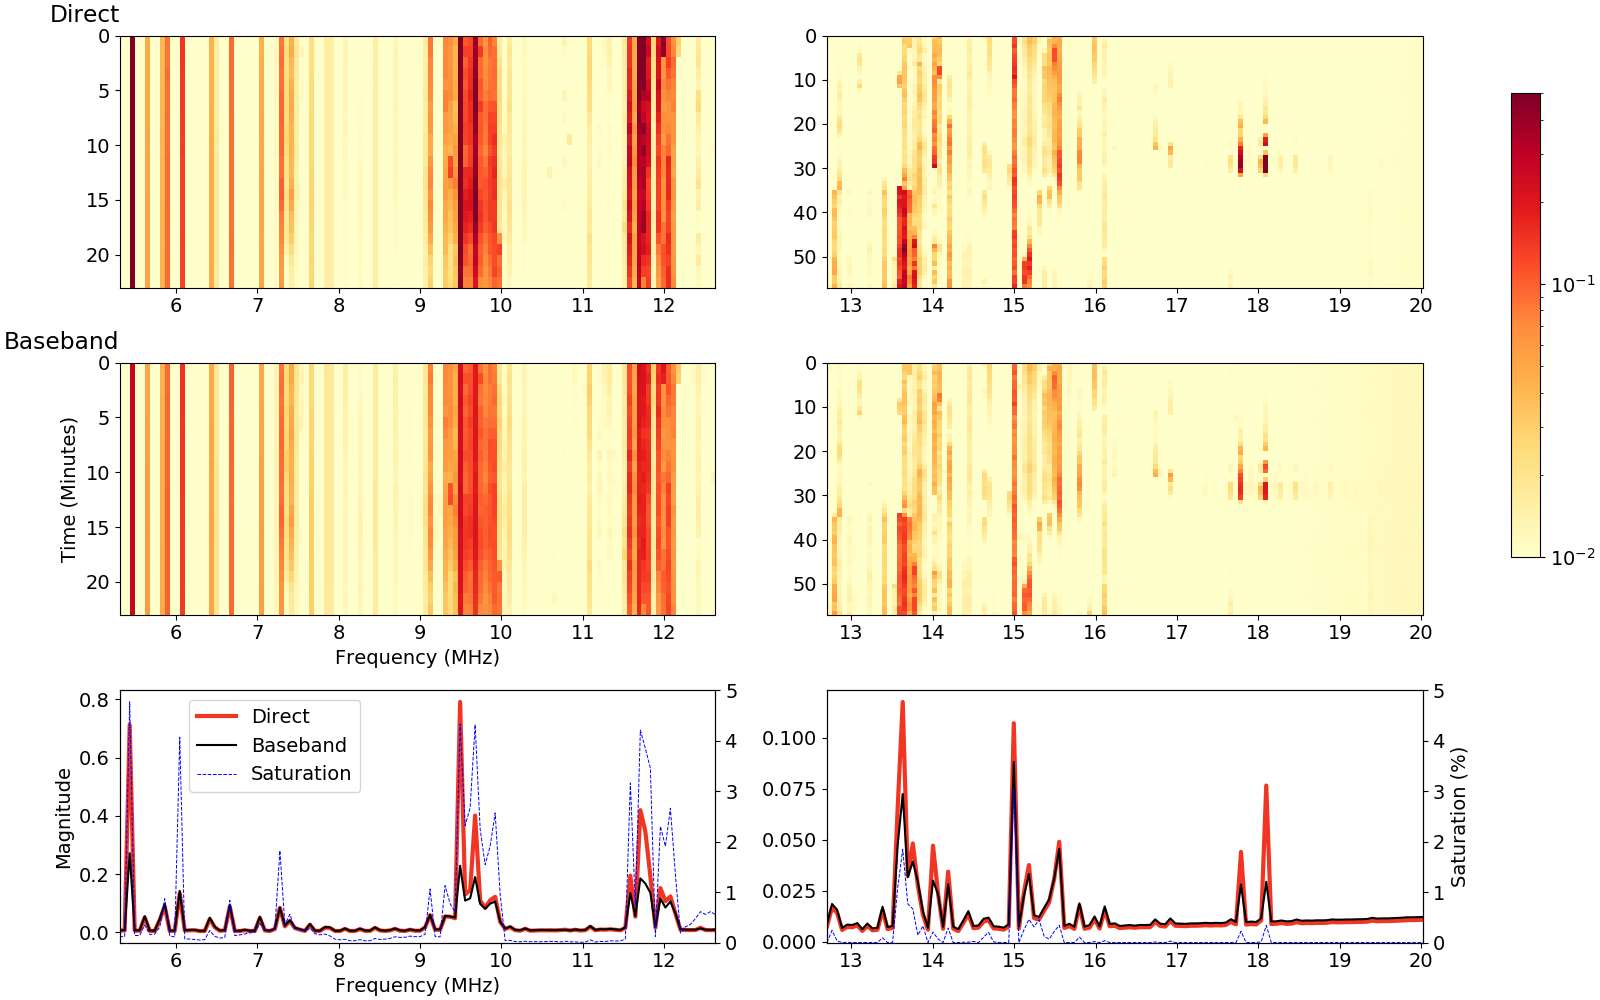
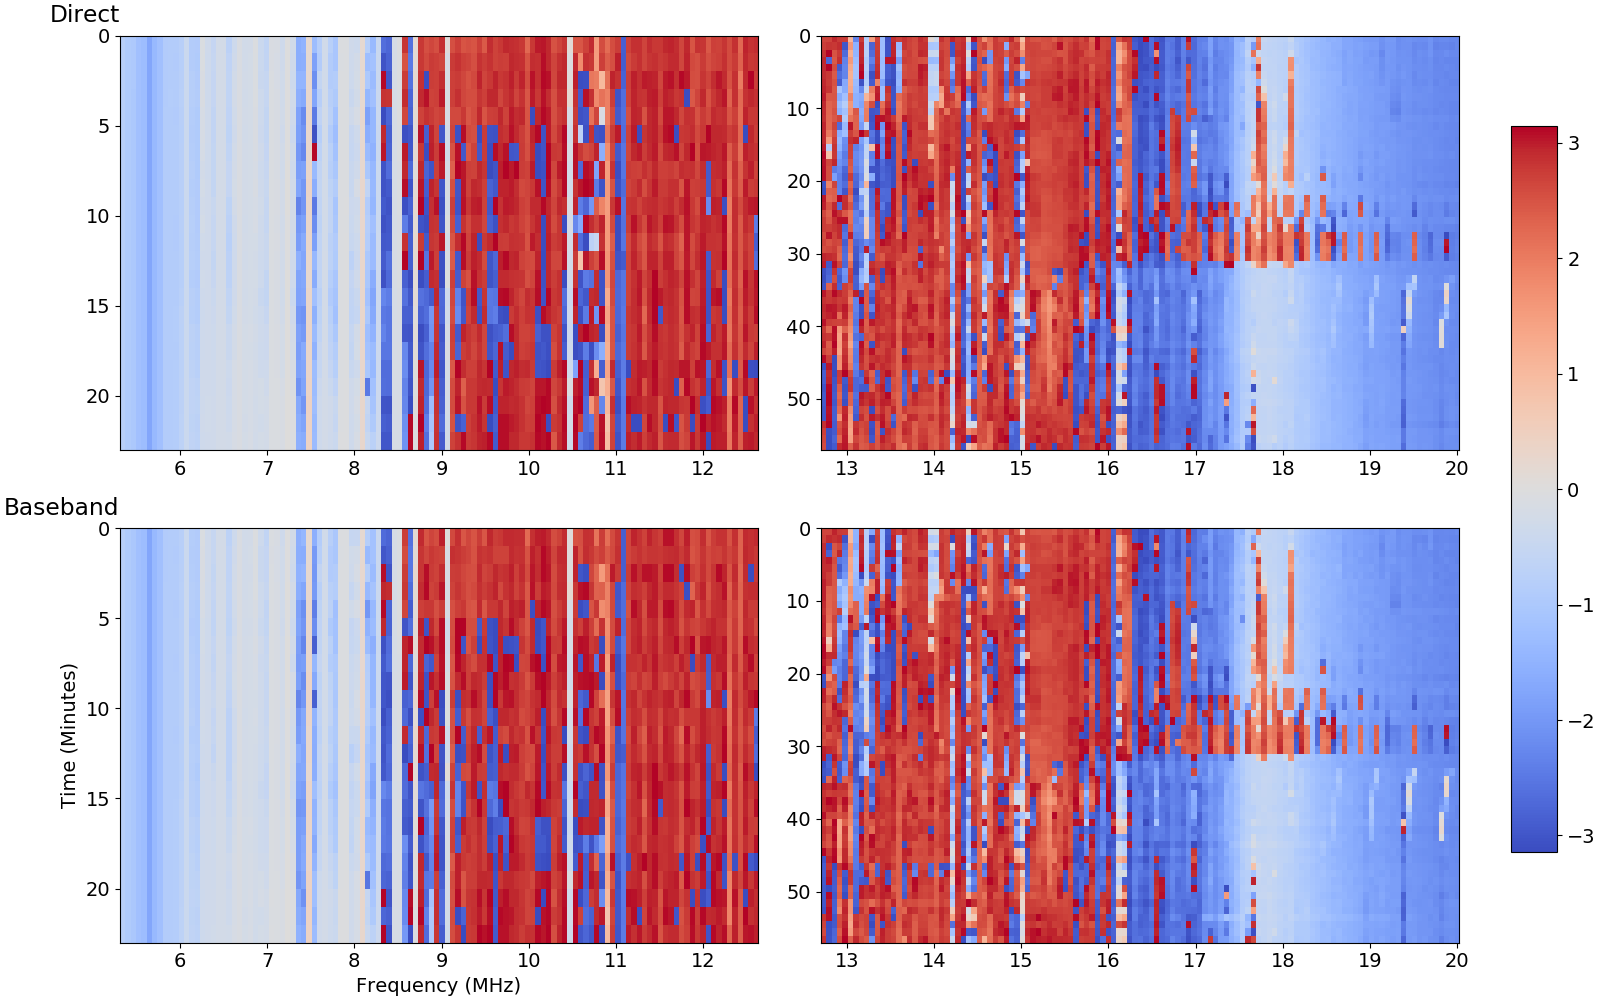
We present short segments of baseband data that were recorded over two adjacent frequency windows, 5.3–12.6 MHz and 12.6–20.0 MHz, at separate times. The baseband data were recorded with 4-bit quantization to preserve autospectrum information, which is not available with 1-bit quantization. Figure 11 shows autospectra for one polarization of the ALBATROS pathfinder installed at MARS, comparing the accumulated spectra that are directly computed by the SNAP board against spectra that are calculated from baseband data. All of the waterfall plots have the same 61-kHz frequency resolution, set by the resolution of the spectra computed by the SNAP board. The waterfall plots are shown with a logarithmic scale to highlight the qualitative agreement between the directly-accumulated and baseband spectra for bright and faint spectral features. The bottom panels show the time-averaged spectra on a linear scale to illustrate differences in bright RFI features that saturate the baseband data. The fraction of baseband data with values at the 4-bit extrema are overplotted with spectra, and there is agreement between the directly-accumulated and baseband spectra except when significant saturation is present. Figure 12 shows waterfall plots of phases computed from the cross-correlation between the two orthogonal polarizations of the ALBATROS pathfinder at MARS, comparing the directly accumulated and baseband data. Both sets of recorded data qualitatively agree, up to small differences caused by the 4-bit quantization.
6 Summary and future outlook
We have presented the design of ALBATROS, a new interferometer that will image the radio sky at MHz using an array of autonomous antenna stations installed on Marion Island. With a two-element, directly correlated pathfinder, we have demonstrated that clear, repeatable sky signal is visible from Marion down to MHz with no data processing or cuts. We have constructed the first prototype autonomous ALBATROS station powered by solar panels, and we have successfully tested the electronics and software for recording baseband data.
With the proof of concept demonstrated from the pathfinder instruments presented here, we plan to improve the design of the future ALBATROS stations that will be installed at the coastal huts on Marion. The LWA antenna and FEE are currently not optimized for the lowest ALBATROS observing frequencies, and we are investigating possible modifications to the antenna and FEE designs to improve the low frequency response, as well as building in calibration circuitry. Because the future ALBATROS stations will be located farther from the base and will be more difficult to access on a regular basis, each station will require larger total hard drive volume to store baseband data over extended periods of time. We are developing a custom low-power hard drive bank with TB total storage capacity that will employ a USB multiplexer to select and power only one hard drive at a time. The autonomous station pathfinder presented here uses solar panels to charge the batteries, and we are investigating the use of small wind turbines as a possible alternative for future stations. We are also developing analysis tools to compute time-domain data from the recorded channelized baseband by inverting the polyphase filter bank while minimizing artifacts from quantization and saturation.
In addition to Marion Island, we are also planning on installing a second ALBATROS array at MARS in the high Arctic. As described in §5, a single pathfinder antenna was installed in July 2019 and observed for about three weeks to assess the RFI environment and ionospheric conditions. When fully operational, the Marion and MARS ALBATROS installations will provide new views of the low-frequency sky across both hemispheres.
Acknowledgments
We gratefully acknowledge the National Research Foundation (grant number 110929), the South African National Antarctic Programme, the Natural Sciences and Engineering Research Council of Canada (grant number RGPNS-2019-534549), and the Polar Continental Shelf Program for providing funding and logistical support for our research program. This research was undertaken, in part, thanks to funding from the Canada 150 Program. This research was enabled in part by support provided by SciNet(https://www.scinethpc.ca/) and Compute Canada (www.computecanada.ca). The financial assistance of the South African SKA Project (SKA SA) towards this research is hereby acknowledged (www.ska.ac.za). We additionally extend our sincere gratitude to the staff at SKA SA for hosting our lab tests. We thank the South African National Space Agency for their technical support, the crew of Ultimate Heli for safely delivering us and our cargo, and all of the Marion takeover and winter team members who provided invaluable advice and field help. The authors also wish to thank members of the LWA and RAPID collaborations for useful discussions, and Raul Monsalve for helping make our first MARS campaign a success.
References
- Alexander et al. (1975) Alexander, J. K., Kaiser, M. L., Novaco, J. C., Grena, F. R., & Weber, R. R. 1975, A&A, 40, 365
- Bhowmik & Nandy (2018) Bhowmik, P., & Nandy, D. 2018, Nature Communications, 9, 5209
- Bilitza (2018) Bilitza, D. 2018, Advances in Radio Science, 16, 1
- Braude et al. (1969) Braude, S. Y., Lebedeva, O. M., Megn, A. V., Ryabov, B. P., & Zhouck, I. N. 1969, MNRAS, 143, 289
- Caswell (1976) Caswell, J. L. 1976, MNRAS, 177, 601
- Chen et al. (2019) Chen, X., Burns, J., Koopmans, L., et al. 2019, arXiv e-prints, arXiv:1907.10853
- D’Addario (1989) D’Addario, L. R. 1989, in Astronomical Society of the Pacific Conference Series, Vol. 6, Synthesis Imaging in Radio Astronomy, ed. R. A. Perley, F. R. Schwab, & A. H. Bridle, 59
- de Oliveira-Costa et al. (2008) de Oliveira-Costa, A., Tegmark, M., Gaensler, B. M., et al. 2008, MNRAS, 388, 247
- Eastwood et al. (2018) Eastwood, M. W., Anderson, M. M., Monroe, R. M., et al. 2018, AJ, 156, 32
- Elingson & Kramer (2004) Elingson, S. W., & Kramer, W. T. 2004, LWA Memo Series
- Gnedin et al. (2009) Gnedin, Y. N., Mihajlov, A. A., Ignjatović, L. M., et al. 2009, New A Rev., 53, 259
- Hickish et al. (2016) Hickish, J., Abdurashidova, Z., Ali, Z., et al. 2016, Journal of Astronomical Instrumentation, 5, 1641001
- Hicks et al. (2012) Hicks, B. C., Paravastu-Dalal, N., Stewart, K. P., et al. 2012, PASP, 124, 1090
- Kero et al. (2014) Kero, A., Vierinen, J., McKay-Bukowski, D., et al. 2014, Geophys. Res. Lett., 41, 5370
- Koopmans et al. (2019) Koopmans, L., Barkana, R., Bentum, M., et al. 2019, arXiv e-prints, arXiv:1908.04296
- Loeb & Zaldarriaga (2004) Loeb, A., & Zaldarriaga, M. 2004, Phys. Rev. Lett., 92, 211301
- Peterson & Webber (2002) Peterson, J. D., & Webber, W. R. 2002, ApJ, 575, 217
- Philip et al. (2019) Philip, L., Abdurashidova, Z., Chiang, H. C., et al. 2019, Journal of Astronomical Instrumentation, 8, 1950004
- Pritchard & Loeb (2012) Pritchard, J. R., & Loeb, A. 2012, Reports on Progress in Physics, 75, 086901
- Reber & Ellis (1956) Reber, G., & Ellis, G. R. 1956, J. Geophys. Res., 61, 1
- Roger et al. (1999) Roger, R. S., Costain, C. H., Landecker, T. L., & Swerdlyk, C. M. 1999, A&AS, 137, 7
- Slee & Higgins (1973) Slee, O. B., & Higgins, C. S. 1973, Australian Journal of Physics Astrophysical Supplement, 27, 1
- Stepkin et al. (2007) Stepkin, S. V., Konovalenko, A. A., Kantharia, N. G., & Udaya Shankar, N. 2007, MNRAS, 374, 852
- Van Vleck & Middleton (1966) Van Vleck, J. H., & Middleton, D. 1966, Proceedings of the IEEE, 54, 2
- Zakharenko et al. (2016) Zakharenko, V., Konovalenko, A., Zarka, P., et al. 2016, Journal of Astronomical Instrumentation, 5, 1641010
- Zarka et al. (2015) Zarka, P., Tagger, M., Denis, L., et al. 2015, in 2015 International Conference on Antenna Theory and Techniques (ICATT), 1–6
- Zheng et al. (2017) Zheng, H., Tegmark, M., Dillon, J. S., et al. 2017, MNRAS, 464, 3486