Weak-measurement-induced phases and dephasing: broken symmetry of the geometric phase
Abstract
Coherent steering of a quantum state, induced by a sequence of weak measurements, has become an active area of theoretical and experimental study. For a closed steered trajectory, the underlying phase factors involve both geometrical and dynamical terms. Furthermore, considering the reversal of the order of the measurement sequence, such a phase comprises a symmetric and an antisymmetric term. Superseding common wisdom, we show that the symmetric and the antisymmetric components do not correspond to the dynamical and geometrical parts respectively. Addressing a broad class of measurement protocols, we further investigate the dependence of the induced phases on the measurement parameters (e.g., the measurement strength). We find transitions between different topologically distinct sectors, defined by integer-valued winding numbers, and show that the transitions are accompanied by diverging dephasing. We propose experimental protocols to observe these effects.
I Introduction.
Geometrical phases are a cornerstone of modern physics [1]. The work of Berry [2] provided a unifying language that is key to understanding disparate phenomena including the quantum Hall effect [3, 4] and topological insulators [5], sheds light on some features of graphene [6, 7], and provides the basis for geometric [8, 9] and topological [10] quantum computation platforms. Geometrical phases can be induced not only by means of adiabatic [2] or non-adiabatic [11, [Seealso]Wood2020] Hamiltonian manipulation, but also as a result of a sequence of projective measurements [13, 14, 15]. In that case, the phase is called the Pancharatnam phase, after the Indian physicist who discovered it in the context of classical optics [16]. Recently, the possibility of inducing geometrical phases by weak measurements [17, 18] was demonstrated experimentally [19]. Moreover, a topological transition in the behavior of the geometrical phase as a function of the measurement strength has been predicted theoretically [20].
Here we outline a general framework for treating measurement-induced phase factors and apply it to a broad class of measurements. Our analysis addresses the nature of the phase accumulated during a sequence of weak measurements, a generalization of the concept of the geometrical Pancharatnam phase in the case of strong (projective) measurements. In previous investigations, measurement-induced phase factors were of a purely geometric origin [13, 19, 20]. In the presence of an additional Hamiltonian acting on the measured system, an additional dynamical component appears [14]. We demonstrate that weak-measurement-induced phases generically involve both geometrical and dynamical components even in the absence of an additional Hamiltonian. This fact went unnoticed in earlier studies that focused on restricted classes of measurements. Quantum measurements are characterized by Kraus operators describing the consequent back-action [21, 22, 23]. While previous works focused on the case of Hermitian Kraus operators, in the more general case of non-Hermitian Kraus operators, considered here, not all of measurement-induced phases can qualify as geometrical.
We also investigate the behavior of the phase with respect to reversing the order of the measurement sequence. The fact that there is no definite symmetry with respect to such a reversal implies that measurement-induced phases can be split into a symmetric and an antisymmetric components. Interestingly, and superseding the common structure of phases generated by conventional adiabatic Hamiltonian dynamics, the symmetric and antisymmetric components do not coincide with the dynamical and geometrical components respectively.
These general insights are then demonstrated through the analysis of specific measurement protocols. We study two types of such protocols: one which involves postselection, and a second which involves averaging over all measurement outcomes (i.e., no postselection). Postselection refers to selecting experimental runs that yield a desired set of measurement readouts. An important quantity here is the postselection probability, i.e., the probability to have a predesignated readout sequence. Concerning the other protocol, one averages the readout-sequence-dependent phase over many experimental runs, which gives rise to a suppression factor a.k.a. dephasing.
Finally, we focus on topological transitions in the context of measurement-induced phases. Previously, such transitions were predicted for a restricted class of measurements with Hermitian back-action [20]. Here we show that such transitions may still take place when the backaction is non-Hermitian. Under such general back-action, multiple distinct topological sectors exist, forming a rich “phase diagram”. Transitions between such sectors are marked by (i) a vanishing probability of the corresponding postselected sequence (the case of postselective protocols); (ii) diverging dephasing (the case of averaging protocols).111A short exposition of our results pertaining to topological transitions in the averaging protocols can be found in Ref. [24]. We also propose and analyze experimental setups that may test our predictions.
The paper is organized as follows. Section II first recaps the theory of generalized quantum measurements. We then define measurement-induced phases, and discuss their classifications into dynamical/geometrical and symmetric/antisymmetric terms and the relation between these two classifications. In Section III we specify the measurements and protocols to be employed. We derive and analyze analytic expressions for the induced phases, the postselection probabilities, and the dephasing factors. Section IV presents a mostly numerical analysis of the topological transitions vis-a-vis postselective protocols. Section V presents a similar analysis for the phase-averaging protocol. In Section VI we discuss possible experimental implementations. Conclusions are presented in Section VII. Three appendices of technical nature are included. Appendix A presents a justification of our choice of scaling of the measurement parameters with the number of measurements, cf. Sec. III. Appendix B provides an analytic derivation of the critical line of topological transitions in the postselective protocol, cf. Sec. IV. Appendix C provides the justification for the averaged phase detection scheme proposed in Sec. VI.
II Weak-measurement-induced phases: definitions and general analysis
In this section, we present a general analysis of measurement-induced phase factors. We briefly recall the theory of generalized quantum measurements in Sec. II.1. We then proceed to define postselected and averaged measurement-induced phases in Sec. II.2. We analyze various characteristics of these phases and discuss possible classifications thereof in Sec. II.3.
II.1 Theory of generalized measurements
Describing a conventional projective measurement in quantum theory requires a Hermitian observable of the measured system. The observable has a set of eigenstates labeled by its eigenvalues , . A projective measurement yields a readout which corresponds to one of the eigenvalues . If a readout is obtained, the system state becomes , where is the system state before the measurement and is the projector onto the corresponding eigenstate of (generalization to the case of a degenerate spectrum is straightforward). Note that is not normalized. The probability of the projective measurement yielding is .
Generalized measurement [21, 22, 23] is an extension of the orthodox concept of projective measurement. The extension is based on treating the detector as an additional quantum-mechanical object. The measurement is then conceptually described as a two-step protocol: (i) the system is coupled to the detector, and then decoupled; (ii) the detector is measured projectively. The strength of the interaction between the system and the detector defines the measurement strength.
The formal description of such a protocol is as follows: Let the system initial state be in the system Hilbert space and the detector initial state be in the detector Hilbert space . During the first step, they interact via Hamiltonian which vanishes outside the interval (i.e., the interaction Hamiltonian is switched on at and off at ). In the second step, the detector is measured projectively with readouts corresponding to some basis in the detector’s Hilbert space. The outcome of the first step is the evolution of the system-detector state
| (1) |
where stands for time ordering; the last equality represents a decomposition that can be performed for any pure state in the system-detector Hilbert space . For a specific system-detector Hamiltonian and detector’s initial state , the resulting system state can be written as [22]
| (2) |
where the Kraus operators
| (3) |
represent the measurement’s non-local backaction, following the detector’s projective readout. The probability of obtaining a specific readout is
| (4) |
Conservation of probability, , independently of the system’s initial state, , implies
| (5) |
where is the identity operator acting in the system’s Hilbert space. This is the only restriction on the Kraus operators, which otherwise are arbitrary.222Anticipating the use of multiple measurements in our protocols below, we comment on the relation between the dynamics of a system under measurement and the dynamics of an open system. Indeed, a detector can be regarded as the system’s environment, putting the measurement-induced dynamics into the framework of open quantum systems. However, the formal analogy is incomplete without emphasizing a key difference between the meaurement-induced and open-system dynamics. The standard treatement of an open system does not consider modulating the system-environment coupling, nor directly controlling the environment in the course of experiment. As a result, a classification into Markovian and non-Markovian open system dynamics (depending on the environment properties) arises. In contrast, measurement-based dynamics includes the following aspects: modulating system-detector couplings to separate distinct measurements, reading out the detector, and preparing the detector in a specific initial state before the next measurement. As a result, the measurement-induced dynamics is non-Markovian on the scale of a single measurement (as the detector does not relax and thus preserves memory of the system’s previous states during the measurement), but is Markovian beyond the single-measurement timescale (the detector is read out and initialized before each measurement; therefore, the result of a measurement depends only on the system state at the beginning of the measurement, and not on the previous system states/measurement readouts).
One thus sees that a description of a generalized quantum measurement does not require microscopic modeling of the detector. It is sufficient to specify the set of possible readouts and the corresponding Kraus operators acting on the system. The Kraus operators are thus the analogues of the projection operators that describe the back-action of a projective measurement. If the Kraus operators are Hermitian and then they can be interpreted as projectors and the generalized measurement scheme reduces to the projective measurement scenario.
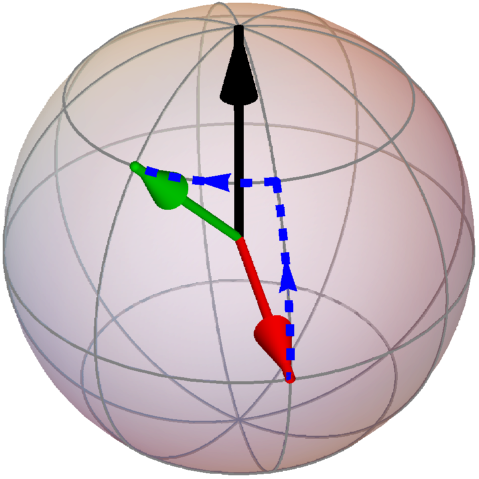
It is important to realize the following difference between projective and generalized measurements. In a projective measurement, a specific readout always corresponds to the system being collapsed onto a specific state following the measurement. This is not necessarily so for generalized measurements. Indeed, knowing the initial state and the readout , one finds the system state after the measurement according to Eq. (2). However, knowing the measurement readout alone does not suffice for the determination of . An example of the generalized measurement back-action is presented in Fig. 1.
It is instructive to understand how the system observable measured, the system-detector interaction Hamiltonian, and the Kraus operators are related. For that, consider a simple canonical example of the system-detector Hamiltonian,
| (6) |
where is the system observable measured, is an operator acting in the detector Hilbert space , is the coupling strength, and
| (7) |
Note that the same measurement setup (the same system and detector, same detector initial state, same detector readout basis) can be used with different observables . In particular, with observables of the form , where is a unitary rotation in the system Hilbert space. The back-action of the measurement then changes
| (8) |
Equation (8) defines a family of measurements of the “same class”. Modifying the system-detector interaction, e.g., by selecting an observable with a different spectrum, modifies the nature of the measurement at hand, thus introducing a different measurement class. The measurement class may be altered even more drastically, e.g., by keeping the same observable but taking a different detector (with different operator , different initial state , different readout basis or even different Hilbert space ). Thus, measurements of different classes can apply to the same observable but yield drastically different back-actions or even have different sets of possible readouts . In principle, nothing prevents us from implementing measurements of different classes on a given system at different times.
II.2 Measurement-induced phases
Consider a sequence of distinct measurements performed on a quantum system. Each measurement is fully characterized by a set of Kraus operators, , where is the measurement number and is the measurement readout. These can be measurements of the same class, yet measuring different system observables (e.g., same strength measurements of the spin projection onto different directions), in which case
| (9) |
where is a unitary rotation in the system Hilbert space and the Kraus operator does not depend on . This is the case for the example considered in Ref. [20] and for the one discussed in Sec. III. However, in the present section we keep the analysis general. In particular, we allow for situations where the Kraus operators for different measurements are not simply related and even the number of possible readout values, , for different measurements can be different.
Consider a system prepared in a certain initial state . Assuming knowledge of all readouts of the measurement sequence, the system state traverses a sequence of states
| (10) |
We choose the last measurement to be projective and postselect the final state such that it coincides with the system’s initial state, i.e., . Then the system state after completing the entire sequence of measurements,
| (11) |
differs from the initial state by a factor
| (12) |
This factor has two components: is the probability to observe the readout sequence , while is the phase factor accrued by the state due to undergoing measurement-induced evolution. In what follows we refer to as the postselected measurement-induced phase.333It is known that the phase of an individual quantum state can be chosen arbitrarily, which is often referred to as the gauge freedom. The phase defined here is gauge-invariant. In order to understand this, consider the two potential sources of non-gauge-invariance. One source is the freedom of choosing the phase of the initial state . One immediately sees that this freedom does not affect Eq. (12); the physical reason is that, just as in Ref. [2], the phase is defined via comparison of the state after some process with the system’s initial state. The second source is the gauge freedom associated with choosing the phase of the detector states and , which would affect the phase of the the Kraus operators , cf. Eq. (3). This freedom is, however, eliminated by demanding that when the system does not interact with detectors (), no phase is accumulated. In the practice (cf. the experimental setups proposed in Sec. VI.1), both of these theoretical sources of gauge non-invariance are made inconsequential by the structure of the interferometer, which ensures that (i) the unaffected initial state is compared to the state after a sequence of measurements, directly implementing the first theoretical argument; (ii) the detector preparation and readout is performed independently of the path taken by the particle, therefore, any phases associated with “cancel out” in the interference pattern. In the case where all the measurements are projective, reduces to the projective-measurement-induced Pancharatnam phase [16, 13, 15].
It is also possible to define the averaged measurement-induced phase through
| (13) |
where the sum runs over all possible readout sequences (such that ). is the averaged measurement-induced phase. The real parameter has a mixed meaning. It characterizes the dephasing due to averaging over various measurement readout sequences ; at the same time, the finite probability of obtaining in the last projective measurement also contributes to . Hereafter we will refer to as the dephasing parameter and to as the dephasing-induced suppression factor.
One may wonder why the averaged phase is defined through the averaging of in Eq. (13), and not through . The reason is rooted in the phase measurement procedure, discussed in detail in Sec. VI. Here we only briefly explain the idea behind the procedure of observing the averaged phase. Different readout sequences correspond to mutually orthogonal states of detectors employed throughout the sequence of measurements. At the same time, measuring a phase requires interference between two states, e.g., the unmeasured and the measured states. For measuring the phase corresponding to a postselected sequence , one can use an interferometer, in one arm of which the system (spin of the flying particle) is measured, and in the other it is not, cf. Fig. 12(a). If the initial state of all detectors coincides with the state corresponding to the postselected readout sequence, the interference pattern exhibits a non-vanishing visibility, which allows for measuring . This may work for one particular postselected readout sequence. However, averaging requires the consideration of numerous readout sequences, the vast majority of which are orthogonal to the sequence of null readouts, expected when no system-detector coupling is present (i.e., when the interfering particle goes through the reference interferometer arm which does not involve coupling to detectors). To facilitate averaging over different readout sequences, one needs to couple detectors to both arms of the interferometer, cf. Fig. 12(b). This facilitates maintaining coherence between the two arms independently of the measurement readouts. In other words: readouts do not constitute a “which path” measurement [25, 26]. We design the couplings such that traversing one arm of the inteferometer or the other, the system accumulates opposite phases, and . As a result, the phase factor that should be averaged is .
II.3 Classification of measurement-induced phases
In Sec. II.2, we defined postselected (12) and averaged (13) measurement-induced phases. Here we investigate their separation into dynamical and geometrical components and their symmetry properties with respect to reversing the order of the measurement sequence.
Consider a specific readout sequence, . The system traverses a trajectory in the Hilbert space corresponding to states , defined in Eq. (10). It is known that any quantum system traversing a trajectory in the Hilbert space accumulates a Pancharatnam phase [16, 13, 15],
| (14) |
where denotes the argument of a complex number and are the projectors onto the respective intermediate states. Does Eq. (14) coincide with ? In general, Pancharatnam’s geometrical phase (14) does not coincide with (12), implying that the latter has a geometrical and a non-geometric (a.k.a. dynamical) components.
One can articulate a simple condition for to be purely geometrical. If the Kraus operators used in the measurement sequence are Hermitian () and positive-semidefinite ( for any ), then . This implies that
| (15) |
so that coincides with the Pancharatnam phase.444Note that this Pancharatnam phase is determined by the system’s intermediate states and not by the measurement directions. The latter coincide with the former only for projective measurements. Generically, however, the Kraus operators are not Hermitian. Then is not constrained to be real (not to mention non-negative), Eq. (15) does not hold, and the phases are not uniquely determined by the measurement-induced state trajectory (although knowledge of the trajectory together with the measurement parameters clearly does determine the phase). We call the difference
| (16) |
the dynamical component of the measurement-induced phase.
This consideration implies that the averaged phase, , too may not be assigned the meaning of a purely geometrical phase. However, in the case of averaging, our discussion below does not provide an algorithm for separating the phase into a geometrical and a dynamical components.
For adiabatic Hamiltonian evolution driven by a Hamiltonian , the phase factor accumulated in the course of the evolution can be split into dynamical and geometrical (Berry) components [2]. These components present the following property: evolving the system in the opposite direction, , keeps the dynamical component unchanged and reverses the sign of the Berry component. This has been the basis for separating dephasing in open systems undergoing adiabatic evolution into dynamical and geometrical components [27, 28, 29, 30, 31, 32]. Evidently, it is of interest to investigate the behavior of measurement-induced phases under reversing the measurement sequence.
Consider the same protocol as in Sec. II.2 but with the intermediate measurements executed in the opposite order. The postselected phase, , cf. Eq. (12), is then defined through . For Hermitian Kraus operators, the last expression is equal to , meaning that the phase reverses its sign, while the probability of the readout sequence is unchanged, cf. Eq. (12). For general (non-Hermitian) Kraus operators, however, no simple relation exists between the direct and the reversed protocols. Moreover, as we show below, even the geometrical component of the phase does not possess a simple symmetry with respect to the reversal of the protocol’s direction. One may then define the symmetric and the antisymmetric components of the measurement-induced phases:
| (17) | ||||
| (18) |
where for the direct () and reversed () protocols are defined via
| (19) | ||||
| (20) |
and the averaged phases are defined via
| (21) |
Similarly, we introduce the symmetric and antisymmetric components of the probabilities and the dephasing parameter:
| (22) | ||||
| (23) | ||||
| (24) |
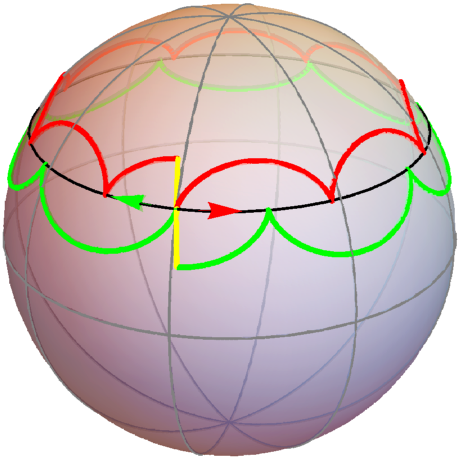
The above considerations lead to the following major conclusion: unlike in adiabatic Hamiltonian evolution, the classification of contributions to the measurement-induced phase into symmetric vs. antisymmetric, does not coincide with the classification into dynamical vs. geometrical contributions. An intuitive understanding of this result relies on the following observation: the intermediate states, , for the direct and the reversed measurement sequences form different trajectories (cf. Fig. 2), implying that the geometrical phase components (14) are different in magnitude for the direct and the reversed protocols. We present an explicit illustration of this in Sec. III.5.3.
III Weak-measurement-induced phases: an explicit example
In the rest of this paper we focus on a specific measurement class (Sec. III.1), and a specific set of measurement sequences that make the system’s spin 1/2 follow closed trajectories on the Bloch sphere (Sec. III.2). In Sec. III.3 we present analytic expressions for the postselected measurement-induced phase under this protocol. In Sec. III.4, we outline a procedure that allows one to calculate the averaged phase in an efficient manner. Explicit results, pertaining to certain limiting cases (e.g., nearly projective measurements) are presented in Sec. III.5.
III.1 The measurement model
Here we describe the measurement model that gives rise to the specific back-action matrices used throughout the rest of the paper. We consider a two-state system (with basis states and ) and a two-state detector (with basis states and ) with the measurement procedure being as follows. The detector is prepared in state . We choose the system-detector interaction Hamiltonian, cf. Sec. II.1, to be
| (25) |
It is switched on during a time interval of duration , i.e., ; are the vectors of Pauli matrices acting on the system/detector. The vectors
| (26) |
determine the system observable measured, (), and the effect of the system-detector interaction on the detector state. Note that the vectors and are normalized, . The arbitrary initial state of the measured system, , evolves under the system-detector coupling according to
| (27) |
where . After the interaction has been switched off, is measured projectively, yielding a readout corresponding to the post-measurement detector states . The back-action matrices (representing the Kraus operators) are thus
| (28) |
with
| (29) | |||||
| (30) | |||||
| (31) |
When , the matrices alone determine the back-action. For a general , the matrix induces a unitary rotation: the eigenbasis of is given by . One thus sees that the role of is to determine the back-action in the eigenbasis of the measured observable .
It is important to understand in detail the evolution of the system state during the measurement process. Consider the case of .555For arbitrary , the effect is the same if considered in the eigenbasis of . If the initial state , the measurement yields with probability 1 and the state remains unchanged. For the initial state , the probabilities of the readouts are and ; the state becomes with a readout-dependent phase . For a generic initial state, both readouts are possible with some probabilities , cf. Eq. (4), yet the back-action on the state does not reduce to a phase multiplication. The readout, whose back-action is described by , projects the state onto . For readout, describes pulling the state towards the north pole on the Bloch sphere (i.e., closer to ) and rotating it around the axis, cf. Fig. 1.
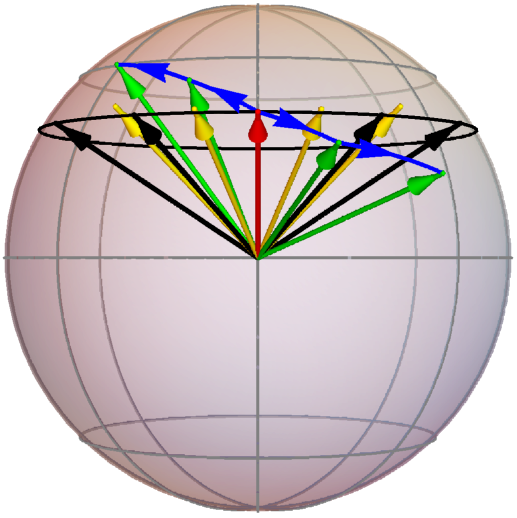
This rotation is a key feature of weak measurement and is absent in the case of projective measurements. Indeed, in a projective measurement, the readout would imply the final state , and any rotation around the axis would become insignificant. Note that this rotation only happens when has an imaginary component, i.e., when is non-Hermitian. The idiosyncrasy of Hermitian back-action matrices has been discussed in Sec. II.3. It is this non-Hermitian back-action that gives rise to asymmetric state trajectories as shown in Fig. 2, cf. Fig. 3 for a detailed explanation.
We note in passing that the back-action matrices in Eqs. (29–30) can appear in a wider context than the toy detector model introduced here. In some contexts, measurements with such back-action are known as partial or interaction-free measurements [33, 34, 35] and can be implemented by optical means [33, 35] or in superconducting qubits [34]. A particularly natural setting for such back-action is presented by imperfect optical polarizers. A polarizer is a detector in the sense that the light can pass through the polarizer (identified with ) or not pass (be absorbed, reflected etc., ). An ideal polarizer, letting one polarization through and completely reflecting the other, is equivalent to a strong measurement being applied to a photon. A non-ideal polarizer, letting one polarization through completely, while the other polarization is partially reflected and partially transmitted, can be described as a measurement with back-action matrices of the form (29–30). Therefore, our proposed protocols, detailed below, may, in principle, be implemented in a variety of experimental settings.
III.2 The measurement sequences and the scaling limit
Hereafter we focus on studying a specific family of measurement sequences. We consider the system initial state
| (32) |
We choose our measurements to be associated with the measurement axes
| (33) |
with
| (34) |
i.e., all the measurement axes belong to a particular parallel corresponding to the polar angle , and denotes whether the sequence is performed clockwise/counterclockwise. We fix the measurement parameters and to be and , independently of the measurement number . For simplicity, we put .
We will be interested in the limit , where the measurement sequence becomes quasicontinuous. If one keeps and constant when taking the limit, a sequence of infinite number of finite strength measurements becomes equivalent to a sequence of projective measurements and yields the Pancharatnam phase, cf. Appendix A. In order to avoid this trivial limiting case, one needs to scale and with . In Appendix A, we show that among the large number of possible approaches to the continuum limit, there is a unique scaling procedure that avoids a trivial limit.
This non-trivial scaling procedure corresponds to and with the parameters and . With such scaling, the back-action matrices in Eqs. (29–30) become
| (35) | ||||
| (36) |
The parameter controls the measurement strength (how much the state is pulled towards the measurement axis for the readout), while controls the non-Hermiticity of (and in Eq. (28)). Since non-Hermiticity is the cause of asymmetric behavior (as was shown in Secs. II.3, III.1), we call the asymmetry parameter.
The non-Hermitian contribution to the measurement back-action can be interpreted as Hamiltonian evolution:
| (37) |
where and . Therefore, this back-action could, in principle, arise as a result of a measurement with Hermitian back-action applied to a system evolving under the Hamiltonian . This, however, is not how the back-action emerges here: the system does not have its own Hamiltonian, nor does the detector model have any term in the Hamiltonian (25) acting solely on the system. Nevertheless, Eq. (37) shows that for the purposes of investigating the effect on the system state, the measurements we consider are equivalent to measurements with a Hermitian back-action (determined by ) supplemented with Hamiltonian evolution of the system (determined by ). We find this equivalence useful for connecting our results to the known results for Hamiltonian-evolution-induced phase factors in Sec. III.5.3.666Note also that the scaling of the back-action matrix in Eq. (35) is the “natural” one in the following case: the measurements are implemented with polarizers, where the degree of polarization is determined by the polarizer thickness. Indeed, for such a polarizer, the degree of letting the “wrong” polarization through would drop exponentially with the thickness of the polarizer. At the same time, different refraction indices for the two polarizations would also result in a phase difference proportional to . Adjusting the polarizer thickness according to the number N of measurements employed would result in the back-action given in Eq. (35), applied to the polarization of the transmitted light. This should enable a relatively easy check of our predictions concerning the case when all the measurements are postselected to yield , cf. Secs. III.3, IV, VI.1.
III.3 Measurement-induced phase in postselected measurement sequences
Here we investigate the behavior of the postselected phase, defined in Sec.II, Eqs. (19, 20). We focus on a specific readout sequence in which all detector readouts are . Such a choice is based on the following observation. Within the measurement model described in Sec. III.1, readout implies that the detector state before a measurement coincides with the detector state after the measurement. This allows for designing a simple observation scheme for , as described in Sec. VI.
The parameter denotes the direction of the measurement sequence, cf. Eq. (34). We next calculate for both directions, keeping unspecified. Using Eqs. (28–31) and the explicit definitions for the initial state (32), the measurement axes (33), and the protocol direction (34), one shows that
| (38) |
where
| (39) |
Using Eq. (35), diagonalizing , and taking the limit of , one finds that
| (40) |
where and . Note that the definition of through the square root allows for a sign ambiguity. Since Eq. (40) is symmetric under , the actual sign does not matter and one can choose any convention for calculating the square root. Note also that the prefactor is exactly the Pancharatnam phase of the system subjected to a quasicontinuous sequence of projective measurements along the parallel corresponding to .
The r.h.s. of Eq. (40) obeys a number of symmetries. First, the expression is invariant under simultaneous replacement of and . Second, the expression remains unaffected under and accompanied by the complex conjugation. From the latter, it follows that for , and . That is, at the probability only has a non-trivial symmetric component, and the phase only has the antisymmetric component. Away from , the phase and the postselection probability, each has both the symmetric and the antisymmetric components (17, 22, 23).
III.4 How to calculate the averaged phase
Here we derive a relatively simple expression for the averaged measurement-induced phase, in Eq. (21). While our result does not constitute a fully analytical expression for , it facilitates general analysis and efficient numerical study of the averaged phase behavior.
Note that similarly to Eq. (38), for an arbitrary readout sequence ,
| (41) |
with defined in Eqs. (35–36) and defined in Eq. (39). Then
| (42) |
where , , denotes the tensor product, and . Therefore,
| (43) |
where
| (44) |
What enabled a fully analytical calculation in Sec. III.3 is the possibility to diagonalize analytically. Here, diagonalizing analytically is a formidable task. However, it can be diagonalised numerically. Suppose one diagonalised ,
| (45) |
with and . Then in the limit ,
| (46) |
with .
Expressions (44, 46) not only provide means for efficient numeric calculation of the averaged phase, they also allow one to make some analytic conclusions. Namely, one can show that the averaged phase obeys the same symmetries as the postselected phase (cf. Sec. III.3). Observe that , where . Therefore, remains invariant under simultaneous replacement , :
| (47) |
Further, , implying that is invariant under applying complex conjugation and simultaneously replacing , .
III.5 Limiting cases
The analytic results of Secs. III.3 and III.4 allow one to analyze the behavior of the postselected, Eq. (40), and averaged, Eq. (46), phases in a number of limiting cases. In this subsection we discuss three limiting cases corresponding to , , and .
III.5.1
We start with the simplest limiting case of . This means that the back-action of readouts strongly rotates the system state around the measurement axis, cf. Eq. (35). This regime is equivalent to an almost adiabatic Hamiltonian evolution supplemented by measurements that have a small effect (cf. Eq.(37) in Sec. III.2). Consequently, one expects the measurement-induced phase in this limit to coincide with the Berry phase up to small corrections. This indeed turns out to be the case. For the postselective protocol, we expand the logarithm of Eq. (40) at large . For the averaging protocol, we perform the diagonalization of Eq. (44) approximately at , after which we use Eq. (46). In both cases, we obtain
| (48) |
| (49) |
It is noteworthy that the results for the postselective and for the averaging protocols coincide as the readouts have negligible probability. At higher orders in , this is no longer so.
III.5.2
The limit of corresponds to almost projective measurements. Here one expects the induced phase to be the Pancharatnam phase up to small corrections. For the postselective protocol, expanding Eq. (40), we find
| (50) |
| (51) |
For the averaging protocol, we find
| (52) |
| (53) |
Note that the asymmetry with respect to is present in the postselected phase but not in the postselection probability (where it only appears in terms ). At the same time, the asymmetry does appear in at this order, showing the non-trivial effect of averaging.
When , one recovers the limit of projective measurements, implying that the resulting phase, , is the Pancharatnam phase. Since the postselection probability , other readout sequences cannot occur, and the averaged phase is the same as the postselected one. At large but finite values of , the two phases are different. One can clearly see the separation of the contribution from that of all the other readout sequences in both the phases and the postselection probability/dephasing factor. Remarkably, the other sequences contribute only at .
III.5.3
This limit corresponds to zero strength measurement. The measurements always yield readouts, and the corresponding back-action (35) is equivalent to a Hamiltonian evolution, cf. Eq. (37). On one hand, this can still be interpreted as the behavior under very weak measurements. On the other hand, this limit can be understood as non-adiabatic Hamiltonian evolution and treated within the framework of Aharonov–Anandan phases [11]. As we show below, the two treatments yield identical results.
The answer in this limit immediately follows from Eq. (40), which yields
| (54) |
where and . Using the same technique as in Sec. III.3, it is possible to obtain the analytic form of the geometrical component of the phase (14):
| (55) |
The dynamical part of the phase is thus
| (56) |
One sees that neither the dynamical, nor the geometrical part of the phase possesses a definite symmetry under . Each has both a symmetric and an antisymmestric component.
In the present case, , separation into the dynamical and geometrical components can be obtained following Aharonov and Anandan [11]. Indeed, the measurement back-action can be interpreted as Hamiltonian evolution:
| (57) | ||||
| (58) |
cf. Eqs. (28–31, 35–37). Then the dynamical phase in the limit is given exactly by the r.h.s. of Eq. (56). This demonstrates consistency between our definition of the geometrical and dynamical components of measurement-induced phases and the conventional definition for the phases induced by Hamiltonian evolution. Further investigation of the separation of the measurement-induced phases into dynamical and geometrical components is left for future work.
IV Topological transitions in the postselective protocol
In this section we investigate topological transitions concerning the postselected phase . We study these transitions in Sec. IV.1 and discuss the resulting “phase diagram” in the space of measurement parameters in Sec. IV.2.
IV.1 The essence of the transitions
Consider the postselection probability , cf. Eqs. (19, 20, 40), when the protocol is executed at, for example, , cf. Fig. 4(a). We note that , is bounded throughout the entire parameter space except for a diveregence near , , indicating that at this special point. This is accompanied by a prominent feature in the behavior of , cf. Fig. 4(b): the phase is ill-defined at the singularity and makes a -winding around the singular point. This is a topological feature in the sense that it cannot be eliminated by a smooth deformation of as a function of . Similar features emerge at other values of , with different locations of the special point in the plane.
For an arbitrary , the presence of a phase winding implies that the phase is ill-defined at a certain value of . In Sec. VI.1 we show that is an observable quantity. Therefore, the phase being ill-defined at implies . The converse is not necessarily true. However, in our study of measurement-induced phases we have not found instances of the postselection probability vanishing without a phase singularity.
In Sec. IV.2, we find the set of all points corresponding to the postselection probability vanishing. Before proceeding there, we now present a different view of what happens at these special points.
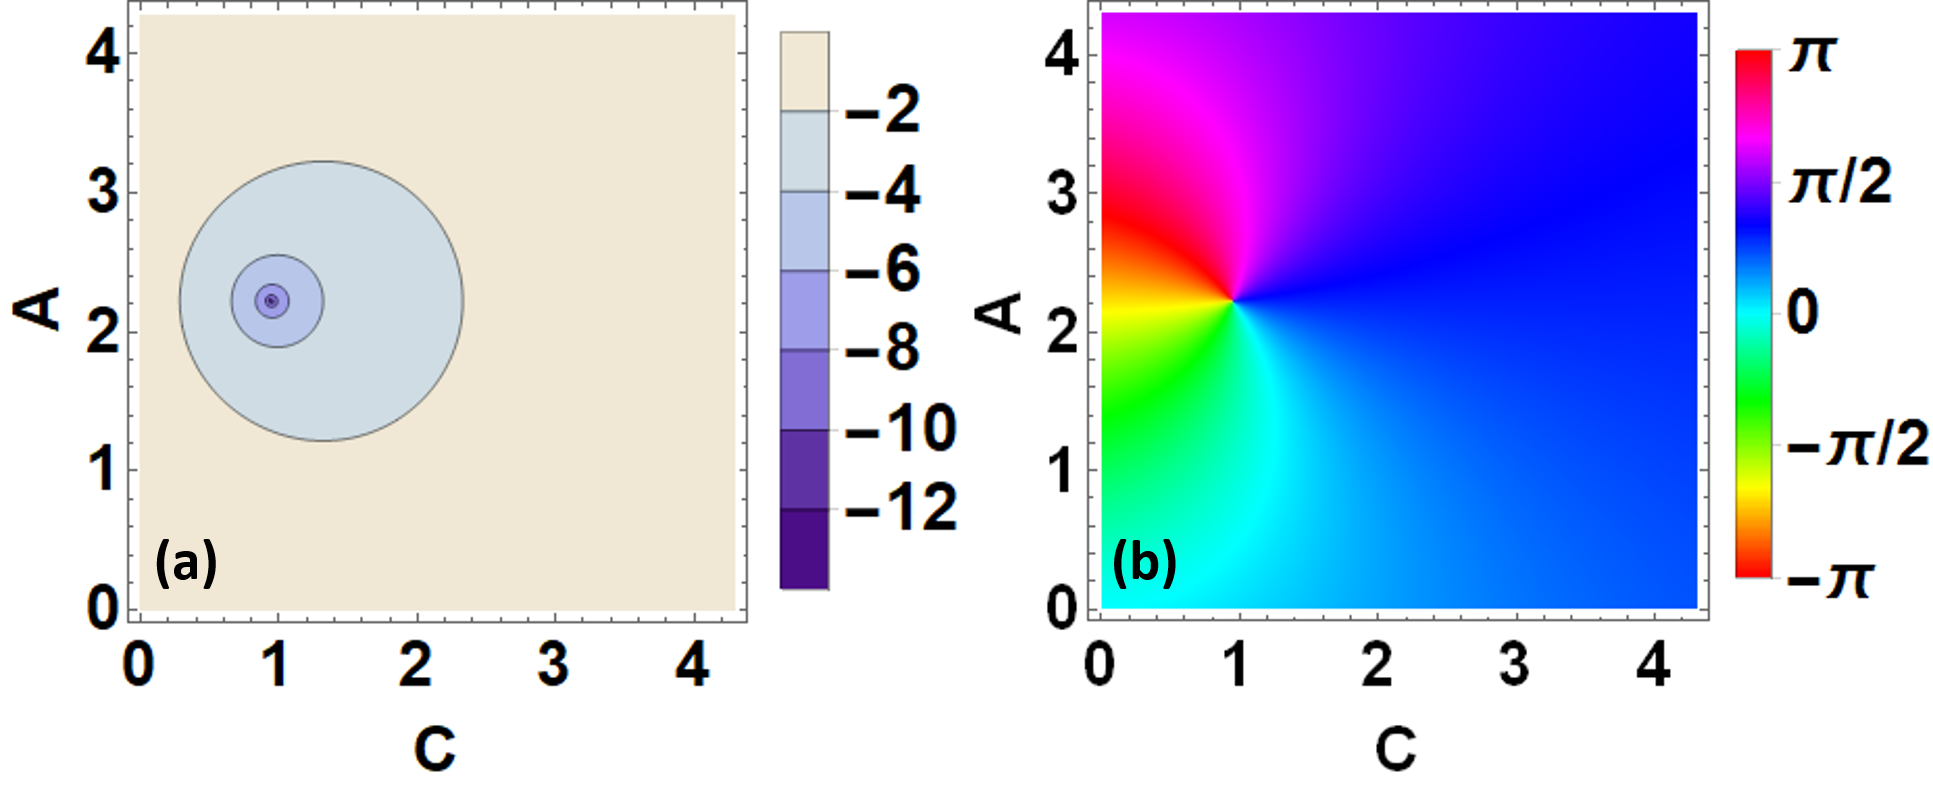
By construction (cf. Eqs. (19–20)), for each given , is defined modulo . It follows from Eq. (40) that . Without loss of generality, one can assign . On top of that, demanding the continuity of as a function of , one removes the freedom of adding multiples of to . One thus must have , where is a well-defined integer that characterizes the entire dependence of on at a given . It is natural to denote as the winding number, as it represents the number of times the function winds around the origin in the complex plane. Being an integer number,
| (59) |
cannot change as is smoothly deformed, rendering a topological invariant. The presence of different values of at different measurement parameters and implies existence of a sharp transition where the value of jumps discontinuously. In other words, there must exist some critical at which the function is ill-defined; it is sufficient for not to be well-defined at a single . As discussed above, this requires . Hence, such transitions between different values of the winding number correspond to singularities like the one found above.
Such transitions have been reported in Ref. [20] for the case of . There, the existence of such transitions is evident through a simple consideration. For the limit of infinitely weak measurements (), yielding , while in the limit of projective measurements (), yielding . Therefore, there must be a transition at some finite when .
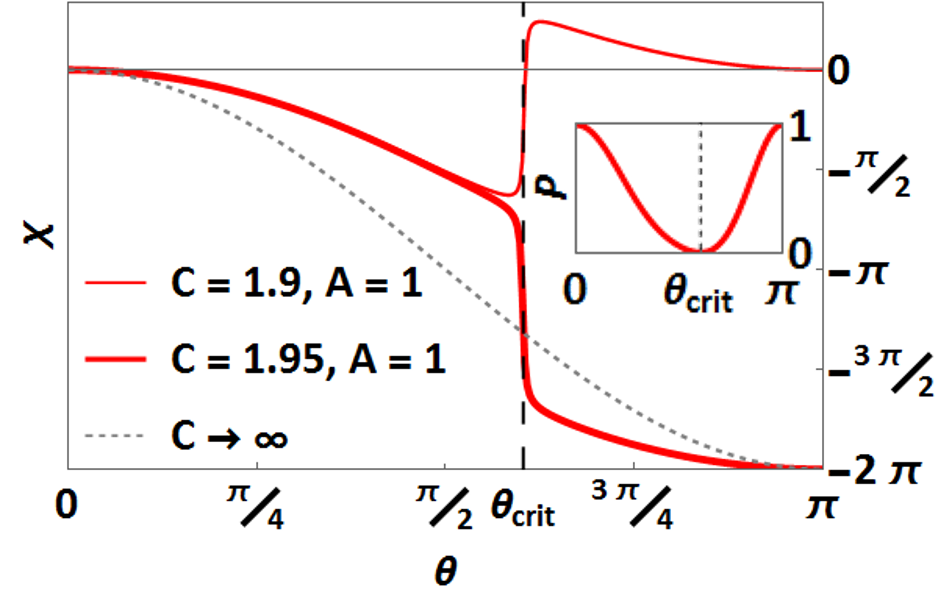
For the present, more general case, the above consideration does not apply. While at , and for any , cf. Eq. (40), the phase at is not identically zero. Therefore, one cannot guarantee the existence of a transition at a certain for an arbitrary value of . We find that transitions exist for (cf. Sec. IV.2 and Appendix B), and do not exist otherwise. An example of such a transition is presented in Fig. 5.
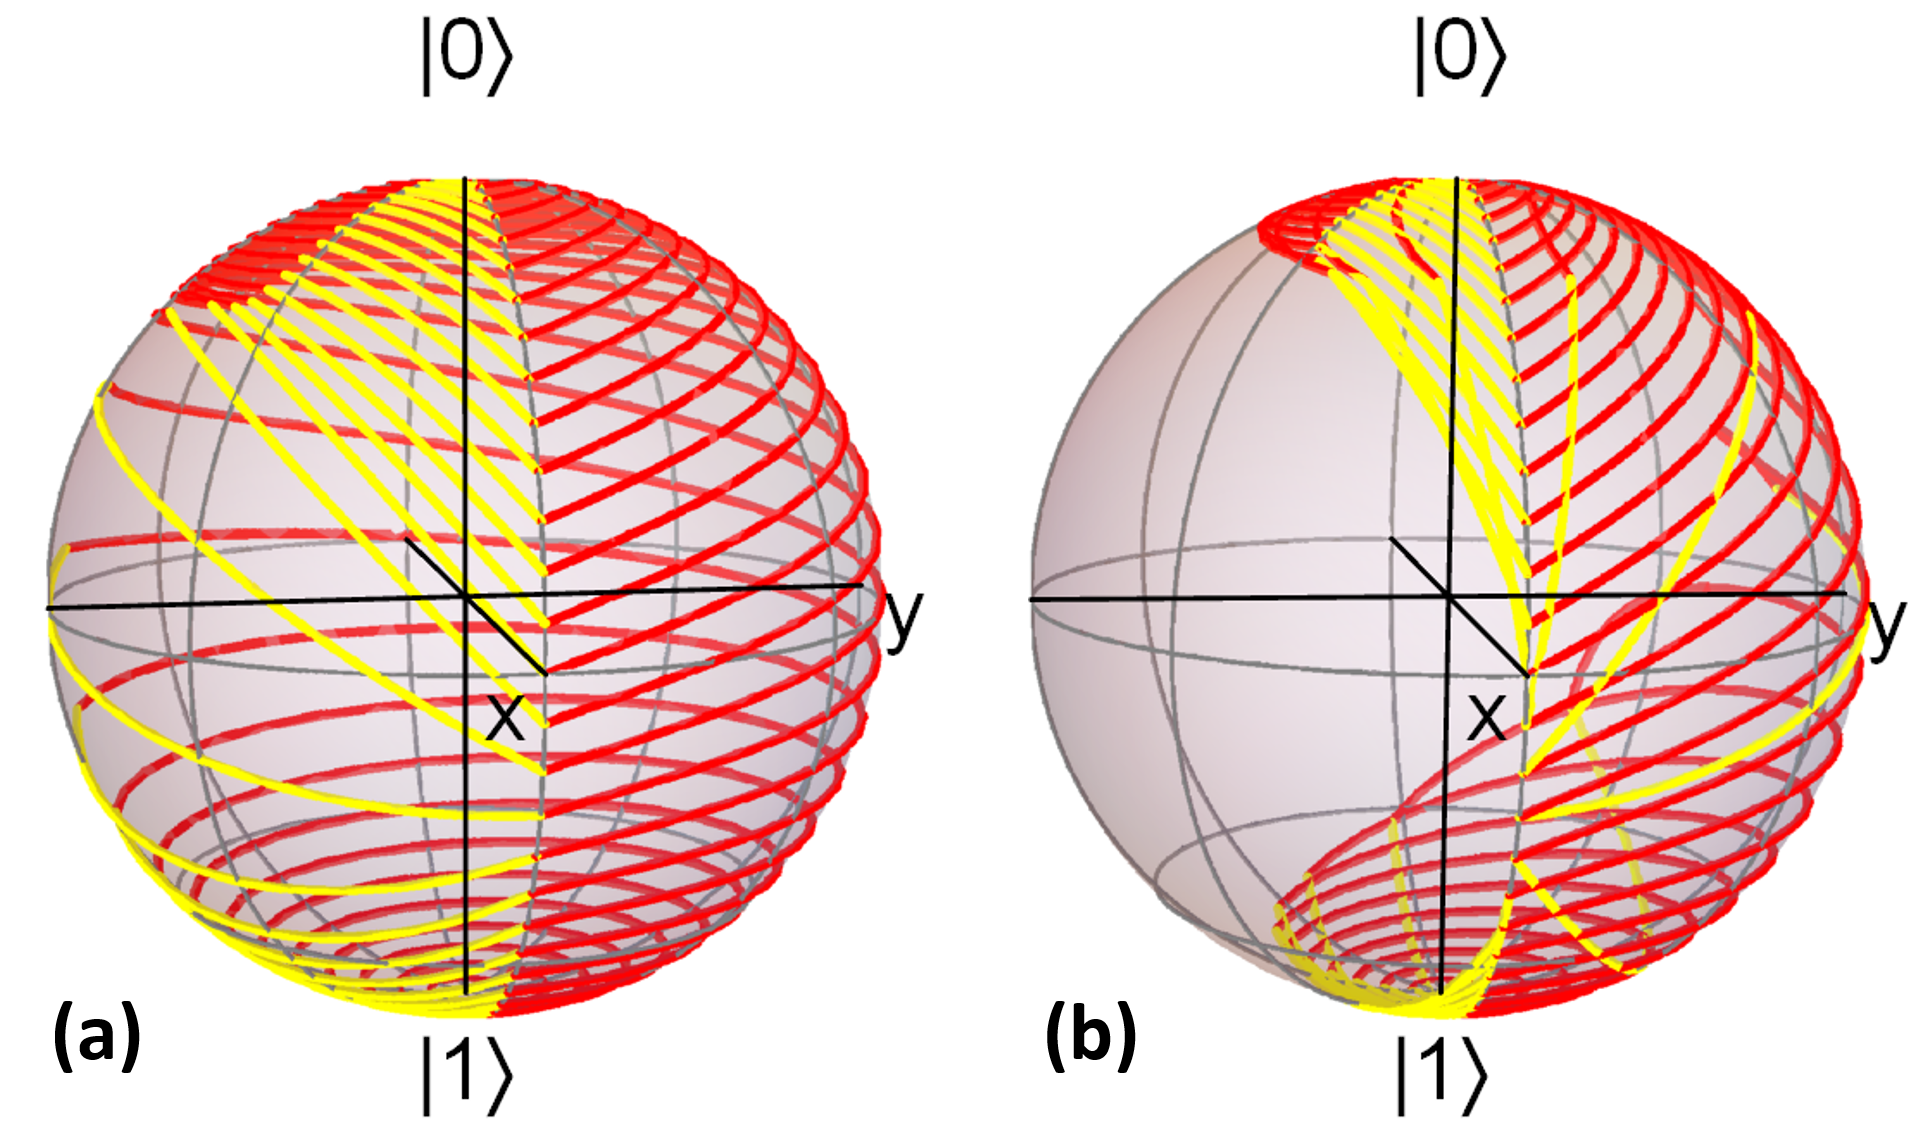
Reference [20] also linked this type of transitions to a topological transition of the surface formed by measurement-induced trajectories on the Bloch sphere. Consider the sequence of states, , cf. Eq. (10), through which the system passes under the sequence of measurements. For a quasicontinuous sequence of measurements they form a quasicontinuous trajectory on the Bloch sphere. This trajectory is not closed. It can be argued [15, 20] that the natural way of connecting with is by drawing the shortest geodesic on the Bloch sphere, which corresponds to a postselected projective measurement at the end of the measurement sequence, cf. the discussion between Eqs. (10) and (12). This guarantees that the trajectory is closed. Consider now all trajectories induced when executing the protocol at different for a given . They form a surface on the Bloch sphere (cf. Fig. 6). We have found numerically that for the surface always covers the Bloch sphere, while for it never does. Therefore, the link between the winding number of the measurement-induced phase and the topology of the surface formed by the measurement-induced trajectories exists beyond the case of , studied in Ref. [20], notwithstanding the phase not being immediately related to the trajectory (cf. the discussion in Sec. II.3).777We emphasize that the two transitions (in the phase winding number and in the topology of the surface formed by the measurement-induced trajectories) always happen concomitantly. In particular, the transition in the surface topology never takes place at .
IV.2 The critical line of the transition

We have demonstrated in Sec. IV.1 that there exist special points where . These special points are associated with phase winding features in the plane and with jumps in the winding number , cf. Eq. (59). In fact, the set of all these points forms a critical line shown in Fig. 7 (left panel). The derivation of this result is presented in Appendix B.
Note that the critical line for the postselective protocol () splits the plane into two regions (“phases”, cf. Fig. 7 (left panel)). These correspond to two different values of the winding number . The region below the critical line corresponds to (a topologically trivial phase). Indeed, at the system is not influenced at all by the measurements leading to and . Changing the value of a topological index requires passing through a critical point such that at some . Since any point within this region can be accessed from another point by a continuous variation of parameters without crossing the critical line, it follows that throughout this region. Similarly, corresponds to projective measurement and yields the Pancharatnam phase with . The same connectivity argument implies that this is the value of throughout the region above the critical line.
We note that the transition only happens for . While this follows from the solution of the problem (cf. Appendix B), it is instructive to have an intuitive understanding of this fact. For this consider the case of . The back-action of a measurement (and only are obtained when ) is equivalent to a Hamiltonian evolution for time in a system with energy gap , cf. Sec. III.2 and Eq. (37). Then the total evolution under all the measurements in the limit is equivalent to a Hamiltonian evolution for time with a continuously evolving Hamiltonian, followed by a projective measurement that ensures the return of the system state to . The rate at which the Hamiltonian parameters are varied is of the order of . For , , so that the evolution is adiabatic; the system state follows meticulously the measurement/Hamiltonian axis and acquires the adiabatic Berry phase leading to a winding number . For , the evolution is not adiabatic, implying that the phase will not coincide with the Berry phase (cf. Sec. III.5.1). At , the evolution is totally non-adiabatic, the system does not have time to “sense” the change in the Hamiltonian axis, and the acquired phase , so that . It is thus clear that there has to be a transition between the two winding numbers at some value of , which is depicted in Fig. 7 (left panel). The required vanishing of the postselection probability at is due to the last projective measurement, implying that the state to which the system arrives as a result of the non-adiabatic Hamiltonian evolution is orthogonal to its initial state.888 In fact, we find that for any the final state after weak-measurement-induced evolution, , is orthogonal to , while the probability of observing the sequence of is .
The regimes of the Pancharatnam phase () and of the Berry phase () share the same topological index . It thus comes with little surprise that they can be smoothly connected, without crossing any critical lines, as follows from Fig. 7 (left panel).
In the next section, we analyze topological transitions of the averaged phase and discuss the qualitative differences from the transitions discussed above.
V Topological transitions in the averaging protocol
The behavior of the averaged phase and dephasing factor bear numerous similarities to the postselected phase and postselection probability . However, there are important qualitative differences that manifest themselves in the topological properties of .
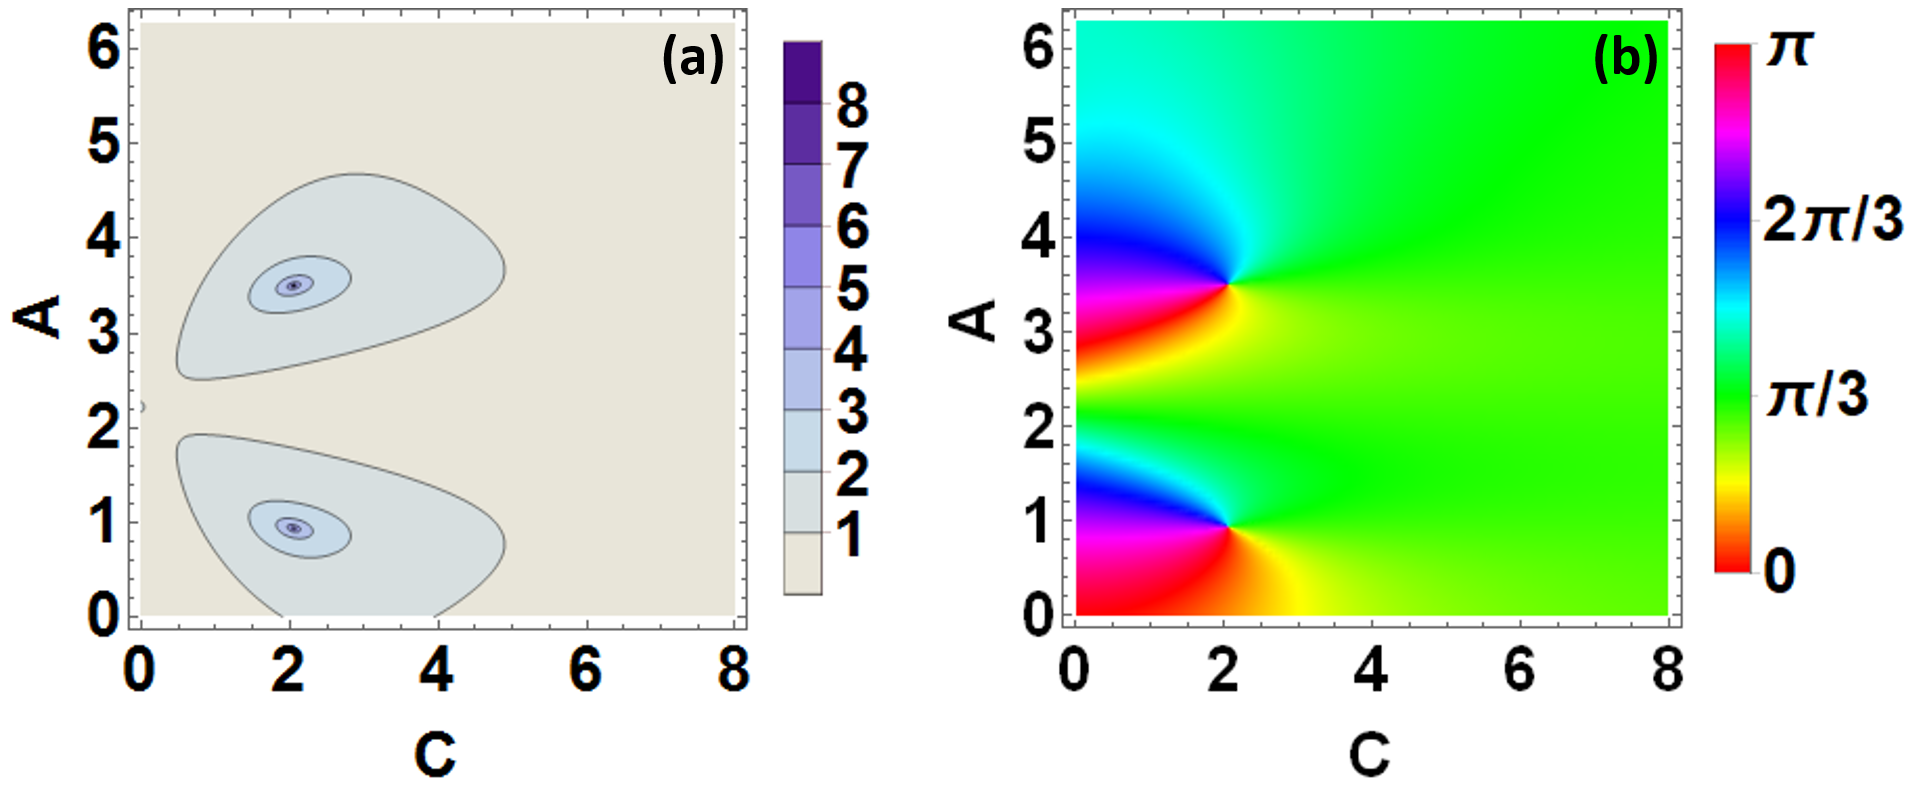
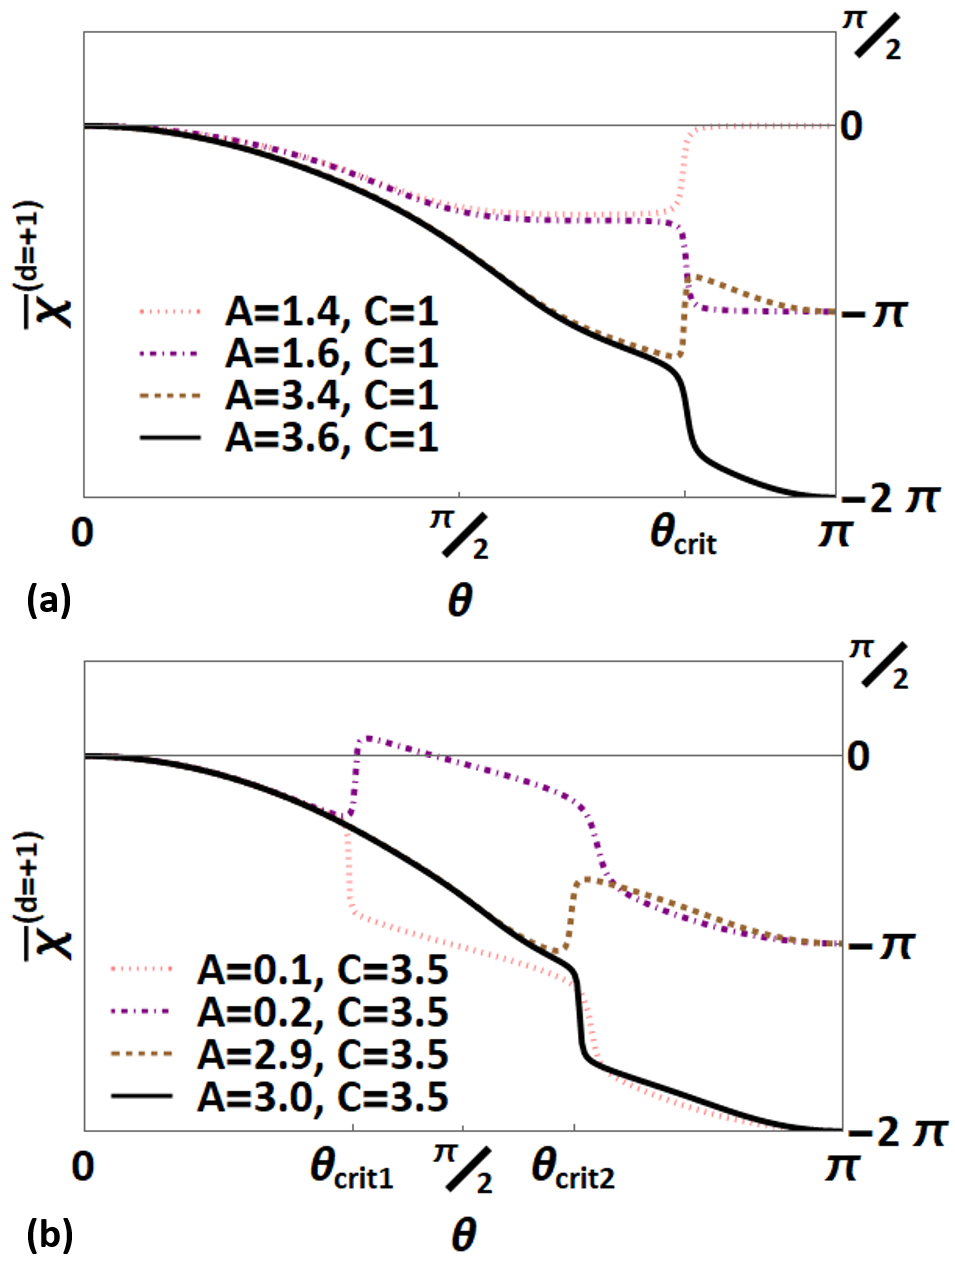
Similarly to the postselective protocol, the dephasing factor vanishes at specific values , cf. Fig. 8(a). Equivalently, one can say that diverges at these points. The phase makes windings around the points of divergent , cf. Fig. 8(b). However, an important qualitative difference is that is defined modulo , and not modulo as the postselected phases, cf. its definition in Eq. (21). This implies that the minimum possible winding is of size , cf. Fig. 8(b), in contrast to the -windings of in Fig. 4(b).
The above distinction naturally leads to the fact that the diagram of topological regimes can be richer in the averaging protocol. Similarly to the protocol of the postselected phase, we have for and , cf. Eqs.(44–46). However, since the averaged phase is defined modulo , and not , the good winding number definition is
| (60) |
Similarly to in Eq. (59), is also integer-valued but demonstrates a larger spectrum of values. Indeed, in the limit of , implying ; for , and ; yet it is also possible to have .
Switching between different values of can only happen at for which there exists such that (making the phase undefined). The set of forms a critical line (Fig. 7 (right panel)) separating the regimes of different . Here, the critical line splits the plane into three regions. The outermost and the innermost regions correspond to and respectively. The middle one, which was absent in the postselective protocol, corresponds to , cf. Fig. 9(a). We emphasize that the region can only be explored with measurements that have non-Hermitian back-action operators (i.e., ).
It is noteworthy that the presence of a middle region is facilitated, yet not dictated, by the definition of the averaged phase modulo . Indeed, as a matter of principle, one could define the postselected phase via as opposed to Eq. (12). This would imply that too (not only ) is defined modulo . Nevertheless, the winding properties of the function would not change with the change of definition. In particular, the winding number of would still acquire only two values, and (translating to and respectively). This demonstrates the non-trivial effect of averaging over the readout sequences.
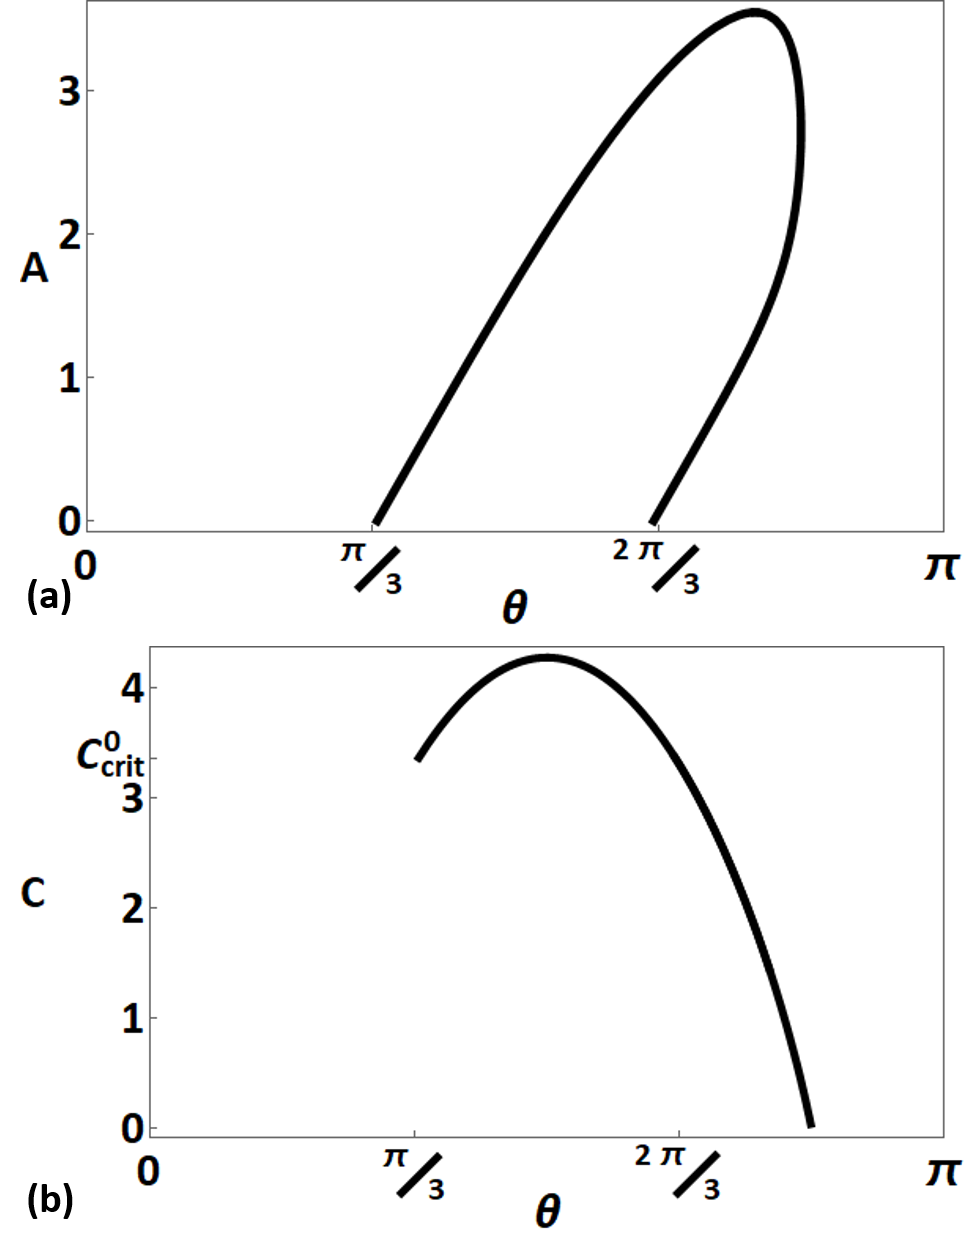
Several other features of the critical line behavior, cf. Fig. 7 (right panel), are noteworthy. First, note that transitions as a function of happen only at . However, the threshold value is different from that in the postselective protocol: .
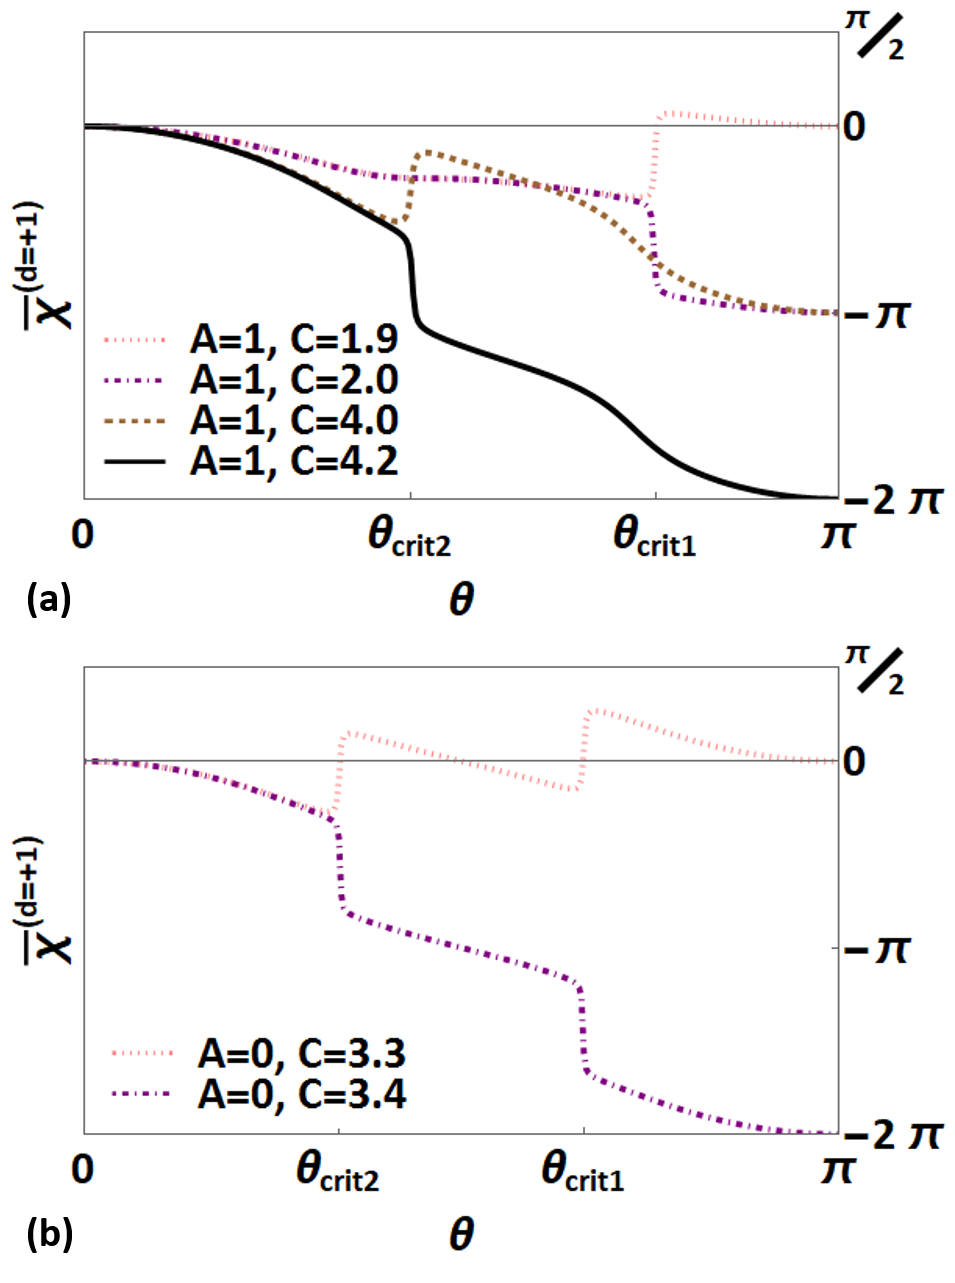
Second, for any there are two transitions, which correspond to two different critical polar angles, . At there is only one transition at taking from to . The critical polar angles of the two transitions do not merge as is approached. This might be puzzling. The resolution of the puzzle is that at , the transition happens as exhibits two jumps at different values of , cf. Fig. 9(b) and Fig. 10(a).
Third, for , there are two transitions ( and ) as a function of happening at the same value of (cf. Fig. 7, Fig. 10(b), and Fig. 11(a)). For , there are again two distinct , yet now the transitions correspond to and , and happen at two different values of , cf. Fig. 11(b).
Finally, both the averaged and the postselected transition have the same at . This is easy to understand, as at essentially no measurement takes place and there is no difference between and : the only readout sequence that can be obtained is , cf. Sec. III.5.3. However, already at arbitrarily small , the critical lines of the two protocols behave in drastically different ways.
In Sec. IV.1 we linked the topological transitions in the postselective protocol to a change in the collective properties of measurement-induced state trajectories, cf. Fig. 6. Establishing such a connection for the averaging protocol is not straightforward since averaging over the detector readouts in the phase definition, cf. Eq. (21), implies that many measurement-induced trajectories are involved for each value of protocol parameters. Recently, it has been predicted theoretically [36] and observed experimentally [37] that measurement-induced dynamics can exhibit one or multiple optimal (“most probable”) quantum trajectories depending on the system parameters. Further, in the case of multiple optimal trajectories the system may exhibit chaotic behavior [38]. It would be interesting to investigate whether transitions between these different regimes exist in our system and, if they do, whether they are linked to the topological transitions we report here.
VI Experimental implementation
In this section, we discuss conceptual experimental setups that enable observing the measurement-induced phases defined and investigated above. We pay particular attention to some practical aspects of measuring the averaged phase.
VI.1 Interferometric detection schemes
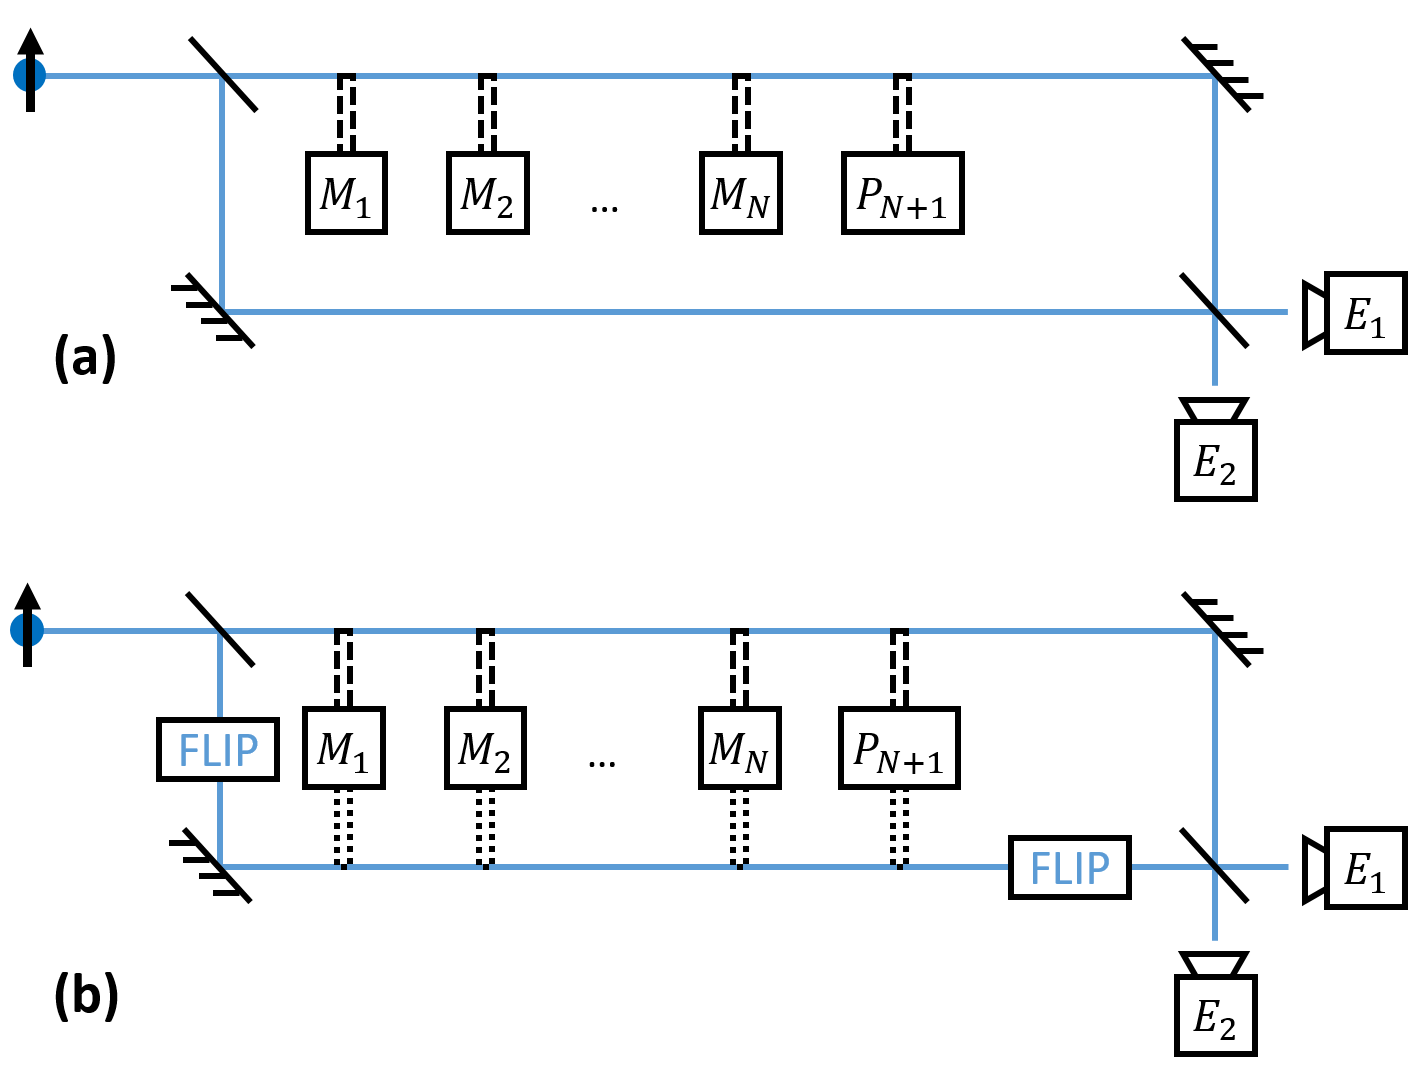
In order to measure the effects discussed in the previous sections, it is crucial to have the ability to access the measurement-induced phases. Here we define two conceptual setups that facilitate measurement of the postselected and the averaged phases (defined in Eqs. (12) and (13) respectively). The setup for measuring is shown in Fig. 12(a). A particle with spin in state enters a Mach-Zehnder interferometer and is split into two arms. In one arm, the particle is subjected to a sequence of weak measurements and one projective measurement (implementing the protocol described in Sec. III). In the other arm, the particle flies through unaffected. As a result, the state of the particle and detectors just before the particle reaches the final beam splitter is
| (61) |
where denotes the particle being in the upper/lower arm, and is the state of the th detector. We have accounted here for the fact that as the particle is flying through the lower arm, the detectors remain in their initial states (which are the initial states of the detectors in the measurement model described in Sec. III.1). As a result, the intensities observed at the interferometer exits, , will be
| (62) |
where is the intensity of the incoming particle beam; the second term on the r.h.s. of Eq. (62) is less than as it accounts for the loss of particles due to discarding the runs in which the last projective measurement yields ; the last—interference—term gives . This scheme thus enables the observation of the measurement-induced phase for the readout sequence . The scheme relies crucially on the fact that the readouts correspond to the detector initial state being unchanged.
The setup of Fig. 12(b) shows how the averaged phase can be measured. Now the particle interacts with the detectors in both arms. Moreover, the th measurement is performed in both arms by the same physical detector that is later read out, thus ensuring that the readout is the same in both arms. However, measuring as defined in Eq. (13) through interference requires that for each readout sequence the particle acquires phase in one arm and in the other arm. In order to achieve that, we propose to flip the particle spin when it enters and exits the lower arm and, in addition, to use somewhat different particle-detector interaction Hamiltonians in the two arms. We give the details of the procedure in Appendix C. The resulting intensities at the interferometer exits are
| (63) |
where the first term accounts for the particle loss in the last projective measurement postselection, and the interference term is exactly in Eq. (13).999Equation (63) is valid for arbitrary for the protocol defined in Sec. III. However, Eq. (63) does not apply to protocols with other choices of the measurement axes and/or the intitial state .
We stress that while for the reasons of theoretical simplification we have considered the limit of the number of measurements in the above sections, essentially the same physics of asymmetric behavior of the phases, the postselection probability, and the dephasing parameter will appear for sequences of measurements with any . Furthermore, the points of vanishing postselection probability and the singularities of the dephasing parameter will be related to the topological transitions in the phase behavior for finite too. However, some specific features (such as the shape of the critical lines) will be modified in the case of finite . In particular, the results will depend periodically on with the period being .
VI.2 Some remarks concerning practicalities of averaging over readout sequences in experiment
The definition of the averaged phase in Eq. (13) requires averaging the postselected phases over all possible readout sequences weighted with appropriate probabilities. However, this does not correspond to the interferometric procedure for measuring outlined above. Indeed, a particle flying through the interferometer will yield a specific readout sequence and a specific phase with probability . The next particle will again yield a random readout sequence , and so on. Therefore, the actual measurement procedure is identical to a Monte Carlo sampling of the readout sequences rather than systematic summing over them. The number of such sequences scales as with the number of measurements . Sampling such a large number of sequences (for large ) is impossible. However, the probability of a specific sequence determines both the frequency of obtaining this sequence and its contribution to the sum, rendering it possible to obtain an accurate estimate of with a moderate number of experimental runs.
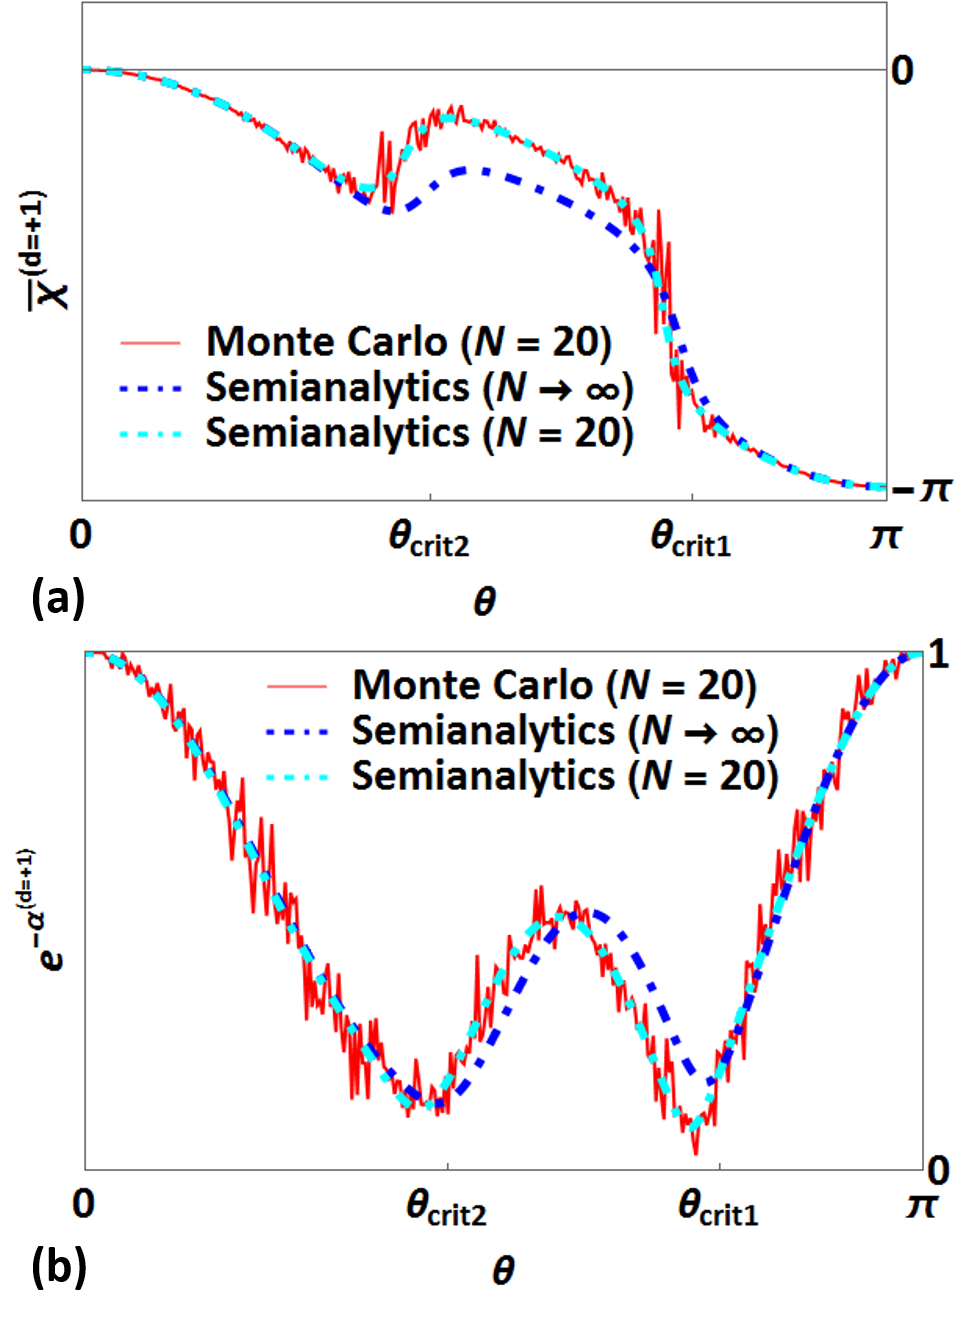
We have performed a Monte Carlo study that simulates the sampling of in the experiment. Namely, we randomly generated the readout sequences according to the algorithm outlined in Ref. [20] and calculated
| (64) |
where readout sequences were generated for sequences of measurements. A comparison of the Monte Carlo simulations to the results obtained using the method of Sec. III.4 is shown in Fig. 13. The Monte Carlo curves reproduce the behavior for qualitatively, and closely follow the exact result for . We, therefore, conclude that the experimental procedure does allow one to probe the physics discussed above with reasonable accuracy. Although pinpointing the exact locations of the critical lines of the topological transitions (where the terms in the sum in Eq. (13) accurately cancel out to yield ) may require a large number of experimental runs, establishing the existence of several topological sectors with different winding numbers can be done without accumulating too large a statistics.
VII Conclusions
We have performed a detailed investigation of measurement-induced phase factors. Our theory brings forward two classifications of such phases: dynamical vs. geometrical phases, and components which are symmetric/antisymmetric with respect to the reversal of the measurement sequence. Importantly, we have shown based on general considerations and on a specific example that these two classifications do not coincide.
We have demonstrated our theoretical framework via analyzing a specific protocol, calculating postselected and averaged measurement-induced phases, and investigating their dependence on various measurement parameters. We have shown that the projective-measurement-induced Pancharatnam phase and the Berry phase induced by adiabatic Hamiltonian evolution can be viewed as two (out of several) limiting cases of the phases induced by quasicontinuous sequences of weak measurements.
We have found and investigated topological transitions pertaining to measurement-induced phases. We have found the “phase diagram” of different topological regimes and discussed its distinctive features. While we have investigated topological transitions for a specific protocol, the generality of our considerations leads one to believe that such transitions are a generic feature of measurement-induced phases, avoiding the need to refer to a specific measurement model or phase-inducing protocol. Nevertheless, the details of the “phase diagram” may depend on the specific protocol and measurement class.
Finally, we have proposed experimental setups facilitating the observation of weak-measurement-induced phases and the study of the effects discussed in this work. We believe that weak-measurement-induced phase factors present a rich playground that may be important for understanding topological phases of matter in open quantum systems.
Acknowledgements.
We thank V. Gebhart for useful discussions. We acknowledge funding by the Deutsche Forschungsgemeinschaft (DFG, German Research Foundation) – Projektnummer 277101999 – TRR 183 (project C01) and Projektnummern EG 96/13-1, GO 1405/6-1, and MI 658/10-2, and by the Israel Science Foundation (ISF).Appendix A Investigation of different scaling regimes
As mentioned in Sec. III.2, taking the limit in our protocols requires adjusting (scaling) the measurement parameters and , cf. Sec. III.1, performing this as a function of . Here we explore the possible ways of scaling. We show that the only non-trivial scaling regime corresponds to the one presented in Sec. III.2.

One can understand the need for scaling of the measurement parameters in the quasicontinuous limit () from the following consideration. Arrange the measurements into sets (). That is, measurements form one set, are the second set etc. Within each set, the axes of the measured system observables are clustered at , where is the set number; here is the floor function. The spread of the actual from is and can be made arbitrarily small in the limit via taking arbitrarily large values of . Then this set of weak measurements can be interpreted as a single projective measurement with the appropriate axis . Indeed, if all measurements in a set yield , the back-action on the system state can be described by with and defined in Eqs. (29) and (31) respectively. Therefore, plays the role of the effective back-action matrix . In the limit , with fixed measurement parameters , , ,
| (65) |
unless . Therefore, for generic measurement parameters, a set of measurements all yielding is equivalent to a single projective measurement yielding . If at least one measurement in the set yields , the form of ensures that the system state is projected onto the eigenstate of , again making the back-action identical to that of a single projective measurement (up to errors ). Since the back-action also determines the probabilities of the outcomes, cf. Sec. II.1, one concludes that the original protocol is equivalent to a quasicontinuous sequence of strong measurements. The latter yields the Pancharatnam phase.
A non-trivial scaling limit thus requires . Since the scaling of the measurement parameters should not depend on the number of groups but only on , this is equivalent to . Similarly, we require as the opposite would imply that there is zero probability of obtaining a readout, making the evolution completely deterministic (equivalent to Hamiltonian evolution). We allow the following scaling , with . The above requirements then imply . With this choice, the single measurement back-action matrix becomes
| (66) |
where in the last step we defined and .
We now need to choose the appropriate scaling of . Again, a qualitative consideration is useful here. Note that
| (67) |
where with and . In other words, a measurement of the class we consider, when yielding , can be decomposed into a Hamiltonian evolution over time , followed by a measurement with a Hermitian back-action matrix. Let us first ignore the measurement (put ). Then the readout is implied since , cf. Eq. (30). The evolution is a quasicontinuous Hamiltonian evolution, with the magnetic field axis changing its direction by after every time interval . In the limit (or equivalently, ), this becomes a continuously evolving Hamiltonian with its axis changing at the rate , and the energy gap . Therefore, for , the adiabatic theorem applies to the system as the gap size is infinitely large; the system state will then meticulously follow the measurement axis. Now, introducing does not modify the picture much as the corresponding part of the back-action pulls the state closer towards the measurement axis, to which the state is close anyway. Numerical investigation shows that this qualitative consideration is correct, cf. Fig. 14. Moreover, one can analytically show that for , the probability of getting all measurement outcomes , , while the phase coincides with the Berry phase for the corresponding Hamiltonian evolution. The regime of is also not interesting for us as the non-Hermitian part becomes insignificant when and the problem reduces to that investigated in Ref. [20].
We conclude that the non-trivial scaling regime corresponds to with and . This is the regime presented in Sec. III.2.
Appendix B Finding the critical line for the postselective protocol
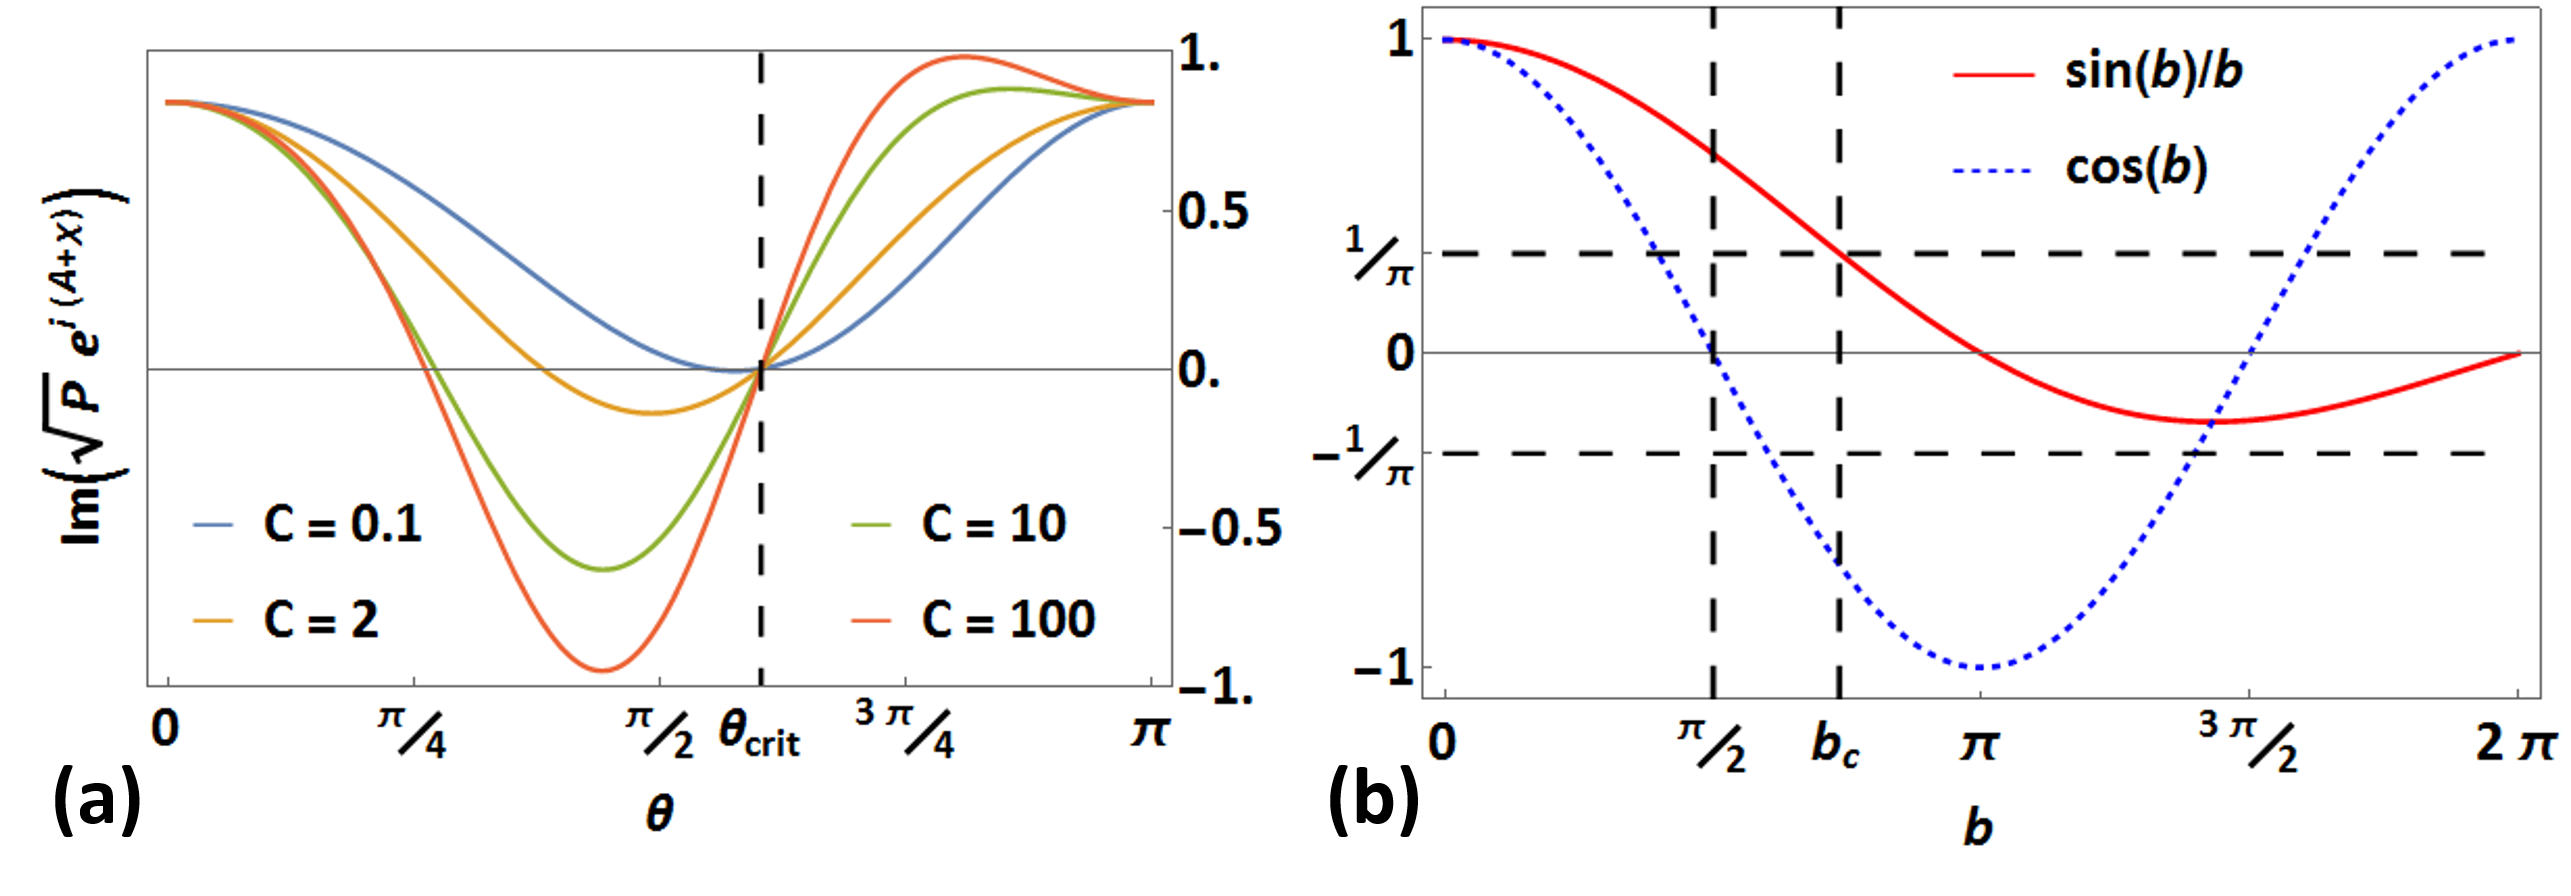
Here, we look for the parameters where . We focus on . The critical line at can be inferred using the symmetries discussed at the end of Sec. III.3. Equation (40) implies that is equivalent to
| (68) |
The real and imaginary parts of this equation represent two equations for three parameters, , , and . Therefore, one expects the solution to represent a line in the space of these three parameters.
We first observe numerically that if Eq. (68) holds at some , then the imaginary part of the l.h.s. of Eq. (68) vanishes at for any , cf. Fig. 15(a). Assuming that this observation is exact, we extract the relation between and as follows. We expand Eq. (68) at and demand that its imaginary part vanishes to the leading order in , obtaining the condition
| (69) |
It is now straightforward to verify that this condition indeed implies that the imaginary part of the l.h.s. of Eq. (68) vanishes. Indeed, when Eq. (69) holds, , and is either purely real or purely imaginary; therefore, , , are all real.
Switching to the real part of Eq. (68), we rewrite the equation as
| (70) |
Squaring the equation and remembering that
| (71) |
(where the sign of the square root is dictated by the fact that ), we obtain
| (72) |
Recall that only being real or imaginary are the cases of interest for us. For real , , dictating the choice of “” in Eq. (72). Using this and Eq. (71), we rewrite Eq. (68) as
| (73) |
implying that there are no solutions with real .
We thus look for solutions with , . Since and are equivalent in Eq. (68), we choose without loss of generality. Then Eq. (72) becomes
| (74) |
The r.h.s. of Eq. (74) is either or . One sees from Fig. 15(b) that only for . In this range of , ; therefore, one has to choose “” in Eq. (74). Not any solution of Eq. (74) with “” is a solution of Eq. (68). Indeed,
| (75) |
Therefore, only the yielding will be actual solutions of Eq. (68). One can see from Fig. 15(b) that these are .
At , implying , while implies . Taking into account Eq. (69), one sees that for only are allowed (which implies, again through Eq. (69), that only are possible). Now one can construct the critical line. For each in this range, is found from Eq. (69); at the same time one solves Eq. (74) with “” numerically to find , which then yields . The resulting critical line is shown in Fig. 7.
We note that the arguments presented above rely on the initial assumption that can only turn to when Eq. (69) holds. Abandoning this assumption, there might be, in principle, additional critical sets that are not included in these considerations. Our numerical investigation, though, showed no evidence of such points.
Appendix C Details on the averaged phase detection scheme
The averaged phase detection setup shown in Fig. 12(b) involves detectors interacting with two arms of the interferometer via different Hamiltonians. Denoting the upper/lower arm as , we write
| (76) |
For the upper arm, , this reduces to Eq. (25). For the lower arm, , which leads to two modifications: the signs of are changed and is measured instead of . This results in a different detector back-action in the lower arm, given by
| (77) |
with
| (78) | |||||
| (79) |
and the rotation matrix defined in Eq. (25). The same applies to the last postselected projective measurement, which is implemented when .
The particle state just before passing the last beam splitter is
| (80) |
where
| (81) |
is the “FLIP” operator applied twice in the lower arm.
Below we prove that
| (82) |
Using this identity, Eq. (63) for the intensities at the interferometer’s exits immediately follows.
The proof of Eq. (82)
References
- Cohen et al. [2019] E. Cohen, H. Larocque, F. Bouchard, F. Nejadsattari, Y. Gefen, and E. Karimi, Geometric phase from Aharonov–Bohm to Pancharatnam–Berry and beyond, Nature Reviews Physics 1, 437 (2019).
- Berry [1984] M. V. Berry, Quantal Phase Factors Accompanying Adiabatic Changes, Proceedings of the Royal Society A: Mathematical, Physical and Engineering Sciences 392, 45 (1984).
- Thouless et al. [1982] D. Thouless, M. Kohmoto, M. Nightingale, and M. den Nijs, Quantized Hall Conductance in a Two-Dimensional Periodic Potential, Physical Review Letters 49, 405 (1982).
- Niu et al. [1985] Q. Niu, D. J. Thouless, and Y.-S. Wu, Quantized Hall conductance as a topological invariant, Physical Review B 31, 3372 (1985).
- Hasan and Kane [2010] M. Z. Hasan and C. L. Kane, Colloquium : Topological insulators, Reviews of Modern Physics 82, 3045 (2010).
- Zhang et al. [2005] Y. Zhang, Y.-W. Tan, H. L. Stormer, and P. Kim, Experimental observation of the quantum Hall effect and Berry’s phase in graphene, Nature 438, 201 (2005).
- Novoselov et al. [2006] K. S. Novoselov, E. McCann, S. V. Morozov, V. I. Fal’ko, M. I. Katsnelson, U. Zeitler, D. Jiang, F. Schedin, and A. K. Geim, Unconventional quantum Hall effect and Berry’s phase of 2 in bilayer graphene, Nature Physics 2, 177 (2006).
- Pachos et al. [1999] J. Pachos, P. Zanardi, and M. Rasetti, Non-Abelian Berry connections for quantum computation, Physical Review A 61, 010305 (1999).
- Jones et al. [2000] J. A. Jones, V. Vedral, A. Ekert, and G. Castagnoli, Geometric quantum computation using nuclear magnetic resonance, Nature 403, 869 (2000).
- Nayak et al. [2008] C. Nayak, S. H. Simon, A. Stern, M. Freedman, and S. Das Sarma, Non-Abelian anyons and topological quantum computation, Reviews of Modern Physics 80, 1083 (2008).
- Aharonov and Anandan [1987] Y. Aharonov and J. Anandan, Phase change during a cyclic quantum evolution, Physical Review Letters 58, 1593 (1987).
- Wood et al. [2020] A. A. Wood, K. Streltsov, R. M. Goldblatt, M. B. Plenio, L. C. L. Hollenberg, R. E. Scholten, and A. M. Martin, Interplay between geometric and dynamic phases in a single-spin system, Physical Review B 102, 125428 (2020), arXiv:2005.05619 .
- Berry and Klein [1996] M. V. Berry and S. Klein, Geometric phases from stacks of crystal plates, J.Mod.Opt 43, 165 (1996).
- Facchi et al. [1999] P. Facchi, A. Klein, S. Pascazio, and L. Schulman, Berry phase from a quantum Zeno effect, Physics Letters A 257, 232 (1999).
- Chruscinski and Jamiolkowski [2004] D. Chruscinski and A. Jamiolkowski, Geometric phases in classical and quantum mechanics (Birkhäuser Basel, 2004).
- Pancharatnam [1956] S. Pancharatnam, Generalized theory of interference, and its applications - part I, Proceedings of the Indian Academy of Sciences - Section A 44, 247 (1956).
- Tamir and Cohen [2013] B. Tamir and E. Cohen, Introduction to Weak Measurements and Weak Values, Quanta 2, 7 (2013).
- Svensson [2013] B. E. Y. Svensson, Pedagogical Review of Quantum Measurement Theory with an Emphasis on Weak Measurements, Quanta 2, 18 (2013).
- Cho et al. [2019] Y.-W. Cho, Y. Kim, Y.-H. Choi, Y.-S. Kim, S.-W. Han, S.-Y. Lee, S. Moon, and Y.-H. Kim, Emergence of the geometric phase from quantum measurement back-action, Nature Physics , 1 (2019).
- Gebhart et al. [2020] V. Gebhart, K. Snizhko, T. Wellens, A. Buchleitner, A. Romito, and Y. Gefen, Topological transition in measurement-induced geometric phases, Proceedings of the National Academy of Sciences 117, 5706 (2020), arXiv:1905.01147 .
- Nielsen and Chuang [2010] M. A. Nielsen and I. L. Chuang, Quantum computation and quantum information (Cambridge : Cambridge University Press, Cambridge, 2010).
- Wiseman and Milburn [2010] H. M. Wiseman and G. J. Milburn, Quantum measurement and control (Cambridge University Press, 2010) p. 460.
- Jacobs [2014] K. Jacobs, Quantum Measurement Theory and its Applications (Cambridge University Press, Cambridge, 2014).
- Snizhko et al. [2021] K. Snizhko, P. Kumar, N. Rao, and Y. Gefen, Weak-Measurement-Induced Asymmetric Dephasing: Manifestation of Intrinsic Measurement Chirality, Physical Review Letters 127, 170401 (2021), arXiv:2006.13244 .
- Buks et al. [1998] E. Buks, R. Schuster, M. Heiblum, D. Mahalu, and V. Umansky, Dephasing in electron interference by a ‘which-path’ detector, Nature 391, 871 (1998).
- Goldstein and Gefen [2016] M. Goldstein and Y. Gefen, Suppression of Interference in Quantum Hall Mach-Zehnder Geometry by Upstream Neutral Modes, Physical Review Letters 117, 276804 (2016), arXiv:1605.06060 .
- Whitney and Gefen [2003] R. S. Whitney and Y. Gefen, Berry Phase in a Nonisolated System, Physical Review Letters 90, 190402 (2003).
- Whitney et al. [2005] R. S. Whitney, Y. Makhlin, A. Shnirman, and Y. Gefen, Geometric Nature of the Environment-Induced Berry Phase and Geometric Dephasing, Physical Review Letters 94, 070407 (2005).
- Whitney et al. [2004] R. S. Whitney, Y. Makhlin, A. Shnirman, and Y. Gefen, Berry Phase with Environment: Classical versus Quantum, in Theory of Quantum Transport in Metallic and Hybrid Nanostructures, Vol. 230 (Kluwer Academic Publishers, Dordrecht, 2004) pp. 9–23, arXiv:0401376 [cond-mat] .
- Berger et al. [2015] S. Berger, M. Pechal, P. Kurpiers, A. A. Abdumalikov, C. Eichler, J. A. Mlynek, A. Shnirman, Y. Gefen, A. Wallraff, and S. Filipp, Measurement of geometric dephasing using a superconducting qubit, Nature Communications 6, 8757 (2015).
- Snizhko et al. [2019a] K. Snizhko, R. Egger, and Y. Gefen, Non-Abelian Geometric Dephasing, Physical Review Letters 123, 060405 (2019a), arXiv:1904.11262 .
- Snizhko et al. [2019b] K. Snizhko, R. Egger, and Y. Gefen, Non-Abelian Berry phase for open quantum systems: Topological protection versus geometric dephasing, Physical Review B 100, 085303 (2019b), arXiv:1904.11673 .
- Elitzur and Dolev [2001] A. C. Elitzur and S. Dolev, Nonlocal effects of partial measurements and quantum erasure, Physical Review A 63, 062109 (2001).
- Paraoanu [2006] G. S. Paraoanu, Interaction-Free Measurements with Superconducting Qubits, Physical Review Letters 97, 180406 (2006).
- Xu et al. [2011] X.-Y. Xu, J.-S. Xu, C.-F. Li, Y. Zou, and G.-C. Guo, Experimental demonstration of nonlocal effects in the partial-collapse measurement and reversal process, Physical Review A 83, 010101 (2011).
- Lewalle et al. [2017] P. Lewalle, A. Chantasri, and A. N. Jordan, Prediction and characterization of multiple extremal paths in continuously monitored qubits, Physical Review A 95, 042126 (2017).
- Naghiloo et al. [2017] M. Naghiloo, D. Tan, P. M. Harrington, P. Lewalle, A. N. Jordan, and K. W. Murch, Quantum caustics in resonance-fluorescence trajectories, Physical Review A 96, 053807 (2017), arXiv:1612.03189 .
- Lewalle et al. [2018] P. Lewalle, J. Steinmetz, and A. N. Jordan, Chaos in continuously monitored quantum systems: An optimal-path approach, Physical Review A 98, 012141 (2018), arXiv:1803.07615 .