Experimental validation of a phase-field model to predict coarsening dynamics of lipid domains in multicomponent membranes
1Department of Mathematics, University of Houston, 3551 Cullen Blvd, Houston TX 77204
alex@math.uh.edu; aquaini@central.uh.edu; molshan@math.uh.edu
2Department of Biomedical Engineering, University of Houston, 3551 Cullen Blvd, Houston TX 77204
ywang147@uh.edu; smajd9@central.uh.edu
Abstract Membrane phase-separation is a mechanism that biological membranes often use to locally concentrate specific lipid species in order to organize diverse membrane processes. Phase separation has also been explored as a tool for the design of liposomes with heterogeneous and spatially organized surfaces. These “patchy” liposomes are promising platforms for delivery purposes, however their design and optimization through experimentation can be expensive and time-consuming. We developed a computationally efficient method based on the surface Cahn–Hilliard phase-field model to complement experimental investigations in the design of patchy liposomes. The method relies on thermodynamic considerations to set the initial state for numerical simulations. We show that our computational approach delivers not only qualitative pictures, but also accurate quantitative information about the dynamics of the membrane organization. In particular, the computational and experimental results are in excellent agreement in terms of raft area fraction, total raft perimeter over time and total number of rafts over time for two different membrane compositions (DOPC:DPPC with a 2:1 molar ratio with 20% Chol and DOPC:DPPC with a 3:1 molar ratio with 20% Chol). Thus, the computational phase-field model informed by experiments has a considerable potential to assist in the design of liposomes with spatially organized surfaces, thereby containing the cost and time required by the design process.
Introduction
In natural membranes, lateral organization of lipids into distinct dynamic entities, often called lipid rafts or domains, has been recognized as a critical mechanism for dynamic control of the spatial organization of membrane components. Lipid rafts are often enriched in sphingolipids (SLs) and cholesterol (Chol), where the long and saturated acyl chains in SLs enable Chol to intercalate tightly with these lipids, leading to the formation of liquid ordered phase [9, 43]. In contrast, loosely packed phospholipids with unsaturated acyl chains in the membrane form liquid disordered phase. The difference in packing ability among these lipids results in phase separation and formation of rafts [10]. Lipid rafts have been linked to a wide range of cellular functions, from membrane trafficking to inter- and intracellular signaling [9, 43, 10]. Membrane phase separation has thus been the focus of intense research in biophysics, often using model membranes, in the past few decades. One of the most common model membranes for these studies are giant unilamellar vesicles (GUVs) as their micron-scale dimensions allows for direct examination of individual vesicles under optical microscopy [66]. Therefore, fluorescence-based microscopy techniques have been extensively applied to study raft formation in GUVs. Studies on phase separation in GUVs have shed light on different aspects of membrane domains such as their fluidity [32, 57], morphology [56], coarsening dynamics [60], and thermodynamic equilibria [63, 21]. Moreover, advancement in image analysis methods have enabled more accurate assessment of lipid raft formation on GUVs, providing quantitative measurements of the size and shape of these domains [57, 21, 31, 4].
With the improved understanding of membrane phase separation, this phenomenon has further been explored as a tool for the design of liposomes with heterogeneous and spatially organized surfaces. These liposomes have, for instance, provided promising platforms for delivery purposes. Pioneered by Sofou and her collaborators [34, 5, 55], phase separation was utilized to create liposomes with small surface regions of high concentrations of a specific lipid along with its attached targeting moiety. These “patchy” liposomes showed a significantly higher level of targeting selectivity compared to their non-patchy counterparts [5, 55]. Furthermore, a recent study that utilized phase separation to control the distribution of a cationic lipid on liposomes, demonstrated that this approach can reduce the toxicity of these fusogenic liposomes to enhance their delivery performance [28]. Hence, liposomal membranes with well-defined phase behavior can overcome some of the major challenges in the field of intracellular delivery. Design and optimization of such liposomes through experimentation can, however, be expensive and time-consuming and will greatly benefit from computer aided modelling. Since the targeting selectively and cellular interactions of these liposomal carriers will depend on spatial and temporal characteristics of their domains (i.e. size, number, ripening time, etc.), it is important for a computational approach to deliver not only a qualitative picture, but also accurate quantitative information about the dynamics of the membrane organization. This paper takes a step towards the design and validation of computational tools that address this need.
It is only in recent years that computational studies of phase separation in lipid bilayers have emerged as a complement to experimental investigations [7]. Multicomponent vesicles have been studied with different numerical approaches: molecular dynamics [47, 16, 7], dissipative particle dynamics [40, 64, 3], and continuum based models [65, 45, 59, 41, 22]. A limit of molecular dynamics simulation is the length and time scales that can be investigated. Dissipative particle dynamics is a coarse graining technique that allows for a significant computational speed-up with respect to molecular dynamics, but is still computationally very expensive depending on the application. Thus, we focus on continuum based models that offer a more time- and cost-efficient alternative. We consider the diffuse-interface description of phase separation given by the Cahn–Hilliard (CH) phase–field model [12, 11]. In [67], it is shown that with a suitable modification of the Ginzburg–Landau free energy, the CH model can successfully simulate lipid microdomains. In our work on phase separation in steady membranes and complex biologically inspired shapes [68], we showed that numerical results from a surface CH equation successfully reproduce the patterns of lipid domains experimentally observed in [62]. All the above references dealing with continuum based models have one key limitation: they do not tackle a quantitative validation of the phase-field model against experimental data. More precisely, the majority of the works are only concerned with modeling and numerical aspects of lateral phase separation, while in [22, 67] it is shown that numerical results can qualitatively reproduce certain experimental trends (i.e., trapped coarsening and power law growth of average raft diameter, respectively). Here, we present the first quantitative comparison of the surface CH phase-field model with experimental data on lateral phase separation in GUVs.
Besides a valid mathematical description, computer modeling requires effective numerical algorithms, especially if evolution (rather than equilibrium) and uncertainty quantification are of interest. Although there exists an extensive literature on numerical methods for the CH equation in planar and volumetric domains (see, e.g., recent publications [27, 61, 44, 13] and references therein), there were not so many papers where the equations are treated on surfaces exhibiting curvature until recently [24, 29, 26, 22, 17, 23]. Benefiting from these new developments we build our simulation tools on a trace finite element method (FEM) [49] (one of the most flexible numerical approach to handle complex geometries), adaptive time integration [25] (necessary to handle a high variation of temporal scales), and state-of-the-art iterative solvers for algebraic systems.
Utilizing the above-mentioned numerical methods to solve the CH equation on curved surfaces, we model lateral phase separation in a multicomponent liposomal membrane. We apply fluorescence confocal imaging of electrofomed GUVs of a ternary lipid composition at two distinct molar ratios for validation of this model. We demonstrate that the results of the present simulations on the number of domains, their ripening dynamics, and their size and shape are in a very good agreement with those from experiments, but require a thoughtful choice of model parameters. This continuum based model thus has a considerable potential for the design of liposomes with spatially organized surfaces, thereby greatly reducing the need for costly and time-consuming experiments.
Materials and methods
Experimental approach
Materials
Lipids 1,2-dioleoyl-sn-glycero-3-phosphocholine (DOPC), 1,2-dipalmitoyl-sn-glycero-3-phosphocholine (DPPC), 1,2-dipalmitoyl-sn-glycero-3-phosphoethanolamine-N- (lissamine rhodamine B sulfonyl) (Rho-PE) were purchased from Avanti Polar Lipids (Alabaster, AL). We purchased the sucrose from VWR (West Chester, PA). Cholesterol was from Sigma Aldrich (Saint Louis, MO) and chloroform from Omnipure (Caldwell, Idaho). All lipid stock solutions were prepared in chloroform. Indium tin oxide (ITO) coated glasses and microscope glass slides were from Thermo Fisher Scientific (Waltham, MA) and coverslips were from Corning Inc. (Corning, NY). ITO plates were cleaned using chloroform, ethanol and DI water prior to use. Microscope slides and coverslips were cleaned with ethanol and DI water before usage.
Preparation of Small Unilamellar Vesicles (SUVs)
SUVs were prepared using dehydration-rehydration and tip sonication as described in our previous studies [52, 46]. In brief, a mixture of DOPC, DPPC, Chol at the desired molar ratio (see below) plus 0.6 mol% Rho-PE was prepared in chloroform. 1 ml of this solution was added into a 5 ml pearl-shaped flask and was dried under vacuum using a rotary evaporator (Hei-Vap, Heidolph, Germany) for 2 hr. The resultant lipid film was then hydrated using pre-heated DI water (60°C) to a final lipid concentration of 2.5 mg/ml. The milky suspension was then sonicated using a tip-sonictor (55-Watt Sonicator Q55, Qsonica, Newtown, CT). The procedure of 1 min tip sonication at 10 Hz with 30 sec resting intervals was applied for about 20 times to produce a clear solution of SUVs. The SUV solution was stored at 4°C and used within 5 days.
Lipid compositions applied here were (i) DOPC:DPPC with a 2:1 molar ratio with 20% Chol, referred to as 2:1:20% composition, and (ii) DOPC:DPPC with a 3:1 molar ratio with 20% Chol, referred to as 3:1:20% composition. Note that both compositions contained Rh-PE to allow for fluorescence microscopy and visualization of lipid domains.
Preparation of Giant Unilamellar Vesicles (GUVs)
We prepared GUVs using the common technique of electroformation originally developed by Angelova et al. [2] with modifications detailed in our previous studies [52, 33]. Briefly, of aqueous dispersion of SUVs was deposited onto each of two ITO plates as small droplets and left overnight to dry. A thin PDMS frame with tubing was sandwiched between the two ITO plates to assemble the electroformation chamber. A solution of sucrose at 235 mM was then slowly injected into the chamber to rehydrate the lipid patches. Next, we placed the device in a 60°C oven to exceed the highest melting temperature in the lipid composition (in this case DPPC with melting temperature of 41.2°C) where an AC electrical field was applied through copper tapes attached to the ITO plates. With a frequency of 50 Hz, the electric field was increased to 2 Vpp at rate of 100 mVpp/min and kept for 3 hours using a function waveform generator (4055, BK Precision, Yorba Linda, CA). Once formed, GUVs were detached by decreasing the frequency to 1 Hz for 30 min.
GUV Imaging
For microscopy, GUVs were collected from the electroformation chamber through the outlet tubing and of the GUV-containing solution was placed on a clean microscope glass slide that was then covered with a clean coverslip. The edges were sealed with nail polish to immobilize the coverslip. The sample was reheated on a hot plate (Hei-Connect, Heidolph, Germany) to 60°C, for at least 5 min before the imaging started. All the images were acquired using a Zeiss LSM 800 confocal laser scanning microscope (Zeiss, Germany). The sample was placed on the microscope stage where it gradually cooled down to the room temperature, which was monitored and recorded. It should be noted that the time (for image collection) was recorded with time zero considered as when the sample was removed from the hot plate. We applied epi-fluorescence imaging for the initial assessment of GUVs and their lipid domains and applied confocal imaging to further assess the domains on GUVs and quantify their size as described below. Epi-fluorescence images were collected using a 40X objective with numerical aperture (NA) of 0.95, with 538-562 excitation filter wavelength and 570-640 emission filter wavelength. Confocal images were collected using a 63X oil objective with NA of 1.40 using a 561 nm wavelength laser. Confocal image slices were collected with 0.4- Z-steps, depending on the size of the examined GUV, to minimize the time required for imaging the entire vesicle without significant movement of vesicle. Confocal images were analyzed using ZEN software (ZEN 2.6 lite, Zeiss, Germany). Considering that Rh-PE has shown preferential partitioning into the liquid disordered phase [37, 30], we assumed that
dark patches on the examined GUVs represented the liquid ordered phase while the red regions represented the liquid disordered phase.
Image Analysis for Lipid Domain Characterization
For the analysis, we assumed that the GUVs were perfect spheres, and and that the lipid domains were in the form of spherical caps (Fig. 1A). For each GUV, all collected confocal image slices were analyzed to determine the vesicle diameter (using the confocal slice with the largest circular cross-section of the GUV) and its radius , to calculate the vesicle total surface area . For lipid domains, which corresponded to dark arcs on individual confocal slices (Fig. 1B), diameter of the base of the cap was determined from the slice with the largest dark arc for a given domain and its corresponding radius was used to calculate the raft perimeter . Surface area of each cap (i.e. lipid domain) was calculated using:
| (1) |
where corresponded to the angle shown in Fig. 1A and was calculated using:
We performed this analysis on 18 GUVs with 2:1:20% composition and 17 GUVs with 3:1:20% composition from at least 2 independent experiments per composition.
Computational approach
Mathematical model
A well established continuum-based model for the process of spinodal decomposition and phase separation is the CH phase-field model [12, 11]. In order to state the model, let be a sphere representing a liposome with a diameter and distributed mass concentrations , . Here, is the specific masses of each phase and . We choose , , to be the representative concentration, e.g. the concentration of the ordered phase, meaning in ordered phase and in the disordered phase. The surface CH equation governs the evolution in time of , :
| (2) |
In (2), is an initial distribution of concentration, corresponding to a homogeneous mixture, is the specific free energy of a homogeneous phase, stands for the tangential gradient, and is the Laplace–Beltrami operator. See also [68]. Problem (2) is obtained from minimizing the total specific free energy subject to the conservation of total concentration . Parameter in the free energy functional defines the width of the (diffuse) interface between the phases. Finally, is the so-called mobility coefficient (see [39]). We consider the degenerate mobility of the form
| (3) |
with diffusivity constant . Mobility (3) is a popular choice for numerical studies. Although it is known that the dependence between the mobility and the concentration produces important changes during the coarsening process, only a few authors consider more complex mobility functions; see, e.g., [70]. In the absence of studies on the appropriate mobility function for lateral phase separation in liposomes, here we choose to use (3).
While both model parameters and correspond to thermodynamics properties of matter, their direct evaluation is not straightforward. In particular, the coefficient determines the rate of change of depending on the specific free energy fluctuations, rather than depending on a molar flux due to molecular Brownian motion. Therefore, the known rates for lateral diffusion in lipid membranes [42] are of limited help in setting . Given the uncertainties about the values of and , we follow an alternative (data driven) approach: If one looks at (2) as a dynamical system, then the time scale depends linearly on , while defines the relative duration of the (fast) decomposition and (slow) patterns evolution phases. This allows us to apply backward optimization: we set the coefficient values to match the time evolution of the patterns observed in vitro. This approach suggested the following values: for the 3:1:20% composition and for the 2:1:20% composition, and for both compositions. The value of over-estimates the 5 nm prediction of the transition layer width found in [53] because such width is beyond the current resolution capabilities of the discrete continuum model. Note that the sensible variation of with the membrane composition and temperature should be expected and it (partially) compensates for the unknown dependence of the free energy functional form on the composition.
In order to model an initially homogenous liposome, the initial concentration is defined as a realization of Bernoulli random variable with mean value , i.e. we set:
| (4) |
Following the thermodynamic principles described in the next section, we set for the 3:1:20% (DOPC : DPPC : Chol) composition and for the 2:1:20% composition.
Numerical method and input data
With the exception of few equilibrium states, the CH equation lacks analytical solutions. Thus, one has to resort to a numerical solution. We discretize problem (2) with the trace finite element method (Trace FEM), a state-of-the-art computational technique for systems of partial differential equations (PDEs) posed on surfaces [49]. The first two steps in the application of Trace FEM are common to other finite element methods. First, one rewrites (2) as the system of two second order PDEs by introducing the chemical potential as another unknown variable: . Then, one proceeds to an equivalent integral form of the PDE system, also known in PDE theory (see, e.g. [20]) as weak formulation. The weak formulation is obtained by multiplying the equations by smooth test functions, integrating the equations over , and applying the surface Stokes formula. For the CH equation (2), the weak formulations reads: Find concentration and chemical potential such that
| (5) | |||
| (6) |
for any sufficiently regular test functions and on .
The remaining steps are specific to Trace FEM. The sphere is immersed in a cube, which is tessellated into tetrahedra. See Fig. 2. This tessellation forms a regular triangulation of the bulk domain in the sense of [14]. The zero level set of the (i.e., linear) Lagrangian interpolant (to the vertices of the tetrahedra) of the signed distance function of provides a polyhedral approximation of the sphere, which will further be used for numerical integration instead of in (5)–(6). Tetrahedra intersected by form an active mesh that supports the degrees of freedom
(dark gray layer in Fig. 2). On we further define a (finite dimensional linear) space of continuous functions, which are polynomials of degree 1 on each tetrahedra from . Seeking approximations of and in such space (denoted with and ) so that that eq. (5)–(6) are satisfied for and in the same space reduces problem (5)–(6) to a large (but finite) system of ordinary differential equations (ODEs). That constitutes the Trace FEM; see [68, 69] for further implementation details. The finite element approximation to the solution enjoys a guaranteed convergence to the true solutions of the PDE problem if the mesh is refined [48, 19]. Hence, the fidelity of the numerical solution is ensured by a sequence of mesh refinements until the solutions on two subsequent meshes demonstrate the same qualitative and quantitative behavior. The final finest mesh, which is the one we adopted for the numerical results reported in this paper, was produced by a 6-level refinement of the coarse mesh shown in Fig. 2, leading to active degrees of freedom. The resulting system of ODEs is integrated in time for to final time using a semi-implicit stabilized Euler method [58] and an adaptive time stepping technique [25]. Thus, the piecewise polynomial approximations and become available at times , . The time step adaptively varies from s during the fast initial phase of spinodal decomposition to about s during the later slow phase of rafts coarsening and growth, and up to s when the process is close to equilibrium. To pass from time to time , a system of algebraic equations needs to be solved in order to get and at time . Such system features a large sparse matrix that has a block structure. To solve it, the GMRES [54] iterative method with a block preconditioner (see, e.g., [6]) is successfully applied.
Note that the finite element method conforms to the mass conservation principle behind (5)–(6) and hence the numerical solution satisfies
| (7) |
for all . Another quantity of interest, is the total perimeter of the rafts, , which can be defined as the length of the (multi-component) curve that is the level set . This definition is implicit, so for numerical purposes we set
| (8) |
For small , this quantity converges to the length of the level-set . Here is a calibration constant such that the computed perimeter is exactly for the equilibrium solution of the 1:1 composition.
Results and Discussion
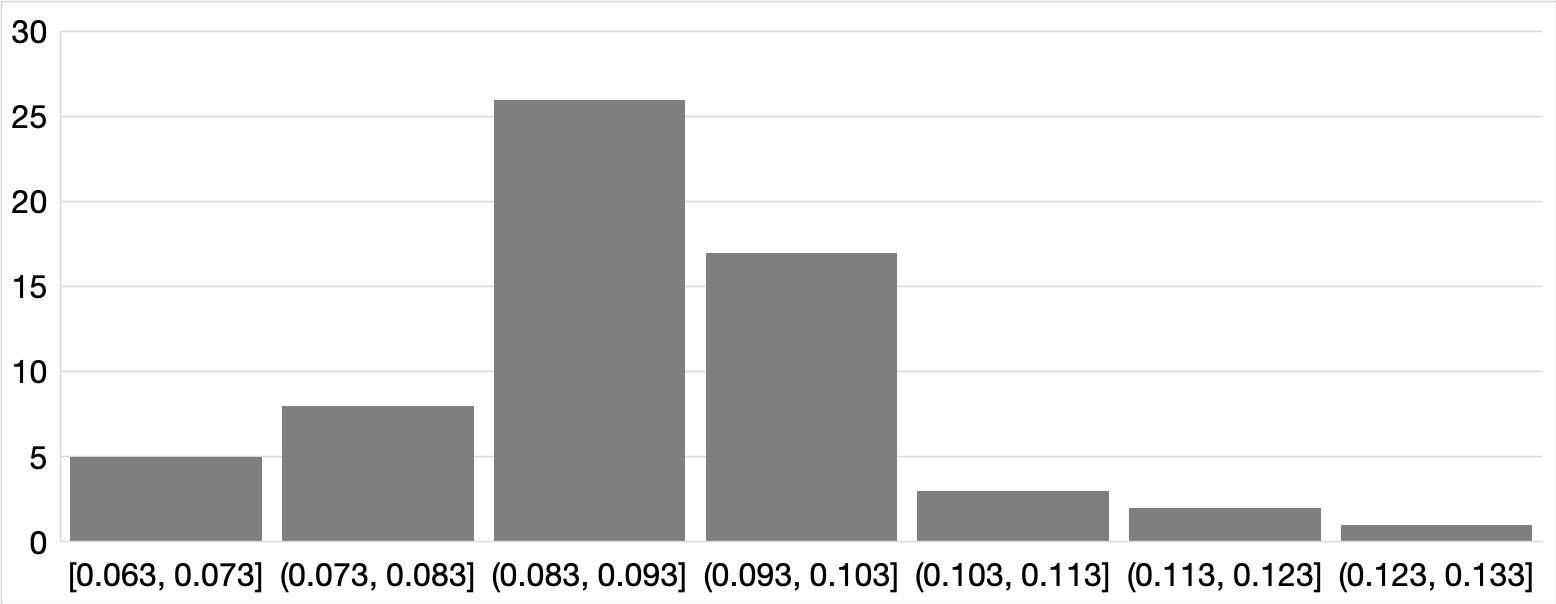
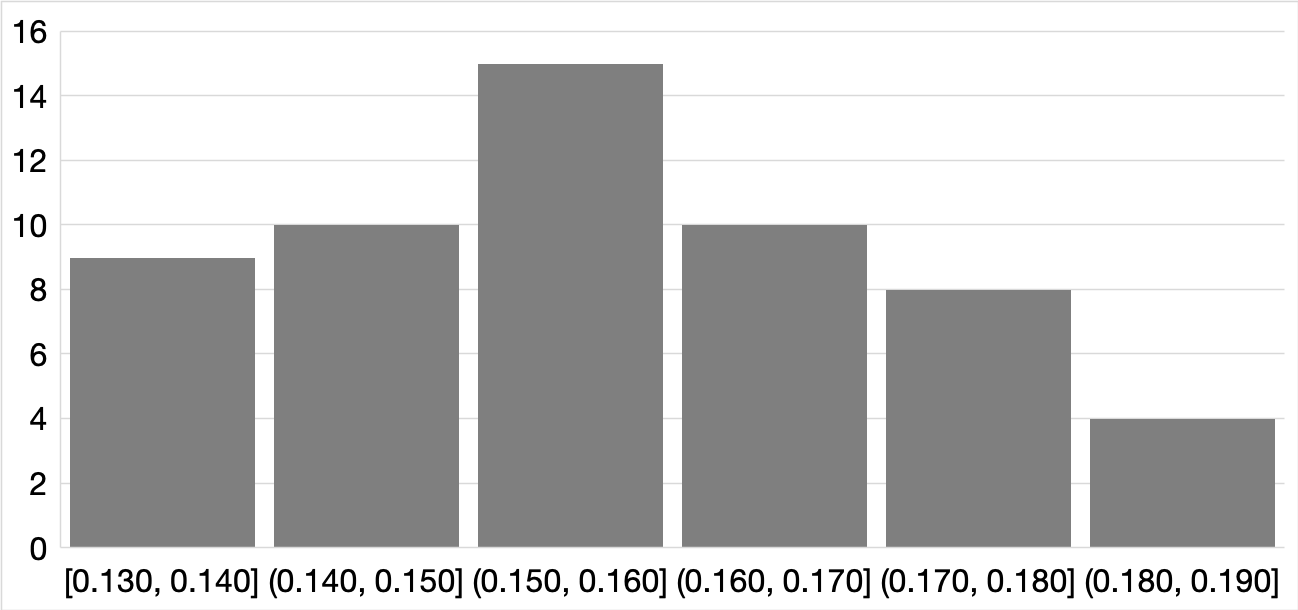
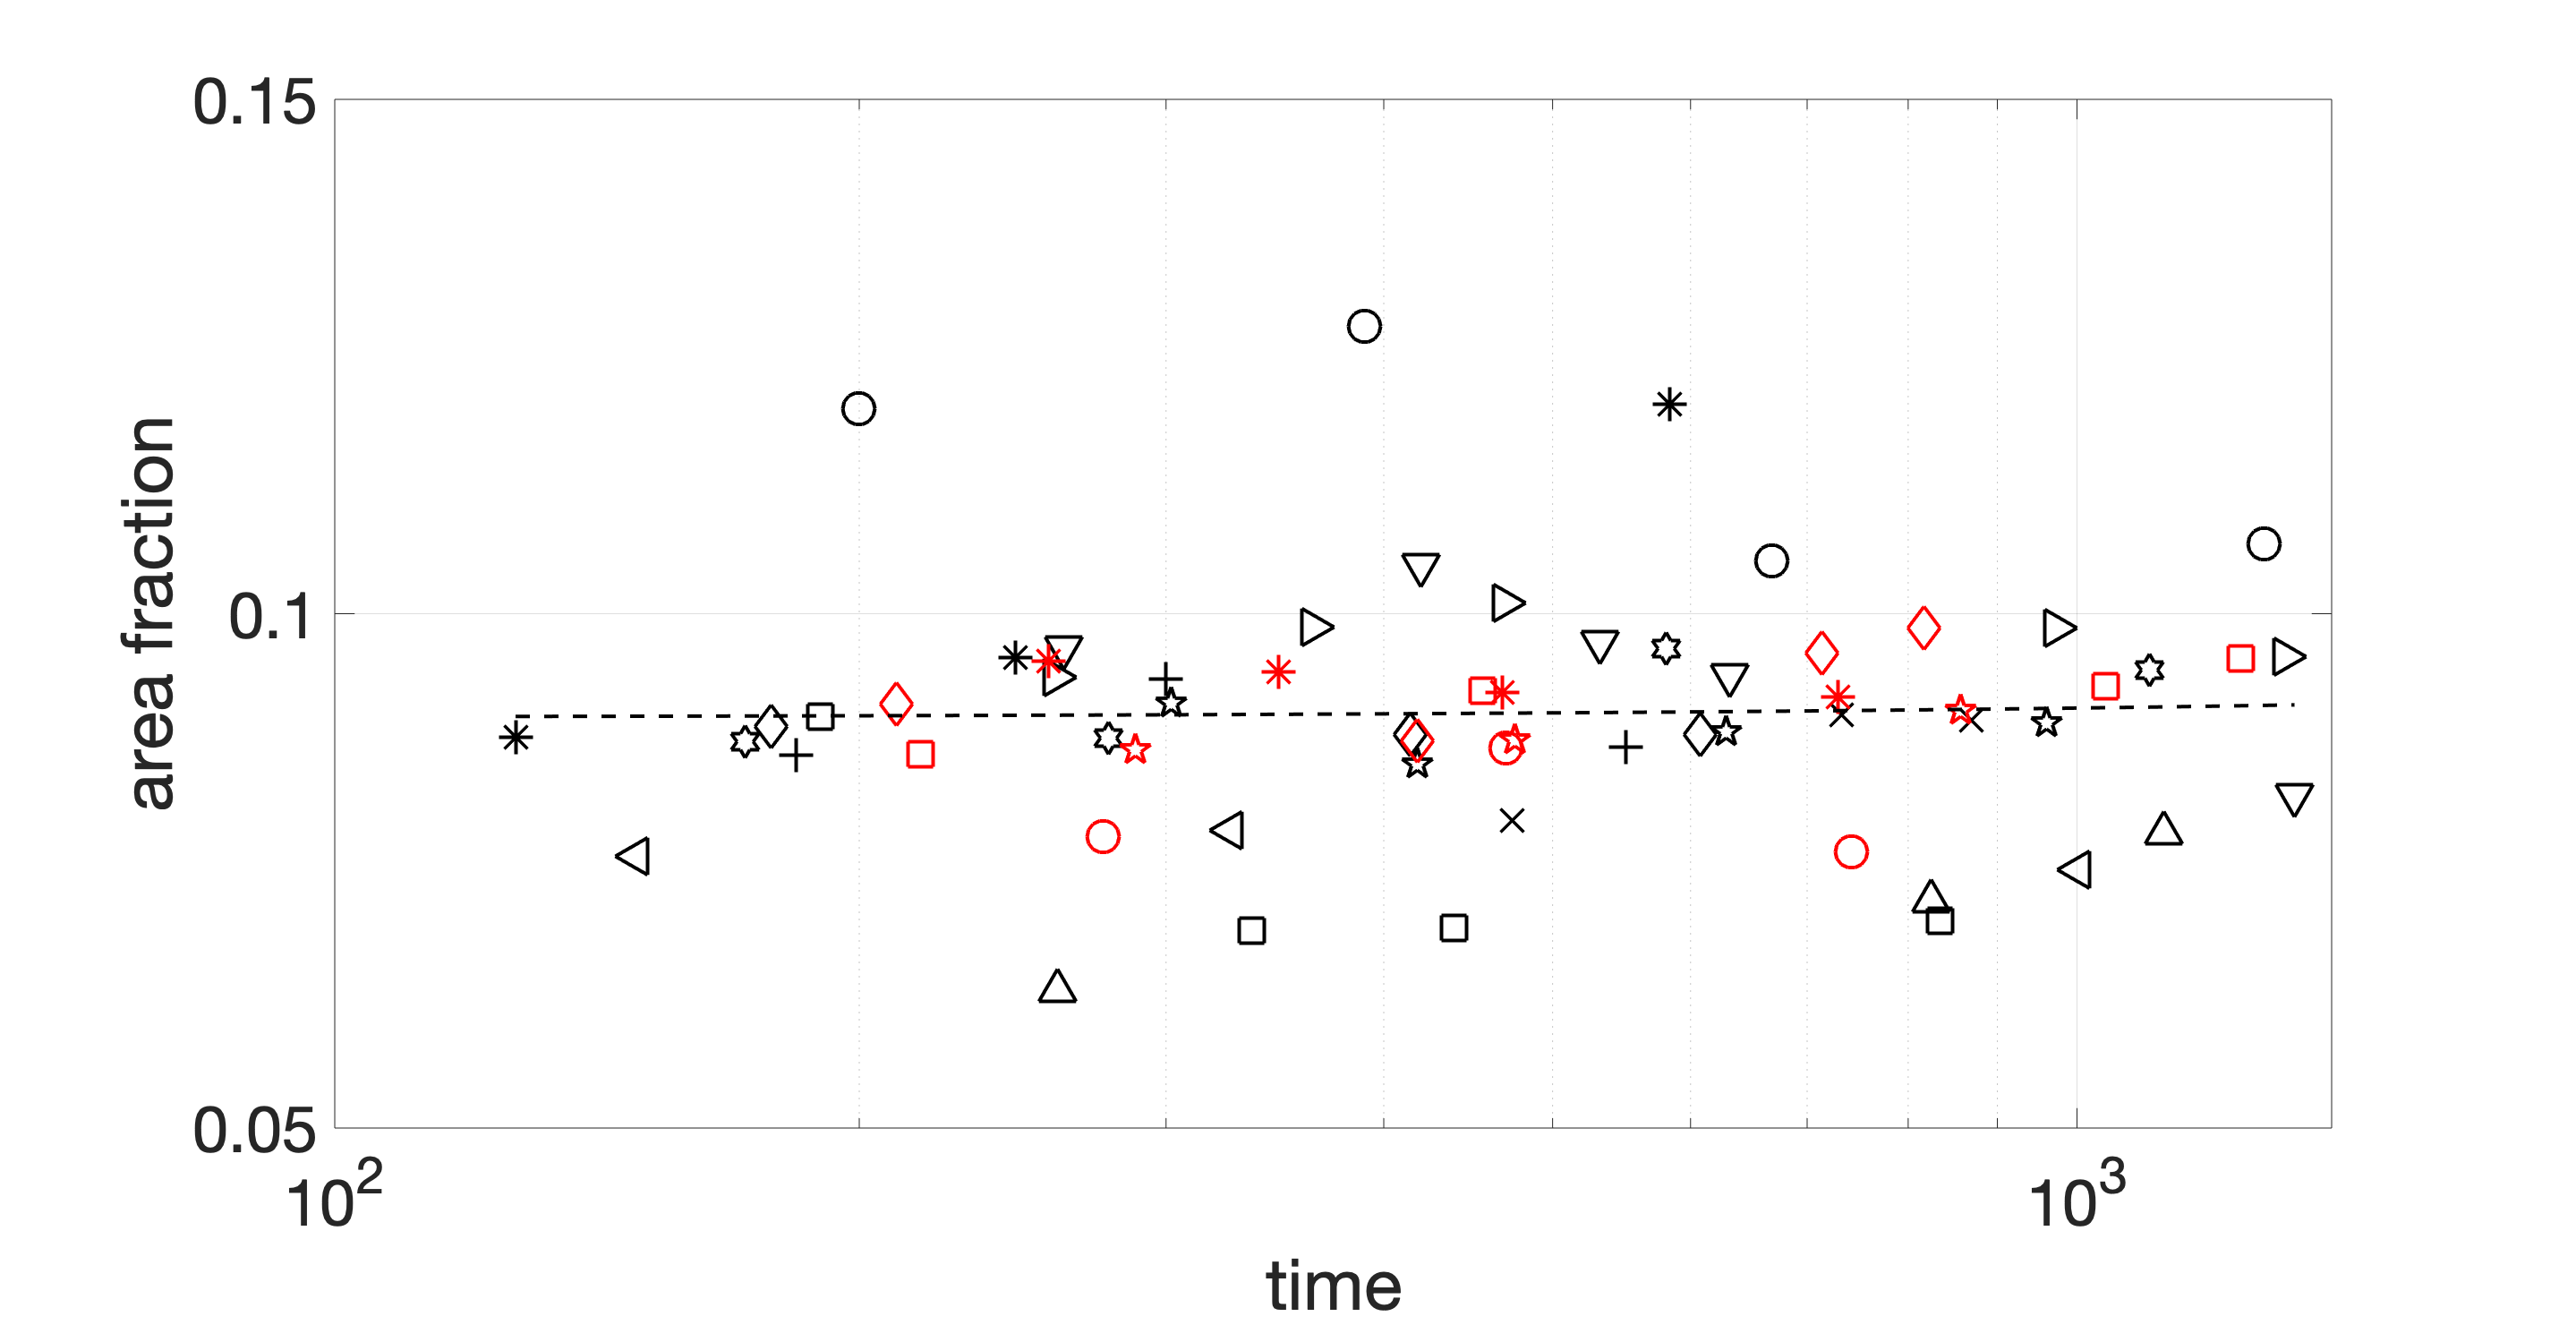
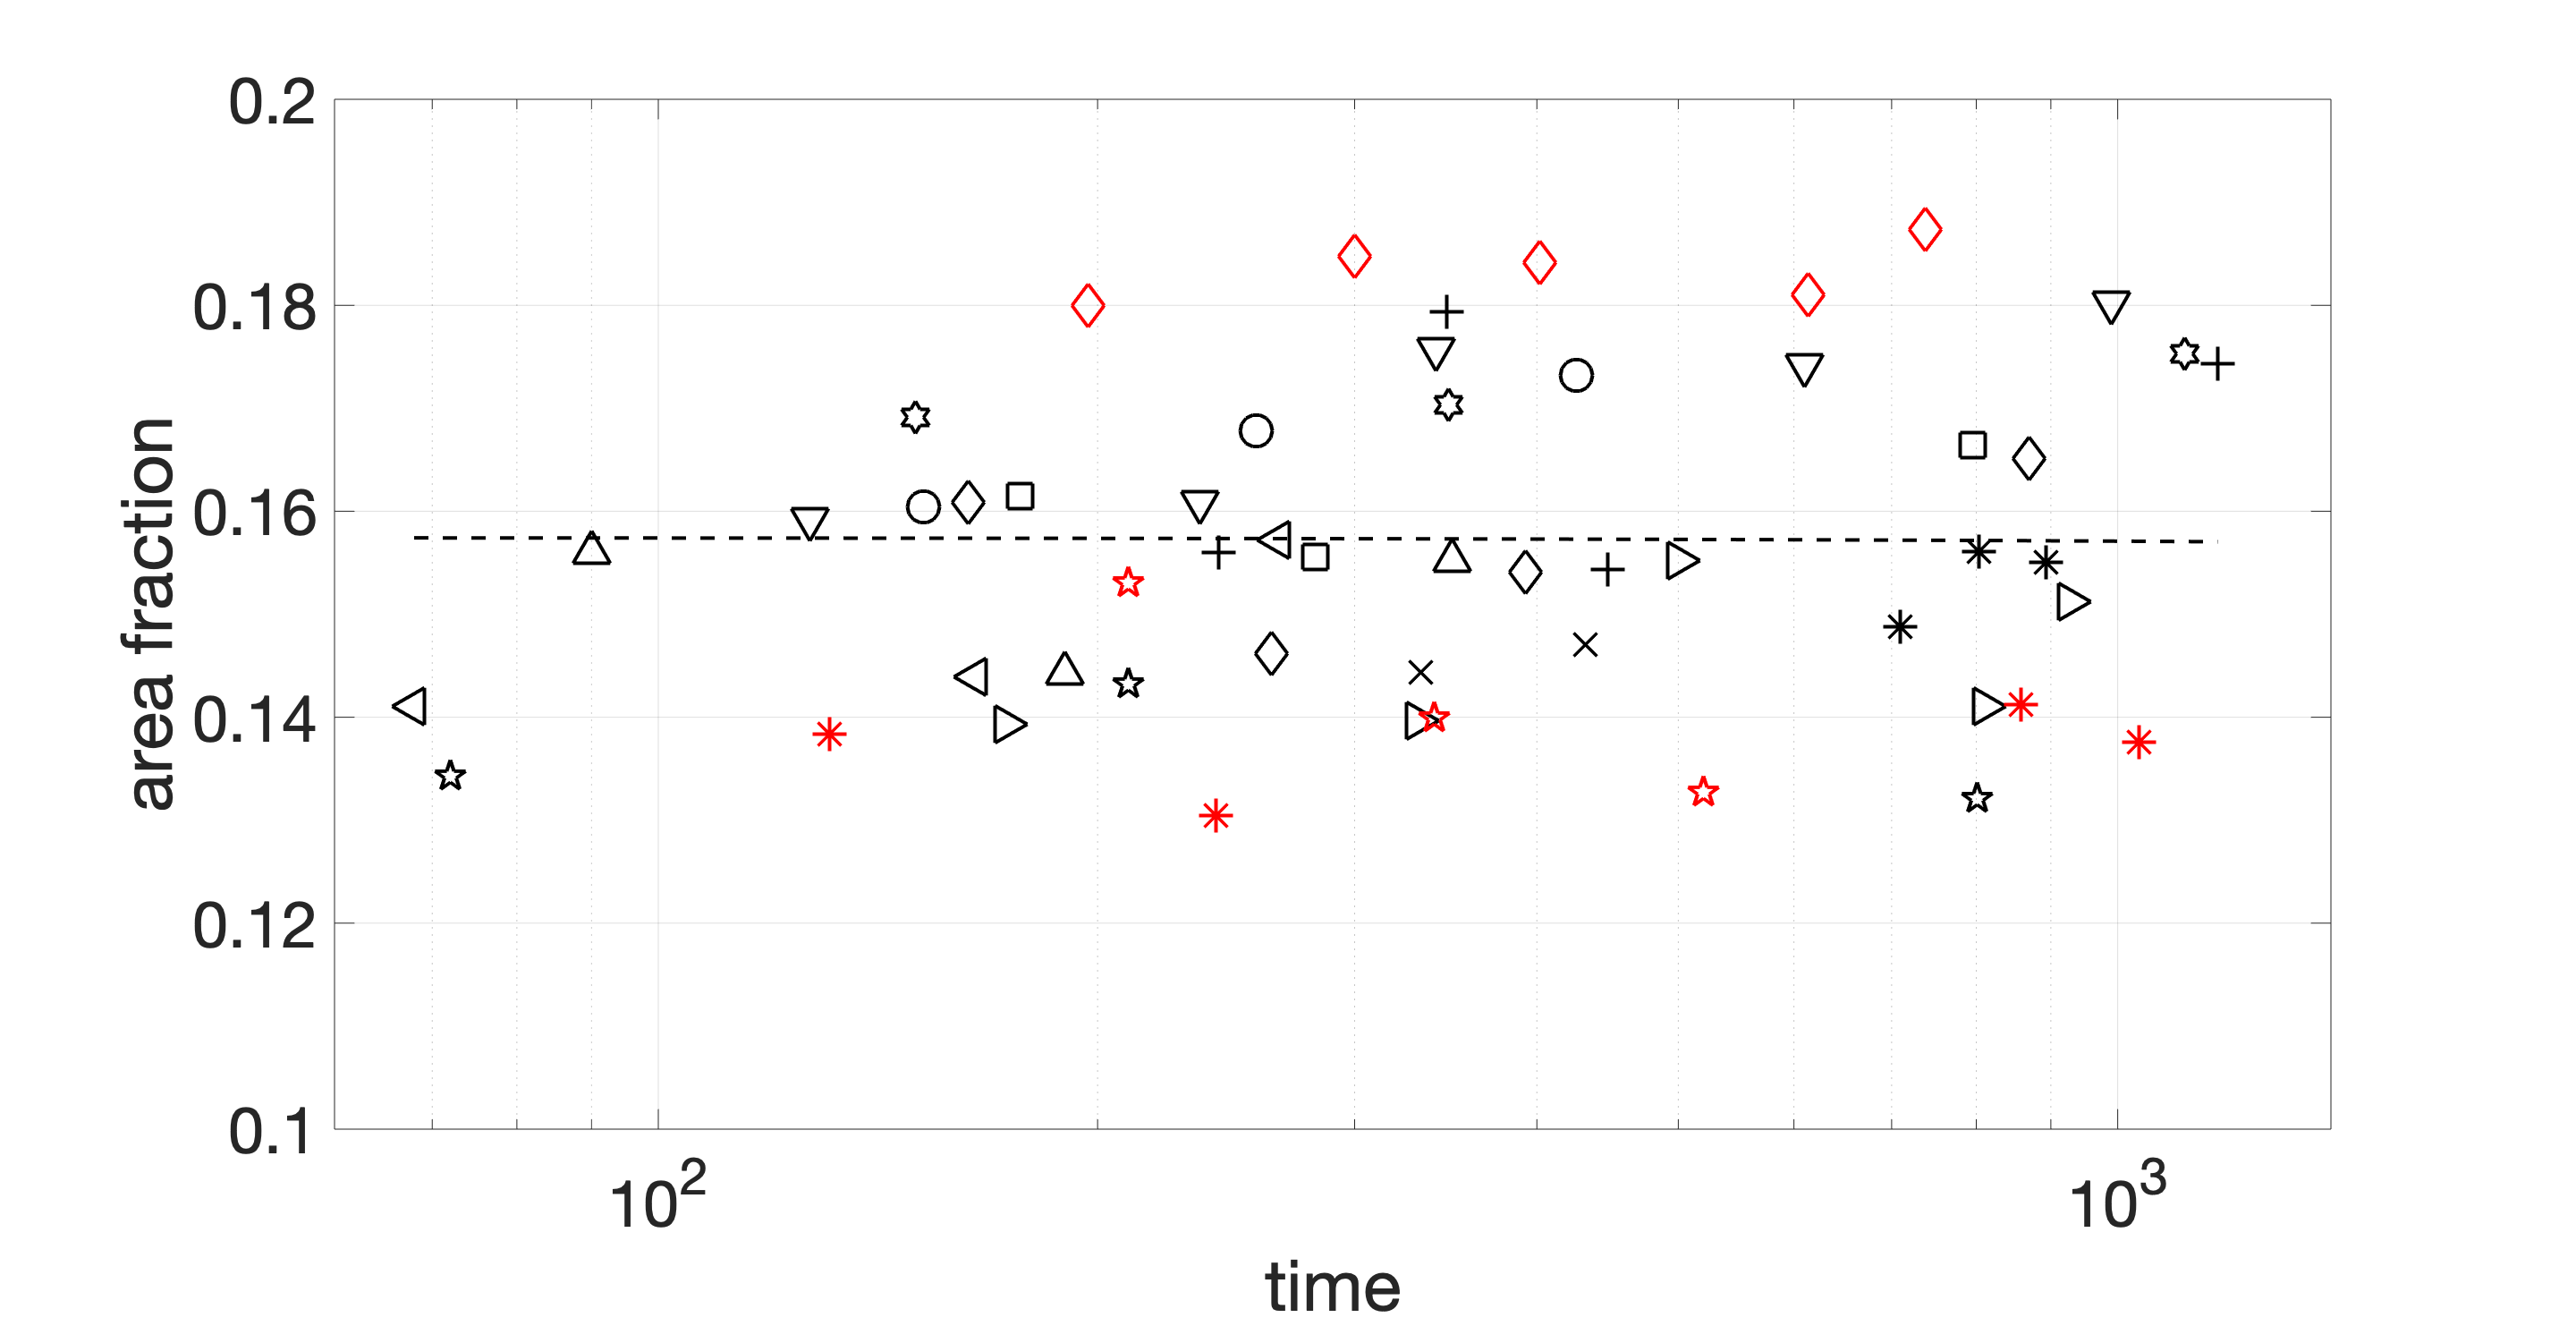
Ternary membranes composed of a lipid with low transition temperature (), a lipid with high , and a sterol such as cholesterol, have frequently been reported to separate into two co-existing phases of liquid ordered () and liquid disordered () near room temperature when mixed in proper ratios [30, 62]. One such membrane composition is DOPC:DPPC:Chol, in which phase is composed primarily of DOPC (lipid with unsaturated acyl chains and low ) and phase is primarily composed of Chol and DPPC (lipid with saturated acyl chains and high ). Here, we prepared two sets of GUVs with this ternary membrane composition at molar ratios of 2:1:20% and 3:1:20% using electroformation. We studied phase separation on these GUVs at 19.2°C for 2:1:20% and 17.5°C for 3:1:20% composition, as we expected the latter to have a lower miscibility temperature [62]. Trace amounts of Rh-PE in GUVs enabled monitoring phase separation using fluorescence microscopy, where this lipid partitioned into phase, providing a great contrast between the two phases. Using confocal fluorescence microscopy, we examined a minimum of 17 GUVs (from 2-3 independent experiments) for the number of their lipid domains as well as area and perimeter of domains at different time points, for each GUV composition. Fraction of vesicle surface area occupied by dark domains, i.e. raft area fraction, in GUVs was then calculated and is summarized in Fig. 3. Histograms in Fig. 3 show the distribution of raft area fractions for compositions 3:1:20% and 2:1:20%. Notably, this area fraction showed only slight (i.e. non-significant) changes at different time points on a given GUV while the number of domains reduced with time (see Fig. 4). To validate our experimental results, we compared these results to area fractions predicted by the literature-reported phase diagrams for this ternary membrane.
From a thermodynamic point of view, co-existence of different phases in ternary membranes of DOPC:DPPC:Chol at equilibrium can be described through phase diagrams. These diagrams suggest that at temperatures studied here (16-19°C), DOPC:DPPC:Chol membrane, at both molar ratios of 3:1:20% and 2:1:20%, is in a binary state of and coexistence [63]. Given the sensitivity of phase diagrams to temperature, we focused on those closest to our experimental temperatures, i.e. 20°C for 2:1:20% and 15°C for 3:1:20% composition. Relying on tie-lines and their corresponding endpoints on the phase diagrams [63], we determined the lipid composition of the two liquid phases in the above-mentioned membranes (see Table 1). Using these values, we then proceeded to find the fraction of total lipids in each phase and finally, the raft area fraction for each membrane composition, as described below and summarized in Table 1.
| Membrane composition | Liquid ordered () | Liquid disordered () | Lipid fraction | Area fraction | |||||
|---|---|---|---|---|---|---|---|---|---|
| DOPC:DPPC:Chol (Temp) | DOPC | DPPC | Chol | DOPC | DPPC | Chol | |||
| 3:1:20% (15°C) | 22% | 43% | 35% | 66% | 16% | 18% | 0.13 | 0.86 | 10.8% |
| 2:1:20% (20°C) | 20% | 48% | 32% | 60% | 22% | 18% | 0.17 | 0.83 | 13.6% |
The fraction of lipids in each of the coexisting phases can then be calculated by [15]:
where () is the fraction of lipids that are in the corresponding phase , represents the molar fraction of a specific lipid in the membrane, represents the molar fraction of this lipid in the corresponding phase, and ( and ) is the molar fraction of this lipid in the other phase. Given the two-phase state of the membrane, the remaining of lipids are in the other phase, and thus:
See Table 1 for the summary of lipid fractions.
The area occupied by each of the phases can be approximated based on the number of lipid molecules and their corresponding cross-sectional areas in each phase. Cholesterol is known to intercalate with the tail region of its surrounding lipids, exerting a condensation effect on these lipids [51, 36, 18]. This effect has been studied for DOPC bilayers and DPPC bilayers independently. In the case of DOPC/Chol mixtures, the area per lipid molecule (DOPC and Chol) was shown to decrease, with an approximately linear relationship, with increasing Chol content (up to 50%) [51]. Assuming a molecular area of 2 for DOPC lipid (in the absence of Chol) at 30°C, and an area contraction coefficient of 2/°C for this lipid [38] the lipid molecular area for DOPC/Chol in a particular phase at temperature can be calculated by:
where is Chol mole fraction within the corresponding phase. For DPPC, increasing Chol content has been reported to reduce the area per lipid molecule (DPPC and Chol) in a non-linear fashion [18, 36]. Assuming an area contraction coefficient of 2/°C for DPPC [38], the area per lipid molecule for DPPC/Chol in a particular phase at temperature can be found by:
where is the lipid molecular area at the Chol molar fraction of at 25°C from the analytical calculation provided by [36].
The number of lipid molecules in a given phase for different lipid species can be calculated by [35]:
where represents the total number of lipids, is the molar fraction of this lipid in the corresponding phase. Assuming Chol is distributed uniformly within each phase, the area occupied by each phase can be estimated by:
where and represent the number of DOPC lipids and DPPC lipids, respectively, in the corresponding phase. Therefore, the raft area fraction (i.e. the area fraction of ) on liposomes of these compositions is:
See Table 1 for calculated area fractions. Note that raft area fractions are sensitive to temperature, due to the temperature sensitivity of the membrane phase behavior, and they increase with a decrease in temperature. For instance, using the same approach to estimate the raft area fraction in 2:1:20% membrane at 17.5°C led to a value of 19.9% for area fraction compared to 13.6% at 20°C. The linear interpolation to predict the raft area fraction at 19.2°C between the two above-mentioned fractions at 17.5°C and 20°C gives the fraction value of 15.6%. This value is very close to the experimental average fraction of 15.7% measured at 19.2°C (see caption of Fig. 3). Similarly, for 3:1:20% composition, the above estimation provides a fraction value of 14.9% at 10°C compared to 10.8% at 15°C. The linear extrapolation of these two fractions, predicts a value of 8.7% for raft area fraction at 17.5°C, which is again in agreement with our experimental average fraction of 9.0% (see caption of Fig. 3). We thus used area fractions of 16% for 2:1:20% composition and 10% for 3:1:20% composition to set the initial membrane composition in our simulations.
Independent of the experimental results,10 numerical simulations were run for each composition. All the simulated liposomes had a diameter and they differed in the initial composition, set using the thermodynamics based estimation outlined earlier. The total raft perimeter and the total number of rafts were tracked over time for each simulation and the results were compared to those from experiments. The simulated raft area fraction remains constant over time, and hence is not reported alone, since the CH model is conservative, as we already remarked. It is noteworthy that our experimental results on raft area fraction supported this assumption (see Fig. 4).
In order to compare the total raft perimeter between simulations and experiments, we first scaled all the data by the radius of the corresponding GUV, since the diameter of GUVs varied in the experiments (between 8-) while it was constant in the simulations. Fig. 5 reports all the rescaled experimental measurements with markers (a different marker for each GUV) and the average of the computed total raft perimeter from all the simulations with a solid line for compositions 3:1:20% and 2:1:20%. In both cases, the average of the computed total raft perimeters falls within the cloud of experimental measurements. For further insights, we then fitted the experimental data with a power function:
| (9) |
where exponent is the critical parameter. The least squares fitting gives for composition 3:1:20% and for composition 2:1:20%. The corresponding power curves are reported in dashed line in Fig. 5.
It is known that the limiting behavior of the CH problem satisfies the Mullins–Sekerka dynamics, characterized by an increase of the average size of (small) rafts and a reduction in the number of rafts. This process takes the name of Ostwald ripening [50]. For the Ostwald ripening in two dimensions, it was shown (e.g., in [1]) that a properly defined average of the raft diameters obeys the well-known growth law predicted in higher dimensions by the Lifschitz–Slyozov–Wagner theory [8]. Hence, if the dynamics of raft growth in lipid membrane can be quantitatively described by a Ginzburg-Landau type of model, then the averaged total raft perimeter in the middle phase of coarsening should decay nearly according to law. This is very close to what we obtained with the least square fitting shown in Fig. 5, supporting the common expectation about applicability of CH and similar models for describing phase separation in lipid membranes. The least squares fitting of the experimental data reinforces our model choice and confirms that the numerical simulations in average correctly reproduce the trend of the experimental data for both membrane copositions. Indeed, the solid line (simulation) and the dashed line (power curve fitting) in Fig. 5 are close to each other in the the middle phase of raft coarsening, i.e. roughly between and s. In particular, we remark a great match for composition 2:1:20%, whose data give an exponent in (9) closer to .
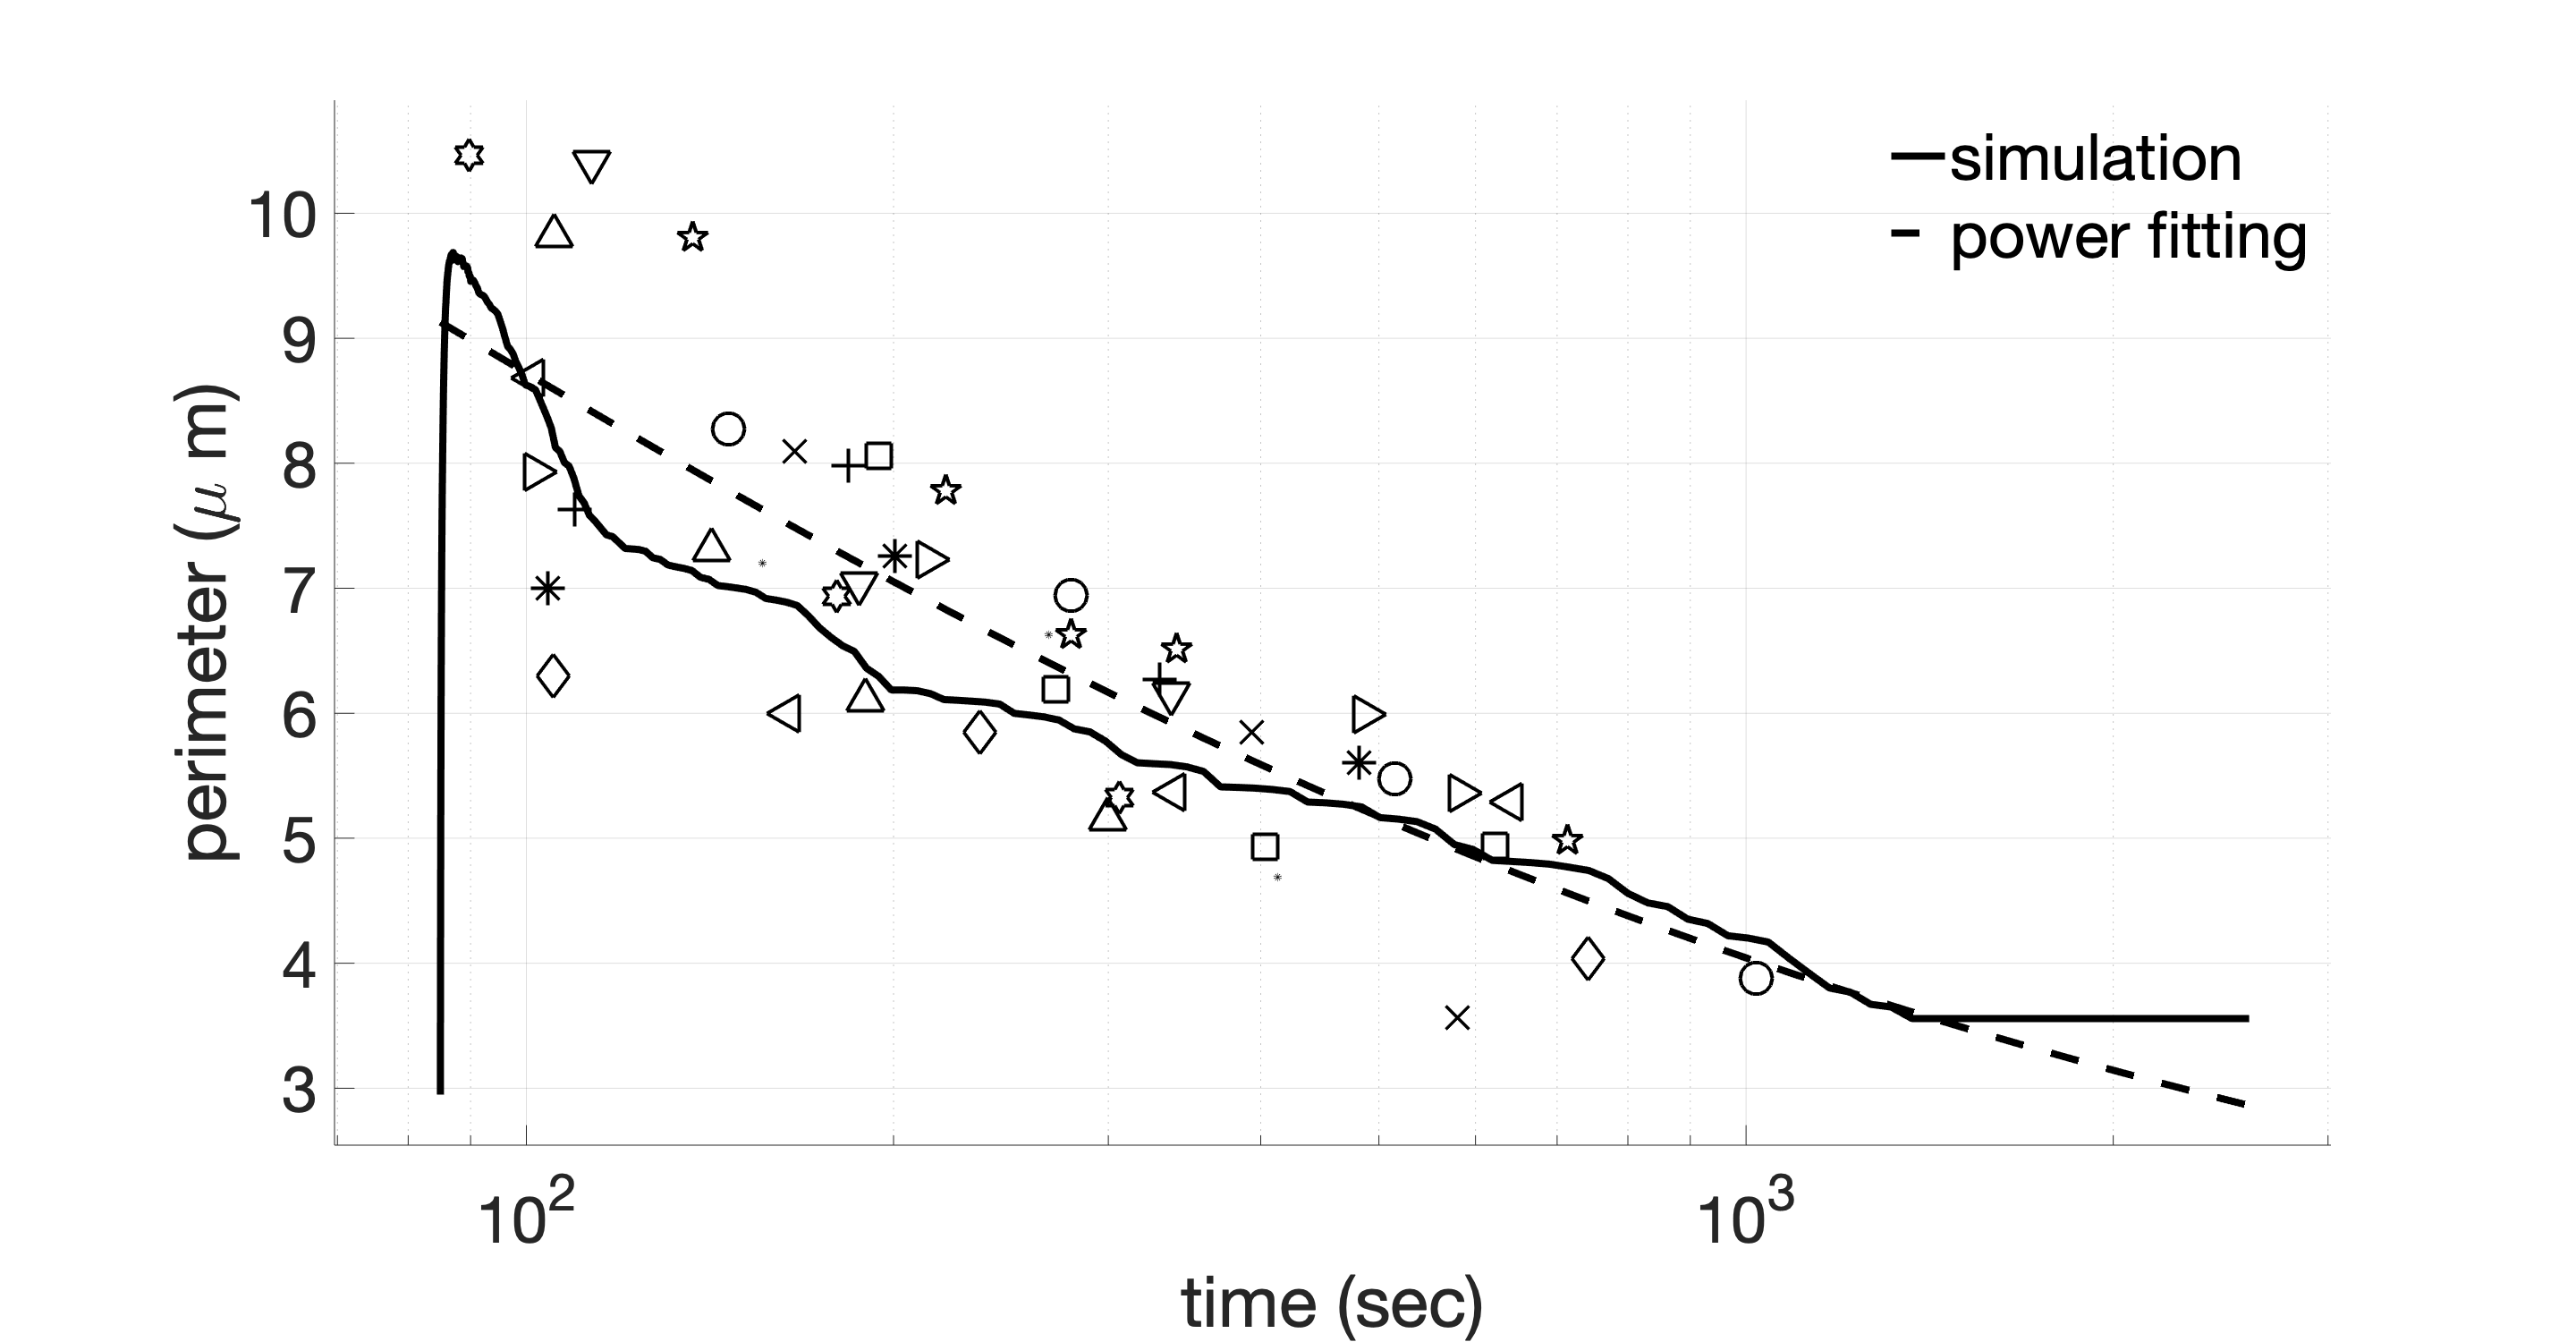
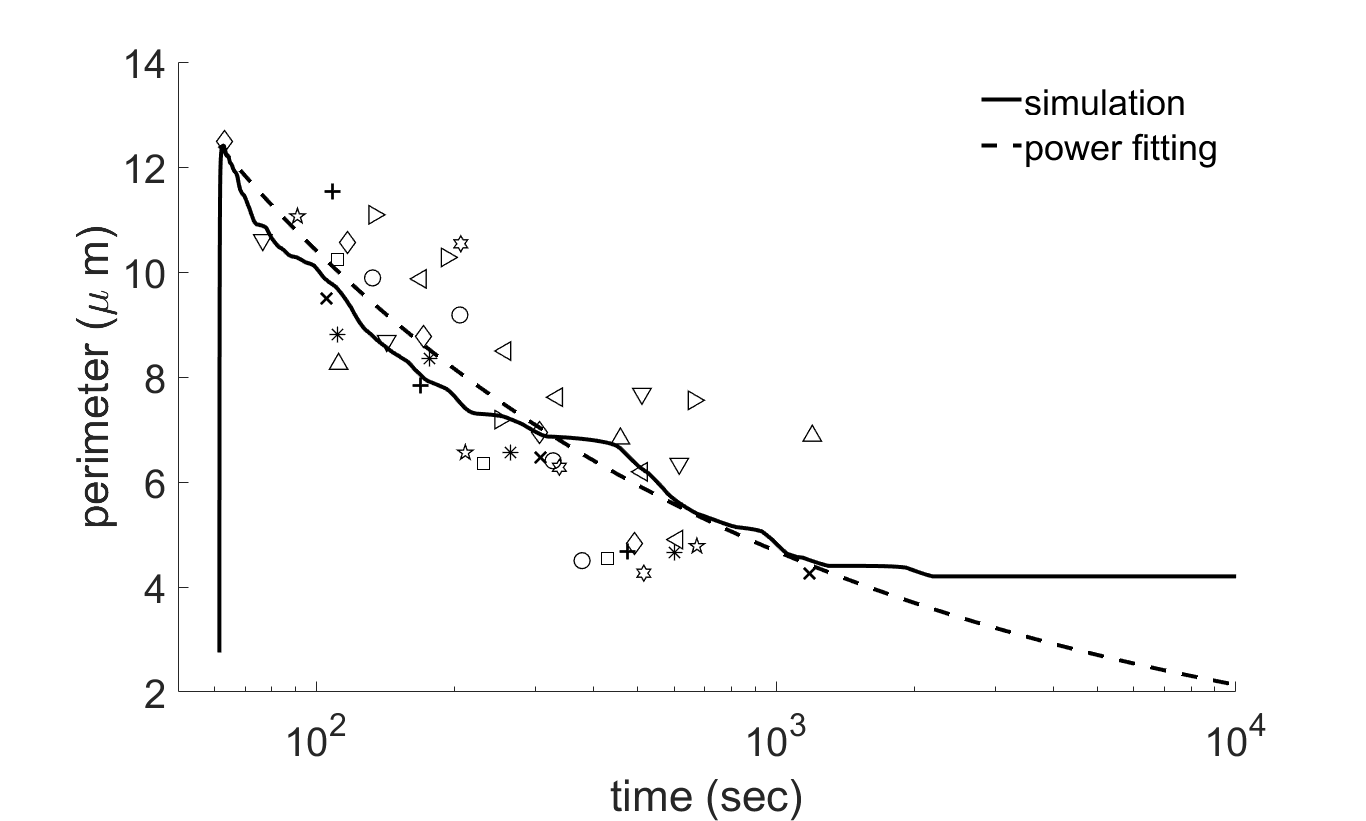
We should point out that collecting experimental data from confocal images proved challenging at early time points due to the rapid changes in domains on GUV surfaces. In Fig. 5 we see that the solid line reaches a plateau after s, indicating that all (or the vast majority) of the simulated liposomes have reached a stable equilibrium.
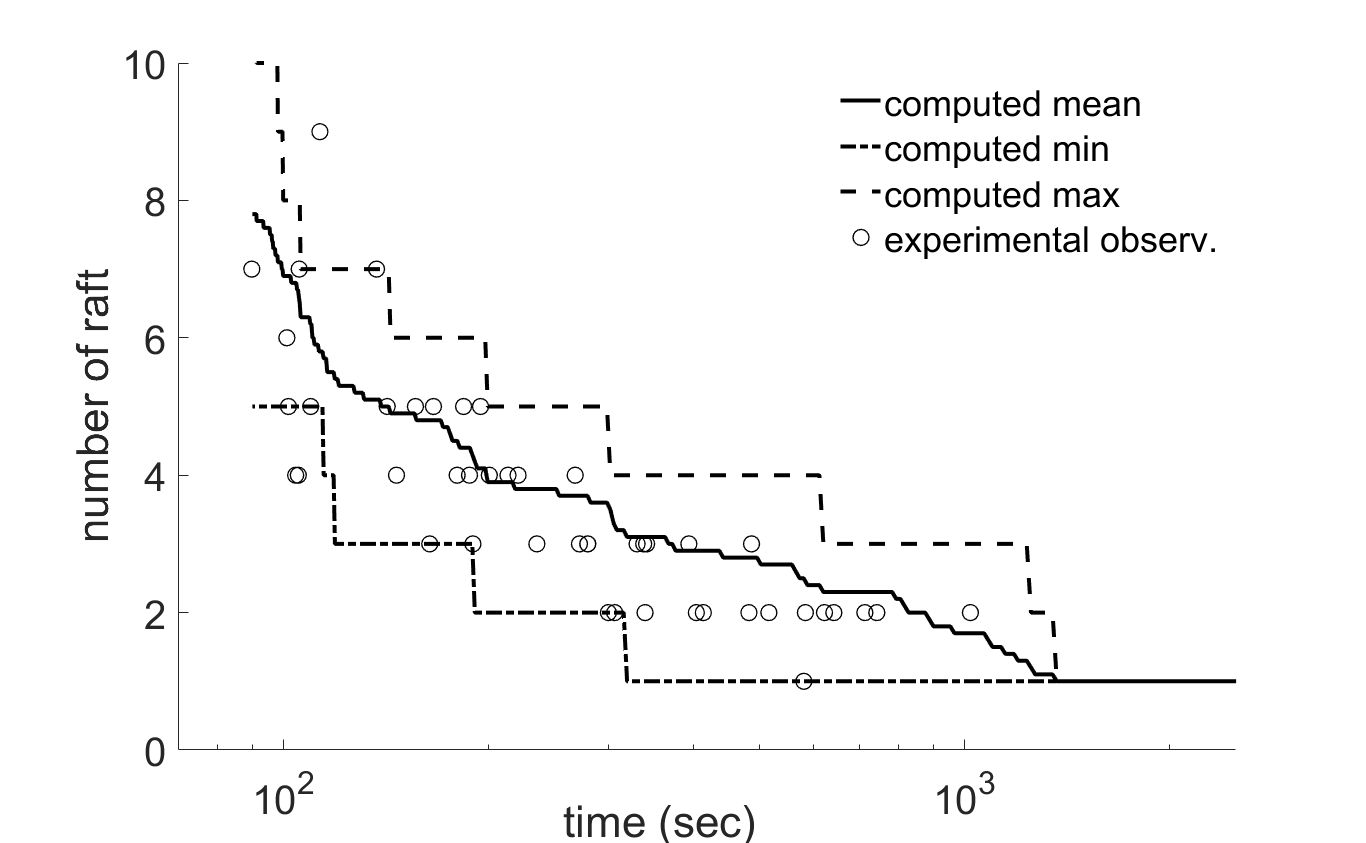
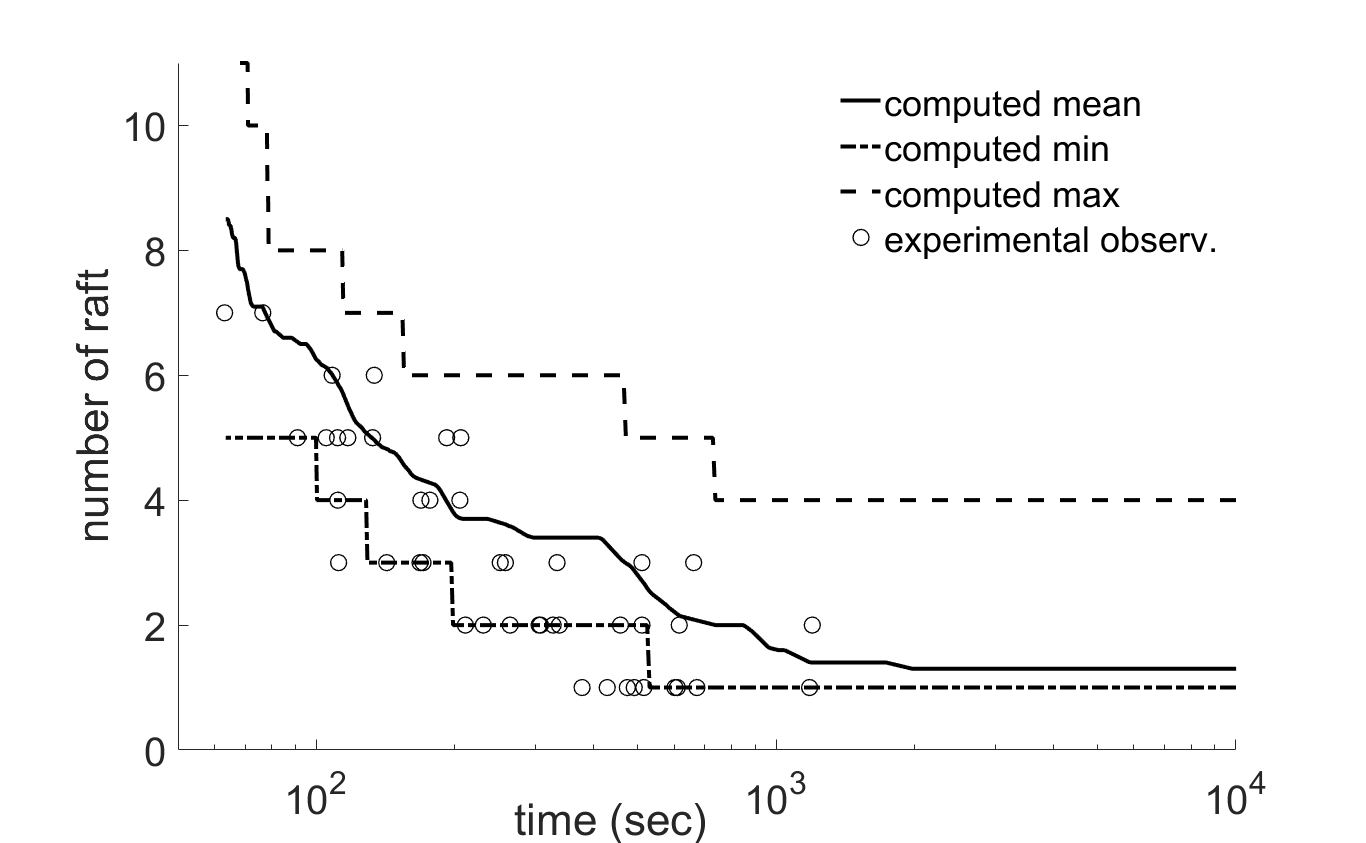
The last quantity we consider is the number of rafts. Fig. 6 reports the experimentally measured and numerically computed total number of rafts over time for both compositions. In particular, Fig. 6 shows all the measurements and the numerical results average, together with the minimum and maximum number of rafts found in the simulations. We observe that the vast majority of the experimental data (62 measurements for composition 3:1:20% and 56 for composition 2:1:20%) falls within the computed extrema. This is particularly true for composition 3:1:20%: only three measurements are outliers. This is further evidence that our simulations based on the CH model capture the evolution of rafts in lipid membranes well.
We conclude this section by presenting a qualitative comparison between images acquired with epi-fluorescence microscopy and images obtained from post-processing the numerical results. Fig. 7 (resp., Fig. 8) presents such comparison for composition 3:1:20% (resp., 2:1:20%). Notice that the microscopy images in Fig. 7 and 8 refer to different sets of GUVs than those used for the quantitative analysis in Fig. 3-6 because confocal microscopy (needed for the measurement) and epi-fluorescence microscopy cannot be used simultaneously. Epi-fluorescence microscopy images could not be used for a quantitative comparison with the numerical simulations because they provide only a two-dimensional picture of the liposome. In post-processing the numerical results, we reduced the level of opacity of the sphere representing the liposome to be able to see the rafts both in the front and in the back. The rafts in the front are dark and should be compared with the rafts in the microscopy images, while the rafts in the back are a lighter shade of gray. Overall, from Fig. 7 and 8 we see an excellent qualitative agreement between experiments and simulations.
Conclusion
This paper presents an experimental and computational study on the evolution of lipid rafts in multicomponent membranes. Focusing on the ternary membrane composition DOPC:DPPC: Chol with well-known phase behavior, we studied domain formation on giant liposomes of two different molar ratios using fluorescence microscopy. Using state-of-the-art numerical techniques, we applied a continuum phase-field model to simulate domain formation on these liposomes. The numerical and experimental results are compared in terms of raft area fraction, total raft perimeter over time and total number of rafts over time for both compositions under consideration. Overall, excellent agreement is found. To the best of our knowledge, this the first quantitative validation of a continuum based model against experimental data. These results show that this continuum model can provide accurate and quantitative prediction of lipid phase separation in membranes.
Acknowledgments
The support of the University of Houston’s Bridge Funds Program is gratefully acknowledged. This work was also partially supported by US National Science Foundation (NSF) through grant DMS-1953535. M.O. acknowledges the support from NSF through DMS-2011444. S.M. acknowledges the support from NSF through DMR-1753328. The authors are grateful to Sergei Mukhin, Timur Galimzyanov, Boris Kheyfets and Vassiliy Lubchenko for insightful discussions on thermodynamic properties of lipid bi-layers.
References
- [1] Nicholas D Alikakos, Giorgio Fusco, and Georgia Karali. Ostwald ripening in two dimensions—the rigorous derivation of the equations from the mullins–sekerka dynamics. Journal of Differential Equations, 205(1):1–49, 2004.
- [2] Miglena I. Angelova and Dimiter S. Dimitrov. Liposome electroformation. Faraday Discuss. Chem. Soc., 81:303–311, 1986.
- [3] Luis Bagatolli and P. B. Sunil Kumar. Phase behavior of multicomponent membranes: Experimental and computational techniques. Soft Matter, 5:3234–3248, 2009.
- [4] A. Bandekar and S. Sofou. Floret-shaped solid domains on giant fluid lipid vesicles induced by pH. Langmuir, 28:4113–4122, 2012.
- [5] Amey Bandekar, Charles Zhu, Ana Gomez, Monica Zofia Menzenski, Michelle Sempkowski, and Stavroula Sofou. Masking and triggered unmasking of targeting ligands on liposomal chemotherapy selectively suppress tumor growth in vivo. Molecular Pharmaceutics, 10(1):152–160, 2013.
- [6] M. Benzi, G. H. Golub, and J. Liesen. Numerical solution of saddle point problems. Acta Numerica, 14:1–137, 2005.
- [7] Max L. Berkowitz, editor. Biomembrane Simulations: Computational Studies of Biological Membranes. CRC Press, 2019.
- [8] Alan J Bray. Theory of phase-ordering kinetics. Advances in Physics, 51(2):481–587, 2002.
- [9] D.A. Brown and E. London. Structure and function of sphingolipid- and cholesterol-rich membrane rafts. J Biol Chem., 275(23):17221–17224, 2000.
- [10] R.E. Brown. Sphingolipid organization in biomembranes: what physical studies of model membranes reveal. Journal of Cell Science, 111(1):1–9, 1998.
- [11] John W Cahn. On spinodal decomposition. Acta Metallurgica, 9(9):795 – 801, 1961.
- [12] J.W. Cahn and J.E. Hilliard. Free energy of a nonuniform system. i. interfacial free energy. The Journal of Chemical Physics, 28(2):258–267, 1958.
- [13] Yongyong Cai, Heejun Choi, and Jie Shen. Error estimates for time discretizations of Cahn–Hilliard and Allen–Cahn phase-field models for two-phase incompressible flows. Numerische Mathematik, 137(2):417–449, 2017.
- [14] Philippe G Ciarlet. The finite element method for elliptic problems, volume 40. SIAM, 2002.
- [15] James H. Davis, Jesse James Clair, and Janos Juhasz. Phase equilibria in dopc/dppc-d62/cholesterol mixtures. Biophysical Journal, 96(2):521 – 539, 2009.
- [16] Alex H. de Vries, Alan E. Mark, and Siewert J. Marrink. Molecular dynamics simulation of the spontaneous formation of a small DPPC vesicle in water in atomistic detail. Journal of the American Chemical Society, 126(14):4488–4489, 2004.
- [17] Qiang Du, Lili Ju, and Li Tian. Finite element approximation of the Cahn–Hilliard equation on surfaces. Computer Methods in Applied Mechanics and Engineering, 200(29-32):2458–2470, 2011.
- [18] O. Edholm and J. F. Nagle. Areas of molecules in membranes consisting of mixtures. Biophysical journal, 89:1827–1832, 2005.
- [19] Charles M Elliott and Stig Larsson. Error estimates with smooth and nonsmooth data for a finite element method for the cahn-hilliard equation. Mathematics of Computation, 58(198):603–630, 1992.
- [20] Lawrence C Evans. Partial differential equations, volume 19. American Mathematical Soc., 2010.
- [21] M. Fidorra, A. Garcia, J.H. Ipsen, S. Härtel, and L.A. Bagatolli. Lipid domains in giant unilamellar vesicles and their correspondence with equilibrium thermodynamic phases: A quantitative fluorescence microscopy imaging approach. Biochimica et Biophysica Acta (BBA) - Biomembranes, 1788(10):2142 – 2149, 2009. Includes Special Section: Cardiolipin.
- [22] Chloe M. Funkhouser, Francisco J. Solis, and K. Thornton. Dynamics of coarsening in multicomponent lipid vesicles with non-uniform mechanical properties. The Journal of Chemical Physics, 140(14):144908, 2014.
- [23] Harald Garcke, Johannes Kampmann, Andreas Rätz, and Matthias Röger. A coupled surface-Cahn–Hilliard bulk-diffusion system modeling lipid raft formation in cell membranes. Mathematical Models and Methods in Applied Sciences, 26(06):1149–1189, 2016.
- [24] Prerna Gera and David Salac. Cahn–Hilliard on surfaces: A numerical study. Applied Mathematics Letters, 73:56–61, 2017.
- [25] Héctor Gómez, Victor M Calo, Yuri Bazilevs, and Thomas JR Hughes. Isogeometric analysis of the cahn–hilliard phase-field model. Computer Methods in Applied Mechanics and Engineering, 197(49-50):4333–4352, 2008.
- [26] John B Greer, Andrea L Bertozzi, and Guillermo Sapiro. Fourth order partial differential equations on general geometries. Journal of Computational Physics, 216(1):216–246, 2006.
- [27] Francisco Guillén-González and Giordano Tierra. Second order schemes and time-step adaptivity for Allen–Cahn and Cahn–Hilliard models. Computers & Mathematics with Applications, 68(8):821–846, 2014.
- [28] ZI Imam, LE Kenyon, G Ashby, F Nagib, M Mendicino, C Zhao, AK. Gadok, and JC Stachowiak. Phase-separated liposomes enhance the efficiency of macromolecular delivery to the cellular cytoplasm. Cellular and Molecular Bioengineering, 10:387–403, 2017.
- [29] Darae Jeong and Junseok Kim. Microphase separation patterns in diblock copolymers on curved surfaces using a nonlocal Cahn-Hilliard equation. The European Physical Journal E, 38(11):117, 2015.
- [30] Janos Juhasz, James H Davis, and Frances J Sharom. Fluorescent probe partitioning in giant unilamellar vesicles of ’lipid raft’ mixtures. The Biochemical journal, 430(3):415—423, September 2010.
- [31] Janos Juhasz, Frances J. Sharom, and James H. Davis. Quantitative characterization of coexisting phases in dopc/dppc/cholesterol mixtures: Comparing confocal fluorescence microscopy and deuterium nuclear magnetic resonance. Biochimica et Biophysica Acta (BBA) - Biomembranes, 1788(12):2541 – 2552, 2009.
- [32] N. Kahya, D. Scherfeld, K. Bacia, B. Poolman, and P. Schwille. Probing lipid mobility of raft-exhibiting model membranes by fluorescence correlation spectroscopy. J Biol Chem., 278(30):28109–15, 2003.
- [33] You Jung Kang, Harrison S Wostein, and Sheereen Majd. A simple and versatile method for the formation of arrays of giant vesicles with controlled size and composition. Advanced Materials, 25(47):6834–6838, 2013.
- [34] Gautam Bajagur Kempegowda, Shrirang Karve, Amey Bandekar, Arjun Adhikari, Tamara Khaimchayev, and Stavroula Sofou. ph-dependent formation of lipid heterogeneities controls surface topography and binding reactivity in functionalized bilayers. Langmuir, 25(14):8144–8151, 2009.
- [35] Nawal K. Khadka, Chian Sing Ho, and Jianjun Pan. Macroscopic and nanoscopic heterogeneous structures in a three-component lipid bilayer mixtures determined by atomic force microscopy. Langmuir, 31(45):12417–12425, 2015.
- [36] B. B. Kheyfets and S. I. Mukhin. Area per lipid in dppc-cholesterol bilayers:analytical approach. arXiv:1501.02727, 2015.
- [37] Andrey S. Klymchenko and Remy Kreder. Fluorescent probes for lipid rafts: From model membranes to living cells. Chemistry & Biology, 21(1):97 – 113, 2014.
- [38] Norbert Kučerka, Mu-Ping Nieh, and John Katsaras. Fluid phase lipid areas and bilayer thicknesses of commonly used phosphatidylcholines as a function of temperature. Biochimica et Biophysica Acta (BBA) - Biomembranes, 1808(11):2761 – 2771, 2011.
- [39] L.D. Landau and E.M. Lifshitz. Statistical physics. Oxford: Pergamon, 1958.
- [40] Mohamed Laradji and P. B. Sunil Kumar. Dynamics of domain growth in self-assembled fluid vesicles. Phys. Rev. Lett., 93:198105, Nov 2004.
- [41] Shuwang Li, John Lowengrub, and Axel Voigt. Locomotion, wrinkling, and budding of a multicomponent vesicle in viscous fluids. Communications in Mathematical Sciences, 10:645–670, 2012.
- [42] Göran Lindblom and Greger Orädd. Nmr studies of translational diffusion in lyotropic liquid crystals and lipid membranes. Progress in Nuclear Magnetic Resonance Spectroscopy, 26:483–515, 1994.
- [43] Daniel Lingwood and Kai Simons. Lipid rafts as a membrane-organizing principle. Science, 327(5961):46–50, 2010.
- [44] Fei Liu and Jie Shen. Stabilized semi-implicit spectral deferred correction methods for Allen–Cahn and Cahn–Hilliard equations. Mathematical Methods in the Applied Sciences, 38(18):4564–4575, 2015.
- [45] John Lowengrub, Andreas Rätz, and Axel Voigt. Phase-field modeling of the dynamics of multicomponent vesicles: Spinodal decomposition, coarsening, budding, and fission. Physical review. E, Statistical, nonlinear, and soft matter physics, 79:031926, 04 2009.
- [46] Sheereen Majd and Michael Mayer. Hydrogel stamping of arrays of supported lipid bilayers with various lipid compositions for the screening of drug–membrane and protein–membrane interactions. Angewandte Chemie, 117(41):6855–6858, 2005.
- [47] Siewert J. Marrink and Alan E. Mark. Molecular dynamics simulation of the formation, structure, and dynamics of small phospholipid vesicles. Journal of the American Chemical Society, 125(49):15233–15242, 2003.
- [48] Maxim A Olshanskii, A. Reusken, and J. Grande. A finite element method for elliptic equations on surfaces. SIAM Journal on Numerical Analysis, 47:3339–3358, 2009.
- [49] Maxim A Olshanskii and Arnold Reusken. Trace finite element methods for PDEs on surfaces. In Geometrically Unfitted Finite Element Methods and Applications, pages 211–258. Springer, 2017.
- [50] Wil Ostwald. Über die vermeintliche isomerie des roten und gelben quecksilberoxyds und die oberflächenspannung fester körper. Zeitschrift für physikalische Chemie, 34(1):495–503, 1900.
- [51] Jianjun Pan, Stephanie Tristram-Nagle, and John F. Nagle. Effect of cholesterol on structural and mechanical properties of membranes depends on lipid chain saturation. Phys. Rev. E, 80:021931, Aug 2009.
- [52] SooHyun Park and Sheereen Majd. Reconstitution and functional studies of hamster p-glycoprotein in giant liposomes. PloS one, 13(6):e0199279, 2018.
- [53] H Jelger Risselada and Siewert J Marrink. The molecular face of lipid rafts in model membranes. Proceedings of the National Academy of Sciences, 105(45):17367–17372, 2008.
- [54] Youcef Saad and Martin H Schultz. Gmres: A generalized minimal residual algorithm for solving nonsymmetric linear systems. SIAM Journal on scientific and statistical computing, 7(3):856–869, 1986.
- [55] Michelle Sempkowski, Charles Zhu, Monica Zofia Menzenski, Ioannis G. Kevrekidis, Frank Bruchertseifer, Alfred Morgenstern, and Stavroula Sofou. Sticky patches on lipid nanoparticles enable the selective targeting and killing of untargetable cancer cells. Langmuir, 32(33):8329–8338, 2016.
- [56] Stefan Semrau and Thomas Schmidt. Membrane heterogeneity – from lipid domains to curvature effects. Soft Matter, 5:3174–3186, 2009.
- [57] Erdinc Sezgin, Ilya Levental, Michal Grzybek, Günter Schwarzmann, Veronika Mueller, Alf Honigmann, Vladimir N. Belov, Christian Eggeling, Ünal Coskun, Kai Simons, and Petra Schwille. Partitioning, diffusion, and ligand binding of raft lipid analogs in model and cellular plasma membranes. Biochimica et Biophysica Acta (BBA) - Biomembranes, 1818(7):1777 – 1784, 2012.
- [58] Jie Shen and Xiaofeng Yang. Numerical approximations of Allen-Cahn and Cahn-Hilliard equations. Discrete & Continuous Dynamical Systems - A, 28:1669, 2010.
- [59] Jin Sun Sohn, Yu-Hau Tseng, Shuwang Li, Axel Voigt, and John S Lowengrub. Dynamics of multicomponent vesicles in a viscous fluid. Journal of Computational Physics, 229(1):119–144, 2010.
- [60] Cynthia A Stanich, Aurelia R Honerkamp-Smith, Gregory Garbes Putzel, Christopher S Warth, Andrea K Lamprecht, Pritam Mandal, Elizabeth Mann, Thien-An D Hua, and Sarah L Keller. Coarsening dynamics of domains in lipid membranes. Biophysical journal, 105(2):444–454, 2013.
- [61] G Tierra and F Guillén-González. Numerical methods for solving the Cahn–Hilliard equation and its applicability to related energy-based models. Archives of Computational Methods in Engineering, 22(2):269–289, 2015.
- [62] Sarah L Veatch and Sarah L Keller. Separation of liquid phases in giant vesicles of ternary mixtures of phospholipids and cholesterol. Biophysical journal, 85(5):3074–3083, 2003.
- [63] Sarah L. Veatch, Olivier Soubias, Sarah L. Keller, and Klaus Gawrisch. Critical fluctuations in domain-forming lipid mixtures. Proceedings of the National Academy of Sciences, 104(45):17650–17655, 2007.
- [64] Maddalena Venturoli, Maria Maddalena Sperotto, Marieke Kranenburg, and Berend Smit. Mesoscopic models of biological membranes. Physics Reports, 437(1):1 – 54, 2006.
- [65] Xiaoqiang Wang and Qiang Du. Modelling and simulations of multi-component lipid membranes and open membranes via diffuse interface approaches. Journal of Mathematical Biology, 56(3):347–371, Mar 2008.
- [66] O. Wesolowska, K. Michalak, J Maniewska, and A. B. Hendrich. Giant unilamellar vesicles - a perfect tool to visualize phase separation and lipid rafts in model systems. Acta Biochimica Polonica, 56:33–39, 2009.
- [67] Thomas Witkowski, Rainer Backofen, and Axel Voigt. The influence of membrane bound proteins on phase separation and coarsening in cell membranes. Phys. Chem. Chem. Phys., 14:14509–14515, 2012.
- [68] Vladimir Yushutin, Annalisa Quaini, Sheereen Majd, and Maxim Olshanskii. A computational study of lateral phase separation in biological membranes. International journal for numerical methods in biomedical engineering, 35(3):e3181, 2019.
- [69] Vladimir Yushutin, Annalisa Quaini, and Maxim Olshanskii. Numerical modeling of phase separation on dynamic surfaces. Journal of Computational Physics, 407:109126, 2020.
- [70] Jingzhi Zhu, Long-Qing Chen, Jie Shen, and Veena Tikare. Coarsening kinetics from a variable-mobility Cahn-Hilliard equation: Application of a semi-implicit Fourier spectral method. Phys. Rev. E, 60:3564–3572, Oct 1999.