Interstellar medium properties and feedback in local AGN with the MAGNUM survey
Abstract
We investigated the interstellar medium (ISM) properties in the central regions of nearby Seyfert galaxies characterised by prominent conical or bi-conical outflows belonging to the MAGNUM survey by exploiting the unprecedented sensitivity, spatial and spectral coverage of the integral field spectrograph MUSE at the Very Large Telescope. We developed a novel approach based on the gas and stars kinematics to disentangle high-velocity gas in the outflow from gas in the disc to spatially track the differences in their ISM properties. This allowed us to reveal the presence of an ionisation structure within the extended outflows that can be interpreted with different photoionisation and shock conditions, and to trace tentative evidence of outflow-induced star formation (“positive” feedback) in a galaxy of the sample, Centaurus A.
keywords:
Galaxies: ISM, Seyfert, jets1 Introduction
Galaxy-scale outflows driven by active galactic nucleus (AGN) activity are thought to be so powerful to sweep away most of the gas of the host galaxy, providing a mechanism for the central black hole (BH) to possibly regulate star formation (SF) activity. This mechanism, the so-called negative feedback, could potentially explain the relation between the BH mass and the galaxy bulge properties [Silk & Rees, 1998, Fabian, 2012]. Recently, models and observations have revealed that outflows and jets can also have a positive feedback effect, triggering SF in the galaxy disc and also within the outflowing gas itself (e.g. Silk 2013, Cresci et al. 2015, Maiolino et al. 2017). Outflows are now routinely detected in luminous active galaxies on different physical scales and in different gas phases (e.g., ionised, atomic and molecular gas; Cicone et al. 2018 and references therein), even though understanding their role in galaxy evolution is still a challenging task. In this context, nearby galaxies represent ideal laboratories to explore in high detail outflow properties, their formation and acceleration mechanisms, as well as the effects of SF and AGN activities on host galaxies.
Here we present the results of the Measuring AGN under MUSE microscope (MAGNUM) survey (P.I. Marconi), aimed at investigating the inner regions of a number of local AGN, all showing evidence for the presence of outflows, with the unprecedented combination of spatial and spectral coverage of the integral field spectrograph MUSE [Bacon et al., 2010] at the Very Large Telescope. This contribution is based on recent published papers [Cresci et al., 2015, Venturi et al., 2017, 2018, Mingozzi et al., 2019] and on unpublished material from M. Mingozzi’s Phd Thesis (2020, University of Bologna; link).
2 The MAGNUM survey
MAGNUM galaxies have been selected to be observable from Paranal Observatory and with a luminosity distance Mpc. In Venturi et al. (2020, in preparation) we present our sample, explaining the selection criteria, data reduction and analysis, and investigating the kinematics of the ionised gas. Here, we show our results for the nine Seyfert galaxies analysed in Mingozzi et al. [2019] (M19 hereafter), namely Centaurus A, Circinus, NGC 4945, NGC 1068, NGC 1365, NGC 1386, NGC 2992, NGC 4945 and NGC 5643. The MUSE field of view (FOV) covers their central regions, spanning from 1 to 10 kpc, according to their distance. The average seeing of the observations is ””. The datacubes were analysed with a set of custom python scripts in order to fit and subtract the stellar continuum in each single-spaxel spectrum and fit the main emission lines (i.e. H, [O iii]4959,5007, H, [N ii]6548,84, [S ii]6717,31, [S iii]9069) with multiple Gaussians where needed. This happens in the central parts of the galaxies and in the outflowing cones. All the details about the applied procedure are given in M19.
2.1 Gas properties: disc versus outflow
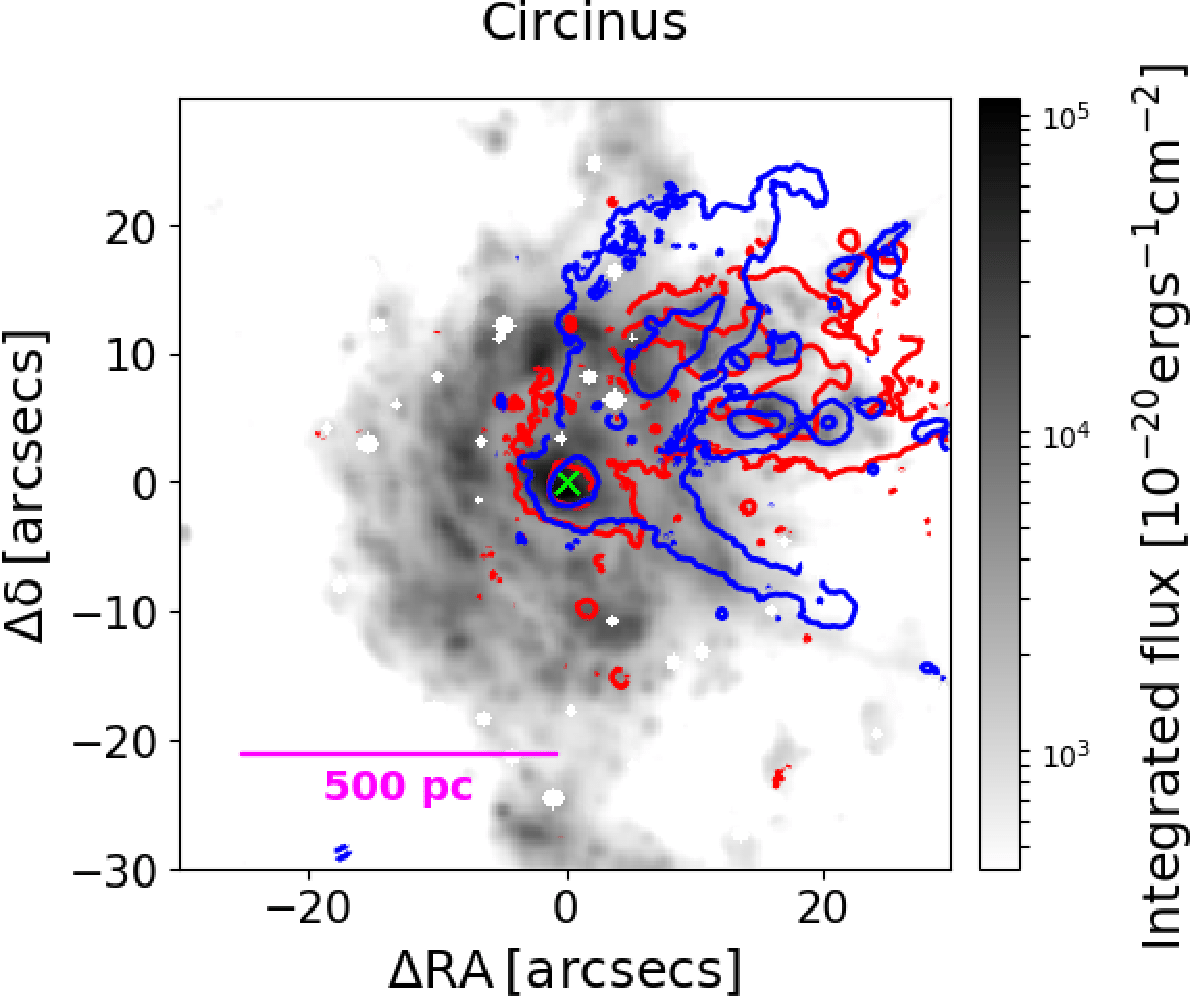
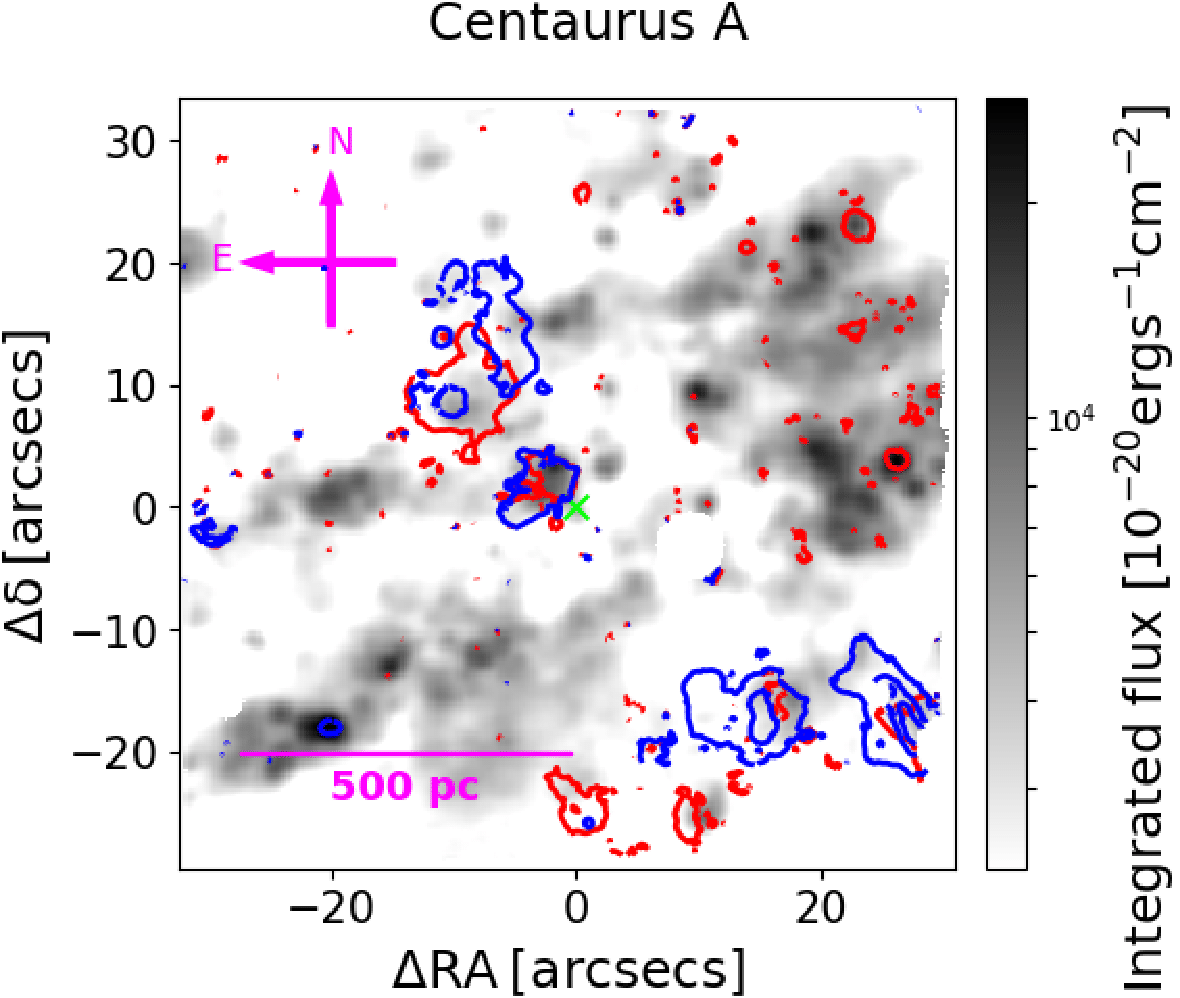
In many works, disc and outflow are separated according to the width of the two Gaussian components used to fit the main emission lines (narrower and broader, respectively). In our analysis this approach is not feasible since the line profiles can be very complex, requiring three or four Gaussians to be fully reproduced. Therefore, we disentangle the outflow from the systemic gas by applying a novel approach, explained in detail in M19. In brief, we assume that the stellar velocity is generally a good approximation of the gas velocity in the disc, defining as disc component the low-velocity ionised gas rotating similarly to the stars, while the outflow component (i.e. the high-velocity component) is moving faster than the stellar velocity, and is partly blueshifted and partly redshifted with respect to it. As an example, Fig. 1 shows the H disc component flux maps, superimposing the [O iii] outflow component contours for Circinus and Centaurus A111Centaurus A shows a strong misalignment between stars and gas (Morganti et al. 2010), so we consider the global systemic velocity ( km/s) as a reference for the disc gas.. Indeed, the H emission is in general dominant in the disc, while the [O iii] is enhanced in the outflow [Venturi et al., 2018]. In Circinus (1” pc), the outflow is extended on North-West in one-sided and wide-angled kpc-scale [O iii] cone, first revealed by Marconi et al. [1994]. In Centaurus A (1” pc) the outflow is mainly distributed in two cones (direction north-east and south-west) in the same direction of the extended double-sided jet revealed both in the radio and X-rays (e.g. Hardcastle et al. 2003), and located perpendicularly with respect to the gas in the disc component.
In M19, we calculated dust extinction, gas density and ionisation parameter (i.e. a measure of the radiation field intensity, relative to gas density) for the disc and outflow components, using H/H, [S ii]6717/[S ii]6731 and [S iii]9069,9532/[S ii]6717,31 line ratios, respectively. We found that the outflow is characterised by higher values of density and ionisation parameter (, cm-3, log([S iii]/[S ii]) ) than the disc component, that is instead more affected by dust extinction (, cm-3, log([S iii]/[S ii]) ). Interestingly, our median outflow density is lower than what is found in literature, but a more consistent value can be obtained calculating the median density weighting by the [S ii] line flux (disc: cm-3; outflow: cm-3). This means that many values of outflow density found in literature could be biased towards higher densities because they are based only on the most luminous and densest outflowing regions, characterised by a high S/N ratio. Finally, in M19 we used spatially and kinematically resolved Baldwin-Phillips-Terlevich (BPT, Baldwin et al. 1981) diagrams to explore the dominant contribution to ionisation in the disc and outflow components separately. The left and middle panels of Fig. 2 show the [N ii]-BPT diagrams of Circinus for the disc and outflow, respectively. The corresponding position on the outflowing gas component map is shown in the right panel of Fig. 2. We noticed that the highest and lowest values of low-ionisation line ratios (LILrs; i.e. [N ii]/H and [S ii]/H), displayed in dark red and orange, are prominent in the AGN/LI(N)ER-dominated outflow component, while they are not observable in the disc component.
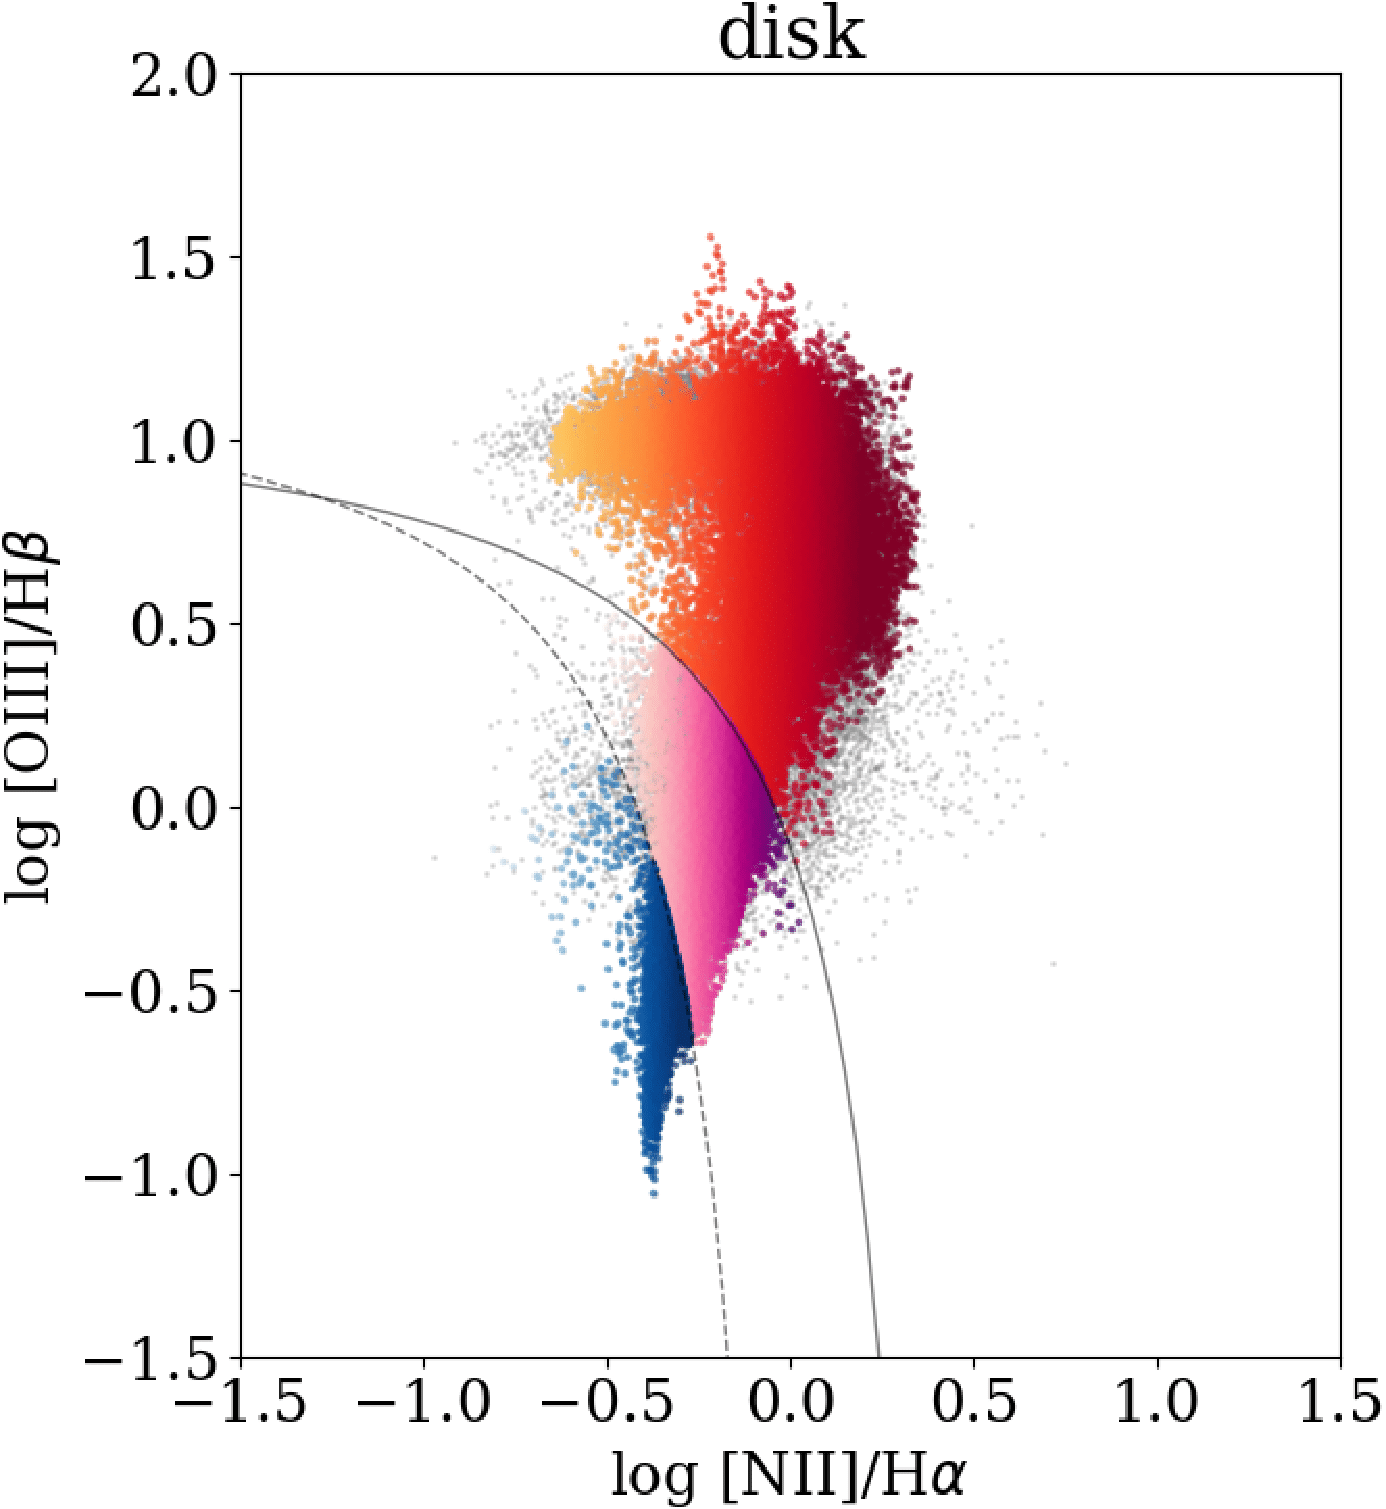
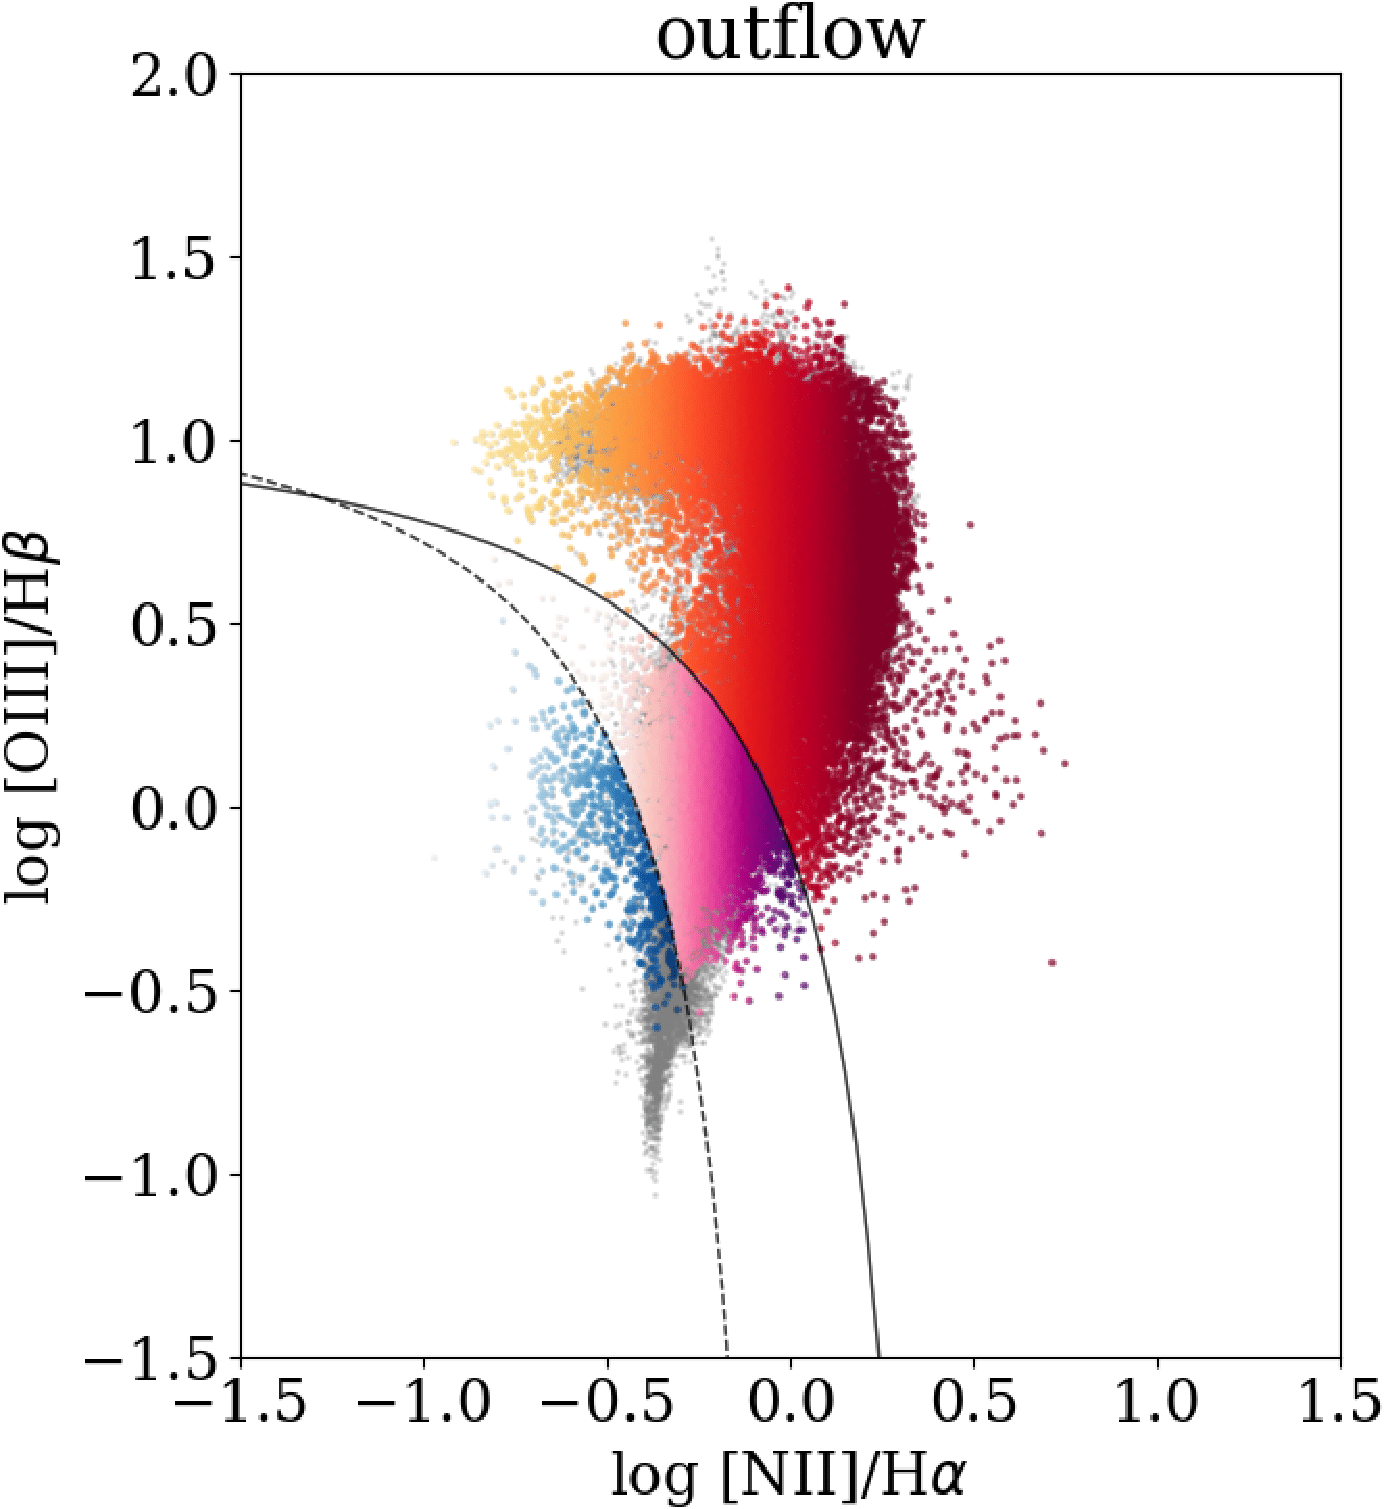
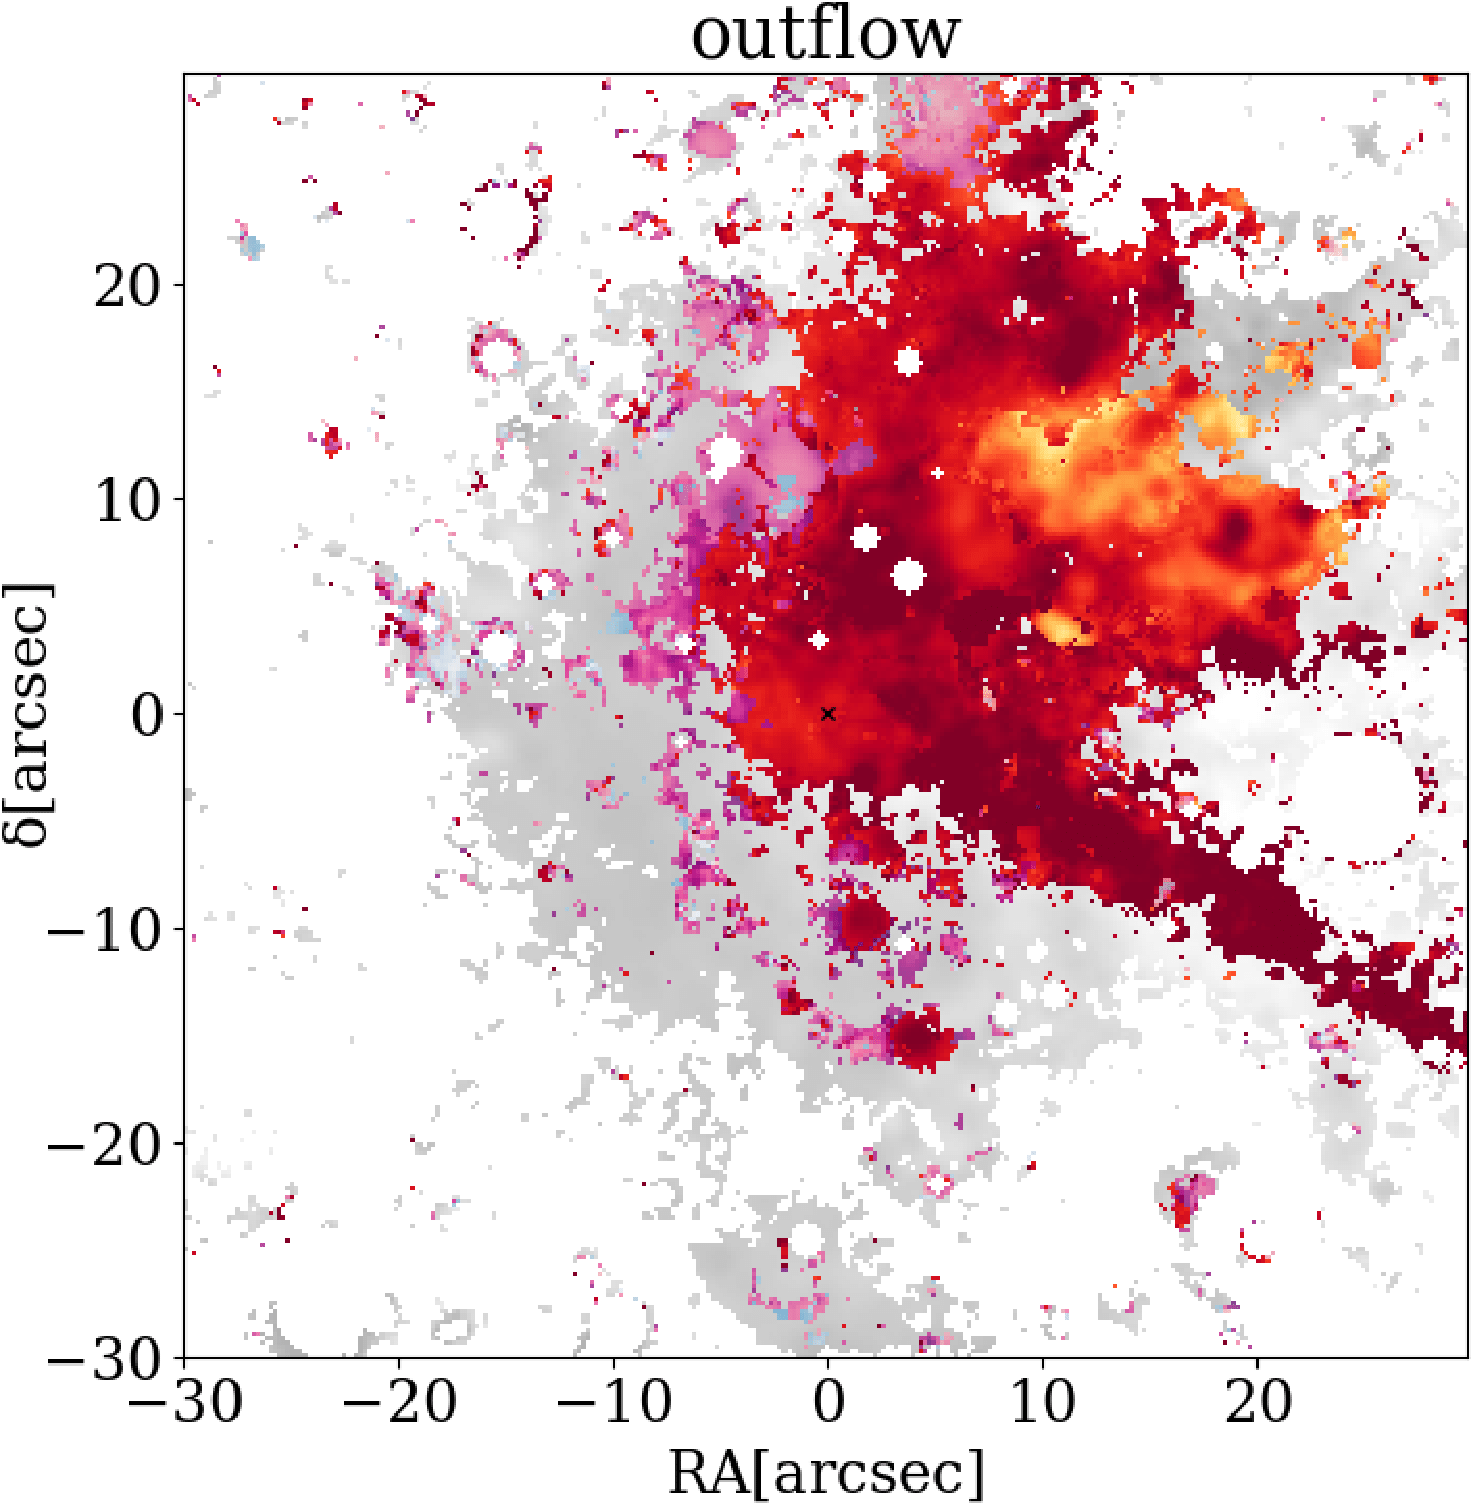
These features are visible in almost all the MAGNUM sample: in general, the highest LILrs trace the inner parts along the axis of the emitting cones, where the [S iii]/[S ii] line ratio is enhanced (i.e. high ionisation), while the lowest LILrs follow the cone edges and/or the regions perpendicular to the axis of the outflow, characterised also by a higher [O iii] velocity dispersion (M19). A possible explanation for the observed features identified in the outflow is to take into account different proportions of two distinct populations of line emitting clouds (e.g. Binette et al. 1996). One is optically thin to the radiation and characterised by the highest excitation, while the other, optically thick, is impinged by a filtered - and then harder - radiation field, which makes it dominated by low-excitation lines and characterised by lower [S iii]/[S ii] line ratios. The highest LILrs may be due to shocks and/or to a hard-filtered radiation field from the AGN (M19).
2.2 Centaurus A: a local laboratory to study AGN positive feedback
Centaurus A shows the best example of a radio jet emitted by the central AGN interacting with the ISM (e.g. Santoro et al. 2016 and references therein). In this context, we investigated its central region, exploiting our approach of disentangling the disc from the outflow component to obtain an independent classification of their ionisation sources. Fig. 3a shows the [N ii]- and [S ii]-BPT maps for the disc (on the left) and the outflow (on the right). The galaxy FOV South-West portion hosts a blob (solid circle) with a velocity consistent with the gas disc and by Composite and SF dominated ionisation (in [N ii]- and [S ii]-BPT, respectively), that can be interpreted as SF triggered in the ionisation cone due to compression of the galaxy ISM by the outflow, as already revealed in another galaxy of the MAGNUM survey, NGC 5643, by Cresci et al. [2015]. Moreover, a nearby clump (solid square) appears to have SF ionisation, but velocities consistent with the gas in the outflow, suggesting that newborn stars could be forming directly in outflowing gas (see Maiolino et al. 2017). The top panel of Fig. 3b shows the spectrum of the star-forming blob in the outflow (solid square in Fig. 3a). The asymmetric line profiles can be reproduced by a fit with three Gaussian components, whose corresponding positions in [N ii]- and [S ii]-BPT diagrams are shown in the bottom panel of Fig. 3b: the redshifted Gaussian component (red) has a very strong H emission (star formation rate SFR M⊙/yr, using Lee et al. 2009 calibration) and SF ionisation.
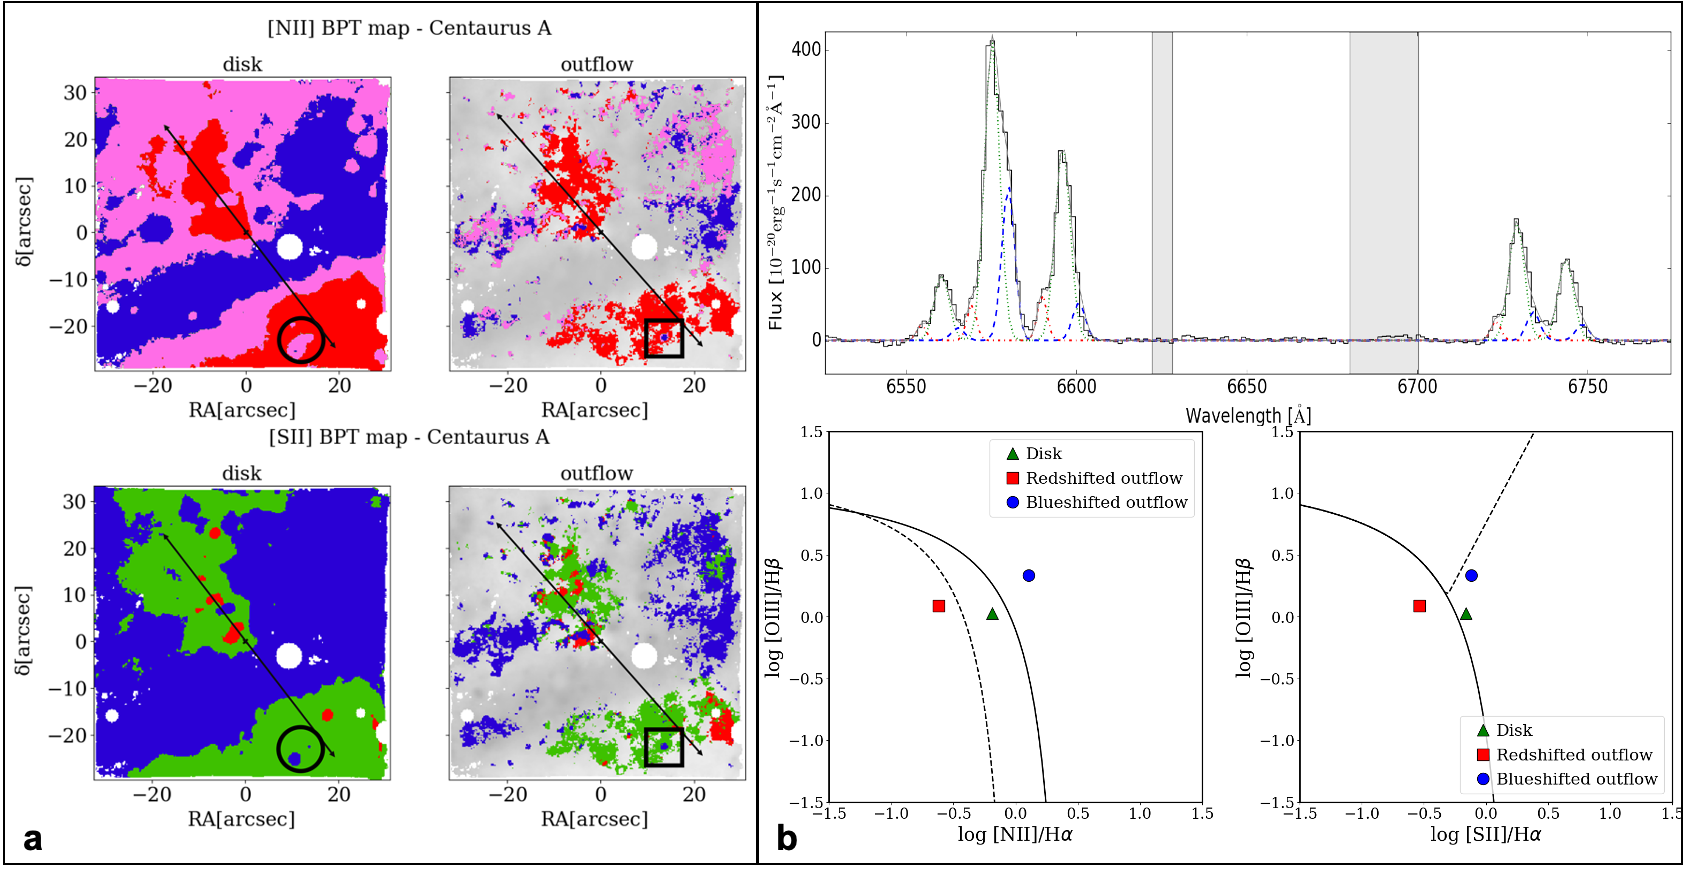
Overall, the two blobs have a total SFR M⊙/yr, which is % of the global value of the galaxy and could represent the first evidence of both the two modes of positive feedback – triggered SF both in the galaxy disc and within the outflowing gas – operating in the nuclear region of this galaxy. Hence, we asked for X-SHOOTER observations (0102.B-0292, P.I. Mingozzi), that we will discuss in a forthcoming paper (Mingozzi et al. 2020, in preparation) to undoubtedly identify SF signatures in the outflow, exploiting IR diagnostics to discard AGN and shock ionisation, and stellar absorption lines to investigate the presence of newborn stars (see Maiolino et al. 2017).
3 Conclusions
The MAGNUM survey is exploring gas properties and ionisation sources of the outflowing gas in the central regions of nearby Seyfert galaxies. We found that the gas in the outflowing cones of our galaxies is set up in clumpy clouds characterised by higher density and ionisation with respect to disc gas. The cone innermost regions are generally highly ionised and directly heated by the AGN. The cone edges and the regions perpendicular to the outflow axis could instead be dominated by shocks due to the interaction between the outflow and the ISM. Alternatively, these regions, generally characterised by low ionisation, could be impinged by an ionising radiation filtered by clumpy, ionised absorbers. Separating the outflow and disc components allowed us also to detect in one of the sources, Centaurus A, two blobs dominated by SF ionisation apparently embedded in the AGN ionisation cone, possibly tracing positive feedback (both in the disc and in the outflow) and accounting for % of the galaxy global SFR. If the new X-SHOOTER data confirmed it, this would be the first example of the two modes of positive feedback coexisting in the same object. The contribution to the total SFR might seem irrelevant, but it remains that Centaurus A could be a local test bench to explore in detail this phenomenon. Positive feedback may play a significant role in the formation of galaxy spheroidal component at high redshift, where AGN-driven outflows are more prominent and the associated SF inside those very massive outflows possibly far higher [Gallagher et al., 2019, Rodríguez del Pino et al., 2019].
References
- Silk & Rees [1998] Silk, J., & Rees, M. J. 1998, A&A, 331, L1
- Fabian [2012] Fabian, A. C. 1995, ARA&A, 50, 455
- Silk [2013] Silk, J. 2013, ApJ, 772, 112
- Cresci et al. [2015] Cresci, G., Marconi, A., Zibetti, S., et al. 2015a, A&A, 582, A63
- Maiolino et al. [2017] Maiolino, R., Russell, H. R., Fabian, A. C., et al. 2017, Nature, 544, 202 19, 71, 75, 165
- Cicone et al. [2018] Cicone, C., Brusa, M., Ramos Almeida, C., et al. 2018, Nature Astronomy, 2, 176 6
- Bacon et al. [2010] Bacon, R., Accardo, M., Adjali, L., et al. 2010, Ground-based and Airborne Instrumentation for Astronomy III, Proc. SPIE, 7735, 773508
- Venturi et al. [2017] Venturi, G., Marconi, A., Mingozzi, M., et al. 2017, Front. Astron. Space Sci., 4, 46
- Venturi et al. [2018] Venturi, G., Nardini, E., Marconi, A., et al. 2018, A&A, 619, A74
- Mingozzi et al. [2019] Mingozzi, M., Cresci, G., Mannucci, F. et al. 2019, A&A, 622, A146
- Morganti et al. [2010] Morganti, R. 2010, Publications of the Astron. Soc. of Australia, 27, 463
- Marconi et al. [1994] Marconi, A., Moorwood, A. F. M., Origlia, L., & Oliva, E. 2019, The Messenger, 78, 20
- Hardcastle et al. [2003] Hardcastle, M. J., Worrall, D. M., Kraft, R. P., et al. 2003, ApJ, 593, 169
- Baldwin et al. [1981] Baldwin, J. A., Phillips, M. M., & Terlevich, R. 1981, Publications of the ASP, 78, 20
- Kauffmann et al. [2003] Kauffmann, G., Heckman, T. M., Tremonti, C., et al. 2003, MNRAS, 346, 1055
- Kewley et al. [2001] Kewley, L. J., Dopita, M. A., Sutherland, et al. 2001, ApJ, 78, 20
- Binette et al. [1996] Binette, L., Wilson, A. S., & Storchi-Bergmann, T. 1996, A&A, 78, 20
- Santoro et al. [2016] Santoro, F., Oonk, J. B. R., Morganti, R., et al. 2016, A&A, 590, A37
- Lee et al. [2009] Lee, J. C., Gil de Paz, A., Tremonti, C., et al. 2009, ApJ, 706, 599
- Gallagher et al. [2019] Gallagher, R., Maiolino, R., Belfiore, F., et al. 2019, MNRAS, 485, 3409
- Rodríguez del Pino et al. [2019] Rodríguez del Pino, B., Arribas, S., Piqueras López, et al. 2019, MNRAS, 486, 344