A MULTIWAVELENGTH STUDY OF THE MASSIVE COOL CORE CLUSTER MACS J1447.4+0827
Abstract
Clusters of galaxies are outstanding laboratories for understanding the physics of supermassive black hole feedback. Here, we present the first Chandra, Karl G. Janksy Very Large Array and Hubble Space Telescope analysis of MACS J1447.4+0827 (), one of the strongest cool core clusters known, in which extreme feedback from its central supermassive black hole is needed to prevent the hot intracluster gas from cooling. Using this multiwavelength approach, including 70 ks of Chandra X-ray observations, we detect the presence of collimated jetted-outflows that coincides with a southern and a northern X-ray cavity. The total mechanical power associated with these outflows ( erg s-1) is roughly consistent with the energy required to prevent catastrophic cooling of the hot intracluster gas ( erg s-1 for tcool = 7.7 Gyrs); implying that powerful supermassive black hole feedback has been in place several Giga-years ago in MACS J1447.7+0827. In addition, we detect the presence of a radio mini-halo that extends over 300 kpc in diameter ( W Hz-1). The X-ray observations also reveal a kpc plume-like structure that coincides with optical dusty filaments that surround the central galaxy. Overall, this study demonstrates that the various physical phenomena occurring in the most nearby clusters of galaxies are also occurring in their more distant analogues.
1 Introduction
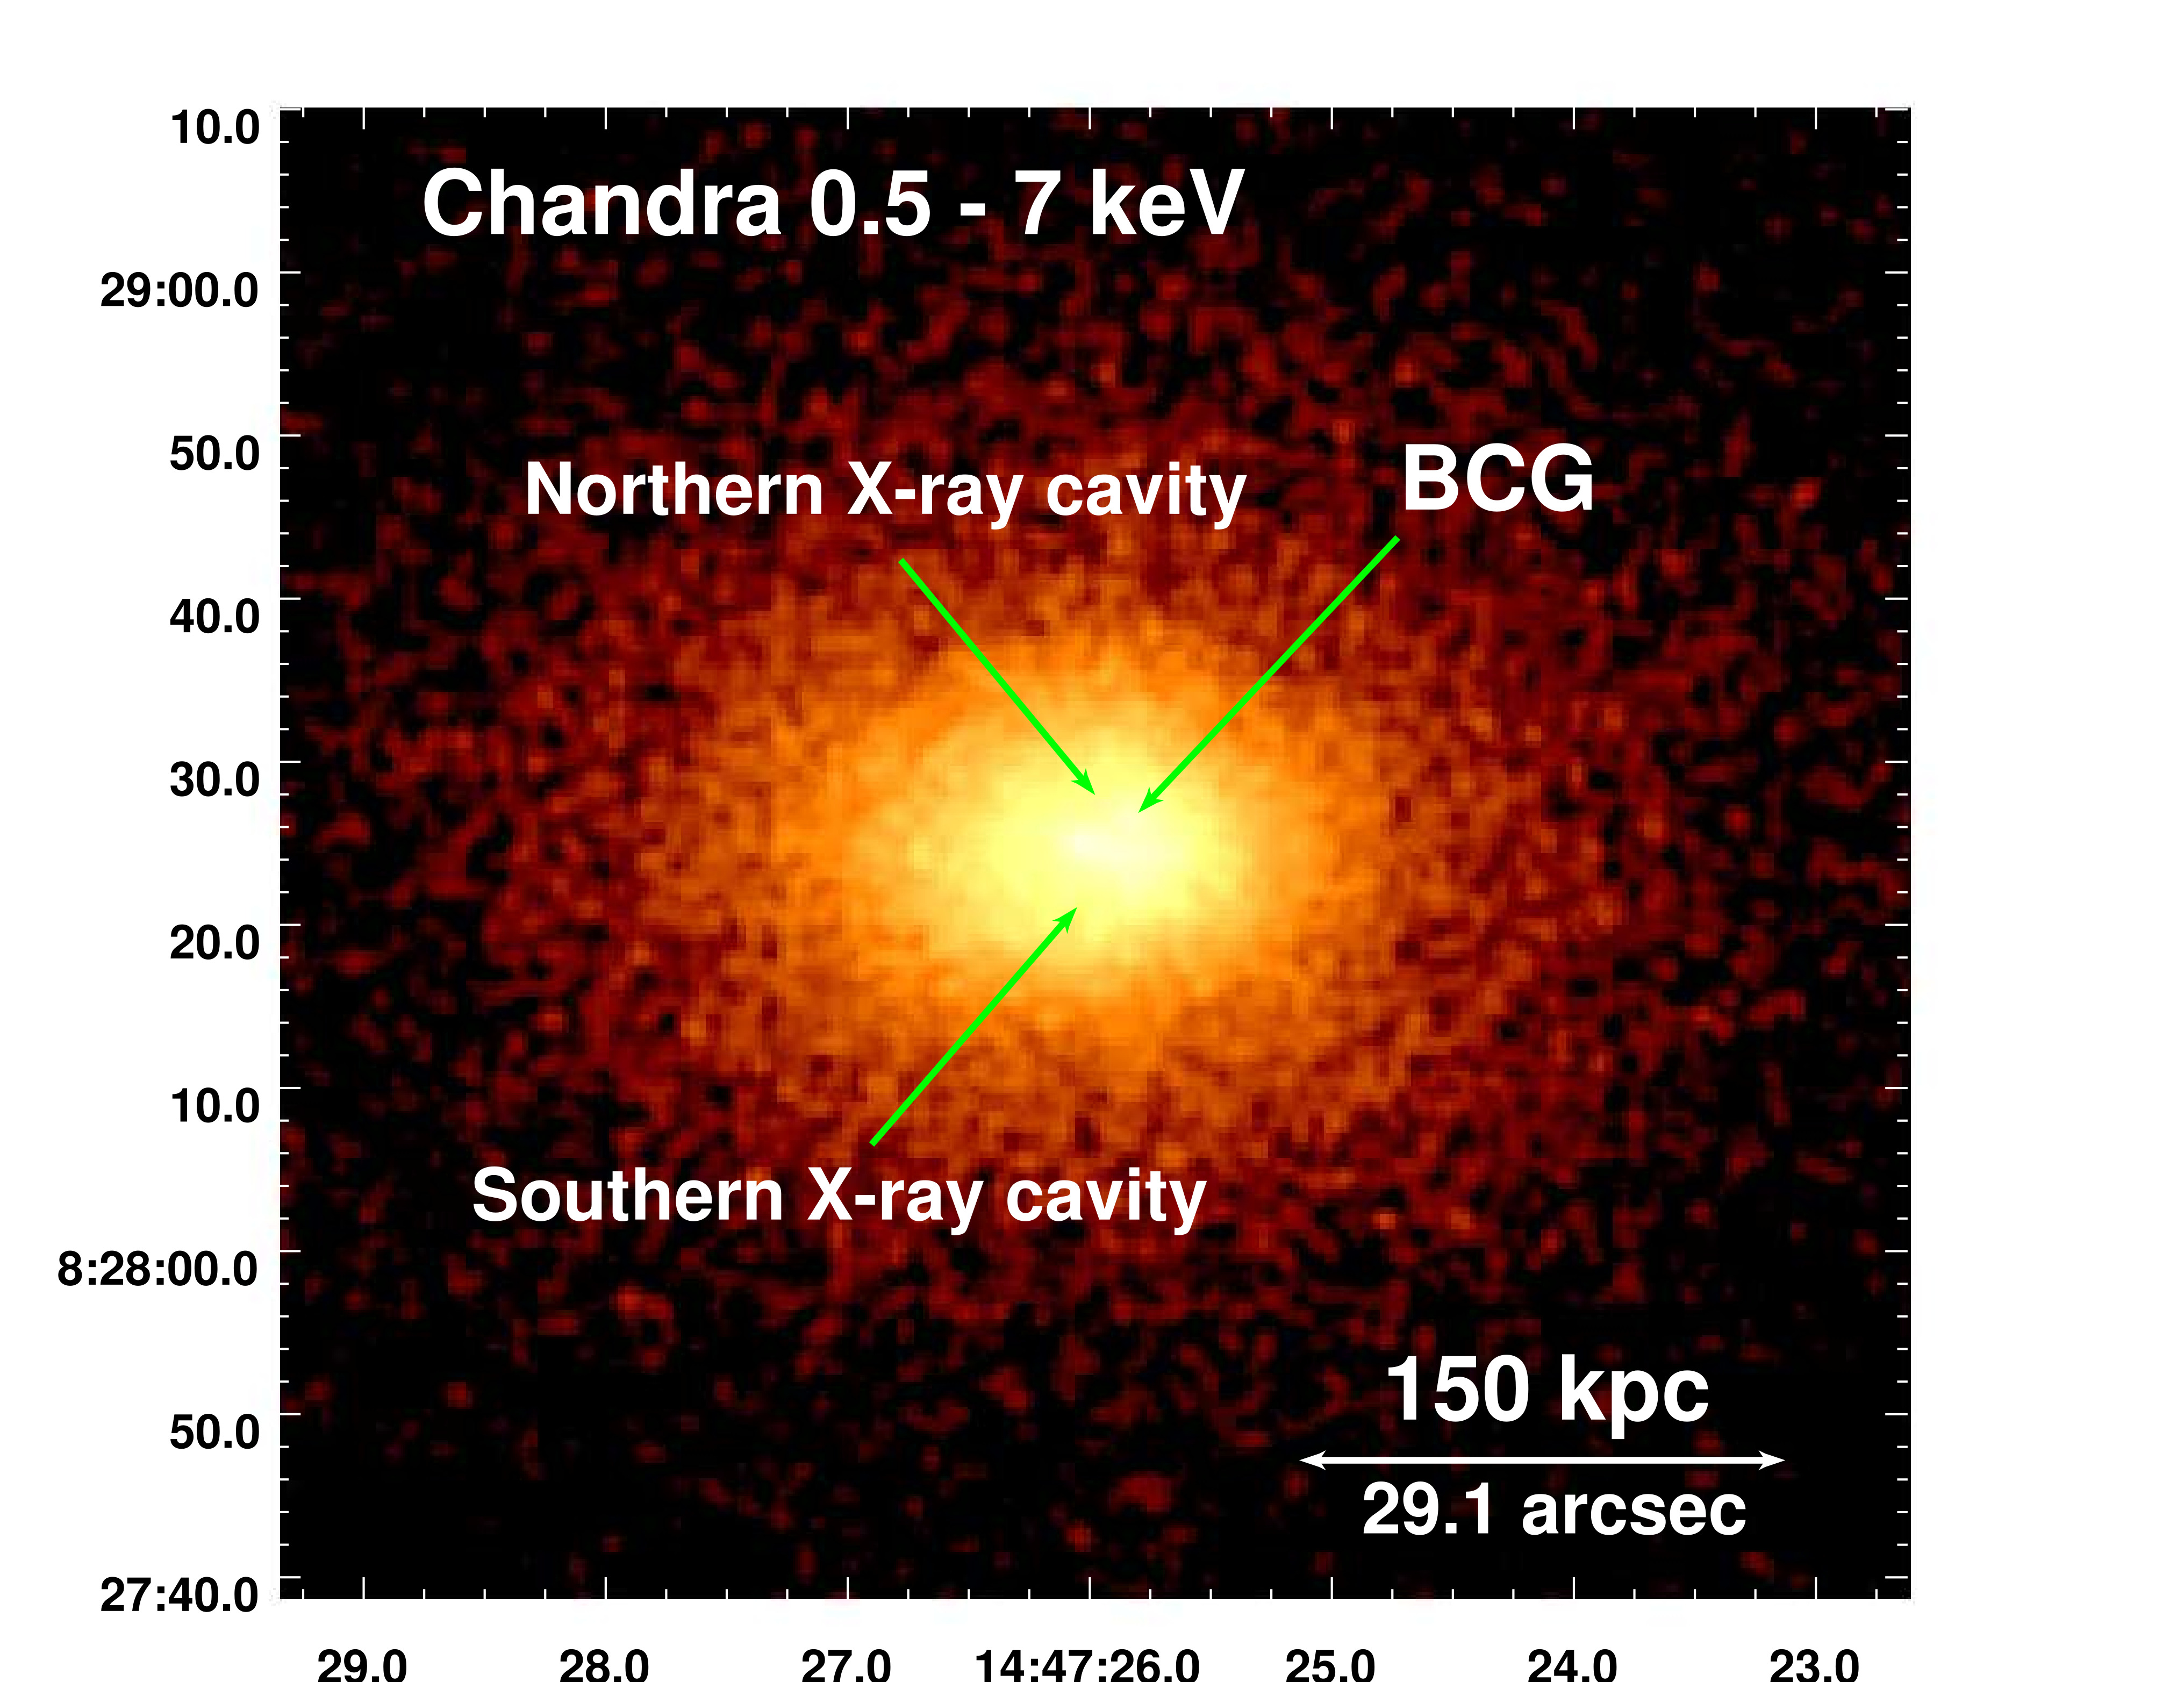
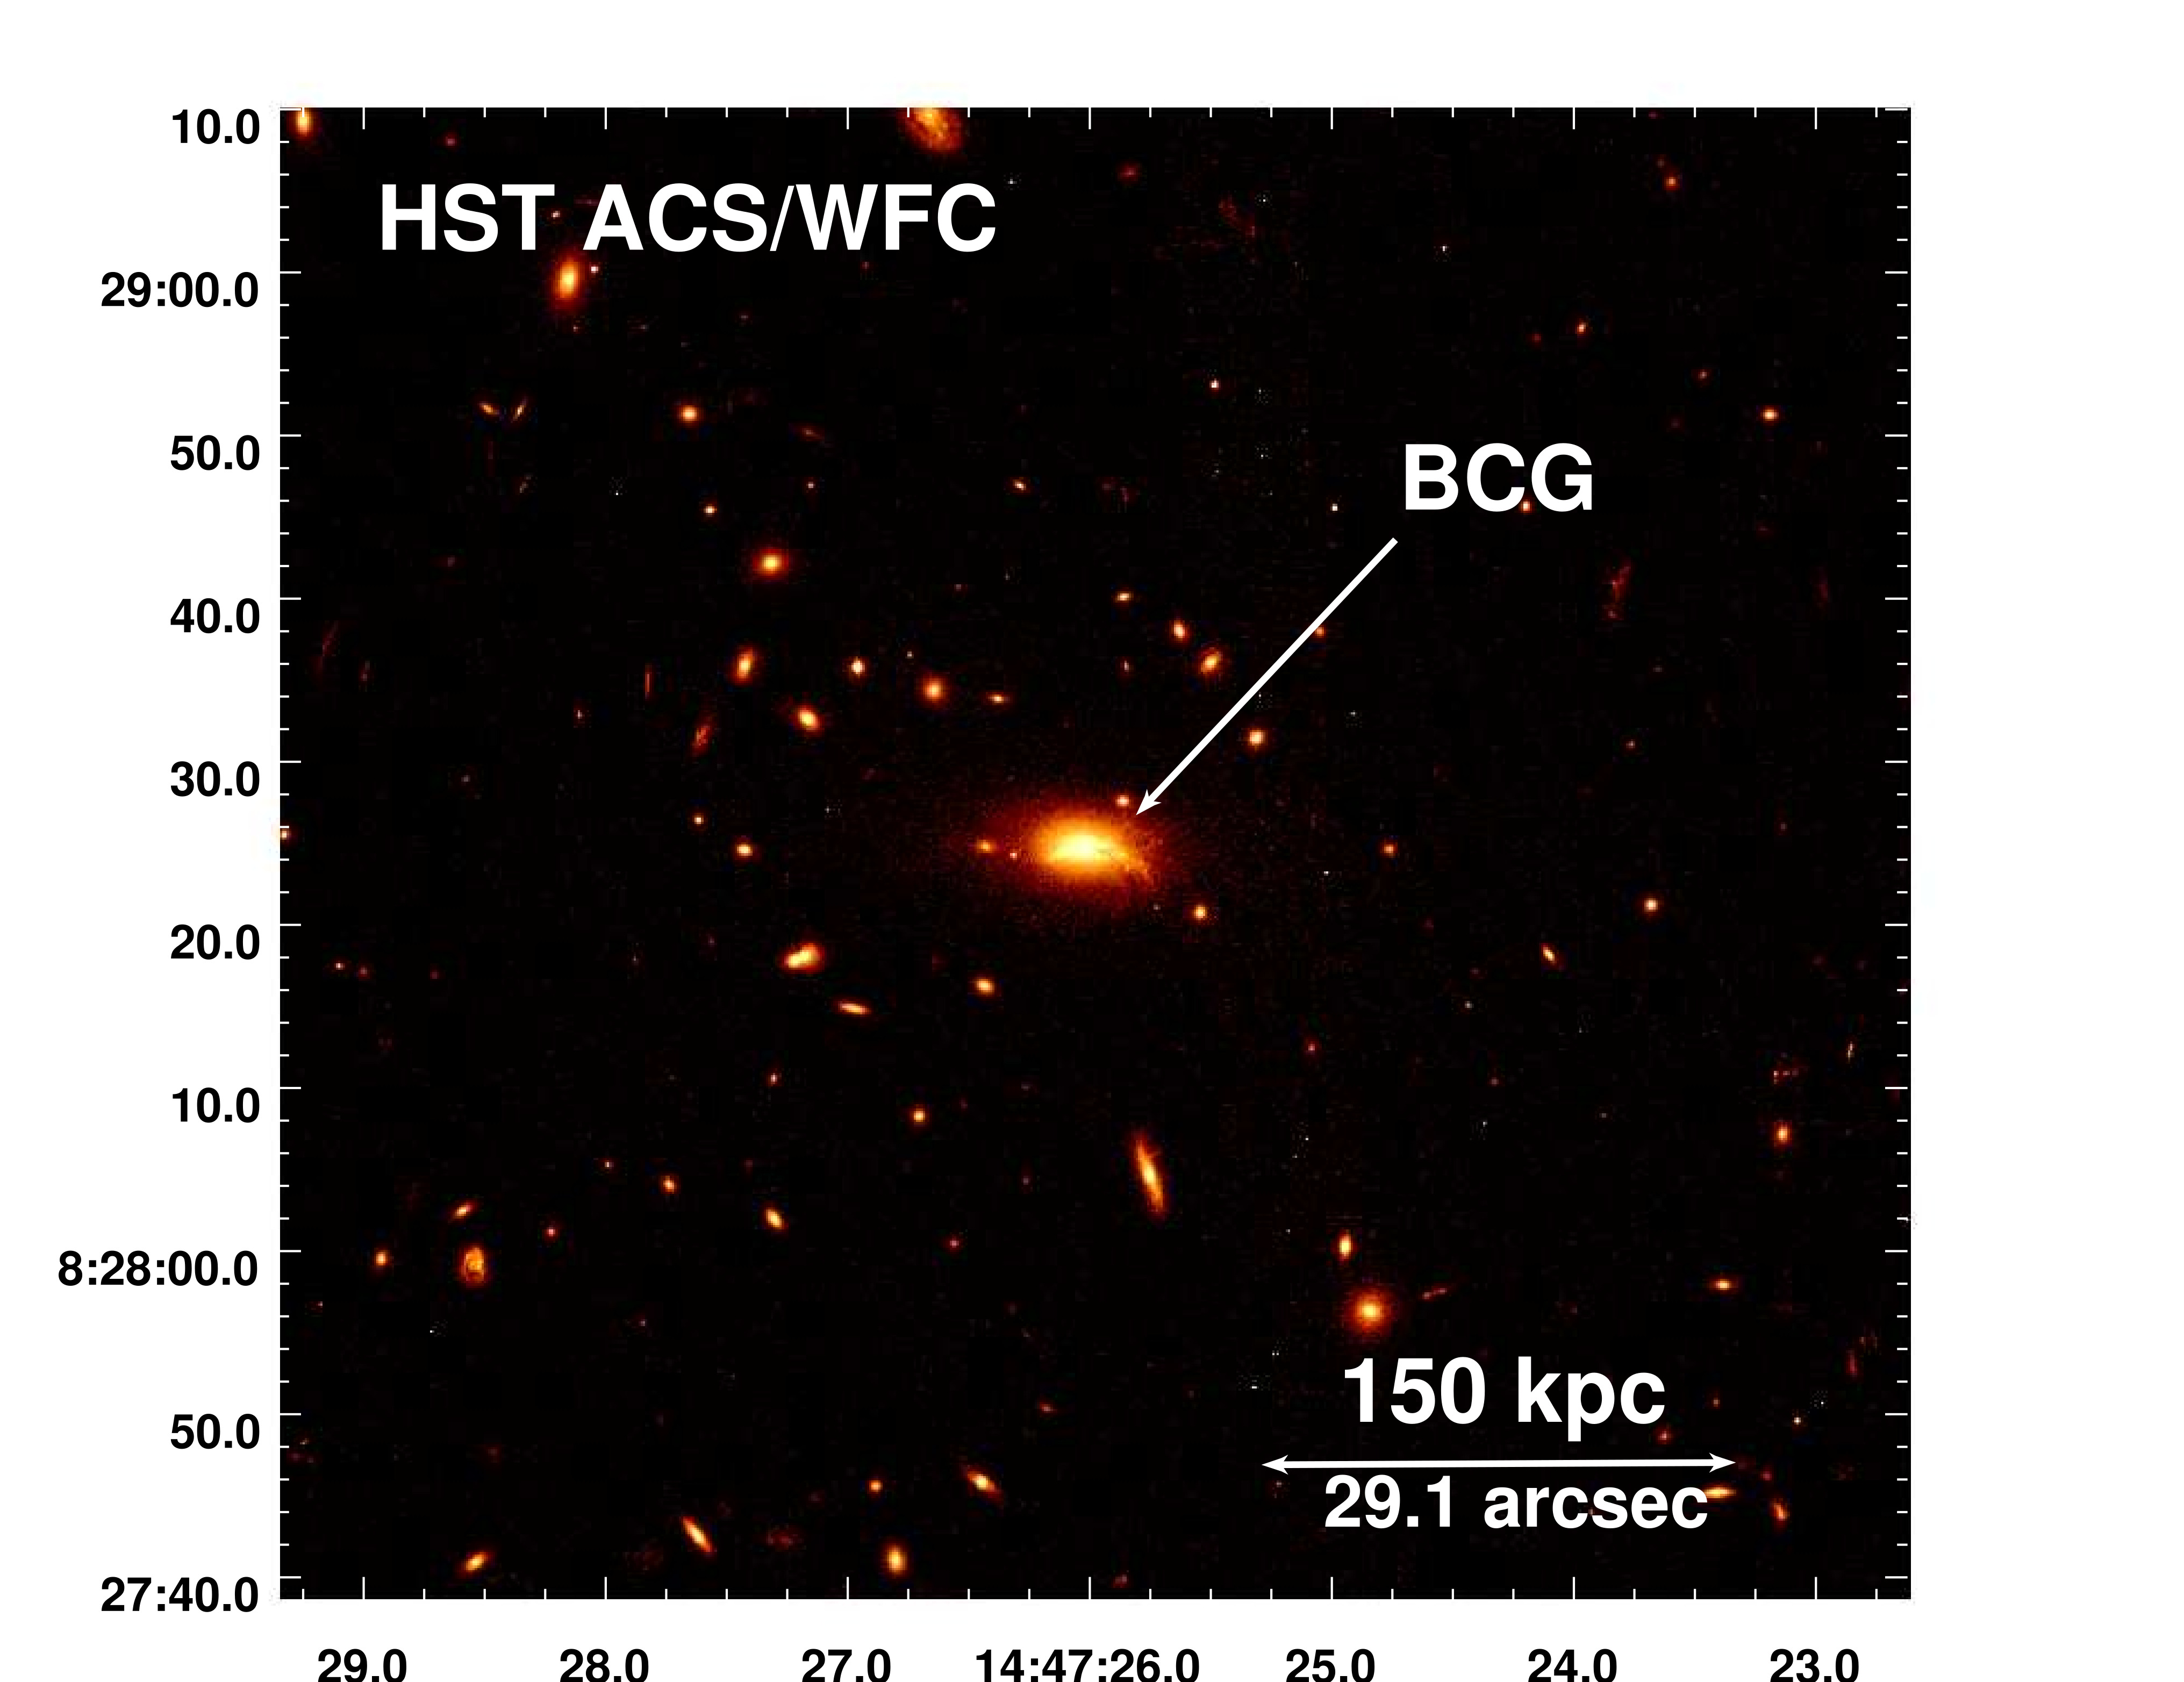
Clusters of galaxies are the largest gravitationally bound structures in the Universe. They are primarily composed of dark matter and an intracluster medium (ICM). They also contain hundreds to thousands of galaxies, including some of the most massive galaxies in the universe. At the center, a giant galaxy usually stands out, known as the Brightest Cluster Galaxy (BCG). The BCG is generally an elliptical galaxy hosting, at its center, a supermassive black hole (SMBH) that can generate powerful outflows jets (e.g. McConnell et al. 2011).
We generally classify clusters into two categories based on the spatial distribution of the hot ICM: cool core clusters, where the X-ray surface brightness distribution peaks steeply towards the center and the temperature drops abruptly in the core by a factor of 2-3, and non-cool core clusters in which the X-ray surface brightness distribution is less peaked and more uniform. In the centers of cool core clusters, the optically thin, almost completely ionized ICM has a radiative cooling time that is remarkably short ( 109 yr; e.g. Voigt & Fabian 2004; Peterson & Fabian 2006; Hlavacek-Larrondo et al. 2012b). Left to its own devices, this gas would be forecasted to cool and form stars at rates of several hundred to thousands of solar masses per year (e.g. Fabian 1994). However, the ICM is not cooling as fast as predicted and therefore the observed star formation rates are much lower than expected (e.g. Johnstone et al. 1987; Nulsen et al. 1987; O’Dea et al. 2008; Rafferty et al. 2008; Gaspari et al. 2013a; McDonald et al. 2018).
This discrepancy is likely due to the Active Galactic Nucleus (AGN) located at the center of the BCG through a mechanism known as AGN feedback. According to this mechanism, the AGN inflates cavities (or bubbles) in the ICM, detectable using X-ray emission, through relativistic jetted outflows visible at radio wavelengths. The exact mechanism that reheats uniformly the ICM is not yet known, although shock, sound waves and turbulent heating are likely part of the process (e.g. Birzan et al. 2004, 2008; Dunn & Fabian 2006, 2008; Nulsen et al. 2009; Cavagnolo et al. 2010; Dong et al. 2010; Hlavacek-Larrondo et al. 2012b; Zhuravleva et al. 2014, 2016, 2018).
The goal of this paper is to better understand these AGN processes by targetting one of the most massive and strongest cool core clusters known, in which feedback must be operating in an extreme level to offset cooling.
The MAssive Cluster Survey (MACS) consists of a sample of about 120 very X-ray luminous clusters located at a redshift between 0.3 and 0.7 (e.g. Ebeling et al. 2001, 2007, 2010). The clusters have been selected from the ROSAT All-Sky Survey and were spectroscopically confirmed. The MACS survey has allowed the discovery of new massive clusters at 0.3 and thus improved the ability to study their evolution as well as the physical and cosmological parameters driving them. MACS clusters have also been the focus of several gravitational lensing surveys (e.g. MACS J0416.1-2403, Kaurov et al. 2019; MACS J0717.5+3745, Zitrin et al. 2009; Jauzac et al. 2012; Limousin et al. 2012; MACS J1149.5+2223, Smith et al. 2009; MACS J0416.1-2403, Chirivì et al. 2018; Weighing the Giants program, von der Linden et al. 2014; Applegate et al. 2014, 2016).
In this paper, we present a multiwavelength study of MACS J1447.4+0827 ( = 0.3755), one of the strongest and most X-ray luminous cool core clusters in the MACS survey, similar to well-studied systems such as RBS 797 (e.g. Schindler et al. 2001; De Filippis et al. 2002; Jetzer et al. 2002; Castillo-Morales & Schindler 2003; Gitti et al. 2006), MACS J1931.8-2634 (e.g. Ehlert et al. 2011; Santos et al. 2016), IRAS 09104+4109 (e.g. Kleinmann et al. 1988; Hines & Wills 1993; Fabian 1999; Franceschini et al. 2000; Iwasawa et al. 2001; Piconcelli et al. 2007; Vignali et al. 2011; Farrah et al. 2016) and RX J1532.9+3021 (e.g. Hlavacek-Larrondo et al. 2013b; Gupta et al. 2016). Here, we present the first detailed study of this cluster. This paper is based on new Chandra X-ray Observatory and Karl G. Janksy Very Large Array (JVLA) observations of the source and focuses on understanding its feedback properties. Richard-Laferrière et al. (submitted) recently presented the radio mini-halo properties of this cluster.
Section 2 introduces the X-ray, radio and optical observations and the data reduction and processing. Section 3 presents the X-ray imaging analysis of the cluster. Section 4 presents a detailed X-ray spectral analysis of the thermodynamic properties of MACS J1447.4+0827. In Section 5, we present the radio analysis of the cluster. In Section 6, we highlight the properties of the central AGN. Finally, in Section 7, we discuss our results and their implications.
We use = 70 km s-1 Mpc-1, = 0.3 and = 0.7 as values of the cosmological parameters, and = 0.3755 as the cluster redshift (1 = 5.157 kpc; Ebeling et al. 2010). Errors are 1 (68.3%) throughout the paper (unless mentioned).
2 Observations and data reduction
2.1 X-rays: Chandra observations
The Chandra Advanced CCD Imaging Spectrometer (ACIS) in VFAINT mode was used to observe MACS J1447.4+0827 three times: first in 2008, centered on the ACIS-S3 back-illuminated chip (12 ks; ObsID 10481; PI Hicks) and then twice in 2016, centered on the ACIS-I3 front-illuminated chip (43 ks; ObsID 17233 and 25 ks; ObsID 18825; PI Hlavacek-Larrondo). These observations are presented in Table 1.
| Observation number | Date | Detector | Exposure [ks] |
|---|---|---|---|
| 10481 | 12/14/2008 | ACIS-S | 11.1 |
| 17233 | 04/05/2016 | ACIS-I | 41.0 |
| 18825 | 04/06/2016 | ACIS-I | 24.2 |
Starting from the event 1 file, the ObsIDs were cleaned, processed and calibrated using the CIAO software (CIAO v4.10 and CALDB v4.7.8). After reprocessing the data with the chandrarepro routine, we excluded 9 point sources by eye using ds9 and we removed flares with deflare with lcclean and a 3 threshold. The net exposure times are presented in Table 1.
| Date | Frequency [GHz] | Bandwidth [GHz] | Configuration | Duration [min] | [mJy/beam] |
|---|---|---|---|---|---|
| 08/14/2015 | 1.5 | 1 | A | 180 | 0.011 |
| 05/25/2016 | 1.5 | 1 | B | 180 | 0.016 |
| 02/02/2016 | 1.5 | 1 | C | 180 | 0.015 |
Background event files, background images and background-subtracted images were generated using blanksky and blankskyimage. Finally, the tool mergeobs was applied to the observations to merge the event files, which created a final exposure-corrected image. The cleaned, merged, background subtracted and exposure-corrected Chandra image is presented in the left panel of Fig. 1. We note that we also computed several of the cluster properties using a background region far from the cluster on the ACIS-I chips and obtained consistent results with the blanksky background event files.
XSPEC (v12.10.0c) was used to analyze spectroscopically the X-ray observations of MACS J1447.4+0827. Throughout this study, we used the Anders & Grevesse (1989) abundance ratios and the Kalberla et al. (2005) value of the Galactic absorption ( cm-2). We verified this value by picking a certain region located between 50 kpc and 200 kpc from the center – in which there is no emission (e.g. from the AGN) – and fitting an absorbed apec plasma model to the spectrum in the 0.5 – 7 keV energy range while letting the Galactic absorption, temperature, abundance and normalization parameters free to vary. We obtained results consistent with the Kalberla et al. (2005) value within 1.
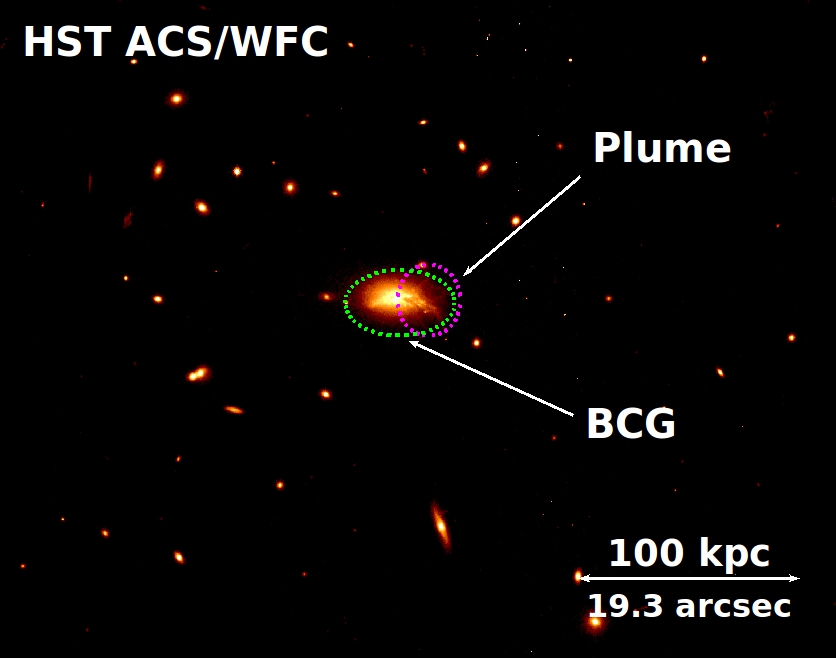
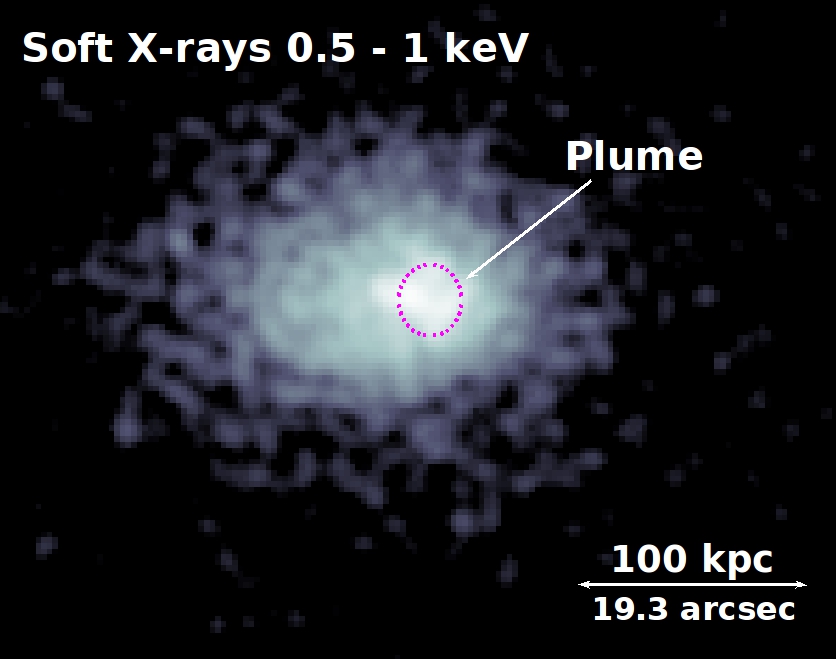
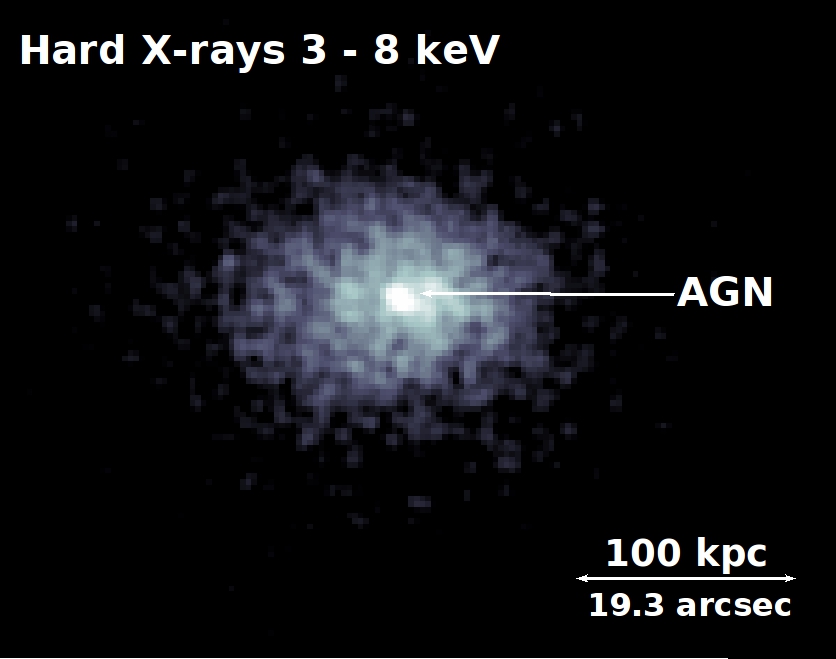
The middle and right panels of Fig. 2 present the soft 0.5 – 1 keV and hard 3 – 8 keV X-ray Chandra images. The middle panel reveals a plume-like structure that matches the western filaments of the BCG which we discuss in Section 4.3. The right panel has a bright point-like region in the center coincident with the BCG. We interpret this feature as the central AGN and we present its properties in Section 6.
2.2 Radio: JVLA observations
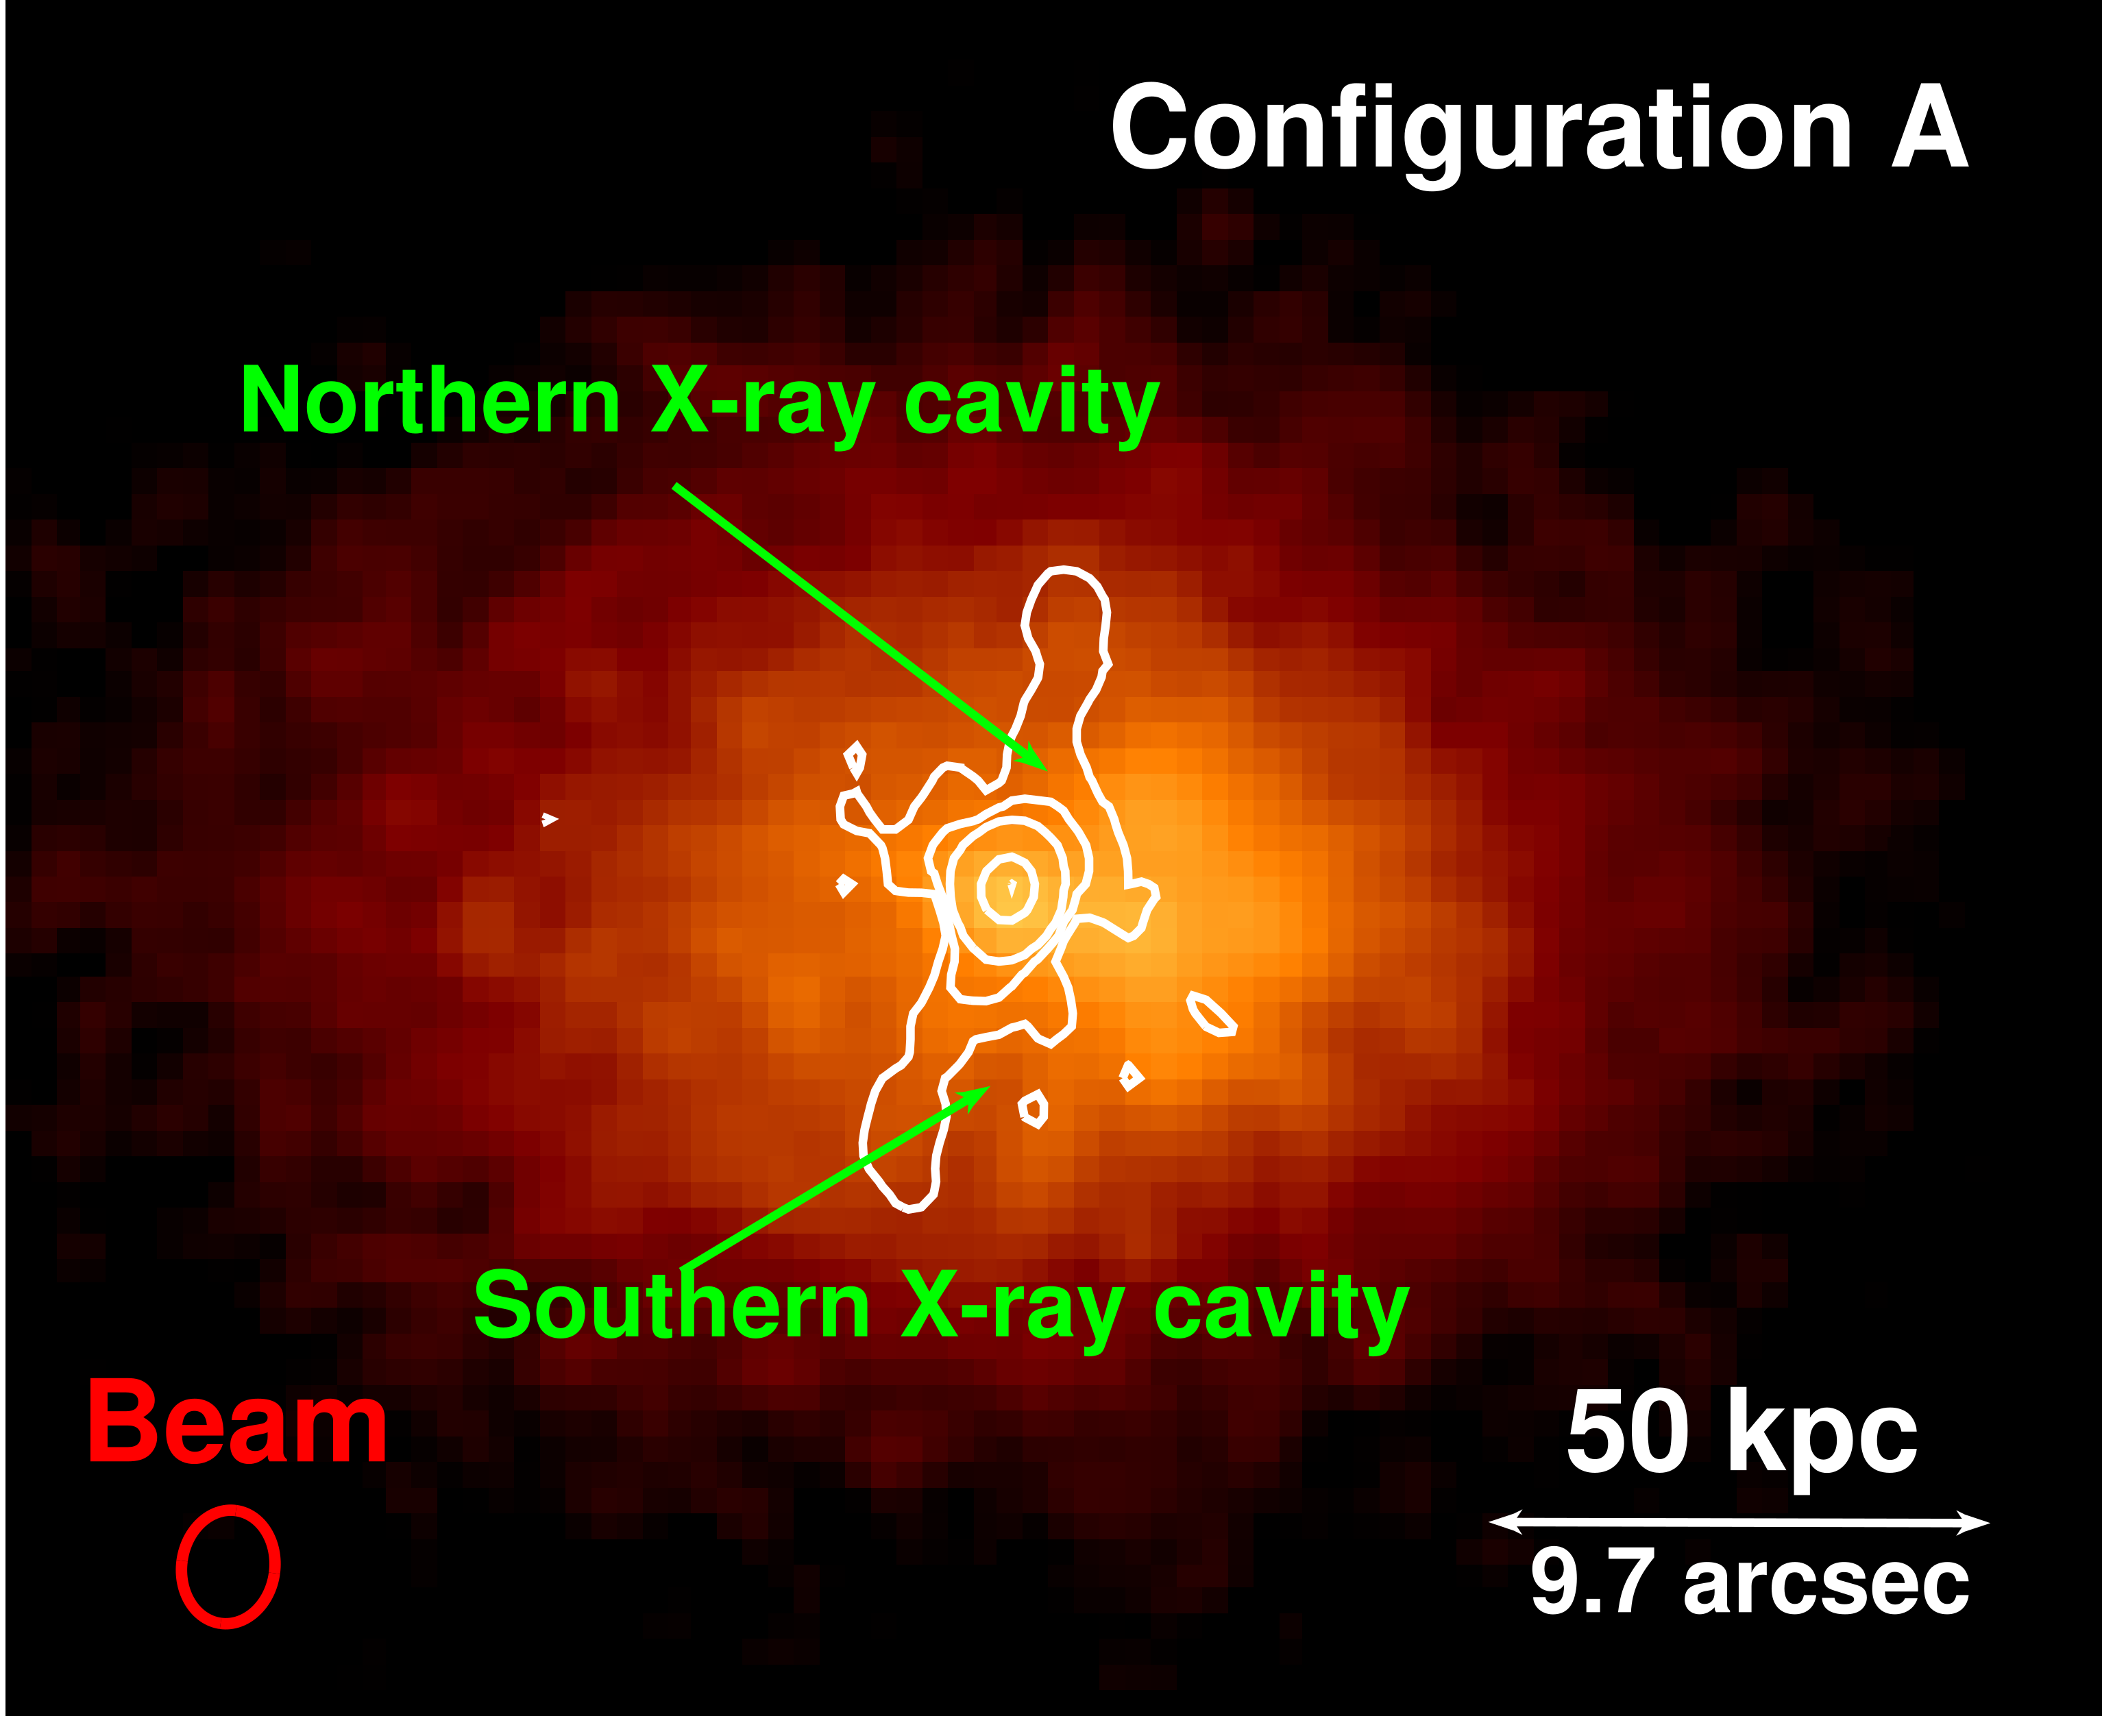
MACS J1447.4+0827 was also observed with the JVLA at 1.4 GHz (L band; PI Hlavacek-Larrondo). We present a summary of the data in Table 2. Configurations A, B and C were obtained to maximize the different scales detected: the A-configuration observations are of comparable resolution to Chandra, whereas B- and C-configurations allow for better detection of faint extended radio emission. The data were reduced with the software CASA (v4.6). A more detailed description of the data reduction and imaging processes are presented in Richard-Laferrière et al. (submitted).
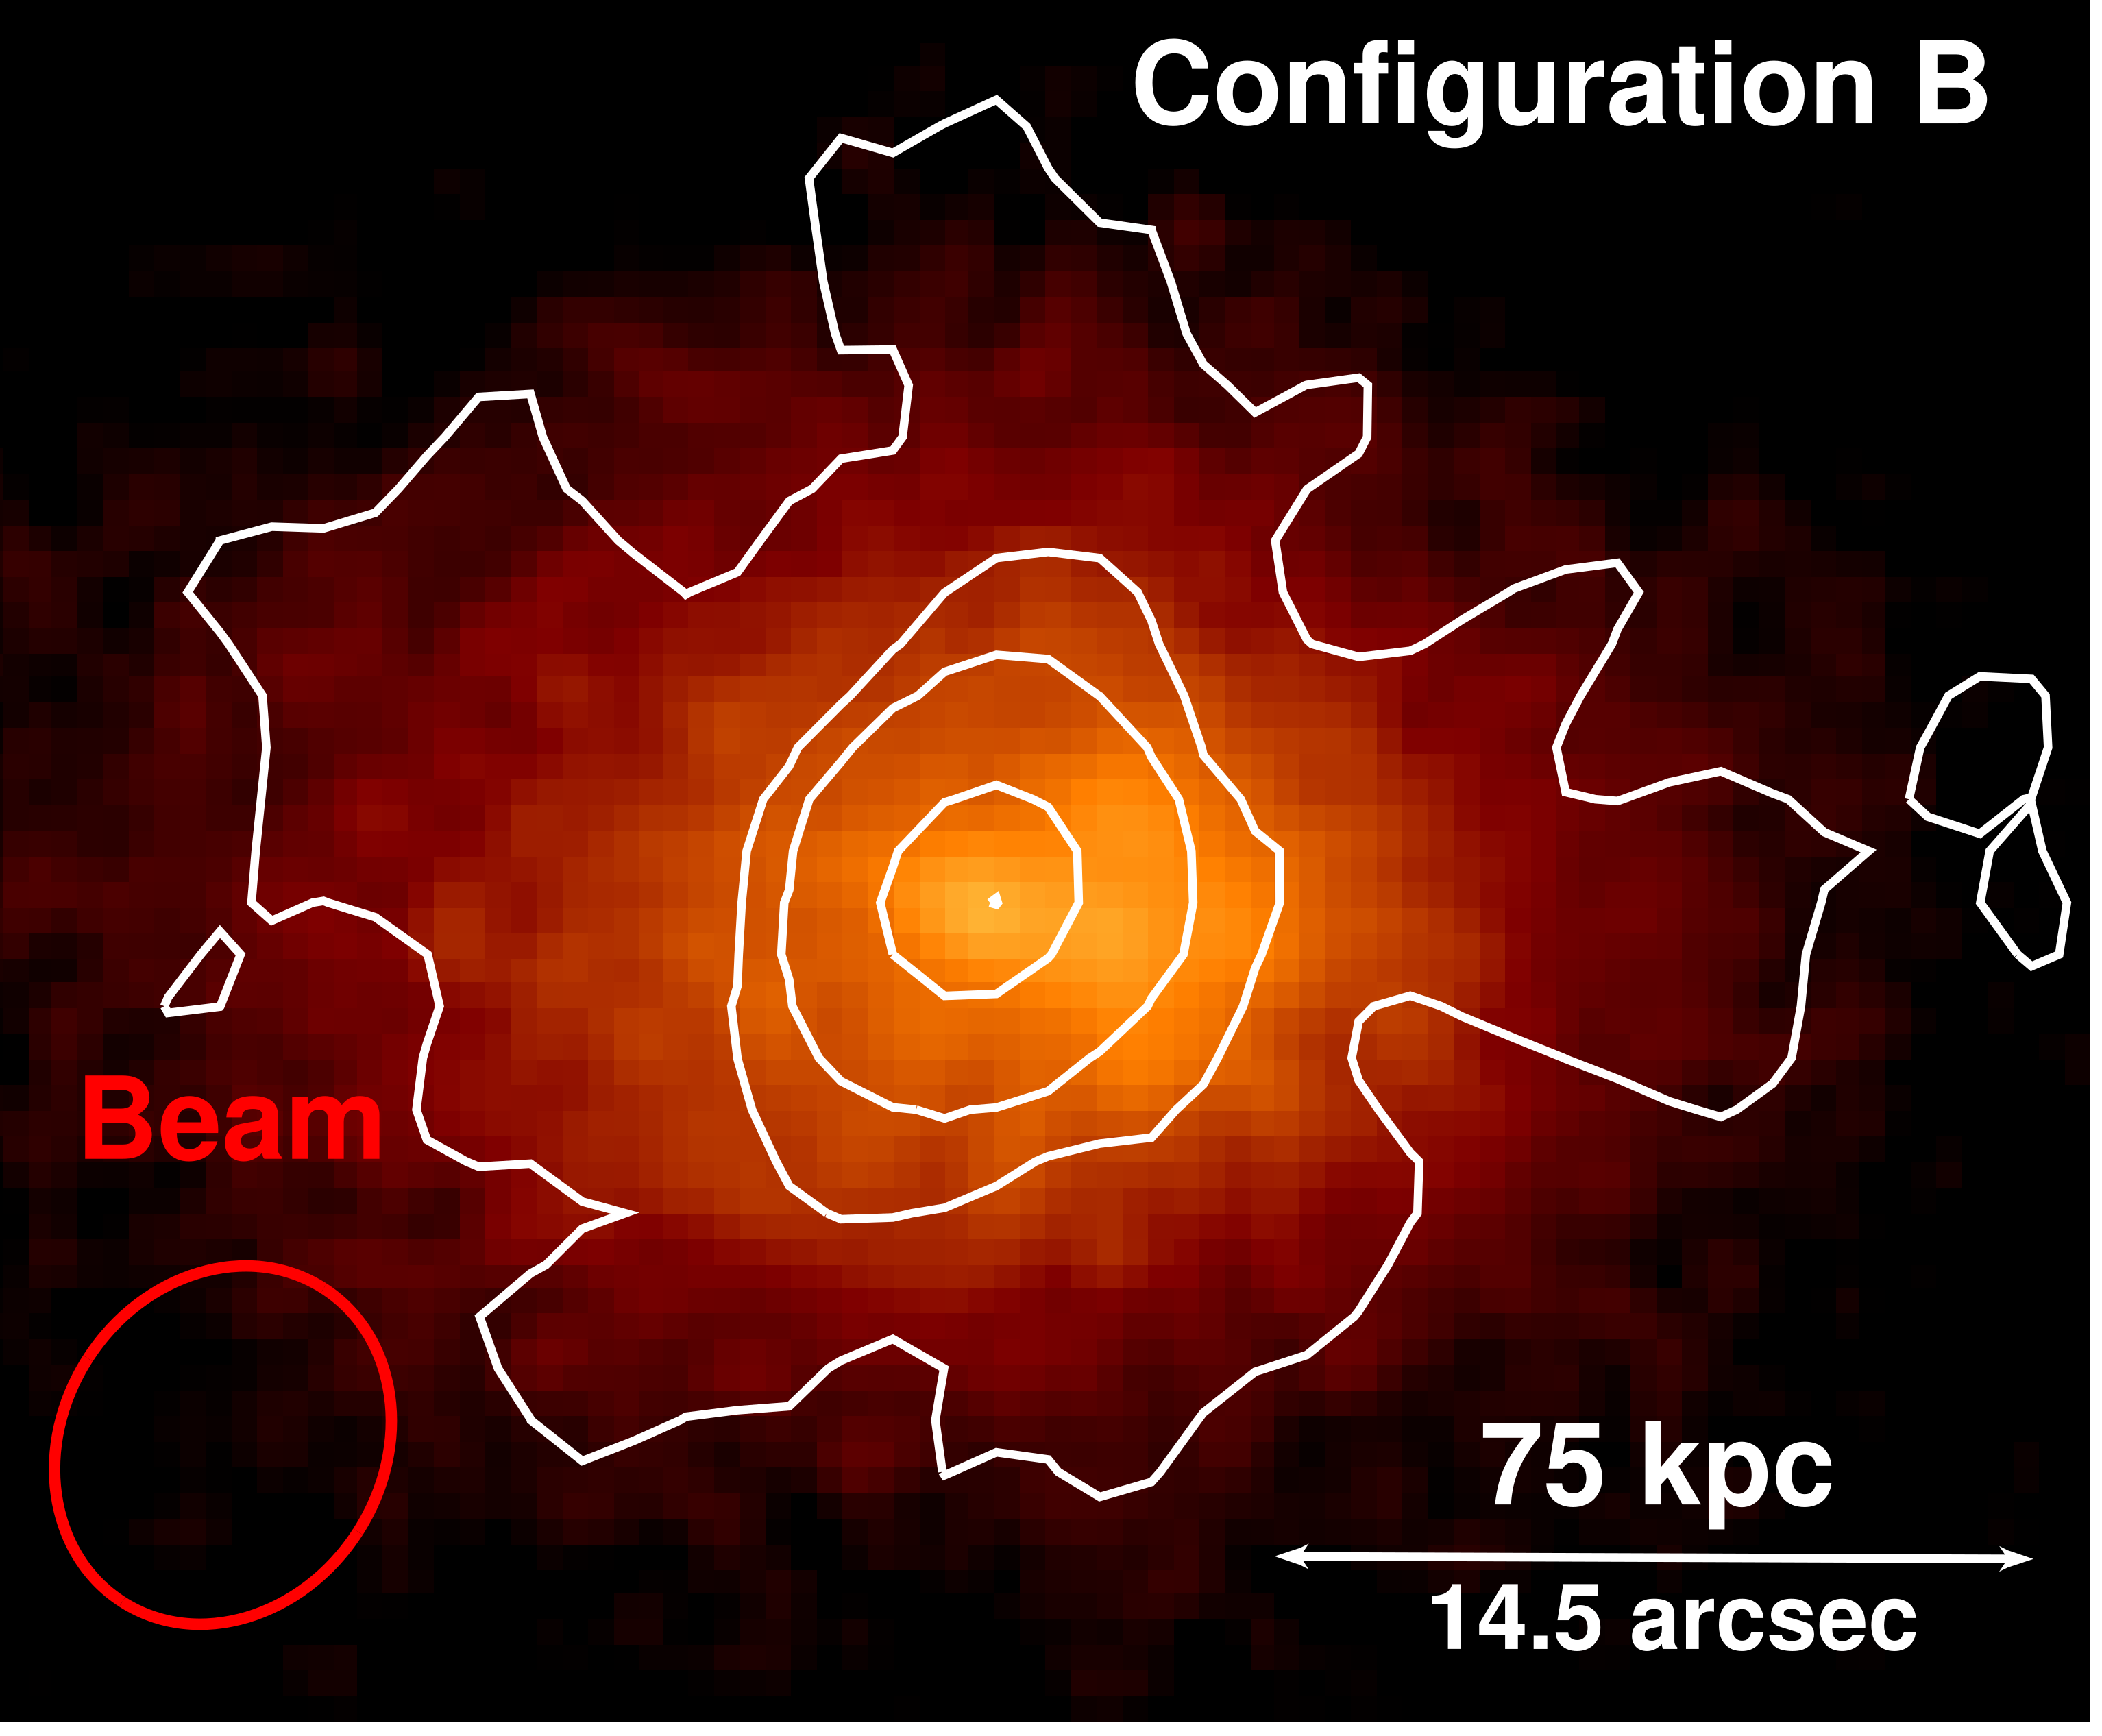
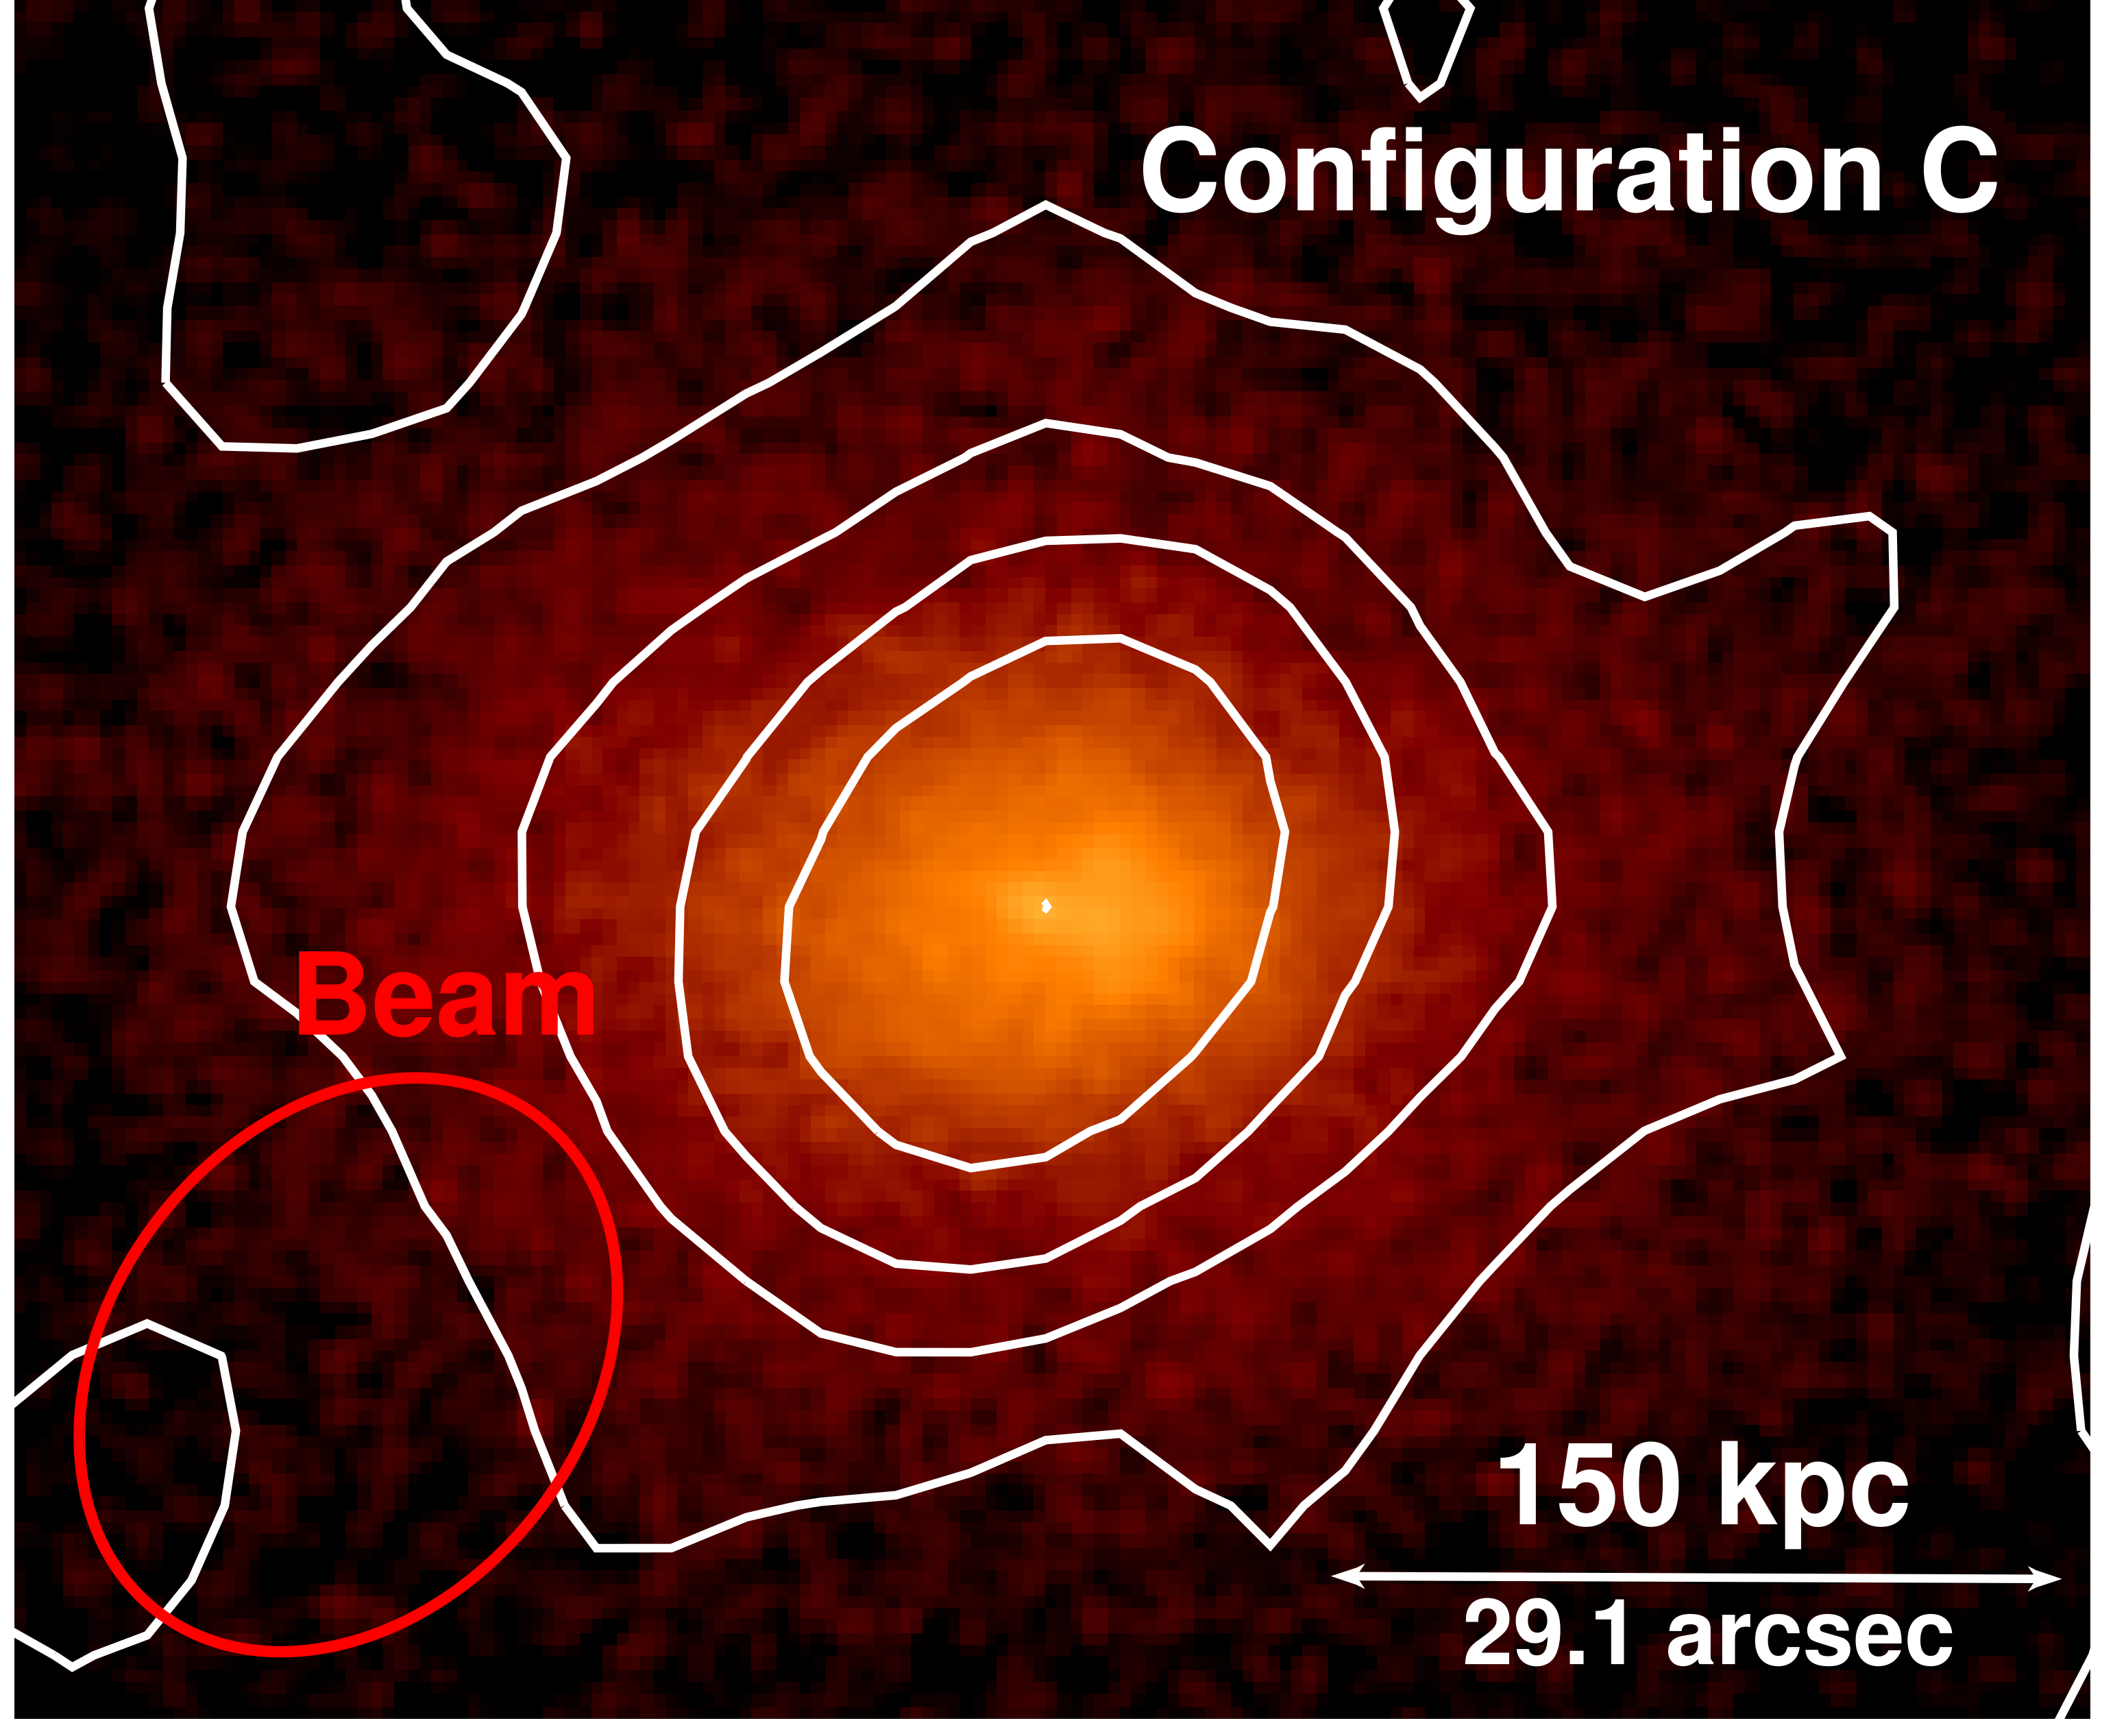
The exposure-corrected and background-subtracted 0.5 – 7 keV Chandra image along with the 1.4 GHz JVLA configurations A (left), B (middle) and C (right) contours are shown in Fig. 3. The images respectively have beam sizes of 0.9 1.1, 3.1 3.6 and 9.6 12.5. The root-mean-square (rms) reached are shown in Table 2.
The A-configuration contours reveal the presence of a compact central AGN that coincides with the X-ray point source seen in the right panel of Fig. 2 and located at RA = and DEC = . It also reveals the presence of north-south oriented jetted outflows that will be analyzed in Section 6.3. Configurations B and C reveal faint emission that extends out to 160 kpc of radius. This type of structure has already been seen in other cool core clusters and we interpreted it as a radio mini-halo (e.g. Mazzotta & Giacintucci 2008, Richard-Laferrière et al. submitted). We characterize the properties of the mini-halo in Section 5.2
2.3 Optical: HST observations
The Hubble Space Telescope (HST) was used to provide optical images of MACS J1447.4+0827 (PI Ebeling). We used two broad-band filters both using the camera Wide Field Channel (WFC)/HRC: F606W ( = 5907 Å; = 2342 Å) and F814W ( = 8333 Å; = 2511 Å). These filters contain the redshifted H emission line (H6562) and highlight the filamentary structure of the BCG. The right panel of Fig. 1 and the left panel of 2 shows the F814W image taken with the Advanced Camera for Surveys (ACS) WFC.
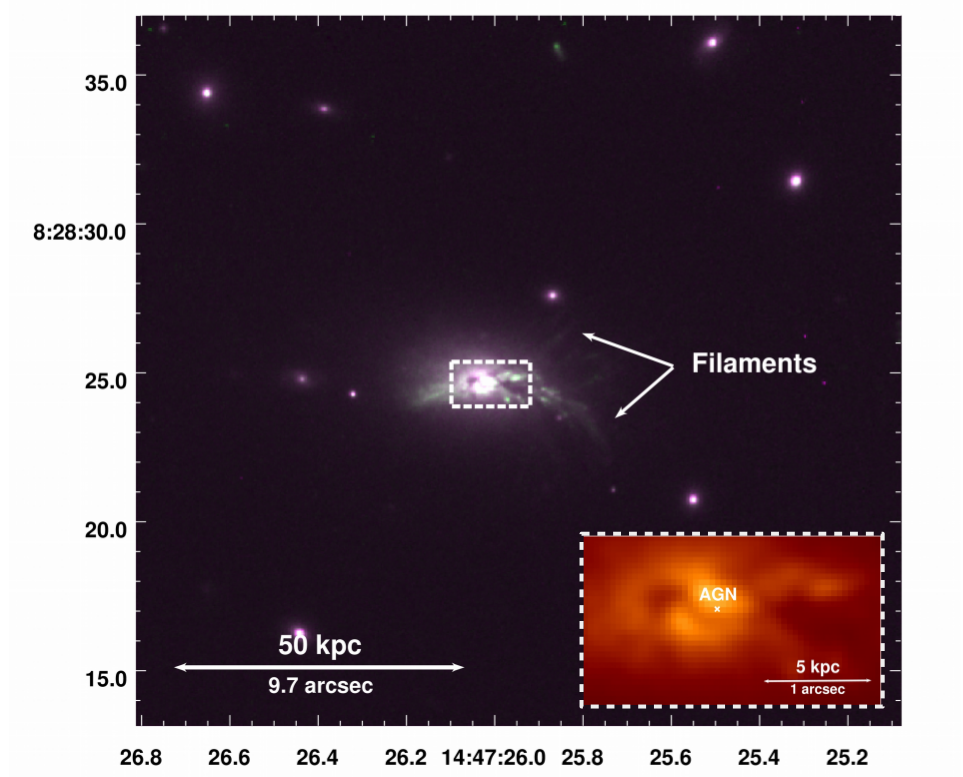
Fig. 4 shows the combined HST F814W (red and blue) and F606W (green) images of MACS J1447.4+0827. The BCG is surrounded by optically bright filaments up to 25 kpc in size. We can denote two prominent filaments: one oriented in the west-south direction and the other in the west-north direction. We analyze the properties of the filaments more in detail in Section 7.2.
3 X-ray Imaging analysis of the cluster
In the following sections, we present the methods used in this study to highlight the X-ray cavities. Although the cavities are not clearly visible in the raw image (see Fig. 1), they must exist due to the presence of relativistic outflows (see left panel of Fig. 3) that push gas. We therefore applied a total of three different methods to bring out these features.
3.1 Gaussian Gradient Magnitude
First, we applied a Gaussian Gradient Magnitude (GGM) filter technique that has recently been applied to astronomical X-ray datasets (Sanders et al., 2016). Starting with the exposure-corrected, background-subtracted image of MACS J1447.4+0827, we convolve the image with the multi-directional gradient of a gaussian using the scipy implementation111The implementation of our code can be found at https://github.com/crhea93/AstronomyTools/tree/master/GGF. This process allows us to strategically resolve astrophysical phenomena of different scale lengths by adjusting the gaussian’s sigma value. Here, we have chosen a = 2 in order to pick out structures corresponding to a 5 kpc scale. We further applied a logarithmic scaling to highlight the complicated substructure. We present the GGM Chandra image in the left panel of Fig. 5. Unfortunately, we do not detect any cavities with this technique, but this image allows to see the variations in the cluster.
3.2 Unsharp-masked
We then subtracted a 2D gaussian smoothed image ( = 6 pixels) from a less smoothed image ( = 1 pixel) using fgauss and farith from CIAO. This unsharp-masked image is presented in the middle panel of Fig. 5, where we can denote four cavity-like structures. In the middle of this image, we can also see a brightest part – a plume-like structure – that will be described in Section 4.3. We tested several smoothing and binning factors to make the X-ray cavities as clear as possible.
3.3 Double- model
To further test the presence of cavities, we used a double- model (e.g. Jones & Forman 1984; Vikhlinin et al. 2005) to fit the X-ray surface brightness profile, based on the following equation from Cavaliere & Fusco-Femiano (1976):
| (1) |
Here, is the central surface luminosity, is the radius of the core, is the slope and is the constant associated with the background.
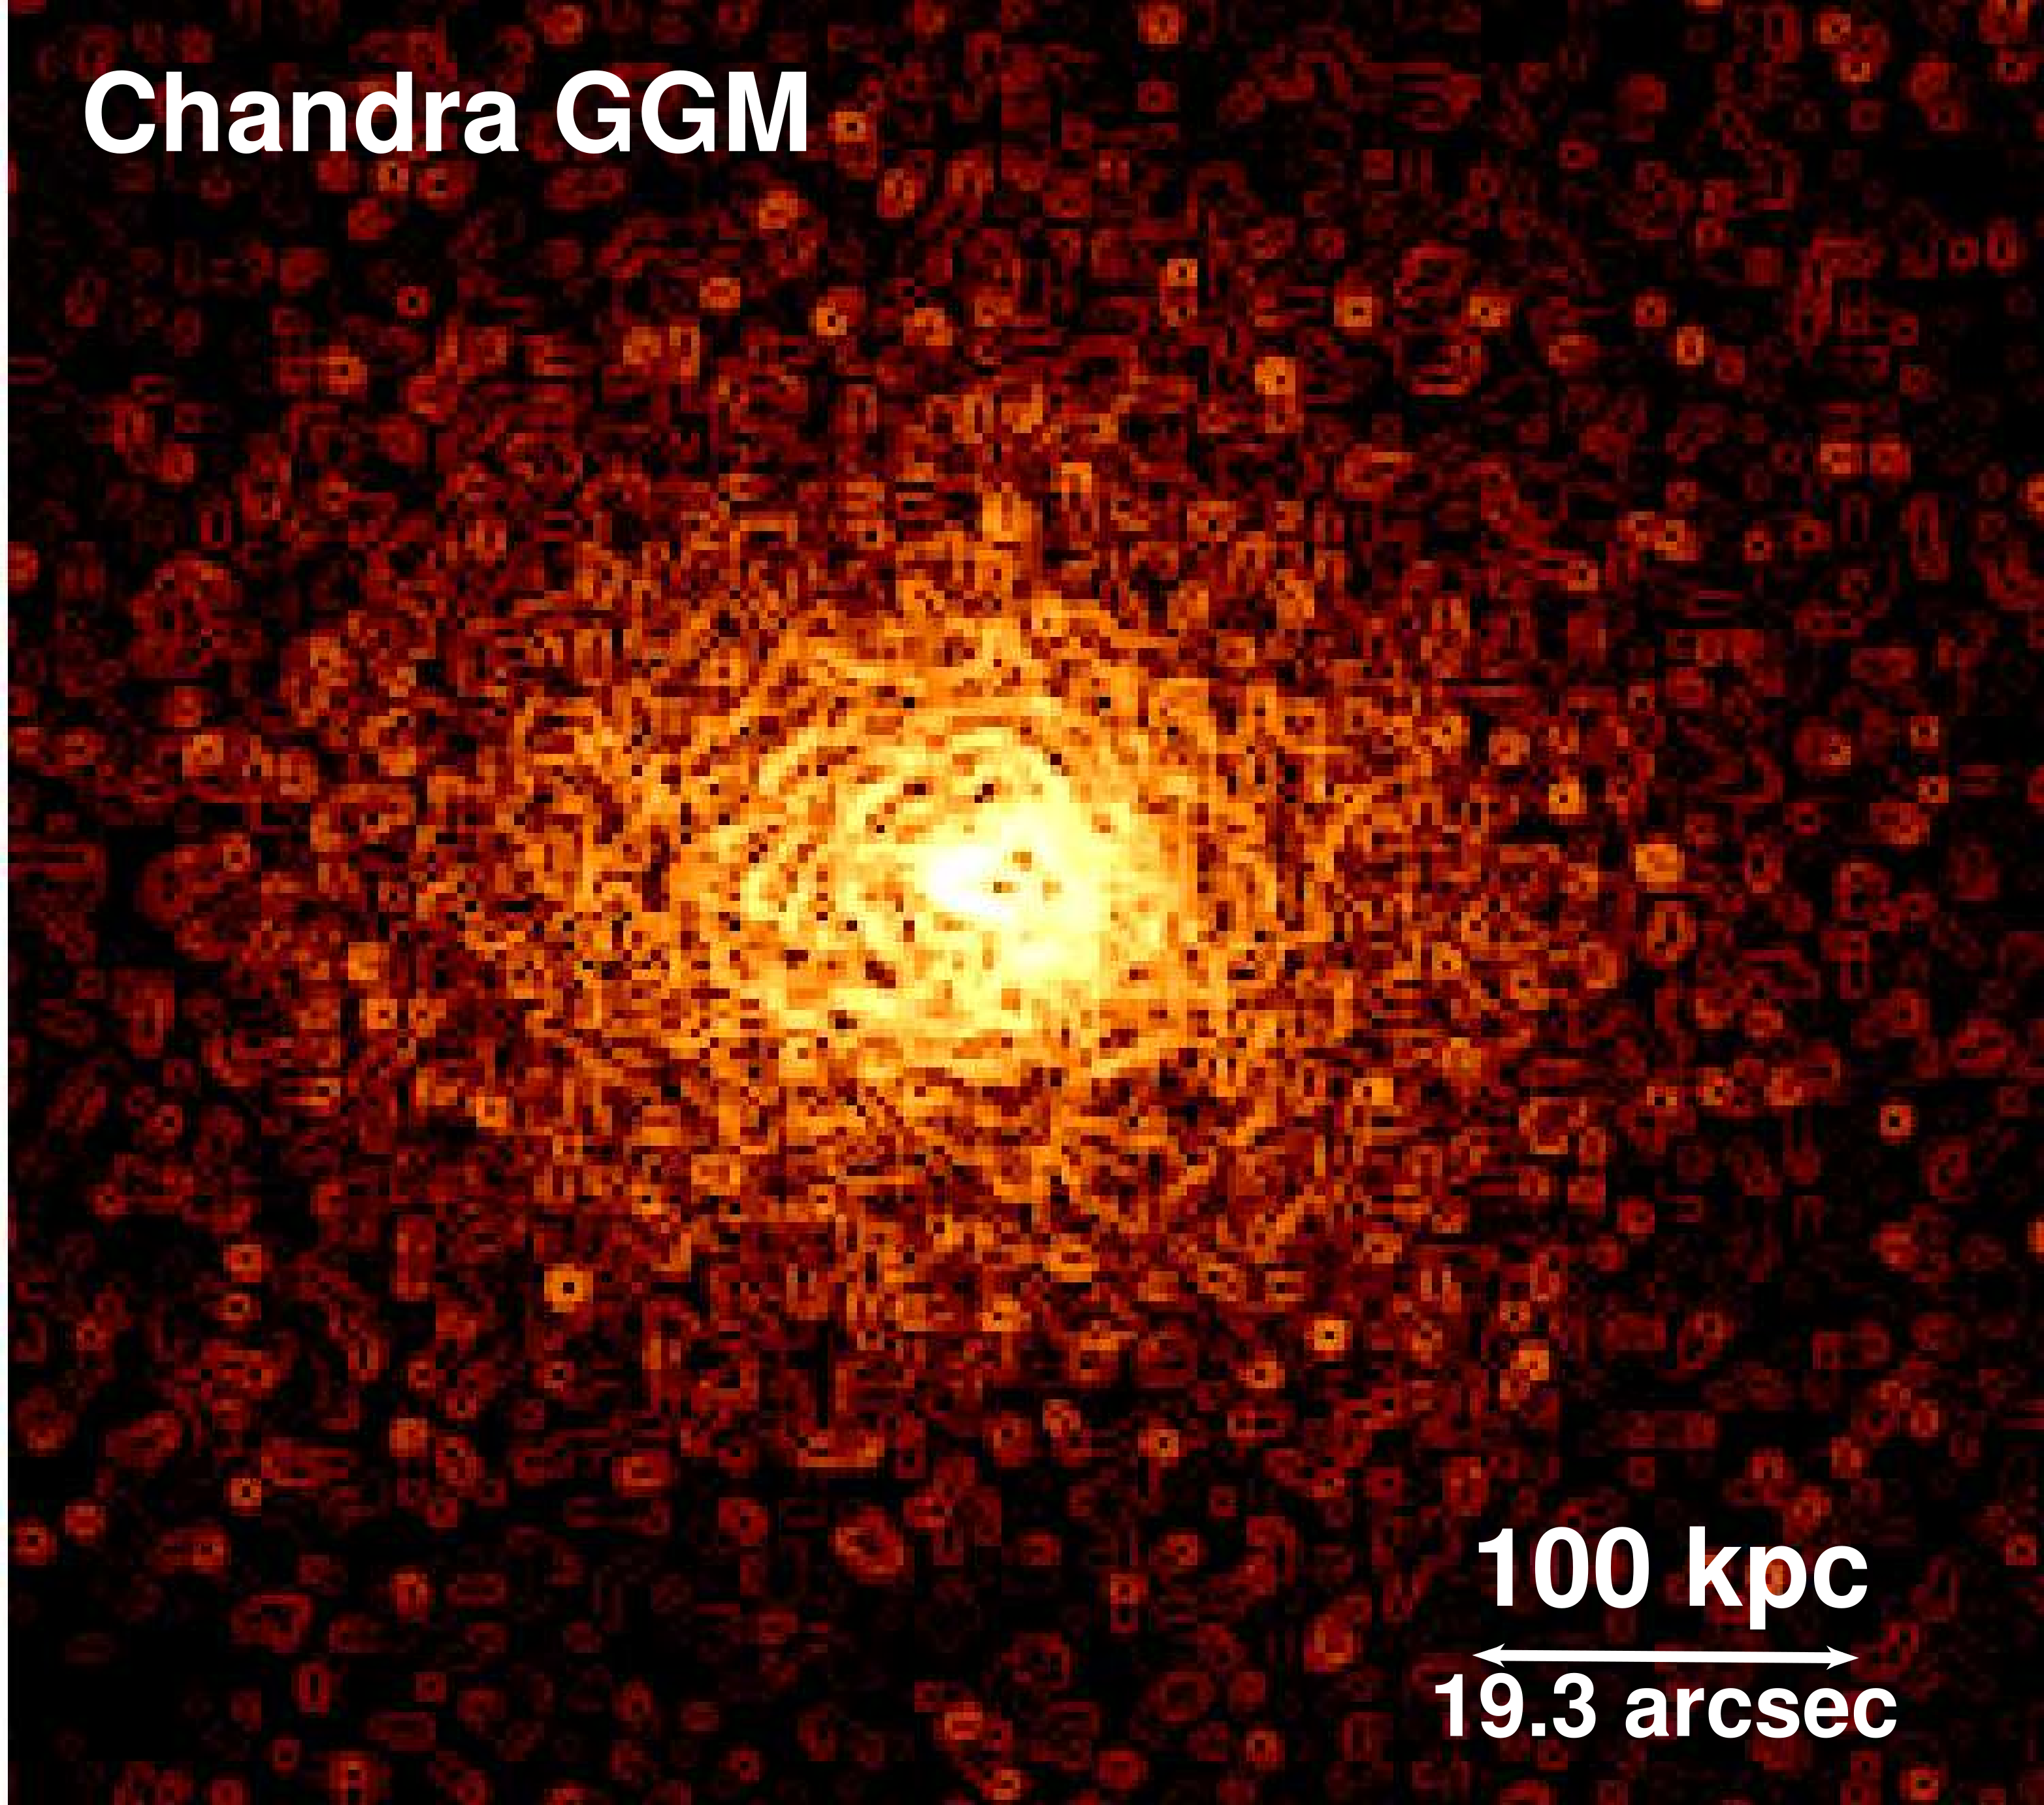
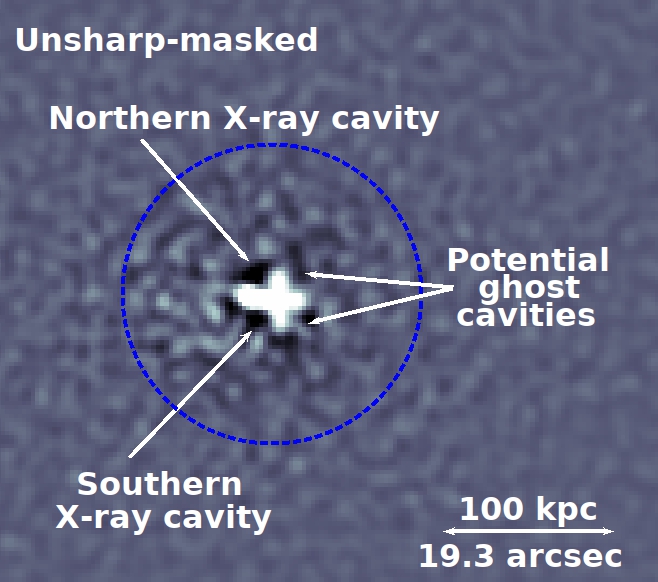
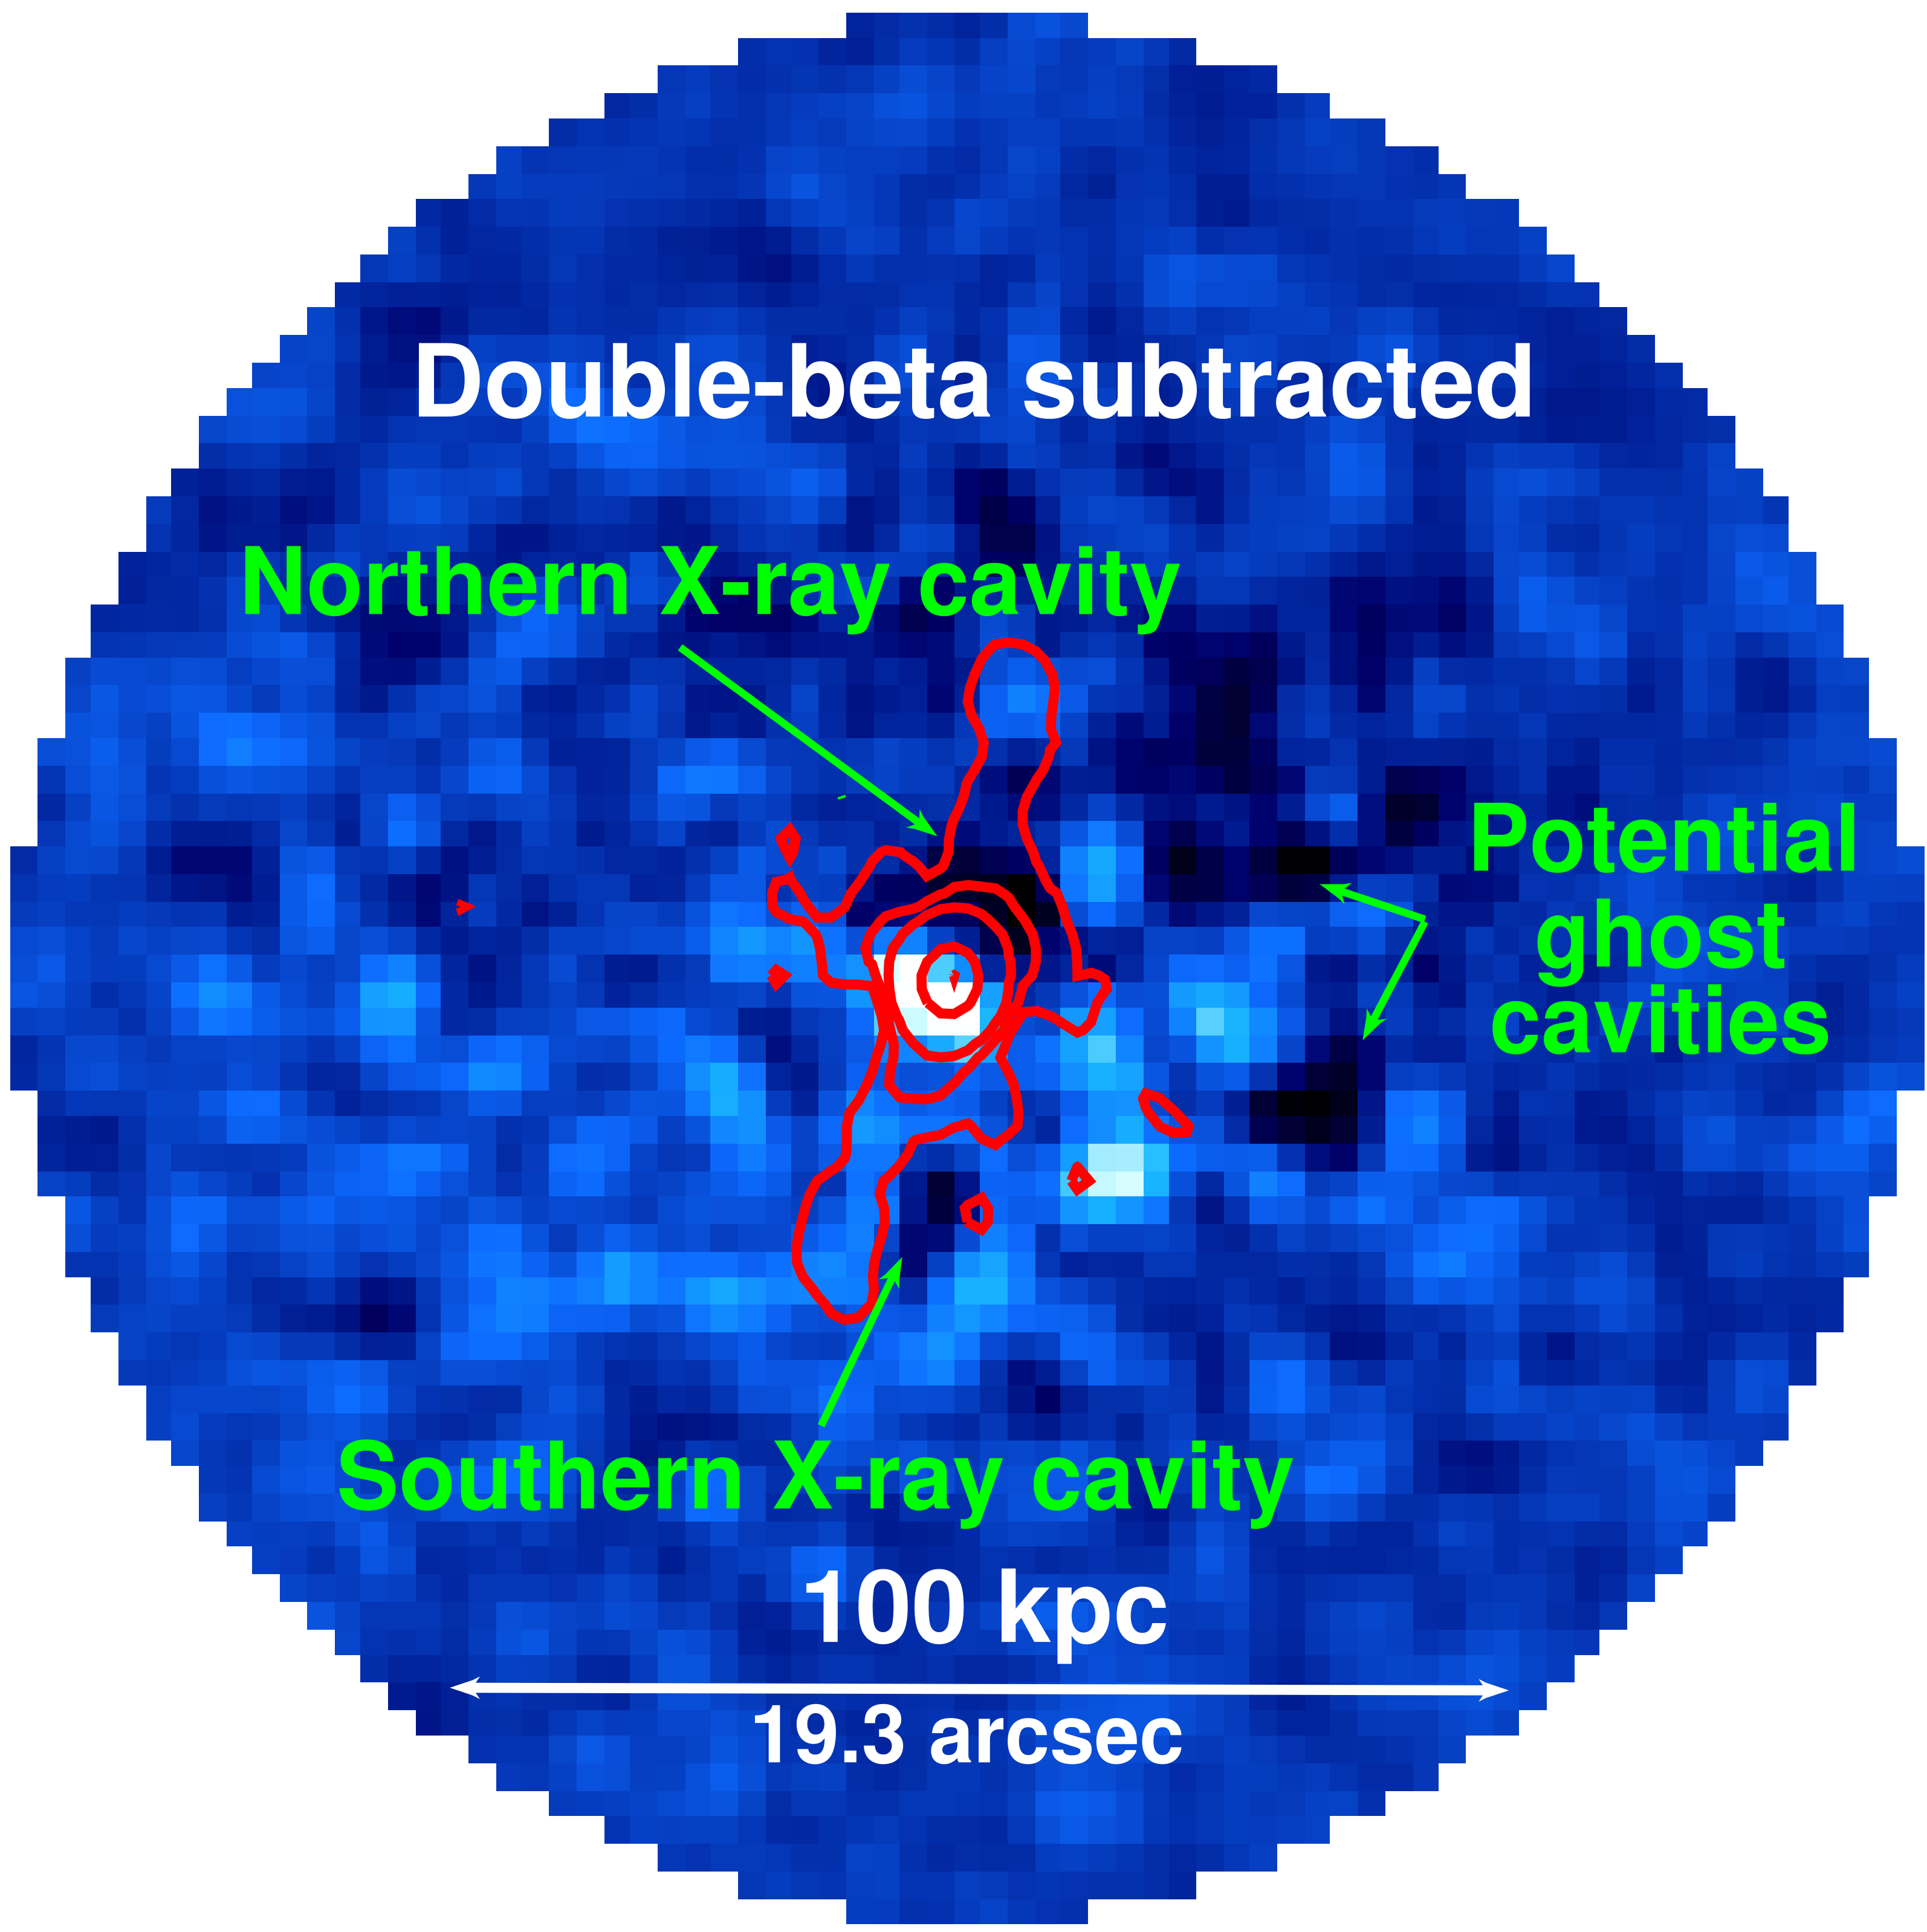
To create the model, we initially divided a circular region of 100 kpc from the center in 15 equal sectors, and each section was separated in 40 radial ranges. We then extracted the surface brightness of the radial ranges from each sector with the tool dmextract from CIAO. The double- model was fitted to those regions, which produced a brightness profile for every sector. The model was created by assembling the 15 sectors by smoothing over the sharp discontinuities at the edges of the sectors using fgauss. Finally, we subtracted the model image from the original image. We present the results in the right panel of Fig. 5, in which we added the contours of the JVLA A-configuration observations. Note that we varied the parameters (number of regions, coordinates of the center and the number of regions per sector) and obtained results consistent with the unsharp-masked image in the previous sub-section. Fig. 5 reveals northern and southern potential cavities, but also two potential ghost cavities, consisting of cavities that have been dragging out of the AGN’s area to larger radii. To test the presence of the northern and southern cavities, we fitted the double- model along four regions and obtained surface brightness profiles in Fig. 6.The northern cavity is detected at 2 and the southern, at 1.7. These detections are statistically weak compare to others clusters (an X-ray cavity surface brightness is normally 20% below the ICM’s), but we can still confirm the presence of two X-ray cavities due to the presence of the relativistic outflows. We further discuss this interesting feature in Section 7.2.
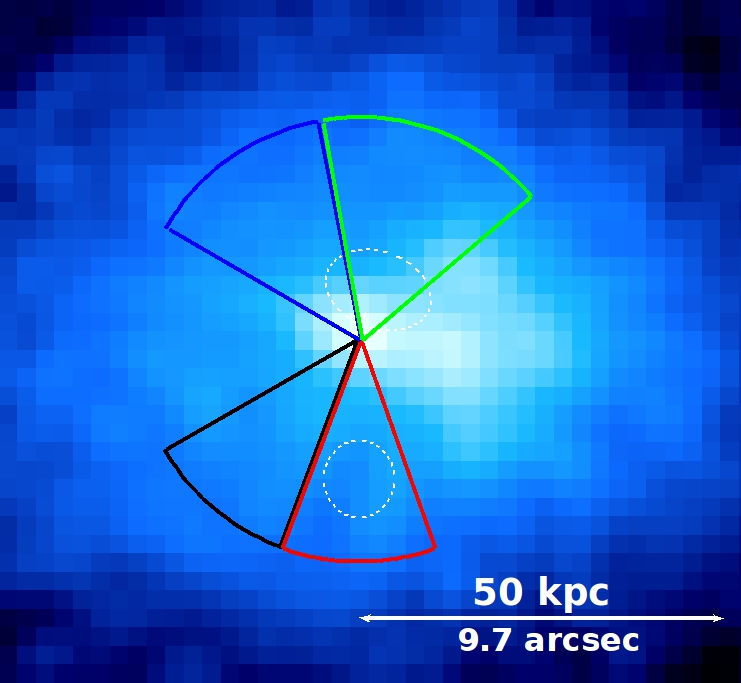
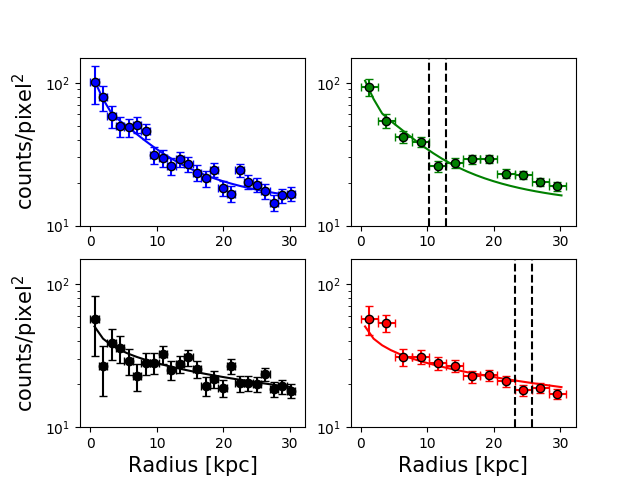
We note that the 1.4 GHz JVLA emission matches the position of the northern potential cavity, but does not match exactly the southern cavity. Located further away from the AGN, ghost cavities are filled with radio emission with steeper spectrum as their relativistic electrons content got older and are therefore less bright at 1.4 GHz than the inner cavities. They are also more difficult to see in the X-rays due to the decreasing brightness as a function of the radius. The X-ray energetics of the cavities will be presented in Section 6.3 and we further discuss the presence of the potential ghost cavities in Section 7.3.
4 X-ray spectral analysis of the cluster
The following sections present the thermodynamic profiles and maps of the cluster.
4.1 Thermodynamic profiles
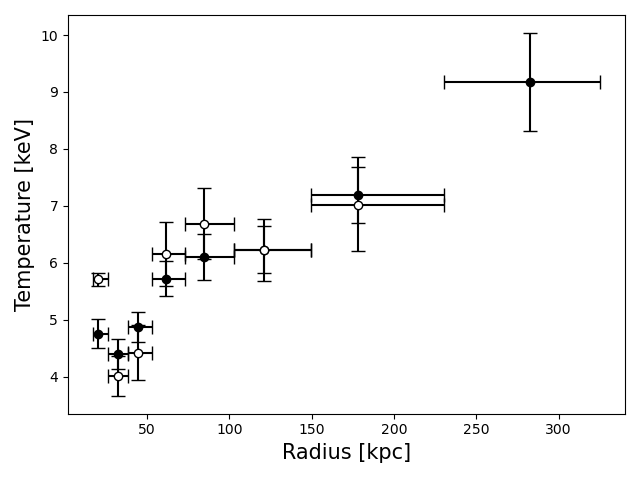
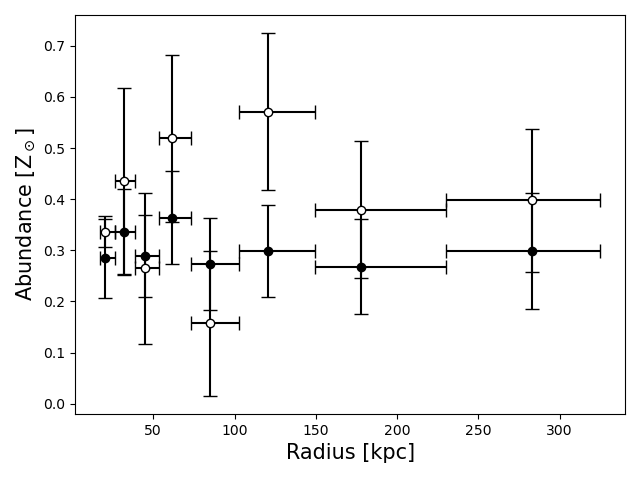
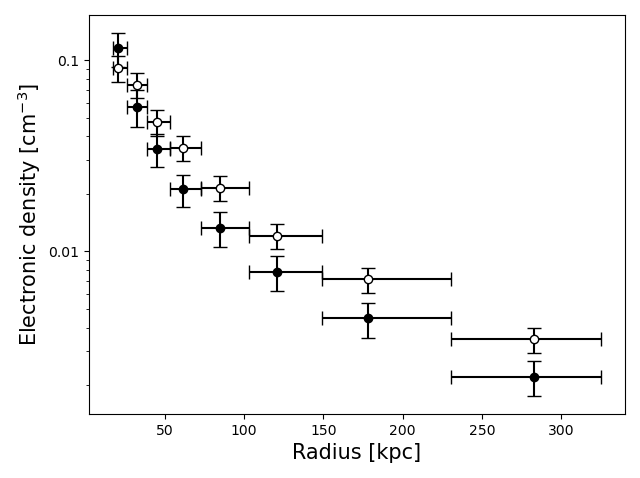
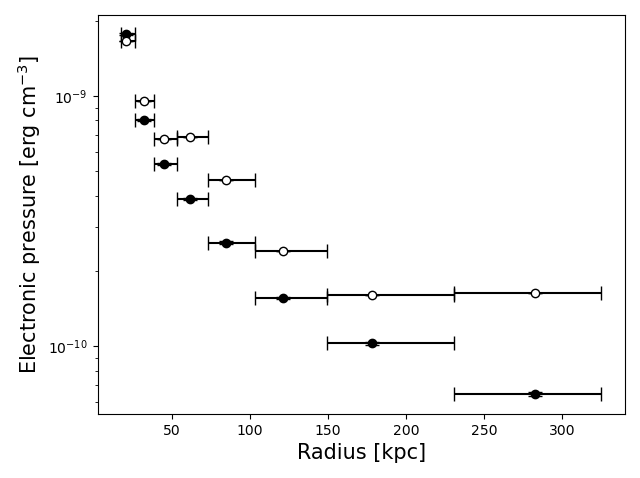
To compute the thermodynamic profiles, we selected nine elliptical regions of 6000 counts with a signal-to-noise ratio of 75 centered on the central AGN from the background-subtracted image. To determine the ellipticity () of these regions, we manually traced elliptical regions on the X-ray image on 10 contours smoothed with a 10 gaussian function. These regions encompass all the X-ray emission up to a distance of 750 kpc from the center and the ellipticity was defined as the average ( = 0.26) with a position angle consistent with 0∘. Afterwards, thermodynamics quantities were extracted with XSPEC and fitted with an apec and phabs models. The spectra were then deprojected with the tool DSDEPROJ (Sanders & Fabian, 2007) – a tool that deprojects the spectra onto 3D ellipsoidal shells 222Details of the code can be found here: https://www-xray.ast.cam.ac.uk/papers/dsdeproj/. Note that we varied the number of counts in each region between 3000 and 8000 and obtained similar fits. The projected and deprojected temperature, electron density, electron pressure and abundance profiles are presented in Fig. 7. We note that the temperature is higher near the center, which is in agreement with the presence of an AGN. The sudden temperature increase at 50 kpc and 300 kpc can be explained by cold fronts.
Using the deprojected temperature and density profiles, we calculated the core entropy , based on the following equation:
| (2) |
Here, is the gas temperature and is the electron density. To calculate , we used the deprojected central density of Fig. 7. The temperature is however strongly influenced by the AGN, so we extrapolated it using the relation , where is the radius and b 0.3 (Voigt & Fabian, 2004). We obtained a core entropy of = (12 2) keV cm2. According to Cavagnolo et al. (2008), this result is another confirmation that MACS J1447.4+0827 is a very strong cool core cluster, with well under 30 keV cm2, the threshold for cool core clusters.
Similar as the steps described in this section, we extracted the X-ray luminosity of the 9 regions using XSPEC in order to compute the cooling time profile. The model clumin – that calculates X-ray luminosity between 0.01 and 50 keV – was used and the data were deprojected using projct. The luminosity between 0.1 and 2.4 keV was also calculated (see Table 3 for the values). The cooling time arises from the following equation:
we
| (3) |
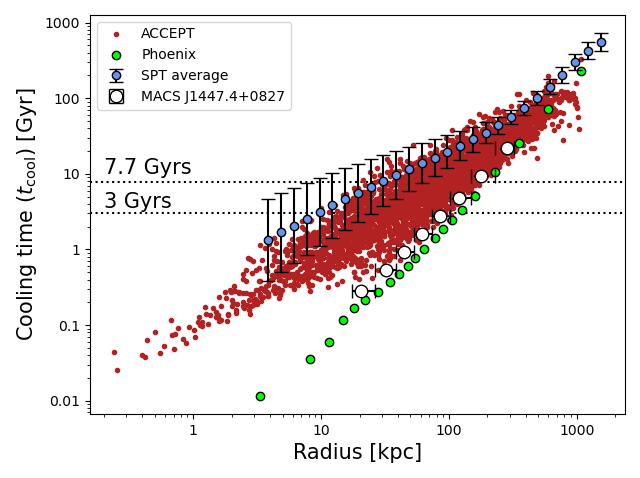
where is the electronic density, is the gas temperature, is the gas volume contained within an annulus and is the gas X-ray luminosity. We define the cooling radius () as the radius for which the cooling time is equal to the look-back time ( Gyrs; represented by a dashed green horizontal line in Fig. 8), same as Rafferty et al. (2006). We define the cooling luminosity () as the X-ray luminosity contained within between 0.1 and 2.4 keV. We extracted the X-ray luminosity within an ellipsoid with a semi-major axis of and an ellipticity of . This gives us kpc and erg s-1 (see Table 3). We further analyze the implications of those results in Section 7.2.
In Fig. 8, we present the cooling time profile of 91 cool core clusters from the ACCEPT sample and of the Phoenix cluster (McDonald et al., 2019), in which we overplotted MACS J1447.4+0827 and the average profile for the SPT clusters (Sanders et al., 2018). Note that we kept the ACCEPT results, although they might not be accurate (e.g. Panagoulia et al. 2014), since they are frequently used in the literature and are here used as background purpose only. We come to the conclusion that MACS J1447.4+0827 is one of strongest cool core clusters known. The central point is influenced by the central AGN.
Furthermore, we added the model mkcflow based on Mushotzky & Szymkowiak (1988) to calculate the mass deposition rate () within the cooling radius . We set the minimal temperature to 0.1 keV and the maximal temperature and abundance to the apec parameters. We obtained a 3 upper limit (see Table 3).
| Values | |
|---|---|
| (5.31 0.02) 1045 erg s-1 | |
| (1.24 0.01) 1045 erg s-1 | |
| 133 kpc | |
| (1.71 0.01) 1045 erg s-1 | |
| 96 M⊙ yr-1 |
4.2 Thermodynamic maps
In order to investigate the temperature and metal abundance distribution across the cluster, we generated thermodynamic maps using a technique mimicking that of Kirkpatrick & McNamara (2015). We first used a weighted Voronoi tessellation (WVT) algorithm (Cappellari & Copin, 2003; Diehl & Statler, 2006) to bin the 0.5 – 7 keV background-subtracted merged X-ray image. The WVT algorithm bins the image into similar signal-to-noise regions by first applying a bin accretion algorithm to the pixels in the image. The bin accretion map is then used as an initial guess for the true WVT algorithm which minimizes a predetermined scale length in order to more accurately group the pixels. The final result is a geometrically unbiased image of binned structures meeting a minimal signal-to-noise requirement. This technique has been implemented in python v3.6 by us and can be found at https://github.com/crhea93/AstronomyTools under the Weighted Voronoi Tessellations repository.
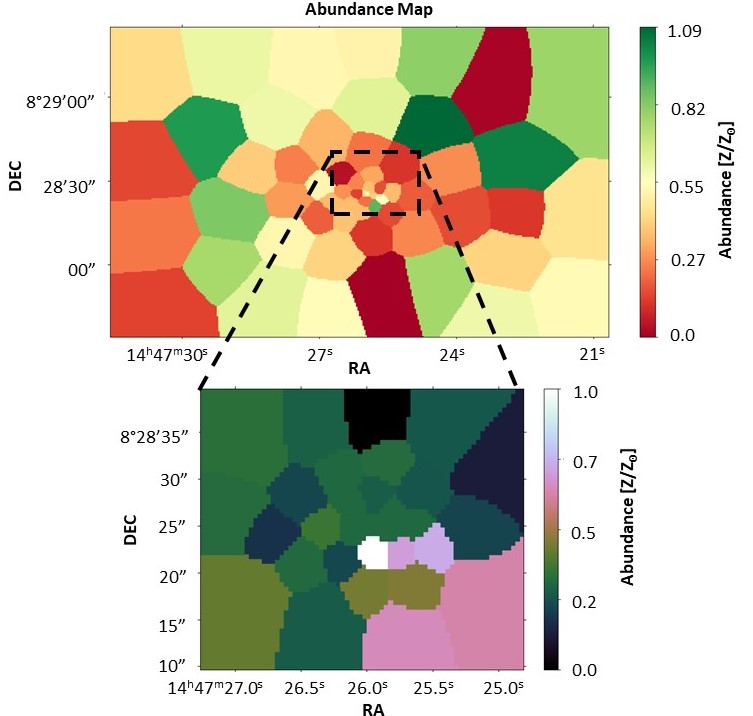
With our pixel-binning scheme determined by the WVT algorithm, we must, for each individual observation, extract a spectrum corresponding to each bin. Once extracted for each bin, we simultaneously fit the three observations using XSPEC v12.10.1, Sherpa v1, and python v3.5. Python provided the main wrapping language, Sherpa enabled the use of well-developed fitting algorithms, and XSPEC supplied the requisite astrophysical models: phabs and apec. Constraining the redshift and column density, , to the previously mentioned values in Section 2, we allow the temperature, metal abundance and normalization to be free. We employ the c-statistic determined by Sherpa in addition to the Nelder-Mead optimization algorithm. The entire temperature and abundance fitting algorithm can be found in its generalized form at https://github.com/crhea93/AstronomyTools under the Temperature Map Pipeline repository.
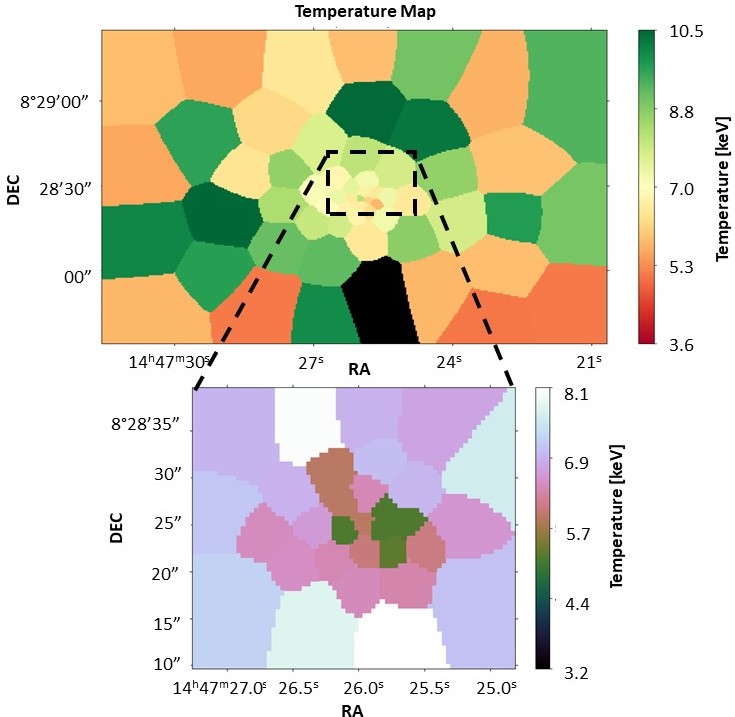
The large-scale (signal-to-noise ratio of 50) and small-scale (signal-to-noise ratio of 40) temperature and abundance maps are presented in Fig. 9. We note that the temperature drops abruptly at the center by a factor of 3, which is consistent with a cool core. Those maps are also coherent with the thermodynamic profiles presented in Fig. 7: we observe the same drop in temperature at the center and a similar abundance distribution.
4.3 Characterization of the plume-like structure
As shown in the middle panel of Fig. 2, the soft X-ray image reveals an extension of soft X-ray emission offset from the central AGN. It consists of a 2.8 plume-like structure centered at RA = and DEC = that encompasses some of the optical filaments of the HST image. We extracted the abundance and temperature of the plume using phabs and apec. We obtained Tplume = (4.8 0.2) keV and Zplume = (0.33 0.06) Z⊙. We also extracted a region surrounding the plume and obtained Tenv = (5.8 0.2) keV and Zenv = (0.30 0.04) Z⊙. We note that the plume is statistically colder than the surrounding medium. The colder region of the temperature map in Fig. 9 also corresponds with the plume-like structure.
A more detailed description of the plume-like structure and its implications will be discussed in the Section 7.3.
5 Radio analysis of the cluster
In Fig. 3, the JVLA A-configuration observations (left panel) reveal south-north oriented jetted outflows, where each lobe extends to 32 kpc in length, while B- and C-configuration observations (middle and right panels) reveal a diffuse radio structure extending to 160 kpc in size. In the following sections, we analyze these structures.
5.1 Characterization of the relativistic jetted outflows
We extracted the flux of the central radio AGN and its jetted outflows, using the 4 contours of the A-configuration observations and CASA. We extracted the flux using the tool imstat and estimated the error following Cassano et al. (2013):
| (4) |
where is the flux, is the percentage of the flux outside of the extraction region, rms is the image noise, is the number of beams in the region and is the flux of point sources in the region. Here, we used (all the flux is contained in the extracted region), rms = 0.011 mJy/beam and (there are no point sources).
The radio power can be calculated using the following equation:
| (5) |
where is the luminosity distance and is the spectral index, that characterizes the dependence of the spectra energy density in such a way that . Assuming for jets, we obtained = (20.4 0.1) 1024 W Hz-1. We compare this result with the X-ray results in Section 7.2.
5.2 Characterization of the mini-halo
A radio mini-halo is a faint radio emission that has a characteristic size of 50 to 300 kpc found at the center of cool core clusters. Richard-Laferrière et al. (submitted) already presented an initial analysis of the radio mini-halo of MACS J1447.4+0827, but here, we focus on characterizing its radio properties compared to the X-ray properties of the cluster.
The size and the flux of the mini-halo was calculated using the 4 contours of the C-configuration observations, since it contains 99 of the mini-halo’s flux. The size can be found in Table 4. The tool imstat in CASA was used to extract the flux and we used (since 99% of the mini-halo’s flux is inside of the extraction region), rms = 0.015 mJy/beam and (there are no point sources) to estimate the error on the flux. However, the C-configuration contains the mini-halo’s flux, but also the AGN’s and its jets: we thus obtained the mini-halo’s flux by subtracting the A-configuration flux () from the C-configuration flux () (see Table 4 for the values).
The mini-halo spectral index map of the configuration C at 1.4 GHz was calculated using the tool clean: it uses parameters that can model the frequency dependence across the bandwidth using the two first terms of the Taylor’s series. The spectral map was obtained by dividing the image associated to the second term (image tt1) by the image associated to the first term (image tt0; total intensity of the 1.4 GHz image). Note that we only considered pixels detected at greater than 4. Taking the maximum value of an histogram of the spectral indexes of the map within a radius of , we find 1.2 for the mini-halo. The power of the mini-halo was calculated with the eq. 5 from the previous section and we obtained 1024 W Hz-1. We further discuss these results in Section 7.4.
Table 4 presents a summary of the radio properties of MACS J1447.4+0827.
| Values | |
|---|---|
| 32 kpc | |
| 160 kpc | |
| (39.4 0.2) mJy | |
| (5.7 0.5) mJy | |
| 1.2 | |
| (19.1 0.1) 1024 W Hz-1 | |
| (3.0 0.3) 1024 W Hz-1 |
6 The central AGN
6.1 Radiative properties of the central AGN
Using the Chandra 3 – 8 keV image, we found evidence of a central point source whose position coincides with the brightest pixels of the HST image (RA = , DEC = ) in the BCG: this emission is characteristic of an AGN. Taking a circular region with a radius of 1 around the X-ray brightest pixel in the hard 3 – 8 keV image, we compared the total number of counts to the 3 upper limit of the surrounding background. We defined the surrounding background as an annular region of 3 of inner radius and of 5 of outer radius. We calculated the number of counts, added 3 and scaled it to the number of counts expected for a small region of radius 1. The total number of counts of the 1 region is above the 3 upperlimit of the surrounding background, so the presence of an AGN is photometrically confirmed.
We furthermore calculated the hardness ratio defined as , where is the number of counts in the hard X-rays and is the number of counts in the soft X-rays for a common region (Wang et al., 2004; Jin et al., 2006; Klesman & Sarajedini, 2012). Taking the 0.5 – 2 keV and 2 – 8 keV images, we obtained a hardness ratio of = -0.25 0.04 for the 1 central region and a hardness ratio of -0.38 0.01 for the 3 5 surrounding background. We note that the hardness ratio of the central region is 3 above the surrounding background. We therefore confirm the presence of an X-ray detected AGN in the BCG of MACS J1447.4+0827. We calculated the AGN’s luminosity by first fitting the spectra of an annular 3 – 5 region to phabs*apec. We then extrapoled the temperature to the central 1 region using the relation (b 0.3; Voigt & Fabian 2004) and fitted a model phabs*(powerlaw+apec) to the region within r = 1. Note that we fixed the abundance of the thermal gas and we fixed the photon index to = 1.9. We obtained an unabsorbed X-ray luminosity of = 2.1 0.2 erg s-1 between 2 – 10 keV. We discuss the results in Section 7.5.
6.2 Radio spectral energy distribution
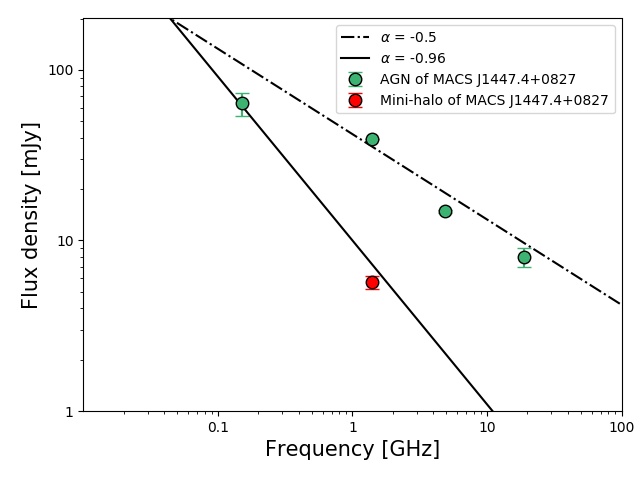
In Fig. 10, we computed the spectral energy distribution (SED) of the cluster using the radio flux density measurements for the BCG in MACS J1447.4+0827 from our own analysis (see Section 5.1) and from a private communication with Alastair C. Edge. We also plotted the mini-halo’s flux (see Table 4). Hogan et al. (2015) found out that the radio SED can be decomposed into two major components: an active, typically flat spectrum component attributed to the AGN activity ( 0.5), and a steeper component that includes all of the others emissions (). We therefore plotted a line for for the 3 points on the right and a line for (average steeper spectrum emission) for the point on the left. The claimed mini-halo’s flux in Table 4 is consistent with the TGSS point. In fact, at low frequency, we see the past emission (or the jets). According to the flux equation, when the frequency decreases, the flux increases for old synchrotron emission. Consequently, the signal from the TGSS point comes from the past emission and not from the core. Also, MWA GLEAM upper limits are consistent with the line, but data from MWA or LOFAR could allow us to go deeper.
6.3 Power of the X-ray cavities
| Cavity | |||||||
|---|---|---|---|---|---|---|---|
| [kpc] | [kpc] | [kpc] | [107 yrs] | [1044 erg s-1] | [1044 erg s-1] | [1044 erg s-1] | |
| Northern | [3.5; 4.2] | [5.0; 18.1] | 9.0 | 0.9 0.1 | 2.5 0.4 | 6.3 1.1 | = [2.9 0.4; 8.4 1.1] |
| Southern | [3.2; 3.9] | [4.1; 14.7] | 21.9 | 2.7 0.2 | 0.40 0.05 | 2.1 0.3 | = 5.7 0.5 |
Here, we characterize the two X-ray cavities found in Fig. 5 that coincide with the jetted outflows detected at radio wavelengths. If we assume that the cavities are in pressure equilibrium with the surrounding medium (e.g. Birzan et al. 2004), we can estimate the total energy contained in them with the following equation:
| (6) |
where is the heat capacity ratio, the thermal pressure and the volume of the cavity. For a relativistic fluid, (Nulsen & McNamara, 2013) and therefore .
We can approximate the volume of the cavity as assuming that they are ellipsoids. and are respectively defined as the projected semi-major axis perpendicular and parallel to the radio jet axis and have been measured directly based on Fig. 5. Note that we assign a 20 per cent uncertainty to and given the limited resolution of the X-ray data and because they are not deep enough to detect more clearly the cavities.
There are three different methods for computing the time scale associated with cavities: the buoyant rise time (Churazov et al., 2001), the refill time (McNamara et al., 2000) and the sound crossing time defined as:
| (7) |
7 Discussion
7.1 The strongest cool core clusters
We have conducted an X-ray (Chandra), radio (JVLA) and optical (HST) analysis of the massive cluster MACS J1447.4+0827. It is a strong cool core and X-ray luminous cluster. Its total mass, within a radius where the mean density is equal to 500 times the critical density at = 0.3755, is estimated to be 7.46) 1014 M⊙ (Planck Collaboration et al., 2015).
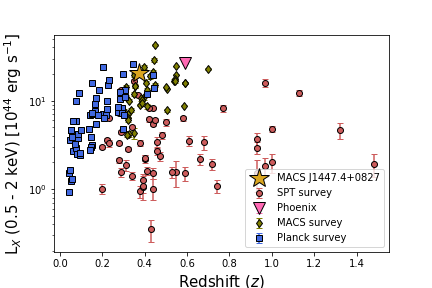
In Fig. 11, we compare the 0.1 – 2.4 keV X-ray luminosity of MACS J1447.4+0827 to other known clusters of galaxies with similar redshifts. This plot includes clusters from the MAssive Cluster Survey (MACS; Ebeling et al. 2007, 2010), the South Pole Telescope survey (Bulbul et al., 2019) and the Planck survey (Planck Collaboration et al., 2011). MACS J1447.4+0827 is one of the most X-ray luminous clusters known in the literature.
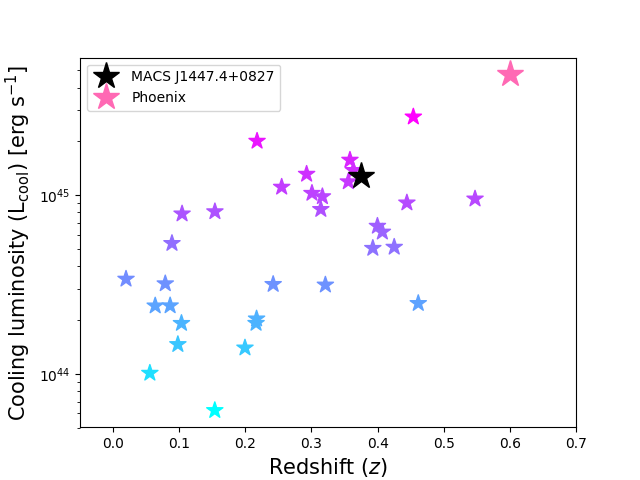
Furthermore, in Fig. 12, we compare MACS J1447.4+0827 to other strong cool core clusters. Here, we plot the cooling luminosity of several known cool core clusters as a function of redshift. Most of these data were taken from Hlavacek-Larrondo et al. (2013a). While Fig. 12 is not complete, we note that MACS J1447.4+0827 is one of the strongest cool core clusters around .
Several authors have also noted that strong cool core clusters often host a prominent abundance peak that coincides with the cool core (e.g. Ghizzardi et al. 2010; De Grandi et al. 2014). Such peaks are thought to originate from metals being created by stellar processes in the central galaxy and have even been observed in high-redshift clusters (e.g. WARPS J1415.1+3612, De Grandi et al. 2014). However, as we can see on the up-right panel of Fig. 7, the abundance profile of MACS J1447.4+0827 does not have a pronounced peak. The abundance profile shown in Fig. 7 further shows that the metallicity varies substantially region to region. This could be explained by recent sloshing motions that disturb the metal distribution close to the BCG. In fact, when the gas sloshes back and forth in the gravitational potential, it creates temperature and abundance discontinuities (e.g. Simionescu et al. 2010). In Abell 3526 ( = 0.01140), Sanders et al. (2016) showed that the sloshing motion can distort and induce asymmetries in the metal distribution across the BCG. Although MACS J1447.4+0827 has a much higher redshift than Abell 3526, we also observed a non-uniform metal distribution in the abundance profile in Fig. 7. The metal distribution may trace the history of the gas motions and provide relevant information about the sloshing mechanisms (e.g. Simionescu et al. 2010).
7.2 Relativistic outflows and X-ray cavities
In Hlavacek-Larrondo et al. (2012a), the authors analyzed Chandra X-ray observations of 76 MACS clusters and found that 20 showed evidence of X-ray cavities. MACS J1447.4+0827 was found to host one potential X-ray cavity, although with the limited X-ray observations at the time ( ks), the authors were not able to study the properties of the cavity in detail.
Here, using new deep Chandra observations, as well as new JVLA observations, we find clear evidence of two collimated jetted outflows, one of which coincides with the X-ray cavity detected by Hlavacek-Larrondo et al. (2012a). The two X-ray cavities are located symmetrically to the north and south of the central galaxy. They both have a radius of kpc, although they have an elliptical and not circular morphology. Interestingly, the jetted outflows are clearly detected at radio wavelength, but they are only detected at a 2 level compared to the surrounding X-ray background, which is not the case for other known cavities at similar redshifts.
In Kolokythas et al. (2018), the authors compared the X-ray cavity power to the radio power of the central AGN at 235 MHz and found that the two quantities are correlated to each other. In MACS J1447.4+0827, we found that erg s-1 and = (20.4 0.1) 1024 W Hz-1. By converting our radio power at 1.4 GHz to 235 MHz assuming , we find that MACS J1447.4+0827 falls directly on the relations found by Birzan et al. (2008) and O’Sullivan et al. (2011) (see Fig. 7 of Kolokythas et al. (2018)), implying that the radio powers and X-ray cavity powers in this cluster are consistent with those detected in other systems.
In Fig. 13, we compare the total mechanical power of X-ray cavities to the cooling luminosity of various samples of clusters. Here, the figure has been adapted from Hlavacek-Larrondo et al. (2015) and the data taken from Rafferty et al. (2006), Dunn & Fabian (2008), Nulsen et al. (2009) and Hlavacek-Larrondo et al. (2012b, 2015).
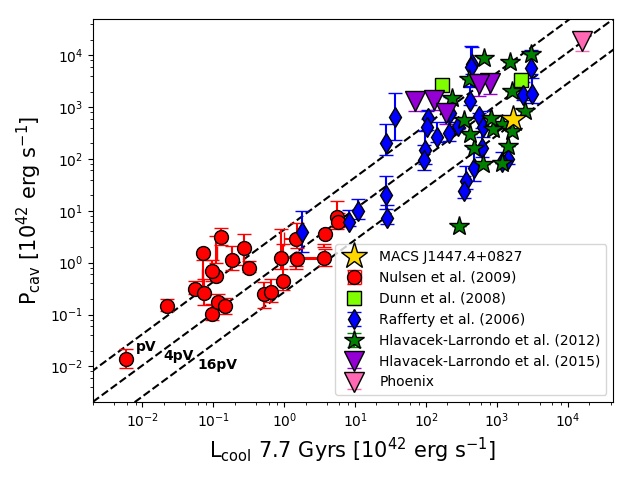
The total mechanical power of the X-ray cavities in MACS J1447.4+0827 seems to be lower than the cooling luminosity by a factor of 8. As we see on the Fig. 13, MACS J1447.4+0827 appears to be closer to the = line than the = line. This could mean that MACS J1447.4+0827 is in a phase of lower AGN power: depending on the different cycles of AGN feedback, the power of the X-ray cavities can vary, although on average the power is sufficient to suppress cooling of the hot atmosphere. However, considering the (large) uncertainties in X-ray cavity powers, the scatter in Fig. 13 and the fact that MACS J1447.4+0827 falls within this scatter, AGN feedback can easily be strong enough to offset cooling in this cluster. AGN feedback therefore seems to be, at the very least, present in the strongest cool core clusters at = 0.3 and may still provide a viable solution to the cooling flow problem even at these redshifts.
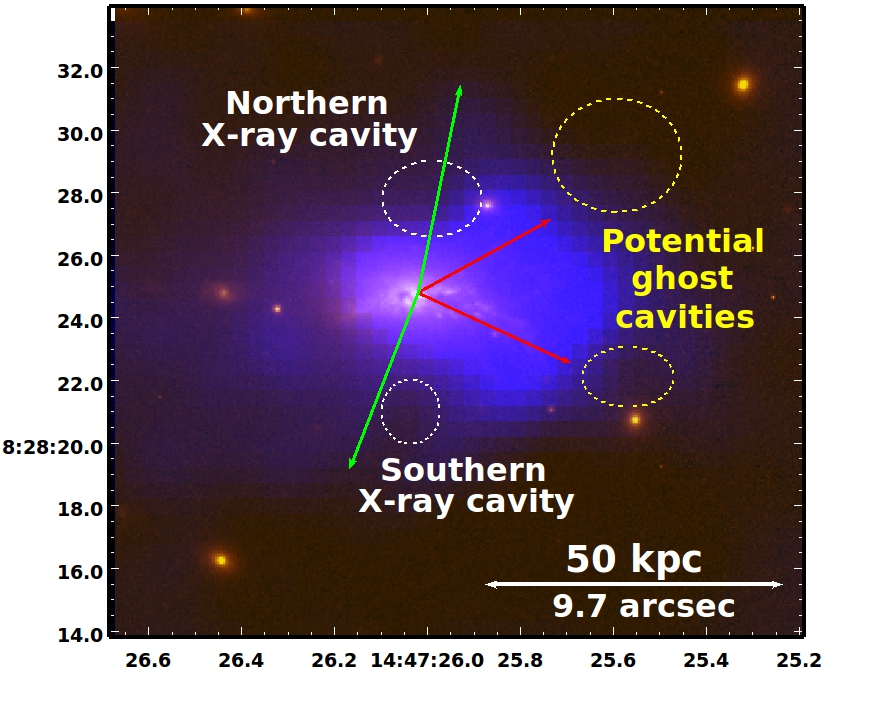
On the right panel of Fig. 5, we also note that the direction of the outflows matches the location of the northern cavity, but not exactly the southern cavity. To highlight this better, we present the combined HST F814W (red), F606W (green) and double- subtracted Chandra (blue) images of MACS J1447.4+0827 in Fig. 14, in which we indicated the direction of the radio outflows (green arrows) and prominent optical filaments (red arrows), as well as the approximate location of the X-ray cavities (white ellipses) and ghost cavities (yellow ellipses) as seen in the unsharp-masked and double- subtracted Chandra images. Note that the filaments and ghost cavities are discussed in the subsequent section. The shift between the south-oriented outflow and the southern cavity is interesting and may be explained by the dynamic nature of the cluster, although deeper observations are needed to better understand this scenario.
There are a number of lines of evidence for the presence of sloshing motions in MACS J1447.4+0827. The temperature profile (Fig. 7), the plume-like structure (Fig. 2), the optical filaments (Fig. 4) and the prominent ellipticity of the cluster all point to a past merger event. However, as we do not detect another X-ray peak, we suspect that it was a relatively minor merger event. This merger event and the sloshing it generates could therefore induce a shift between the cool core and the BCG (Hamer et al., 2012).
7.3 Optical filaments, ghost cavities and the plume
In Section 3, we introduced the possibility of the presence of ghost cavities, consisting of cavities that have been dragged out of the AGN’s area to larger radii. This type of cavity have been seen in other clusters at lower redshifts (e.g. Abell 2052, Blanton et al. 2009; Abell 2597, McNamara et al. 2001; Fornax, Su et al. 2017; Abell 1795, Walker et al. 2014; Perseus, Hitomi Collaboration et al. 2018), but also at higher redshifts (e.g. Pheonix, McDonald et al. 2015; RX J1532.9+3021, Hlavacek-Larrondo et al. 2013b).
In Fig. 14, we note that the prominent optical filaments of the cluster are oriented towards the potential ghost cavities. Optical filaments are thought to be created from thermally unstable ICM gas (e.g. McCourt et al. 2012; Sharma et al. 2012; Gaspari et al. 2013b; Li & Bryan 2014a, b) that originates, in part, from the pushing-back motions created by the formation of X-ray cavities (e.g. McNamara et al. 2016; Hogan et al. 2017; Prasad et al. 2017; Voit et al. 2017; Gaspari et al. 2018). Therefore, filaments could have been created in the wake of the cavities (e.g. Hlavacek-Larrondo et al. 2013b), and thus the observed optical filaments in MACS J1447.4+0827 could be created in the wake of the ghost cavities seen to the west. These X-ray cavities could have been pushed back by sloshing motions towards the western side of the cluster, implying that X-ray cavities do not just rise buoyantly, but that there are also constantly affected by the dynamics of the X-ray gas in the cluster. Due to the evidence of sloshing motions mentioned before, the bulk of the ICM may have moved to the west, which may have caused a shift between the jets and part of the southern X-ray cavity. Such dynamic motions of the cluster may also have shifted the position of the ghost cavities in the same direction.
In Section 4.3, we characterized the X-ray plume-like structure. We found out that the plume was colder than the environment. The origin of this type of structure is still unsure, but has been observed in many clusters (e.g. Abell 3526, Sanders & Fabian 2002; Crawford et al. 2005; Walker et al. 2015; RX J1532.9+3021, Hlavacek-Larrondo et al. 2013b; merging Abell 2146, Russell et al. 2012). The plume would come from the gas from the regions in the BCG: the gas would have been first driven out by the cavities, before falling back to the BCG (e.g. Walker et al. 2015). In their study of the optical filaments in NCG 1275, Fabian et al. (2011) proposed that the gas in the plume is excited by the ICM gas. While cooling, the hot gas from the ICM penetrates the optical cold filaments through the reconnection diffusion process which allows the hot gas to enter the cold gas despite the magnetic field that holds the filaments. By crossing it, the gas of the ICM transfers energy to the filaments and would allow its excitation.
7.4 Radio mini-halo
There are now over 30 radio mini-halos that have been discovered (see Giacintucci et al. 2019 and Richard-Laferrière et al. submitted). The mini-halo of MACS J1447.4+0827 was presented and analyzed in detail in Richard-Laferrière et al. (submitted). The mini-halo’s power was plotted as a function of the 0.01 – 50 keV X-ray luminosity and compared to other mini-halos in cool core clusters. It was found out that the mini-halo in MACS J1447.4+0827 follows this correlation but is one of the most radio powerful known to date.
The exact origin of mini-halos is still unknown. Like jetted outflows, their radiation is due to synchrotron emission by relativistic particles in the cluster’s magnetic field. However, the radiative lifetime of the particles is too short to spread over the observed mini-halo’s radius. This implies that the particles of mini-halos come from the re-acceleration of relativistic particles or are produced in-situ (van Weeren et al., 2019). For the latter, mini-halos could come from the proton-proton interaction between the cosmic rays and the ICM (Pfrommer & Enßlin, 2004; Fujita et al., 2007; Zandanel et al., 2014). For the former, it has been proposed that turbulence in the ICM could be the source of re-acceleration. It was suggested that this turbulence could either be caused by the dynamics of the jets (e.g. Bravi et al. 2016; Richard-Laferrière et al. submitted) or by sloshing motions of the ICM via minor mergers (Mazzotta & Giacintucci, 2008; ZuHone et al., 2013; Giacintucci et al., 2014). This kind of motion leaves traces: cold fronts, which are discontinuities of temperature and density that appear to bound the mini-halos (e.g. Markevitch et al. 2001; Mazzotta et al. 2001, 2003; Markevitch & Vikhlinin 2007; Owers et al. 2009; Ghizzardi et al. 2010).
In MACS J1447.4+0827, we find evidence of 2 cold fronts (see up-left panel of Fig. 7) located at a radius of 50 kpc and 300 kpc. The mini-halo in MACS J1447.4+0827 therefore appears to be bounded by the cold fronts, since 160 kpc. However, Richard-Laferrière et al. (submitted) recently found evidence that mini-halos are directly connected to the AGN feedback processes of the BCG. In this work, the power of the mini-halo was plotted as a function of the BCG steep radio power at 1 GHz, the BCG core radio power at 10 GHz and the total power of the X-ray cavities. In all cases, the mini-halo of MACS J1447.4+0827 agrees with the correlations, indicating that the mini-halo in this cluster could also be connected at a fundamental level with its feedback processes.
7.5 Power mechanisms in the central AGN
In order to further understand the feedback mechanisms occurring in the central AGN of MACS J1447.4+0827, we computed its Eddington luminosity, the black hole’s mean accretion rate and the Eddington rate.
The Eddington luminosity is defined as the limiting luminosity where the radiation pressure is in equilibrium with the local gravity of the accreting material. For a fully ionized plasma, the Eddington luminosity is given by the following equation:
| (8) |
where is the SMBH mass. Since there are no mass estimates of the black hole available in the literature, we assumed a mass of between 9 and 10 109 M⊙ for MACS J1447.4+0827, which is the typical mass expected for such a massive cluster and central galaxy.
The mean accretion rate scaled by the Eddington rate can be expressed as:
| (9) |
where is the bolometric luminosity. Here, we used a typical bolometric correction of 5 for low luminosity sources on the 2 – 10 keV X-ray luminosity of the central AGN (see Section 6.1 for the value), following in Russell et al. (2013).
Fig. 15 presents the cavity power (blue circles) and the radiative power (red triangles) scaled by the Eddington luminosity as a function of the required mean accretion rate scaled by the Eddington rate (). The open symbols indicates the upperlimits. The figure was adapted from Russell et al. (2013) (Fig. 12) and Churazov et al. (2005) (Fig. 1). We plotted the location of MACS J1447.4+0827 (see star symbols), similarly with the cavity power in blue and radiative power and red.
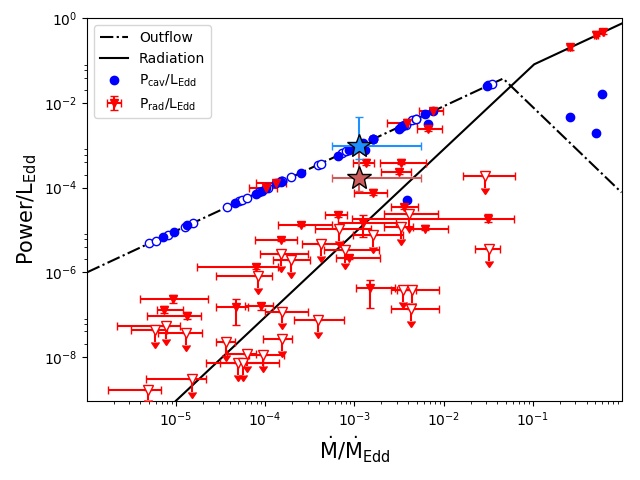
At low accretion rates, it is the jetted outflow mode that is dominant rather than the radiative (e.g. Churazov et al. 2005; Russell et al. 2013). Indeed, Fig. 15 shows that for 3 10-2, the outflow mode is dominating over the radiative mode. Since MACS J1447.4+0827 is not in the quasar phase, the outflow mode is dominating over the radiative mode by a factor of 10.
The radiative mode would act mainly in the young AGNs ( 1) when they are in the quasar stage and the accretion rate of the black hole is high (e.g. Churazov et al. 2005; Hopkins et al. 2006). We find that our object is perfectly consistent with the low-accretion mode, even though it is located at . We can therefore affirm that this feedback mode has been in place several Giga-years ago in MACS J1447.4+0827. It is also happening in many other clusters (e.g. Hlavacek-Larrondo et al. 2012b, 2015).
8 Summary and Conclusions
In this work, we have presented the first detailed and multiwavelength analysis of one of the strongest cool core cluster known, MACS J1447.4+0827 ( = 0.3755) using data from the Hubble Space Telescope, and new data from the Chandra X-ray Observatory and the Karl G. Janksy Very Large Array. Our relevant findings are summarized as follows:
-
•
MACS J1447.4+0827, with its 0.01 – 50 keV X-ray luminosity of = (5.31 0.02) 1045 erg s-1, is one of the most luminous clusters at 0.7.
-
•
We detected a northern and southern X-ray cavity as well as two potential ghost cavities. The A-configuration JVLA observations reveals south-north oriented jetted outflows extending to 32 kpc in length and coincident with the X-ray cavities. Their total mechanical power is erg s-1.
-
•
We calculated the cooling luminosity of erg s-1. This cooling luminosity indicates that MACS J1447.4+0827 is one of the strongest cool core clusters around 0.7. We found that the total mechanical power of the X-ray cavities was generally consistent with power required to offset the cooling of the ICM. MACS J1447.4+0827 might currently be going through a phase of lower activity, but not to the point to lead to a catastrophic cooling of the core.
-
•
The HST images reveal an elliptic BCG in the centre of MACS J1447.4+0827 as well as large H filaments whose directions match the location of the potential ghost cavities. Part of these filaments also match the position of a cool X-ray plume.
-
•
The B- and C-configuration JVLA observations reveal a diffuse radio structure extending to 160 kpc in size interpreted as a mini-halo. The total radio power is W Hz-1. It is one of the most powerful mini-halos found.
While this study clearly shows that powerful mechanical feedback is occurring in the strongest cool core clusters, new and/or deeper observations in other wavelengths such as submillimiter, infrared, optical and ultraviolet – with the Multi Unit Spectroscopic Explorer (MUSE) – could provide more information concerning the star formation rate, the quantity and location of molecular gas in the BCG and would allow to better understand the multiphase gas in extreme cool core clusters.
Acknowledgments
We wish to thank M. McDonald for sharing his data and for his help.
MPE is supported by NRSEC (Natural Sciences and Engineering Research Council of Canada) and by FRQNT (Fonds de recherche du Québec - Nature et technologies) through the Undergraduate Student Research Awards, and by IVADO (Institute for Data Valorization) through the Summer Internship and Undergraduate Research Fellowships. JHL is supported by NSERC through the Canada Research Chair programs and wish to acknowledge the support of an NSERC Discovery Grant and of the FRQNT. ARL is supported by NSERC through the NSERC Alexander-Graham-Bell Canada Graduate Scholarships-Master’s Program (CGS M) and by FRQNT through the FRQNT Graduate Studies Research Scholarship - M. Sc. level under grant #209839.
References
- Anders & Grevesse (1989) Anders, E., & Grevesse, N. 1989, Geochimica et Cosmochimica Acta, 53, 197
- Applegate et al. (2014) Applegate, D. E., von der Linden, A., Kelly, P. L., et al. 2014, MNRAS, 439, 48
- Applegate et al. (2016) Applegate, D. E., Mantz, A., Allen, S. W., et al. 2016, MNRAS, 457, 1522
- Birzan et al. (2008) Birzan, L., McNamara, B. R., Nulsen, P. E. J., Carilli, C. L., & Wise, M. W. 2008, ApJ, 709, 546
- Birzan et al. (2004) Birzan, L., Rafferty, D. A., McNamara, B. R., Wise, M. W., & Nulsen, P. E. J. 2004, ApJ, 607, 800
- Blanton et al. (2009) Blanton, E. L., Randall, S. W., Douglass, E. M., et al. 2009, ApJ Letters, 697, L95
- Bravi et al. (2016) Bravi, L., Gitti, M., & Brunetti, G. 2016, arXiv e-prints, arXiv:1603.00368
- Bulbul et al. (2019) Bulbul, E., Chiu, I.-N., Mohr, J. J., et al. 2019, ApJ, 871, 50
- Cappellari & Copin (2003) Cappellari, M., & Copin, Y. 2003, MNRAS, 342, 345
- Cassano et al. (2013) Cassano, R., Ettori, S., Brunetti, G., et al. 2013, ApJ, 777, 141
- Castillo-Morales & Schindler (2003) Castillo-Morales, A., & Schindler, S. 2003, arXiv:astro-ph/0303610, astro-ph/0303610
- Cavagnolo et al. (2008) Cavagnolo, K. W., Donahue, M., Voit, G. M., & Sun, M. 2008, ApJ, 683, L107
- Cavagnolo et al. (2010) Cavagnolo, K. W., McNamara, B. R., Nulsen, P. E. J., et al. 2010, ApJ, 720, 1066
- Cavaliere & Fusco-Femiano (1976) Cavaliere, A., & Fusco-Femiano, R. 1976, A & A, 49, 137
- Chirivì et al. (2018) Chirivì, G., Suyu, S. H., Grillo, C., et al. 2018, A & A, 614, A8
- Churazov et al. (2001) Churazov, E., Brüggen, M., Kaiser, C. R., Böhringer, H., & Forman, W. 2001, ApJ, 554, 261
- Churazov et al. (2005) Churazov, E., Sazonov, S., Sunyaev, R., et al. 2005, MNRAS: Letters, 363, L91
- Crawford et al. (2005) Crawford, C. S., Hatch, N. A., Fabian, A. C., & Sanders, J. S. 2005, MNRAS, 363, 216
- De Filippis et al. (2002) De Filippis, E., Schindler, S., & Castillo-Morales, A. 2002, arXiv:astro-ph/0201349, astro-ph/0201349
- De Grandi et al. (2014) De Grandi, S., Santos, J. S., Nonino, M., et al. 2014, A&A, 567, A102
- Diehl & Statler (2006) Diehl, S., & Statler, T. S. 2006, MNRAS, 368, 497
- Dong et al. (2010) Dong, X.-B., Ho, L. C., Wang, J.-G., et al. 2010, ApJ, 721, L143
- Dunn & Fabian (2006) Dunn, R. J. H., & Fabian, A. C. 2006, MNRAS, 373, 959
- Dunn & Fabian (2008) —. 2008, Monthly Notices RAS, 385, 757
- Ebeling et al. (2007) Ebeling, H., Barrett, E., Donovan, D., et al. 2007, ApJ, 661, L33
- Ebeling et al. (2001) Ebeling, H., Edge, A. C., & Henry, J. P. 2001, ApJ, 553, 668
- Ebeling et al. (2010) Ebeling, H., Edge, A. C., Mantz, A., et al. 2010, MNRAS, 407, 83
- Ehlert et al. (2011) Ehlert, S., Allen, S., von der Linden, A., et al. 2011, MNRAS, 411, 1641
- Fabian (1999) Fabian, A. 1999, Chandra Proposal
- Fabian (1994) Fabian, A. C. 1994, Annu. Rev. Astron. Astrophys., 32, 277
- Fabian et al. (2011) Fabian, A. C., Sanders, J. S., Williams, R. J. R., et al. 2011, MNRAS, 417, 172
- Farrah et al. (2016) Farrah, D., Baloković, M., Stern, D., et al. 2016, ApJ, 831, 76
- Franceschini et al. (2000) Franceschini, A., Bassani, L., Cappi, M., et al. 2000, A & A, 353, 910
- Fujita et al. (2007) Fujita, Y., Kohri, K., Yamazaki, R., & Kino, M. 2007, ApJ Letters, 663, L61
- Gaspari et al. (2013a) Gaspari, M., Brighenti, F., & Ruszkowski, M. 2013a, Astron. Nachr., 334, 394
- Gaspari et al. (2013b) Gaspari, M., Ruszkowski, M., & Oh, S. P. 2013b, MNRAS, 432, 3401
- Gaspari et al. (2018) Gaspari, M., McDonald, M., Hamer, S. L., et al. 2018, ApJ, 854, 167
- Ghizzardi et al. (2010) Ghizzardi, S., Rossetti, M., & Molendi, S. 2010, A&A, 516, A32
- Giacintucci et al. (2014) Giacintucci, S., Markevitch, M., Brunetti, G., et al. 2014, ApJ, 795, 73
- Giacintucci et al. (2019) Giacintucci, S., Markevitch, M., Cassano, R., et al. 2019, ApJ, 880, 70
- Gitti et al. (2006) Gitti, M., Feretti, L., & Schindler, S. 2006, A&A, 448, 853
- Gupta et al. (2016) Gupta, A., Yuan, T., Tran, K.-V. H., et al. 2016, ApJ, 831, 104
- Hamer et al. (2012) Hamer, S. L., Edge, A. C., Swinbank, A. M., et al. 2012, MNRAS, 421, 3409
- Hines & Wills (1993) Hines, D. C., & Wills, B. J. 1993, ApJ, 415, 82
- Hitomi Collaboration et al. (2018) Hitomi Collaboration, Aharonian, F., Akamatsu, H., et al. 2018, Publications of the Astronomical Society of Japan, 70, 9
- Hlavacek-Larrondo et al. (2013a) Hlavacek-Larrondo, J., Fabian, A. C., Edge, A. C., et al. 2013a, MNRAS, 431, 1638
- Hlavacek-Larrondo et al. (2012a) —. 2012a, MNRAS, 421, 1360
- Hlavacek-Larrondo et al. (2012b) Hlavacek-Larrondo, J., Fabian, A. C., Edge, A. C., & Hogan, M. T. 2012b, MNRAS, 424, 224
- Hlavacek-Larrondo et al. (2013b) Hlavacek-Larrondo, J., Allen, S. W., Taylor, G. B., et al. 2013b, ApJ, 777, 163
- Hlavacek-Larrondo et al. (2015) Hlavacek-Larrondo, J., McDonald, M., Benson, B. A., et al. 2015, ApJ, 805, 35
- Hogan et al. (2015) Hogan, M. T., Edge, A. C., Hlavacek-Larrondo, J., et al. 2015, MNRAS, 453, 1201
- Hogan et al. (2017) Hogan, M. T., McNamara, B. R., Pulido, F. A., et al. 2017, ApJ, 851, 66
- Hopkins et al. (2006) Hopkins, P. F., Hernquist, L., Cox, T. J., et al. 2006, ApJ Supplement Series, 163, 1
- Iwasawa et al. (2001) Iwasawa, K., Fabian, A. C., & Ettori, S. 2001, MNRAS, 321, L15
- Jauzac et al. (2012) Jauzac, M., Jullo, E., Kneib, J.-P., et al. 2012, MNRAS, 426, 3369
- Jetzer et al. (2002) Jetzer, P., Koch, P., Piffaretti, R., Puy, D., & Schindler, S. 2002, arXiv:astro-ph/0201421, astro-ph/0201421
- Jin et al. (2006) Jin, Y. K., Zhang, S. N., & Wu, J. F. 2006, ApJ, 653, 1566
- Johnstone et al. (1987) Johnstone, R. M., Fabian, A. C., & Nulsen, P. E. J. 1987, MNRAS, 224, 75
- Jones & Forman (1984) Jones, C., & Forman, W. 1984, ApJ, 276, 38
- Kalberla et al. (2005) Kalberla, P. M. W., Burton, W. B., Hartmann, D., et al. 2005, A & A, 440, 775
- Kaurov et al. (2019) Kaurov, A. A., Dai, L., Venumadhav, T., Miralda-Escudé, J., & Frye, B. 2019, ApJ, 880, 58
- Kirkpatrick & McNamara (2015) Kirkpatrick, C. C., & McNamara, B. R. 2015, MNRAS, 452, 4361
- Kleinmann et al. (1988) Kleinmann, S. G., Hamilton, D., Keel, W. C., et al. 1988, ApJ, 328, 161
- Klesman & Sarajedini (2012) Klesman, A. J., & Sarajedini, V. L. 2012, MNRAS, 425, 1215
- Kolokythas et al. (2018) Kolokythas, K., O’Sullivan, E., Raychaudhury, S., et al. 2018, MNRAS, 1807.11095
- Li & Bryan (2014a) Li, Y., & Bryan, G. L. 2014a, ApJ, 789, 153
- Li & Bryan (2014b) —. 2014b, ApJ, 789, 54
- Limousin et al. (2012) Limousin, M., Ebeling, H., Richard, J., et al. 2012, A & A, 544, A71
- Markevitch & Vikhlinin (2007) Markevitch, M., & Vikhlinin, A. 2007, Physics Reports, 443, 1
- Markevitch et al. (2001) Markevitch, M., Vikhlinin, A., & Mazzotta, P. 2001, ApJ, 562, L153
- Mazzotta et al. (2003) Mazzotta, P., Edge, A., & Markevitch, M. 2003, ApJ, 596, 190
- Mazzotta & Giacintucci (2008) Mazzotta, P., & Giacintucci, S. 2008, ApJ Letters, 675, L9
- Mazzotta et al. (2001) Mazzotta, P., Markevitch, M., Vikhlinin, A., & Forman, W. R. 2001, arXiv:astro-ph/0109420, astro-ph/0109420
- McConnell et al. (2011) McConnell, N. J., Ma, C.-P., Gebhardt, K., et al. 2011, Nature, 480, 215
- McCourt et al. (2012) McCourt, M., Sharma, P., Quataert, E., & Parrish, I. J. 2012, MNRAS, 419, 3319
- McDonald et al. (2018) McDonald, M., Gaspari, M., McNamara, B. R., & Tremblay, G. R. 2018, ApJ, 858, 45
- McDonald et al. (2015) McDonald, M., McNamara, B. R., van Weeren, R. J., et al. 2015, ApJ, 811, 111
- McDonald et al. (2019) McDonald, M., McNamara, B. R., Voit, G. M., et al. 2019, arXiv e-prints, 1904, arXiv:1904.08942
- McNamara et al. (2016) McNamara, B. R., Russell, H. R., Nulsen, P. E. J., et al. 2016, ApJ, 830, 79
- McNamara et al. (2000) McNamara, B. R., Wise, M., Nulsen, P. E. J., et al. 2000, ApJ, 534, L135
- McNamara et al. (2001) McNamara, B. R., Wise, M. W., Nulsen, P. E. J., et al. 2001, ApJ Letters, 562, L149
- Mushotzky & Szymkowiak (1988) Mushotzky, R. F., & Szymkowiak, A. E. 1988, 229, 53
- Nulsen et al. (2009) Nulsen, P., Jones, C., Forman, W., et al. 2009, arXiv:0909.1809 [astro-ph], 198
- Nulsen et al. (1987) Nulsen, P. E. J., Johnstone, R. M., & Fabian, A. C. 1987, Proceedings of the Astronomical Society of Australia, 7, 132
- Nulsen & McNamara (2013) Nulsen, P. E. J., & McNamara, B. R. 2013, Astron. Nachr., 334, 386
- O’Dea et al. (2008) O’Dea, C. P., Baum, S. A., Privon, G., et al. 2008, ApJ, 681, 1035
- O’Sullivan et al. (2011) O’Sullivan, E., Giacintucci, S., David, L. P., et al. 2011, ApJ, 735, 11
- Owers et al. (2009) Owers, M. S., Nulsen, P. E. J., Couch, W. J., & Markevitch, M. 2009, ApJ, 704, 1349
- Panagoulia et al. (2014) Panagoulia, E. K., Fabian, A. C., & Sanders, J. S. 2014, MNRAS, 438, 2341
- Peterson & Fabian (2006) Peterson, J. R., & Fabian, A. C. 2006, Physics Reports, 427, 1
- Pfrommer & Enßlin (2004) Pfrommer, C., & Enßlin, T. A. 2004, A & A, 413, 17
- Piconcelli et al. (2007) Piconcelli, E., Fiore, F., Nicastro, F., et al. 2007, A & A, 473, 85
- Planck Collaboration et al. (2015) Planck Collaboration, Ade, P. A. R., Aghanim, N., et al. 2015, A & A, 581, A14
- Planck Collaboration et al. (2011) Planck Collaboration, C., Ade, P. a. R., Aghanim, N., et al. 2011, A&A, 536, A11
- Prasad et al. (2017) Prasad, D., Sharma, P., & Babul, A. 2017, MNRAS, 471, 1531
- Rafferty et al. (2008) Rafferty, D. A., McNamara, B. R., & Nulsen, P. E. J. 2008, ApJ, 687, 899
- Rafferty et al. (2006) Rafferty, D. A., McNamara, B. R., Nulsen, P. E. J., & Wise, M. W. 2006, ApJ, 652, 216
- Richard-Laferrière et al. (submitted) Richard-Laferrière, A., Hlavacek-Larrondo, J., Latulippe, M., et al. submitted, MNRAS
- Russell et al. (2013) Russell, H. R., McNamara, B. R., Edge, A. C., et al. 2013, MNRAS, 432, 530
- Russell et al. (2012) Russell, H. R., McNamara, B. R., Sanders, J. S., et al. 2012, MNRAS, 423, 236
- Sanders & Fabian (2002) Sanders, J. S., & Fabian, A. C. 2002, MNRAS, 331, 273
- Sanders & Fabian (2007) —. 2007, MNRAS, 381
- Sanders et al. (2018) Sanders, J. S., Fabian, A. C., Russell, H. R., & Walker, S. A. 2018, MNRAS, 474, 1065
- Sanders et al. (2016) Sanders, J. S., Fabian, A. C., Taylor, G. B., et al. 2016, Mon. Not. R. Astron. Soc., 457, 82
- Santos et al. (2016) Santos, J. S., Balestra, I., Tozzi, P., et al. 2016, Mon. Not. R. Astron. Soc: Lett., 456, L99
- Schindler et al. (2001) Schindler, S., Castillo-Morales, A., De Filippis, E., Schwope, A., & Wambsganss, J. 2001, A&A, 376, L27
- Sharma et al. (2012) Sharma, P., McCourt, M., Quataert, E., & Parrish, I. J. 2012, MNRAS, 420, 3174
- Simionescu et al. (2010) Simionescu, A., Werner, N., Forman, W. R., et al. 2010, MNRAS, 405, 91
- Smith et al. (2009) Smith, G. P., Ebeling, H., Limousin, M., et al. 2009, ApJ Letters, 707, L163
- Su et al. (2017) Su, Y., Nulsen, P. E. J., Kraft, R. P., et al. 2017, ApJ, 847, 94
- van Weeren et al. (2019) van Weeren, R. J., de Gasperin, F., Akamatsu, H., et al. 2019, Space Science Reviews, 215, 16
- Vignali et al. (2011) Vignali, C., Piconcelli, E., Lanzuisi, G., et al. 2011, MNRAS, 416, 2068
- Vikhlinin et al. (2005) Vikhlinin, A., Markevitch, M., Murray, S. S., et al. 2005, ApJ, 628, 655
- Voigt & Fabian (2004) Voigt, L. M., & Fabian, A. C. 2004, MNRAS, 347, 1130
- Voit et al. (2017) Voit, G. M., Meece, G., Li, Y., et al. 2017, ApJ, 845, 80
- von der Linden et al. (2014) von der Linden, A., Mantz, A., Allen, S. W., et al. 2014, MNRAS, 443, 1973
- Walker et al. (2014) Walker, S. A., Fabian, A. C., & Kosec, P. 2014, MNRAS, 445, 3444
- Walker et al. (2015) Walker, S. A., Kosec, P., Fabian, A. C., & Sanders, J. S. 2015, Mon. Not. R. Astron. Soc., 453, 2481
- Wang et al. (2004) Wang, J. X., Malhotra, S., Rhoads, J. E., & Norman, C. A. 2004, ApJ, 612, L109
- Zandanel et al. (2014) Zandanel, F., Pfrommer, C., & Prada, F. 2014, MNRAS, 438, 124
- Zhuravleva et al. (2018) Zhuravleva, I., Allen, S. W., Mantz, A., & Werner, N. 2018, ApJ, 865, 53
- Zhuravleva et al. (2014) Zhuravleva, I., Churazov, E., Schekochihin, A. A., et al. 2014, Nature, 515, 85
- Zhuravleva et al. (2016) Zhuravleva, I., Churazov, E., Arévalo, P., et al. 2016, MNRAS, 458, 2902
- Zitrin et al. (2009) Zitrin, A., Broadhurst, T., Rephaeli, Y., & Sadeh, S. 2009, ApJ Letters, 707, L102
- ZuHone et al. (2013) ZuHone, J. A., Markevitch, M., Brunetti, G., & Giacintucci, S. 2013, ApJ, 762, 78