Simulated Annealing for Volcano Muography
Abstract
Muography or muon radiography is a non-invasive emerging image technology relying on high energy atmospheric muons, which complements other standard geophysical tools to understand the Earth’s subsurface.
This work discusses a geophysical inversion methodology for volcanic muography, based on the Simulated Annealing algorithm, using a semi-empirical model of the muon flux to reach the volcano topography and a framework for the energy loss of muons in rock.
The Metropolis-Simulated-Annealing algorithm starts from an “observed” muon flux and obtains the best associated inner density distribution function inside inside a syntetic model of the Cerro Machín Volcano (Tolima-Colombia). The estimated initial density model was obtained with GEOMODELER, adapted to the volcano topography. We improved this model by including rock densities from samples taken from the crater, the dome and the areas associated with fumaroles.
In this paper we determined the minimum muon energy (a function of the arrival direction) needed to cross the volcanic building, the emerging integrated flux of muons, and the density profile inside a model of Cerro Machin. The present inversion correctly reconstructed the density differences inside the Machín, within a error concerning our initial simulation model, giving a remarkable density contrast between the volcanic duct, the encasing rock and the fumaroles area.
keywords:
Muography , Muon Tomography , Muon Radiography , Geophysical Inversion , Simulated annealing , Volcanoes , Cosmic Ray Techniques.MSC:
[2010] 00-01, 86-081 Introduction
A technique known as muon radiography, muon tomography –or merely muography– is emerging with many applications ranging from geosciences to nuclear safety, civil engineering and archaeology (see Procureur (2018); Kaiser (2019); Bonechi et al. (2020); Thompson et al. (2020), and references therein). This technique is based on measuring the attenuation of the atmospheric muon flux travelling through the material (Tanaka et al., 2007; Lesparre et al., 2010; Okubo and Tanaka, 2012). Atmospheric muons originate from the decay of charged pions, kaons, and other mesons through weak interactions processes, produced while cosmic rays cross Earth’s atmosphere. The small cross-section of muon interaction with matter (Barrett et al., 1952) due to its mass being times higher than that of the electron, and the muon energy spectrum –extending to high energies (Gaisser, 1990)– results in the high penetrating power of muons and their ability to cross hundreds of meters of rock (although suffering a significant flux attenuation). There are two main mougraphy techniques: absorption-based or transmission muography –based on the opacity of the material along that line of sight– and scattering-based muography –which measures the average muon deflection angle () due to Coulomb scattering of the muons with the nucleus of the scanning materials– (Procureur, 2018; Bonechi et al., 2020).
As pointed by R. Kaiser (Kaiser, 2019), the muography community is very active. It is transiting the path from a research field to a technological innovation area, where half a dozen companies are providing services and products in several commercial niches. In Latin America, three initiatives from Mexico, Colombia and Argentina are starting to cooperate in several research projects.
A quick search111Searching: muography OR ”muon tomography” OR ”muon radiography” in google scholar found almost 1,200 publications2221,177 publications including patents distributed as 221 in 2016; 226 in 2017; 235 in 2018; 264 in 2019 and 231 in 2020 with 194 US patents33333 in 2016; 34 in 2017; 32 in 2018; 42 in 2019 and 53 in 2020 in the last five years. The cost of this competitive technology depends on both, the technique (scattering-based muography or absorption-based muography) and the required resolution ( mrad to mrad), ranging from €/m2 to €/m2 (see Table 1 in reference Bonechi et al. (2020)).
Volcanoes are structures of great interest from both geological and geophysical points of view. Seismic, gravimetric and other standard geophysical methods have been applied to model inner volcanic structures (McNutt, 1996), while geological, geochemical and geophysical studies are routinely made to understand their composition and past behaviour. Rock drilling is one of the best ways of collecting information but is expensive and limited to the area and depth of drilling.
Active volcanoes are those which have erupted in the recent past (last 10000 years) and could represent a hazard for their surrounding populations. The knowledge of the internal structure of active volcanoes is crucial in assessing their potential impact. However, this remains one of the most challenging geophysics problem because defining the structure of a highly composite volcano requires dense data sampling in severe field conditions.
In Colombia, it is worth mentioning the 3D model of the Nevado del Ruiz volcano which integrates geological, geochemical and geophysical (seismic and magneto-telluric) information (González-Garcia et al., 2015). However, several authors Munoz (1992); Lesparre et al. (2012b) have pointed out certain limitations in spatial resolution of geophysical methods, related for example to the wavelength in seismic surveys.
In vulcanology, muon radiography measures the atmospheric muon flux attenuated by rock volumes of different densities, projecting images of volcanic conduits at the top of the volcanic structure, which are critical in understanding possible eruption dynamics. Obtaining the density profile in volcanoes requires comparing the muon flux detected by a properly calibrated instrument with the flux expected and validated by a detailed simulation. When the detected flux is higher than expected, the average density along that path must be less than the one initially considered and vice versa (Tanaka et al., 2007; Lesparre et al., 2010; Okubo and Tanaka, 2012; Calderón-Ardila et al., 2020).
More than a dozen active volcanoes in Colombia, representing significant risks to the nearby population (Cortés, 2016; Agudelo, 2016; Muñoz, 2017), have motivated local research groups to explore possible applications of muography to inland geological structures. Colombian inland volcanoes are commonly surrounded by other geological structures that screen the atmospheric muon flux, and only a few potential observation points are available. Some ideas had been reported around the possibility of designing a muon telescope to study the Galera volcano in the southern part of Colombia (Tapia et al., 2016; Guerrero et al., 2019). In Bogotá, at the centre of the country, J.S. Useche-Parra and C. A. Avila-Bernal designed and built a hodoscope prototype to measure muon flux crossing Monserrate Hill. Through the interpolation of stopping power data, they determine the muon incident energy’s attenuation function and estimate the muon flux as a function of the mountain’s location (Useche-Parra and Avila-Bernal, 2019). The Astroparticle research group at the Universidad Industrial de Santander –in cooperation of several institutions in Argentina–, developed a research muography program, designing and constructing instrumentation to study the Colombia Volcanoes, and civil structures (Asorey et al., 2017, 2018a, 2018b; Peña-Rodríguez et al., 2019; Vásquez-Ramírez et al., 2020; Peña-Rodríguez et al., 2020). The landscape in Colombia –and indeed in all other Andean volcanoes– is very different. Most of the country active volcanoes are along the Cordillera Central, surrounded by higher altitudes shielding cosmic ray flux. Thus, we developed a methodology to identify the most feasible volcano candidates, identifying the best candidates and the possible observation point to study with this technique (Vesga-Ramírez et al., 2020).
The present work describes an optimization method for obtaining the best density distribution inside the volcano by measuring the muon flux emerging from the geological structure. Some previous work has considered this inverse problem using a Bayesian framework (Barnoud et al., 2019; Nishiyama et al., 2017, 2014) or traditional local optimization methods (Lelièvre et al., 2019; Rosas-Carbajal et al., 2017; Davis et al., 2011). In this study, we use a global optimization inversion method based on Simulated Annealing Algorithm (SAA) –applying the Metropolis criterion– to obtain the global optimum for the density distribution function inside the volcano. The name of this algorithm, inspired by annealing in metallurgy, was proposed in 1983 by S. Kirkpatrick, C.D. Gelatt Jr. and M. P. Vecchi when they solved the travelling salesman problem applying this optimization scheme(Kirkpatrick et al., 1983). The SAA inversion has some advantages over other approach based on local inversion methods. It is computationally efficient, can solve linear and no linear problems, underdetermined inverse problems, can more easily implement complex a priori information, and does not introduce smoothing effects in the final density structure model (Nagihara and Hall, 2001).
We have organized the paper as follows. In the next section, we briefly describe our hybrid muon telescope and the criteria used to select the muography site in Colombia. Section 3 develops two essential inputs to the geophysical inversion: the geological model of the Cerro Machín Volcano and the initial density distribution emerging from the forward modelling. Section 4 implements the geophysical inversion by using the SSA, while Section 5 discusses the results obtained. Finally, in section 6, we outline some final remarks and conclusions along with possible future work.
2 Muography in Colombia
Colombia has more than a dozen active volcanoes along the Cordillera Central, the highest of the three branches of the Colombian Andes. Most of these volcanoes represent a significant risk to the nearby population in towns and/or villages(Cortés, 2016; Agudelo, 2016; Muñoz, 2017) and have caused major disasters.
In this section, we briefly describe our hybrid Muon Telescope, MuTe, and the selected muography observation site at Cerro Machín in the department of Tolima. Details of the instrument operation and calibration are considered elsewhere (Asorey et al., 2017; Peña-Rodríguez et al., 2019; Vásquez-Ramírez et al., 2020; Peña-Rodríguez et al., 2020), while the reasons in choosing Cerro Machín among 13 other Colombian volcanoes can be found in reference (Vesga-Ramírez et al., 2020).
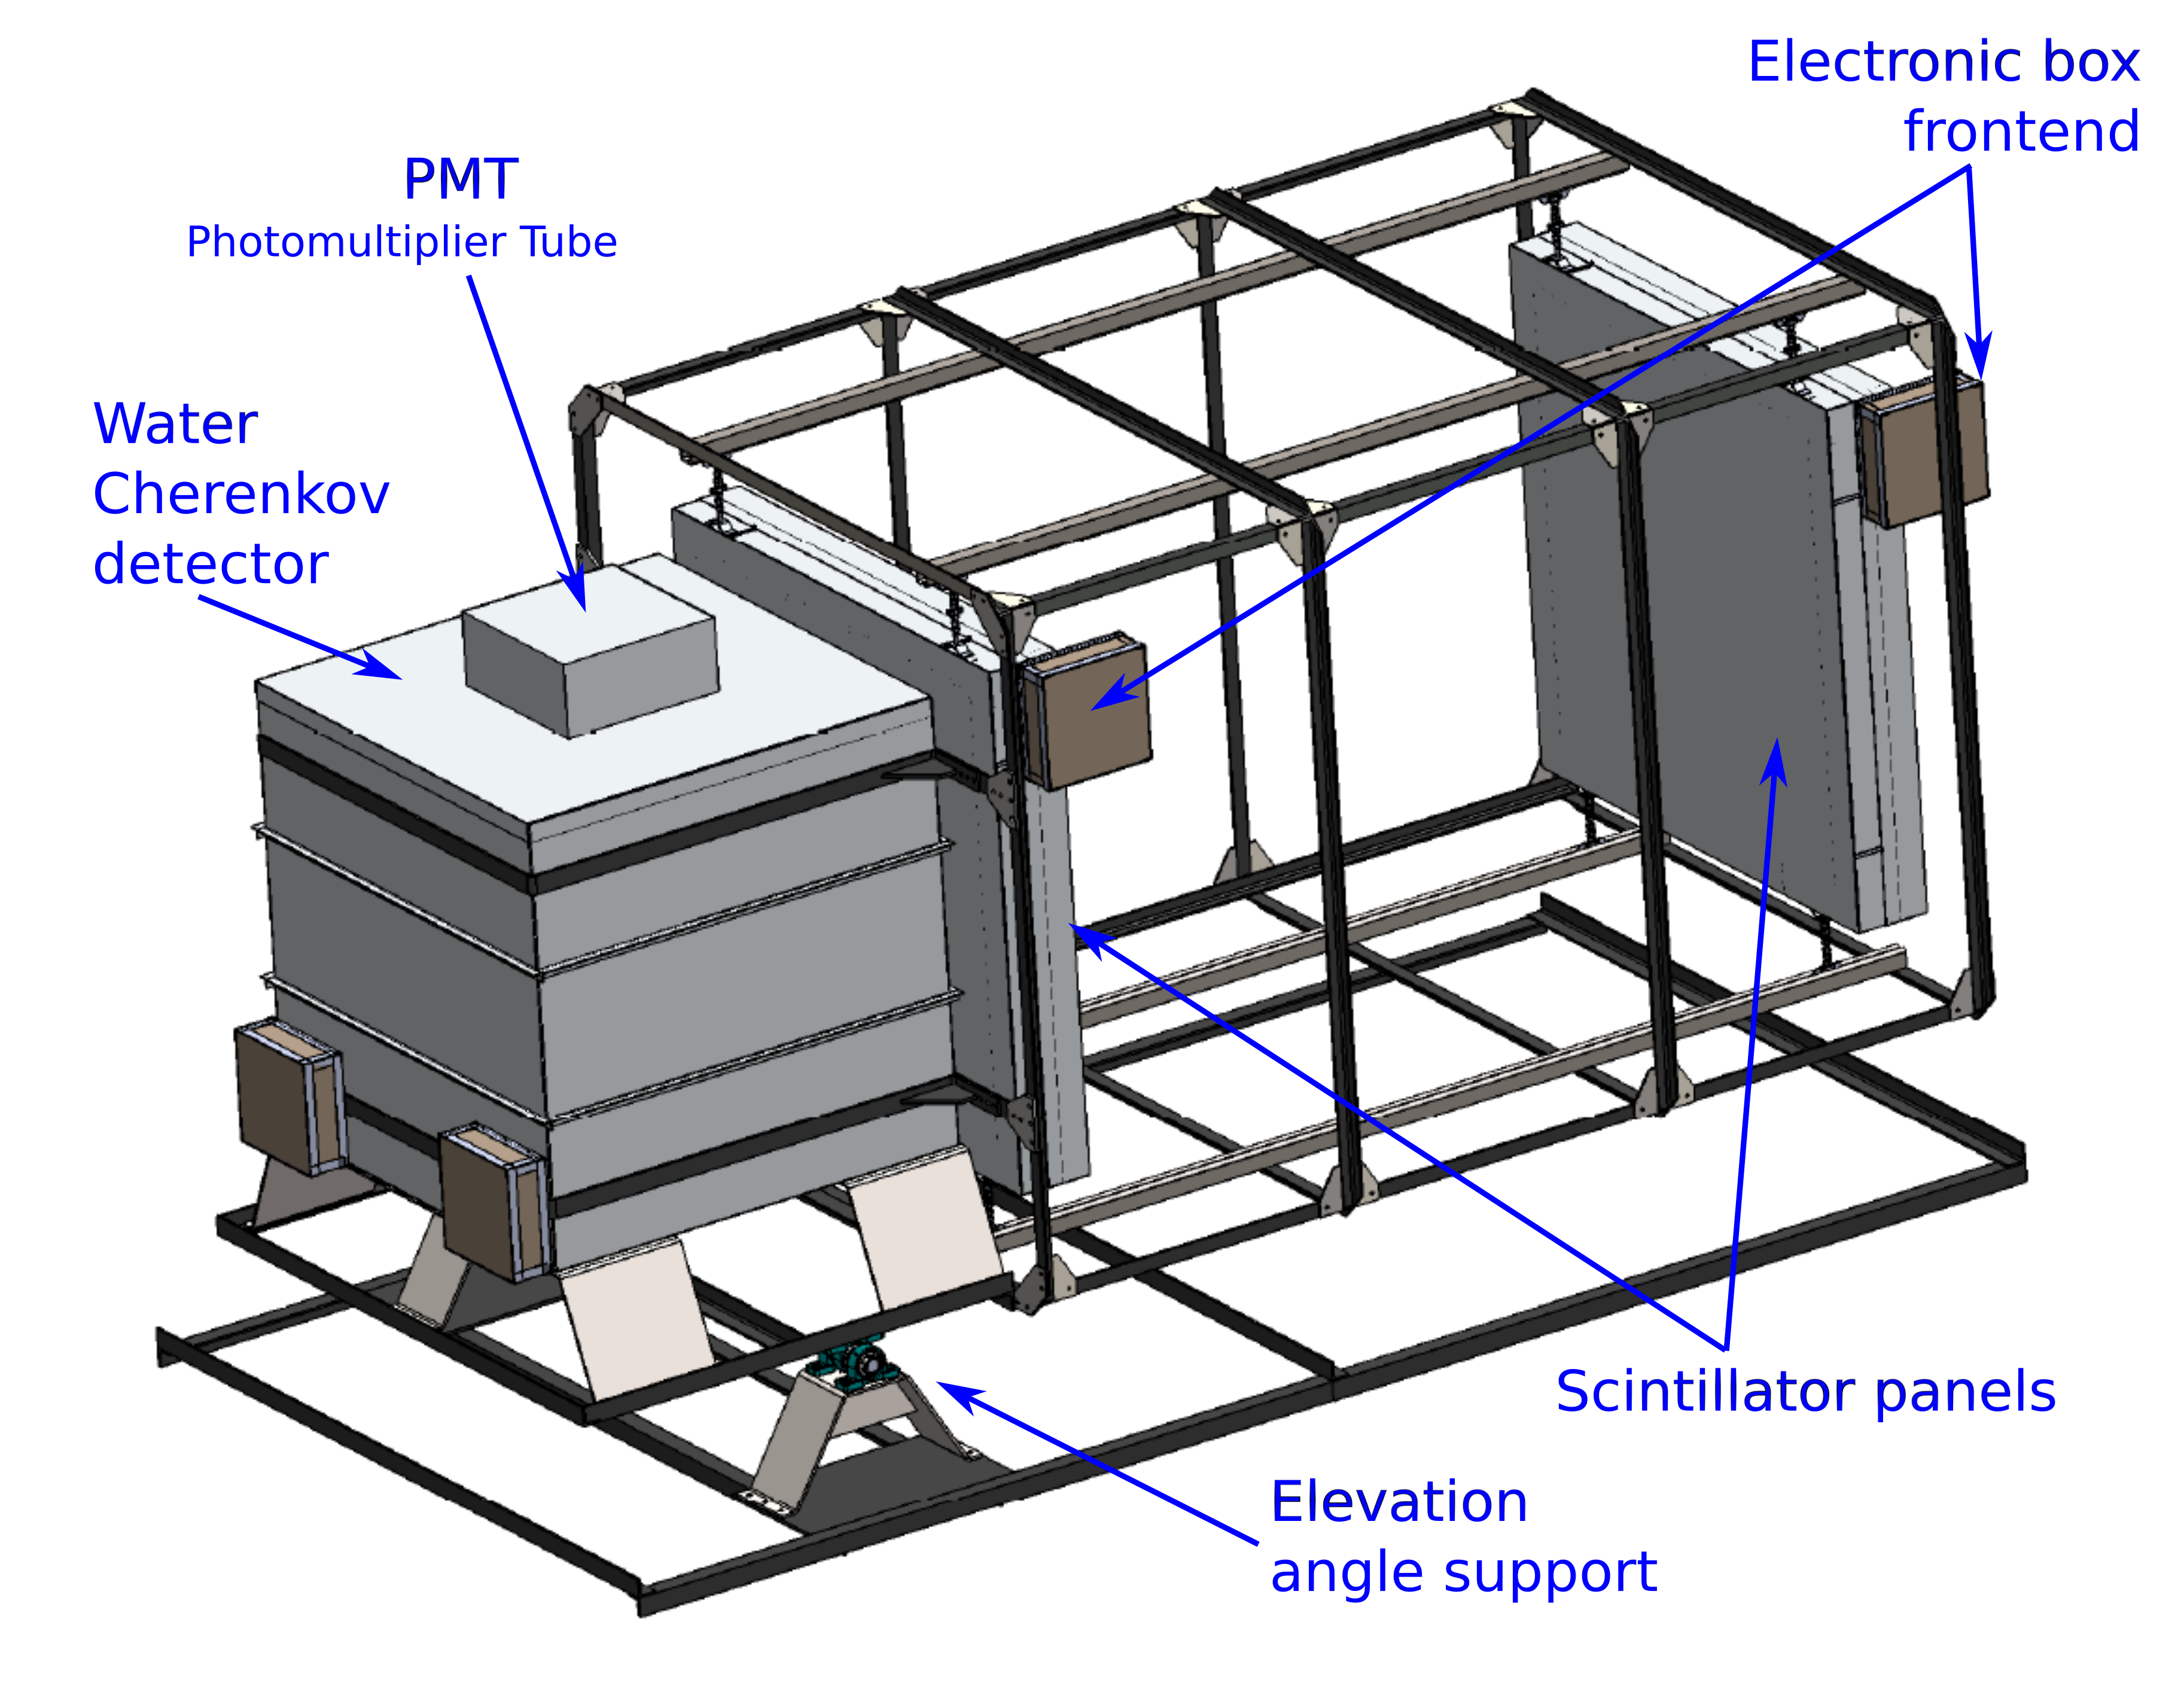
2.1 MuTe: a hybrid Muon Telescope
There are three main types of detectors implemented for volcano muography: nuclear emulsion, scintillation and gas detectors. Each one has its pros and cons as described in references (Tanaka and Oláh, 2019; Tanaka, 2016).
MuTe is a hybrid telescope with two detectors combined:
-
1.
Two-panel-hodoscope: Hodoscopes are the most common detectors designed and implemented for volcano muography. They consist of two panels devised to identify muon trajectories. Inspired by the experiences of other volcano muography experiments (Uchida et al., 2009; Gibert et al., 2010), we have designed two X-Y arrays of plastic scintillating strips ( cm cm cm). Each array ( cm cm = cm2) has pixels, giving a surface detection area of cm2. The two panels can be separated up to cm (Vásquez-Ramírez et al., 2020).
-
2.
Water Cherenkov Detector: The Water Cherenkov Detector, WCD, indirectly detects charged particles by the Cherenkov photons generated by relativistic particles traveling through water. The MuTe WCD is a purified water cube of cm side, located behind the rear scintillator panel (see Figure 1), which filters most of the backwards and the background noise of muography, discriminating the muonic from the electromagnetic component of the atmospheric showers produced by cosmic rays (Vásquez-Ramírez et al., 2020).
2.2 The MuTe Selection Sites
In Colombia, various active volcanoes are found along the Cordillera Central, with neighbouring geological structures of higher altitude. This complex surrounding topographic environment obstructs the tilted cosmic ray fluxes increasing the overall distance the muons travel through rock, and distorting the estimated density distribution inside the volcano. Thus, we used the topographical surface map of the Machín volcano444From Alaska Satellite Facility Vertex https://vertex.daac.asf.alaska.edu/ with a resolution of m m, and with a ray-tracing algorithm calculated all the possible distances associated with muon paths crossing only the dome. Then, we determined the muon energy losses to estimate muon flux at the detector.
| Points | P1 | P2 | P3 | P4 |
|---|---|---|---|---|
| Latitude (∘N) | 4.49229 | 4.49198 | 4.48733 | 4.49494 |
| Longitude (∘W) | -75.38109 | -75.38009 | -75.37951 | -75.38811 |
As described in reference (Vesga-Ramírez et al., 2020), having considered technical and logistic data, we found that only Cerro Machín can be feasibly studied through muography, and there we identified four observation points (shown in Table 1) which are not screened by any geological structures behind. Some of the manifestations of the volcanic activity of Cerro Machín are the presence of fumaroles in the dome, permanent microseismicity, thermal waters flowing in the vicinity of the crater, geoforms of the volcanic building and a more significant presence of radon gas in the sector (Rueda, 2005).
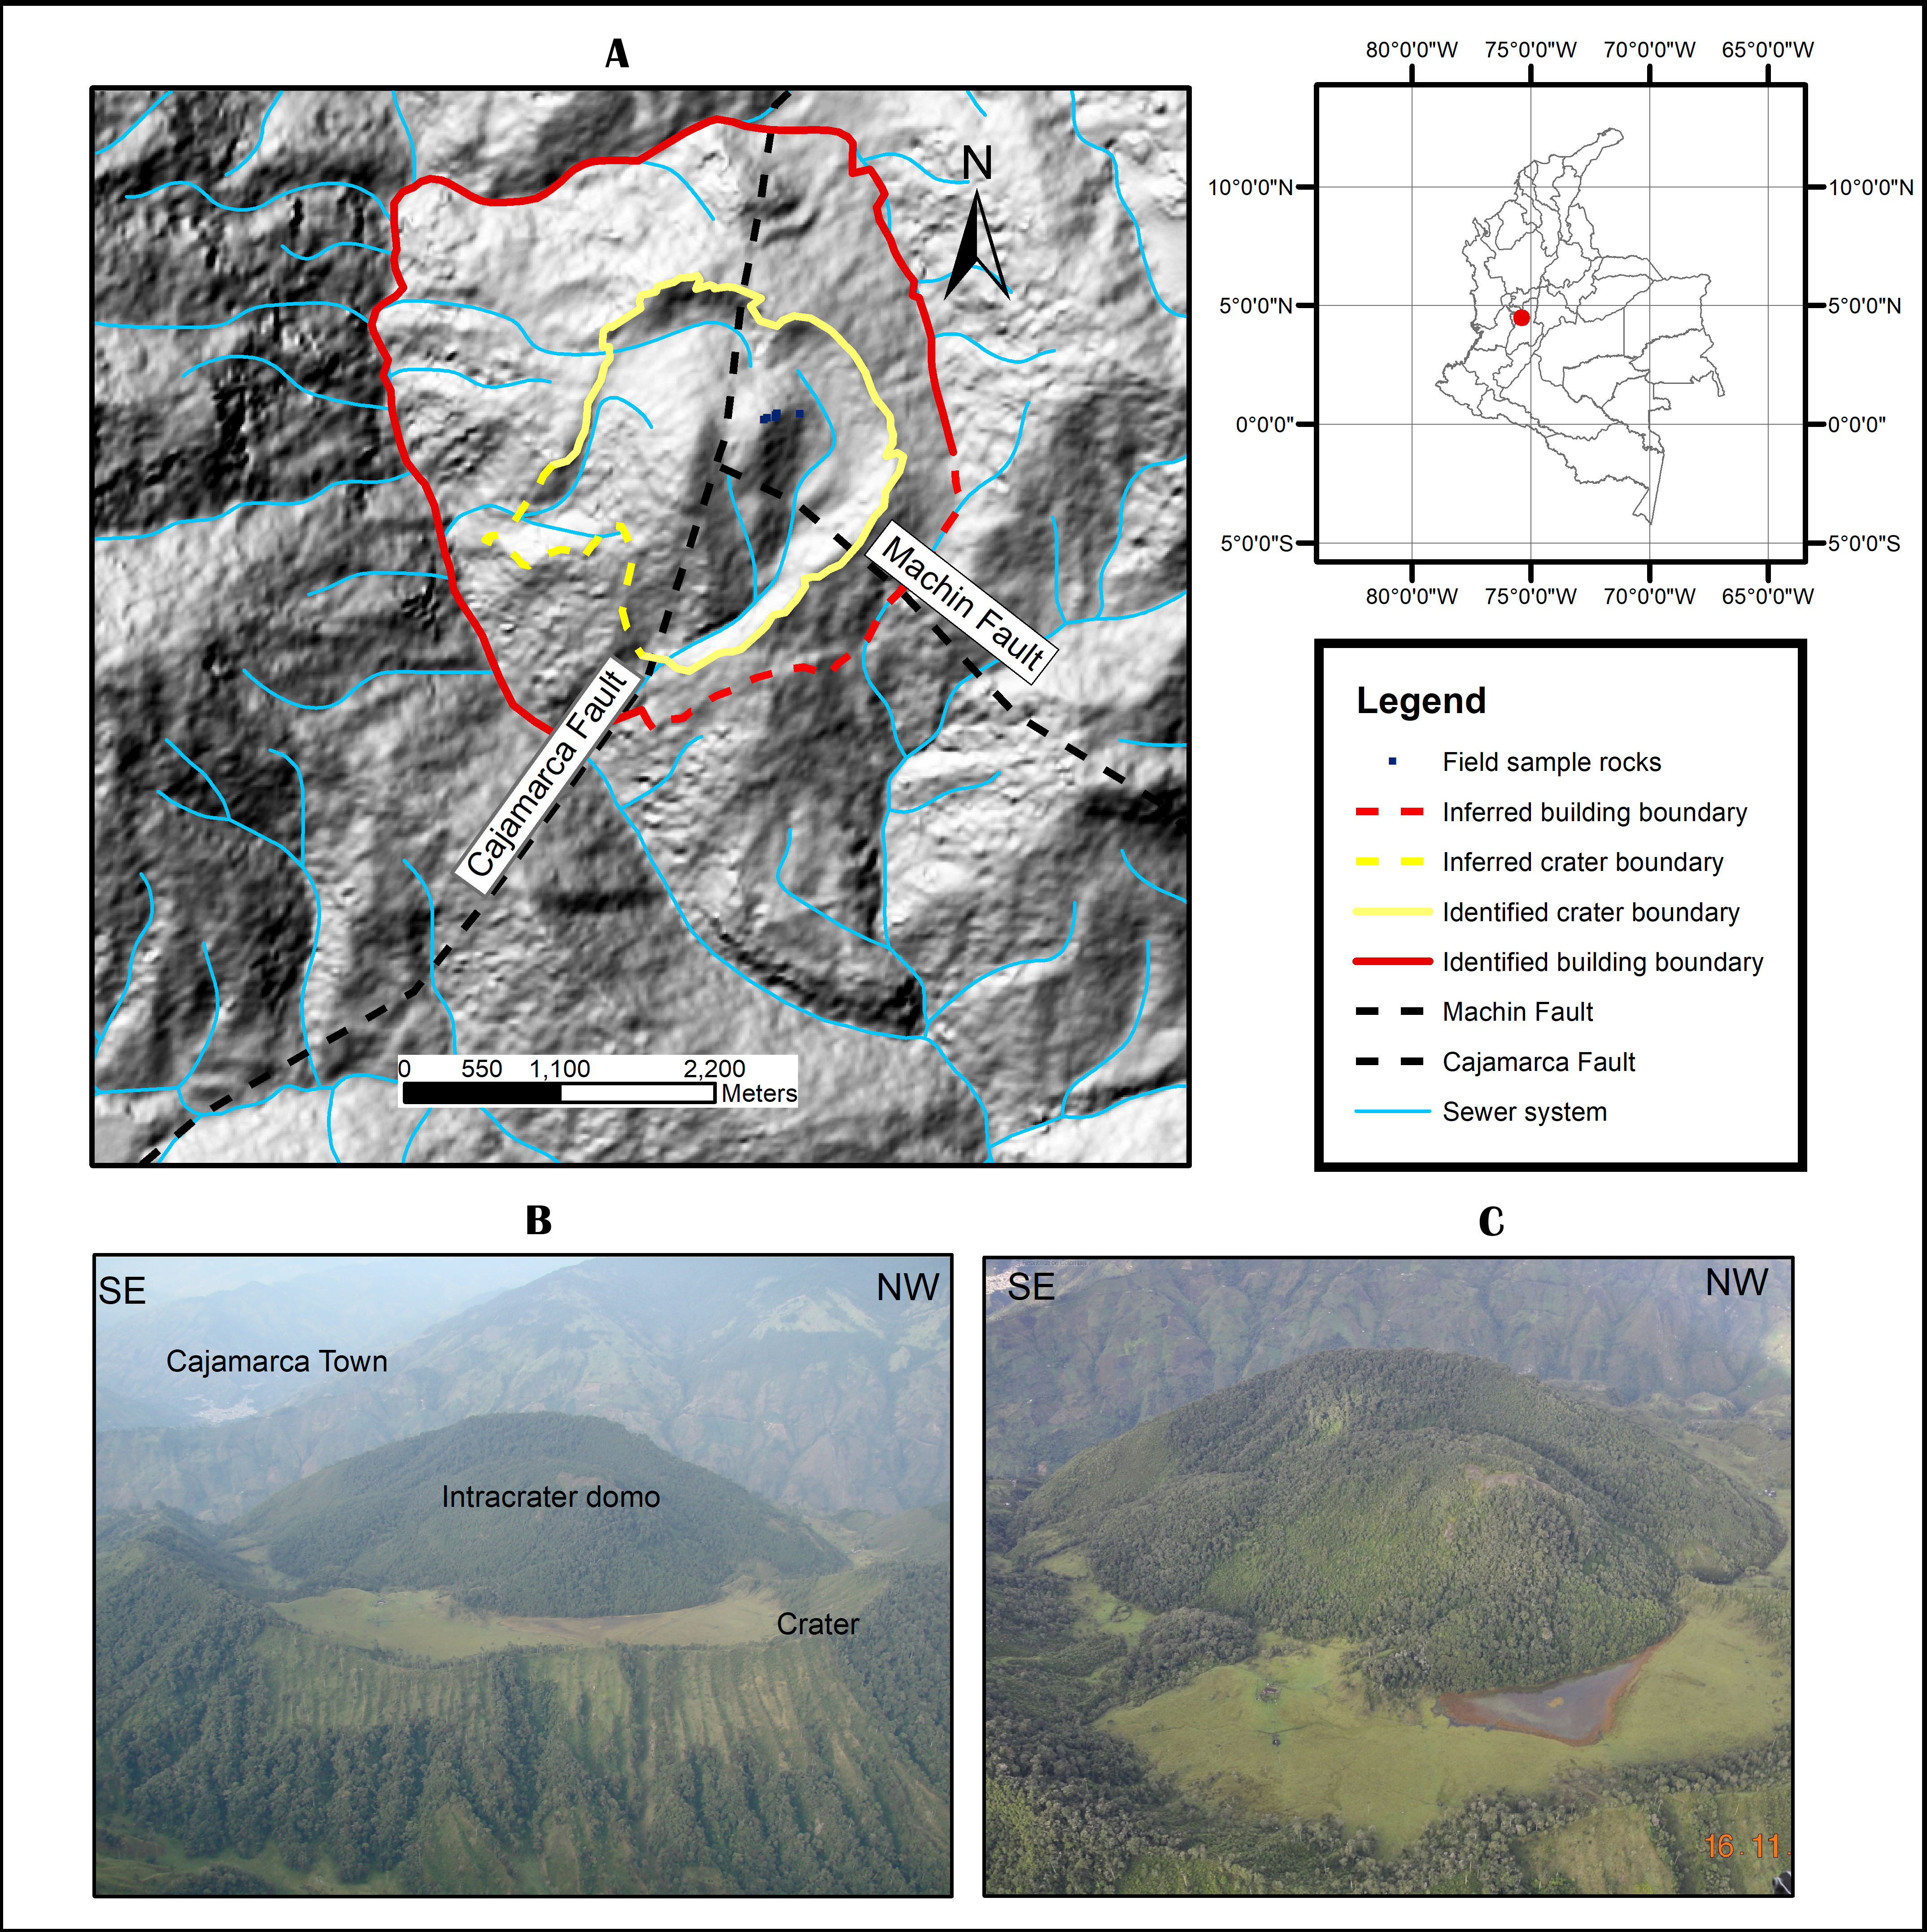
The Cerro Machín volcano is in a strategic region on the eastern flank of Colombia’s Central Cordillera (at 4∘29’23.08”N, 75∘23’15.39”W), with a crater km diameter and m high dome (see figure 2). It is one of the most dangerous active volcanoes in Colombia, having had six significant explosive eruptions in the last years (Laeger et al., 2013; Cortés, 2001; Inguaggiato et al., 2017). These eruptions have deposited many types of pyroclastic sediments with associated lahars that have travelled more than km (Murcia et al., 2008). The last known Vulcanian eruption occurred years ago and produced associated pyroclastic flows. This incident ended with the emplacement of an intra-crater dacitic dome and an active boiling fumarole field in the summit area of the central volcanic structure (Rueda, 2005; Laeger et al., 2013; Murcia et al., 2008; Thouret et al., 1995). Moreover, the recent increase of seismic activity recorded since could result in a potentially higher threat to the neighbouring population (Sánchez, 2014).
3 The geological model and the forward modelling
To implement the geophysical inversion, we first devised a geological model for the density distribution and a plausible inner structure for the Machín Volcano. Beginning with this improved representation of the inner volcano structure, we carried out the forward modelling to estimate the detected muon flux at a particular observation point.
3.1 Cerro Machín volcano density model
The first step for implementing the forward modelling, discussed in the next section, is to guess the inner density distribution for the geological structure. In this section, we present an estimation of the density distribution as well as the possible inner structure of the Machín Volcano based on geological field information.
A geological model that accurately characterizes the spatial distribution of rock type, alteration, and structure of a geothermal system is the fundamental starting point for validating the inversion technique and testing ideas on the locations of potential fractures and permeable fluid pathways. We used GEOMODELER555https://geomodelr.com/ to design a model adapted to the Cerro Machín topography. We also considered a geological survey carried out, 2D sections from interpreted geological maps (Cepeda et al., 1995; Mosquera et al., 1982; Piedrahita et al., 2018) and rock samples taken from the current crater, in the dome and the areas associated with fumaroles of the volcano.
Figure 3 shows the geological model of Cerro Machín used to create the density model. The volcano is located at the intersection of the Cajamarca and Machín faults (directed N20∘E and N42∘W, respectively) (Rueda, 2005) and built up on the metamorphic rocks of the Cajamarca Complex.
The Cajamarca complex contains orthogneisses, phyllites, quartzites, greenschists, graphitic schists and local marbles (Laeger et al., 2013; Vargas et al., 2005; Villagómez et al., 2011). The Cerro Machín volcanic edifice consists of a ring of pyroclastic material with a diameter of km and includes a dacitic intra-crater lava dome (Murcia et al., 2008).
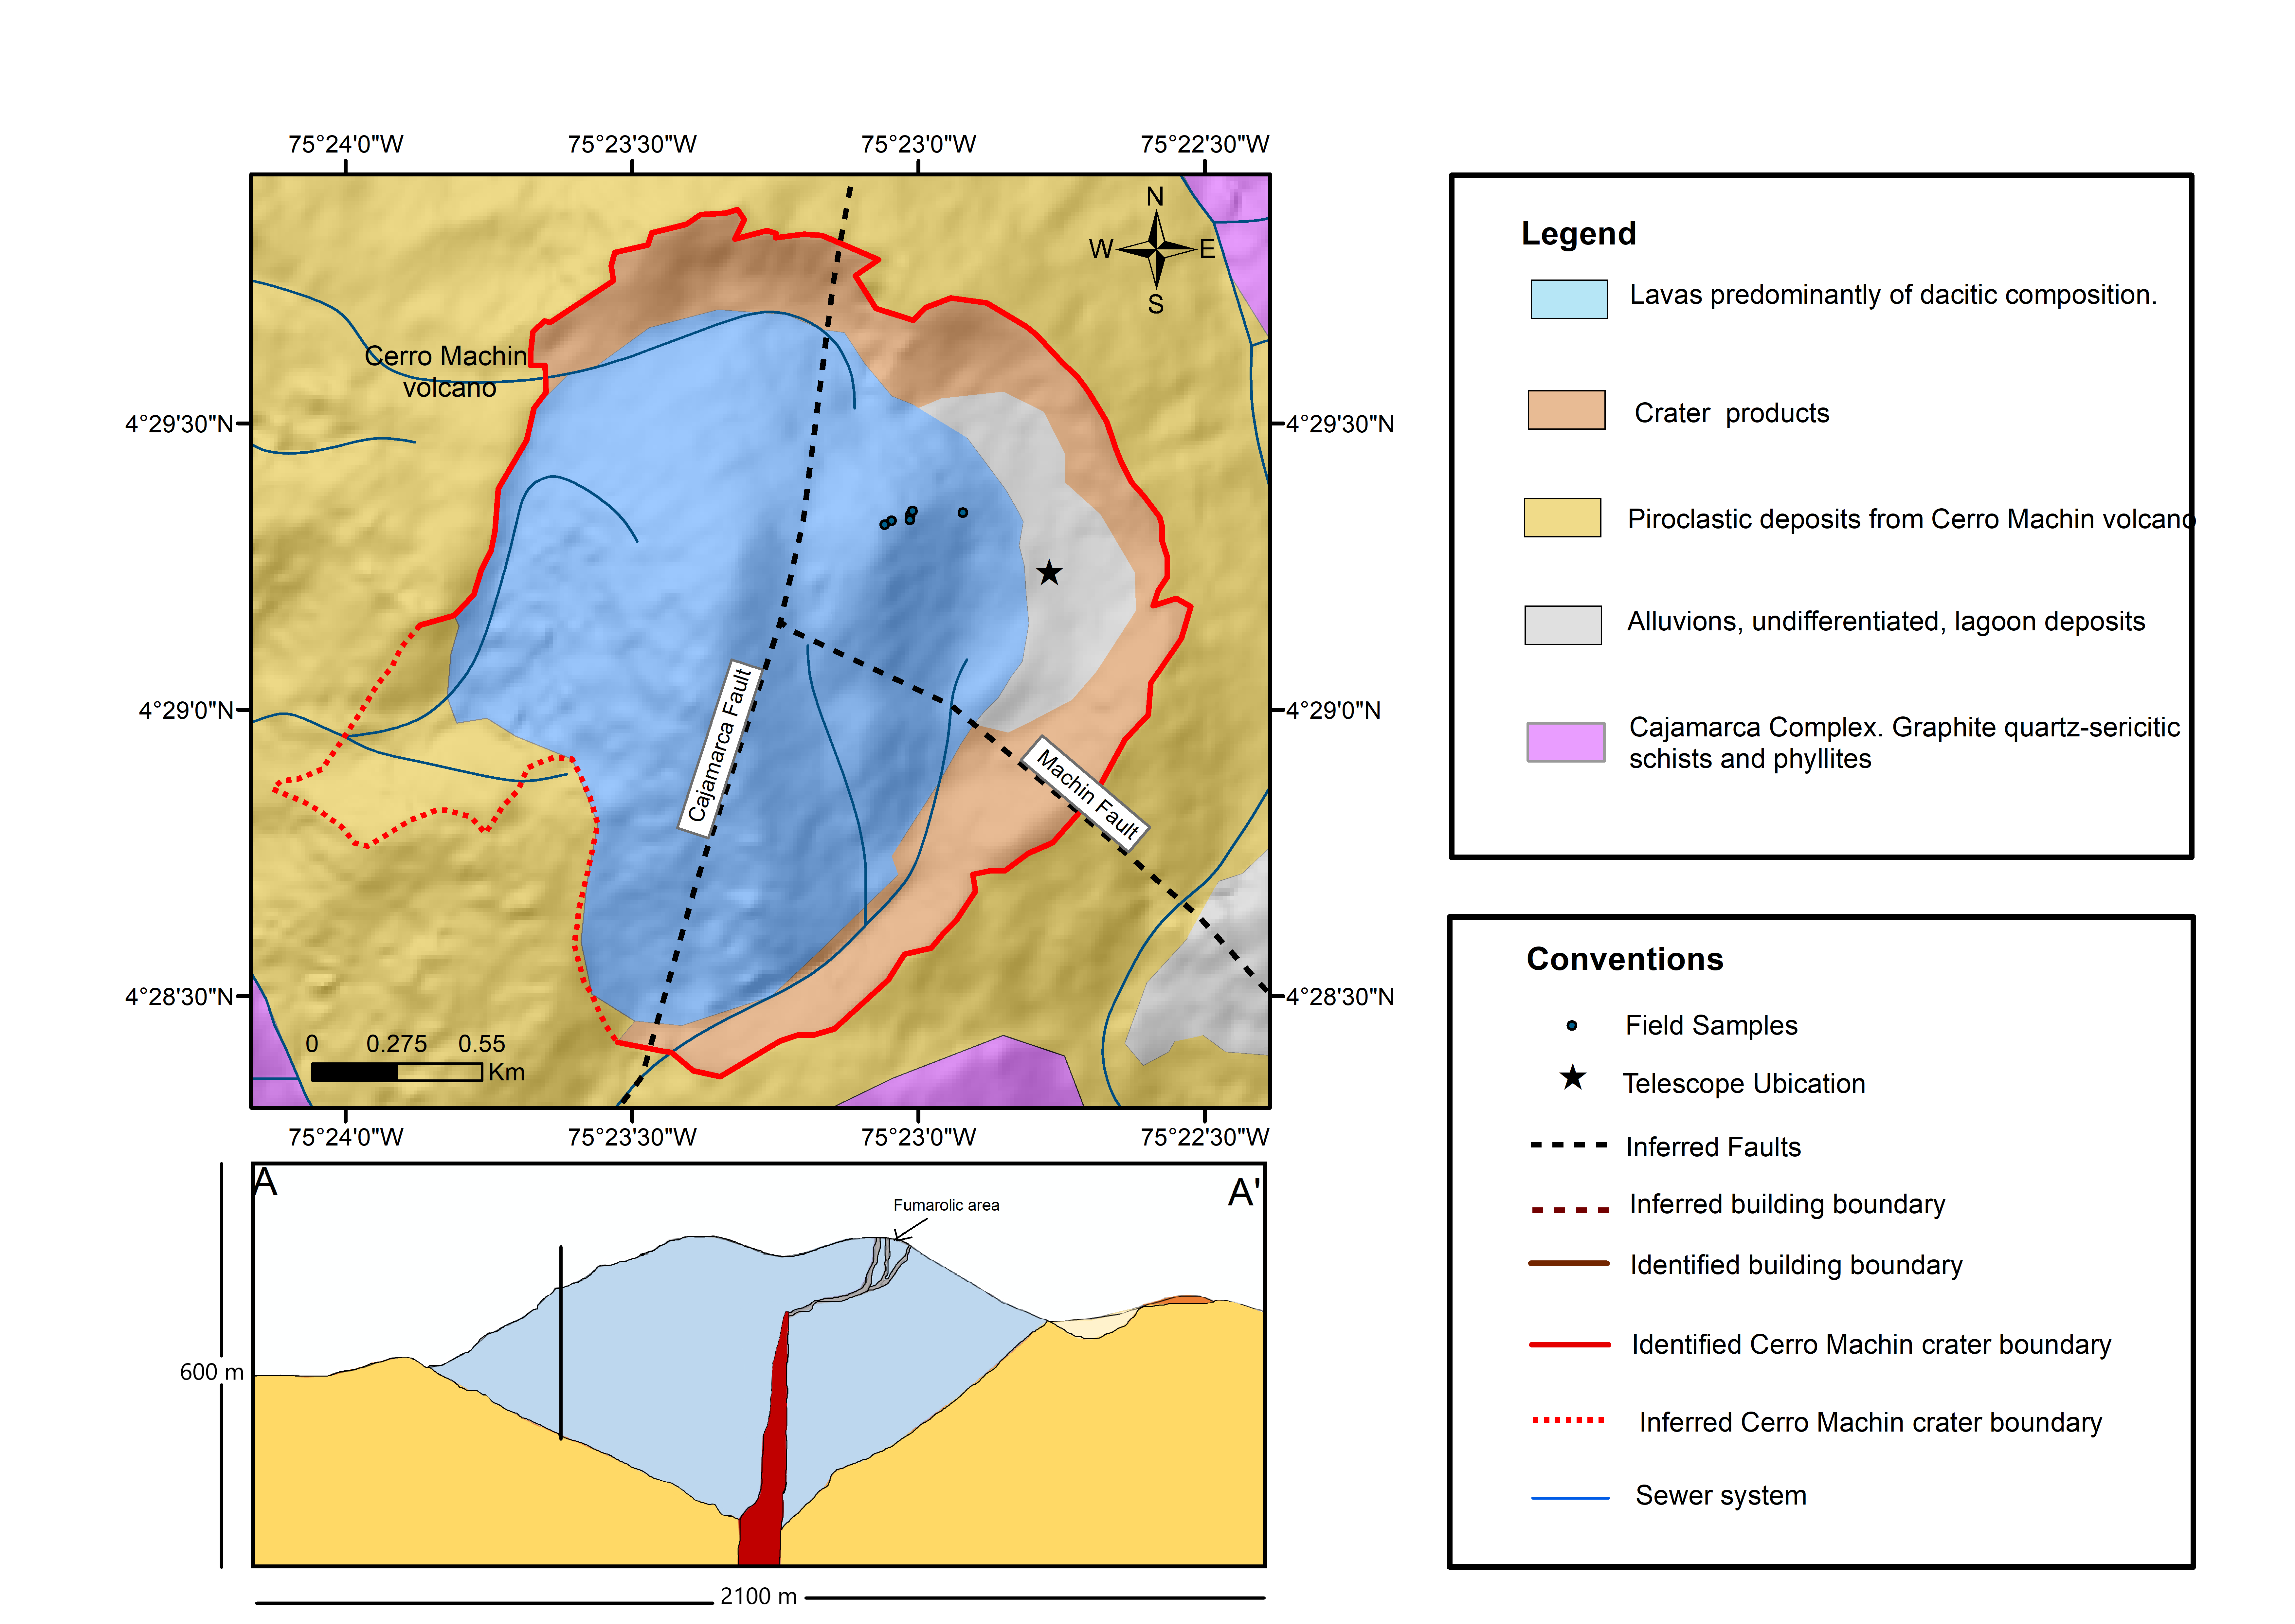
We are mainly interested in the density contrasts that could exist in the dacitic dome of the Machín because muons are not coming from below the horizon. To better understand the complex geology and structure of the region, other researchers have conducted integrated geophysical studies of Cerro Machín. For example, in studies as described (Inguaggiato et al., 2017; Londoño and Dionicio, 2011) it is estimated that the volcano has at least two magmatic chambers located at depths of km- km and km - km. However, since several faults cross the volcano, it is believed that there is an interaction between tectonic and volcanic activity (Londono, 2016). The chemical and isotopic compositions found in the thermal samples reported in (Inguaggiato et al., 2017) supports the existence of a heat source that induces vaporisation of shallow thermal fluids of meteoric origin, releasing vapour in the upper part of the dome and feeding boiling water to the springs at its base.
| Sample | Density (g/cm3) |
|---|---|
| (dark grey, unweathered dacitic) | |
| (dark grey, slightly weathered dacitic) | |
| (light grey, slightly weathered dacitic) | |
| (light grey, slightly weathered dacitic) | |
| fragment (light beige, weathered dacitic) | |
| fragment (light beige, weathered dacitic) |
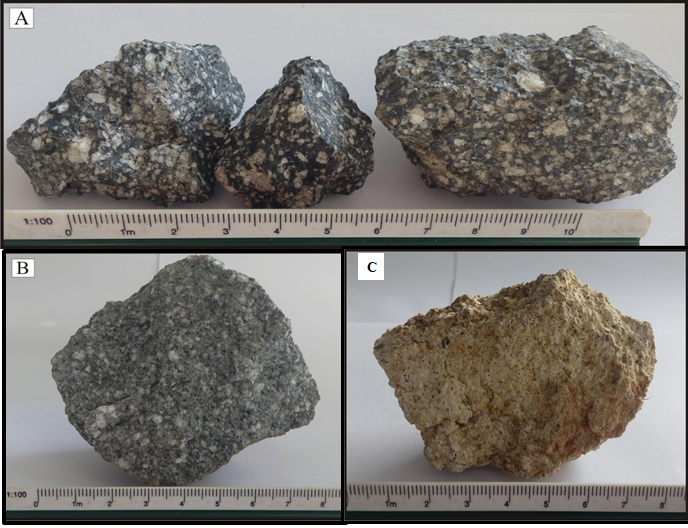
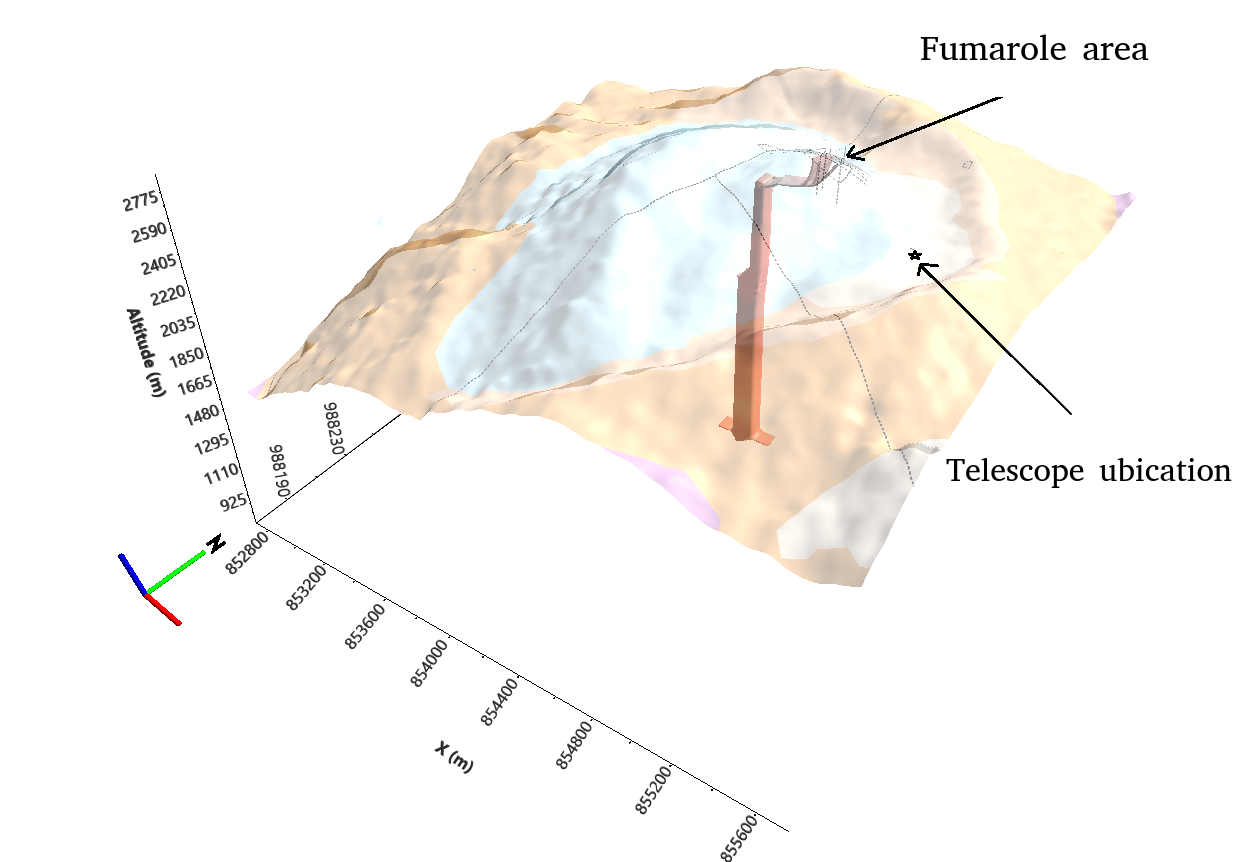
Table 2 lists the density of rock samples taken from the hillside of the Machín volcano and complementing our 3D geophysical density model. Accordingly, the lava dome has three main areas characterised by different densities, as shown in figure 4. An area associated with unweathered dacitic rock with a density of g/cm3. A second and third area ( and , respectively) with samples related to the fumarolic field with densities between g/cm3 - g/cm3.
3.2 Forward modelling
The forward modelling provides an initial estimation of the number of muons, crossing the volcanic structure (as described above in figure 5), and impinging on the telescope. To determine the muon flux emerging from the Cerro Machín volcano and impacting the instrument, we used three main elements: the open sky Reyna-Bugaev muon energy spectrum model (Lesparre et al., 2010; Bugaev et al., 1998; Reyna, 2006), the specific topography of the volcanic dome area, with the density distribution model and the energy losses schema for transmitted muons through matter. The modelling consists of several steps described below.
In the next sections we describe in details the forward modelling pseudo-code diplayed in the Appendix A, table 3.
3.2.1 The open sky muon flux
As an input we use the Reyna-Bugaev differential parametric muon flux model (Lesparre et al., 2010; Bugaev et al., 1998; Reyna, 2006),
| (1) |
with and the momentum verifying,
| (2) |
The parameters considered are: , , , and (Reyna, 2006). This semi-empirical and simple parametric model is valid for a wide energy range ( GeV GeV) and zenith angles, and particularly for low energy muon fluxes.
In this paper, we use this simplified model for the atmospheric muon flux to focus on the density profile reconstruction using SAA. However, in other studies (Vesga-Ramírez et al., 2020; Asorey et al., 2015, 2018c; Sarmiento-Cano et al., 2020) we employed more accurate Monte Carlo simulations of muons using CORSIKA (Heck et al., 1998) and MagnetoCosmic (Desorgher, 2003) codes to generate more realistic atmospheric showers.
3.2.2 Distances travelled by muons through the volcanic edifice
The second stage is to estimate the distance travelled by muons in the volcano. This estimation includes the calculation of both the opacity of the material and the minimum energy required by muons to cross the geological structure. The opacity of the material, determined by using the distances travelled by muons in the volcanic edifice, is associated with the mass density distribution integrated along the muon path as
| (3) |
where is a distance along the muon path through the geological edifice, is the total distance travelled by muons in rock and the average density along the muon trajectory.
We have modelled the muon energy loss along each path considering a uniform density distribution as
| (4) |
where is the muon energy, and depend on the rock composition/properties and is the density integrated along the trajectory of the muons (the opacity defined by equation (3)). As stated above, the prevalent type of rock in the Cerro Machín Volcano dome is dacitic, mainly quartz () with a density of g/cm3.
The coefficients and are obtained from the report of the Particle Data Group (Olive et al., 2014)666Tables on: http://pdg.lbl.gov/2011/AtomicNuclearProperties/ , where the function represents the energy loss due to ionization, while takes into account the contribution of radiative energy losses due to bremsstahlung, pair production and nuclear interactions.
With the muon energy losses, it is possible to determine the minimum muon energy needed to cross a certain opacity , given by
| (5) |
where is the muon rest energy, given in equation (2).
Finally, solving this equation we obtain the minimum energy necessary for a muon to cross a given thickness of rock (see figure 6). This model largely agrees with detailed simulations of muon flux in atmospheric showers and accurate muon transport through the rock (Lesparre et al., 2010).

3.2.3 The integrated muon flux
The integrated muon flux, , after crossing a certain thickness of rock, can be estimated from the differential muon flux as
| (6) |
Figure 7 displays the integrated muon flux impinging on the detector after passing through a pre-defined thickness of rock in a volcano at different zenith angles. We have chosen to consider the rock thickness less than m to ensure a statistically significant measurement of muon flux over a period of a few months.

3.2.4 The instrument acceptance
Finally, detailed knowledge of the instrument capabilities is essential in estimating the number of muons which cross the structure and impact the telescope (Lesparre et al., 2012b). The acceptance function (, measured in cm sr) is one of the key features to take into account because it converts the integrated flux onto the number of detected muons as
| (7) |
where is the integrated flux (measured in cmsrs-1), the acceptance function (measured in cmsr), the recording time, and represents the opacity parameter.
Let us consider two impacted pixels in the two panels by the same impinging muon. In the front panel the pixel is labeled as and in the rear panel as . The subscripts and indicate the position in each detector matrix of pixels and range from found at one corner to located at the opposite corner. Thus, we can identify different particle trajectories, , shared by the same relative position, and (Lesparre et al., 2010).
The acceptance is obtained multiplying the detection area, , by the angular resolution, , i.e.
| (8) |
where represents each discrete muon incoming direction.
The acceptance and the corresponding number of impinging muons detected are a function of the telescope’s geometrical parameters such as the number of pixels in the panels (), size of pixels (), and separation of detection surfaces ().
Figure 8 displays the angular resolution and acceptance function for the MuTe hodoscope with scintillator bars, size of pixel cm and cm. The total angular aperture of the telescope (considering both panels and the WCD) with this configuration is roughly ( rad) with a maximum solid angle of sr at , and the largest detection area approximating cm2 sr at (see reference (Peña-Rodríguez et al., 2020) for details).


3.2.5 The numbers of detected muons
As shown in the next section, the input for the geophysical inversion should be the distribution of observed muons. Therefore, for the present work we use as “observed” number of muons those coming from a simulation described in the forward modelling having a known inner density configuration.
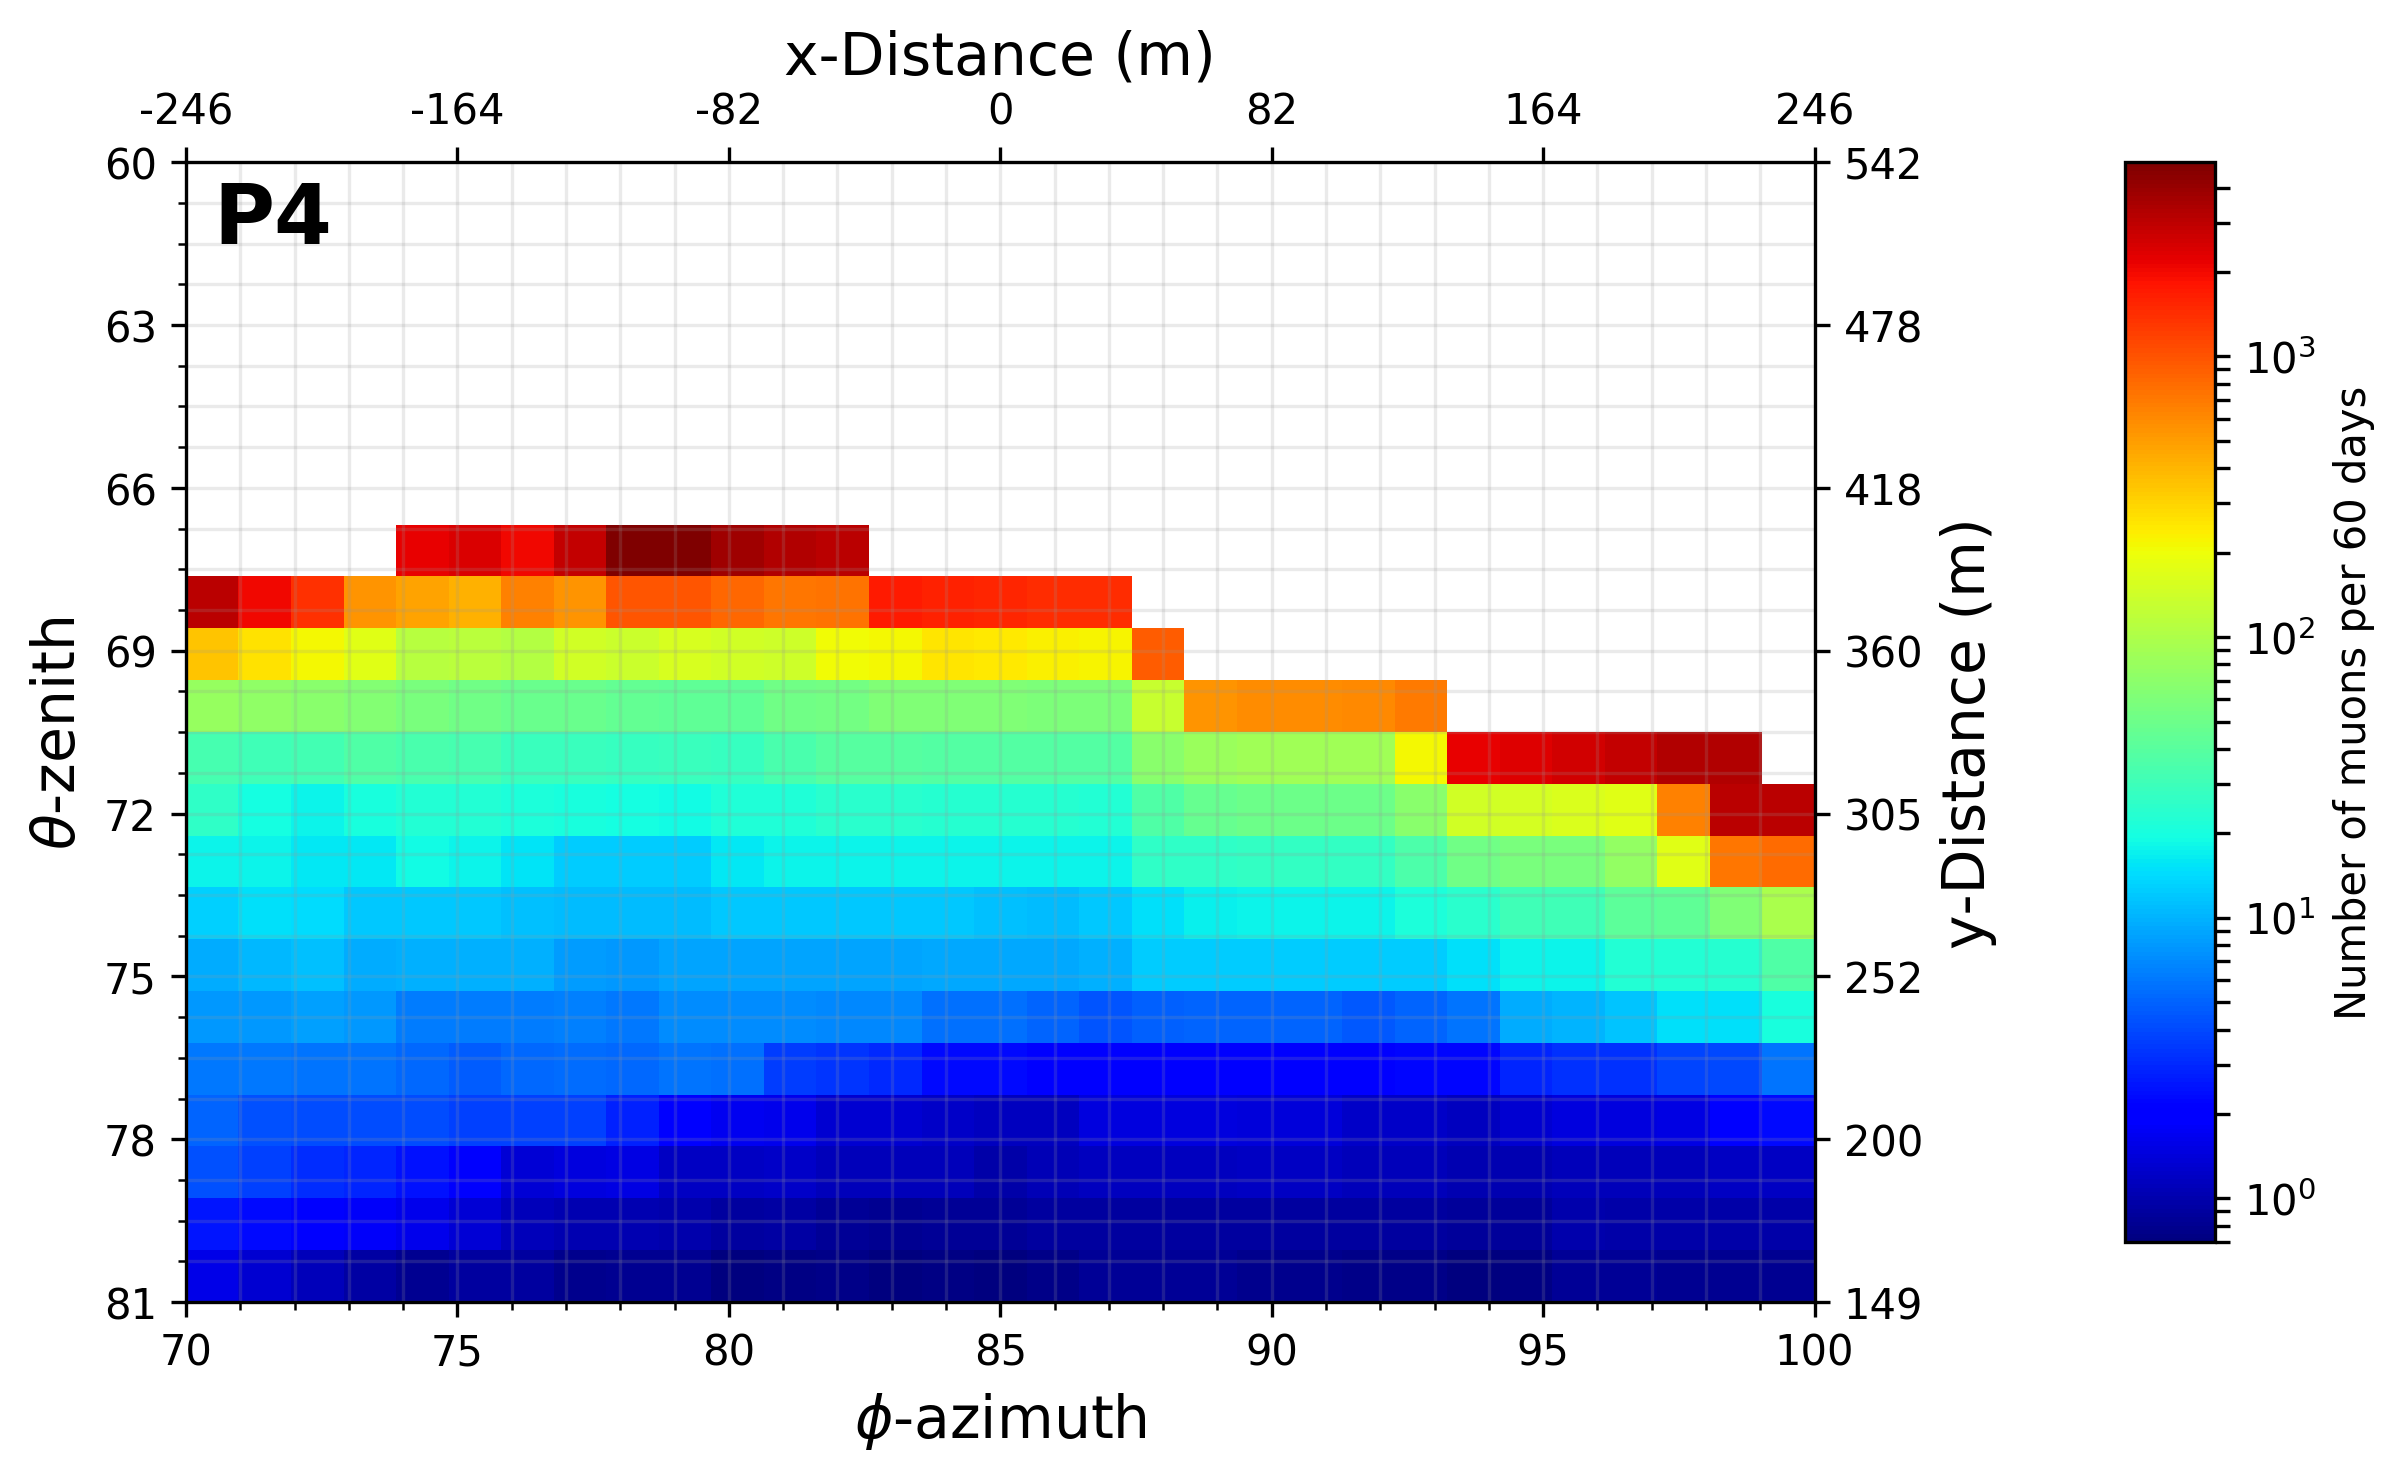
In figure 9 we present the distribution of , collected at the observation point No. , from all possible directions, during a time-lapse of days. The average muon flux obtained is muon/pixel, reaching muon/pixel from the centre of the volcanic structure. If we define the maximum observed depth where the emerging muon flux is less than 10-2 muons per cm2 per day –with a zenith angle – then we can only explore inner structures up to the depth of m from the top of the volcano (Vesga-Ramírez et al., 2020).
4 The geophysical inversion
Different studies (Lesparre et al., 2012a; Davis et al., 2011; Rosas-Carbajal et al., 2017; Lelièvre et al., 2019) discuss the problem of geophysical inversion in muography in combination with other complementary techniques. In this work we present an inversion implementation of muography using the SAA, to find an improved inner density distribution of Cerro Machín volcano.
The central point with any inversion method is to enhance the modelling with measured information, expressing the differences between the recorded and modelled data in terms of a real number known as a cost. The idea of this strategy is to find the best model (i.e. a solution), improved by the measured data, which minimizes the cost function.
There are several “local” optimization strategies, schemes like least squares and gradient methods, which start from an initial model and look for other neighbouring solutions. The main problem with the local methods is the possibility to get stuck in a bounded minimum where the cost function does not vary significantly. In contrast, global optimization algorithms systematically explore the variety of possible neighbouring solutions, decreasing the probability in identifying a local minimum instead of a global one. Monte Carlo simulation, genetic algorithm, particle swarm optimization and simulated annealing, search for a minimum value of the cost function choosing new solutions in a stochastic way.
In this work, we adopted SAA because of its simplicity, and excellent results in a wide range of disciplines (Kirkpatrick et al., 1983; Tarantola and Valette, 1982; Gibert and Virieux, 1991; Pessel and Gibert, 2003). For problems when the solution space is small, simulated annealing has a faster time with respect to another global optimization methods (Otubamowo et al., 2012). The name of simulated annealing arises from the physics of annealing in solids when a crystalline solid is heated and later allowed to a prolonged cooling. The final configuration of the solid has the most regular possible crystal lattice layout with minimal energy.
In table 4 within Appendix B, we present the pseudo-code to implement the geophysical inversion applying SAA. We have replicated the idea of solid annealing with the physical temperature , translated into the evolution parameter and implementing the cooling process by decreasing in predefined steps.
The corresponding state of the physical system, is defined by the average density distribution function for all zenithal & azimuthal angles in the observation range. The associated muon number, , and the corresponding cost function , implies a candidate solution to the problem.
As stated above, the input data to SAA is the number of observed muons, , collected at the observation point No. during days and displayed in figure 9. Then the method starts by choosing the initial evolution parameter, , the cooling scheme, , and the initial random average density, .
It is critical to identify the appropriate initial evolution parameter and to select it. We have followed the statistical approach discussed in reference (Weber, 2000), which can be written as:
| (9) |
where stands for an average of the square of the cost function for different s and models, while represents the square of the average of cost function for the same sample of s and s. In Appendix C, we sketch a modified SAA to calculate these averages from different values of s and s. The algoritm generating samples to select the initial parameter, , is essentially the SSA, but suppressing all executions loops.
The cooling scheme, , i.e. the way the temperature decreases, is also crucial and we set it as
| (10) |
which is very common in several other SAA implementations (Peprah et al., 2017; Mahdi et al., 2017; Cabrera et al., 2014; Khairuddin and Zainuddin, 2019).
The initial random average density, –for all possible emerging volcano trajectories– is taken from a list of equal spaced values within the typical density range for volcanic rocks, i.e. g/cm3 to g/cm3. Next, we estimate the simulated number of muons impacting each pixel of the telescope and calculate the initial cost function , the difference between the number of muons “observed” , and those obtained from the initial simulated data ; where denotes the norm of a vector space.
Now, for each step in the evolution parameter , we generate a random neighbour state of the system for all azimuth and zenith angles in the observation range. Then we calculate an random average density, , its associated number of muons and the corresponding cost function for this neighbouring model, .
If , the difference in the cost function for this neighbour model is less or equal to zero, we accept the system state, i.e. the , its resulting muon number, , and the associated cost function as a candidate solution; otherwise the model is not rejected but admitted with a probability given by the Metropolis’s statistical criterion (Metropolis et al., 1953). Thus, we calculate the probability
| (11) |
compare it with a random number and accept the new state of a system if and if not, reject it.
Before decreasing the evolution parameter, , we perform several iterations to refine the obtained model based on the Metropolis’ criterion. Next, is reduced, and the cycle is repeated until reaching the final value, typically: .
5 Implementing the inversion
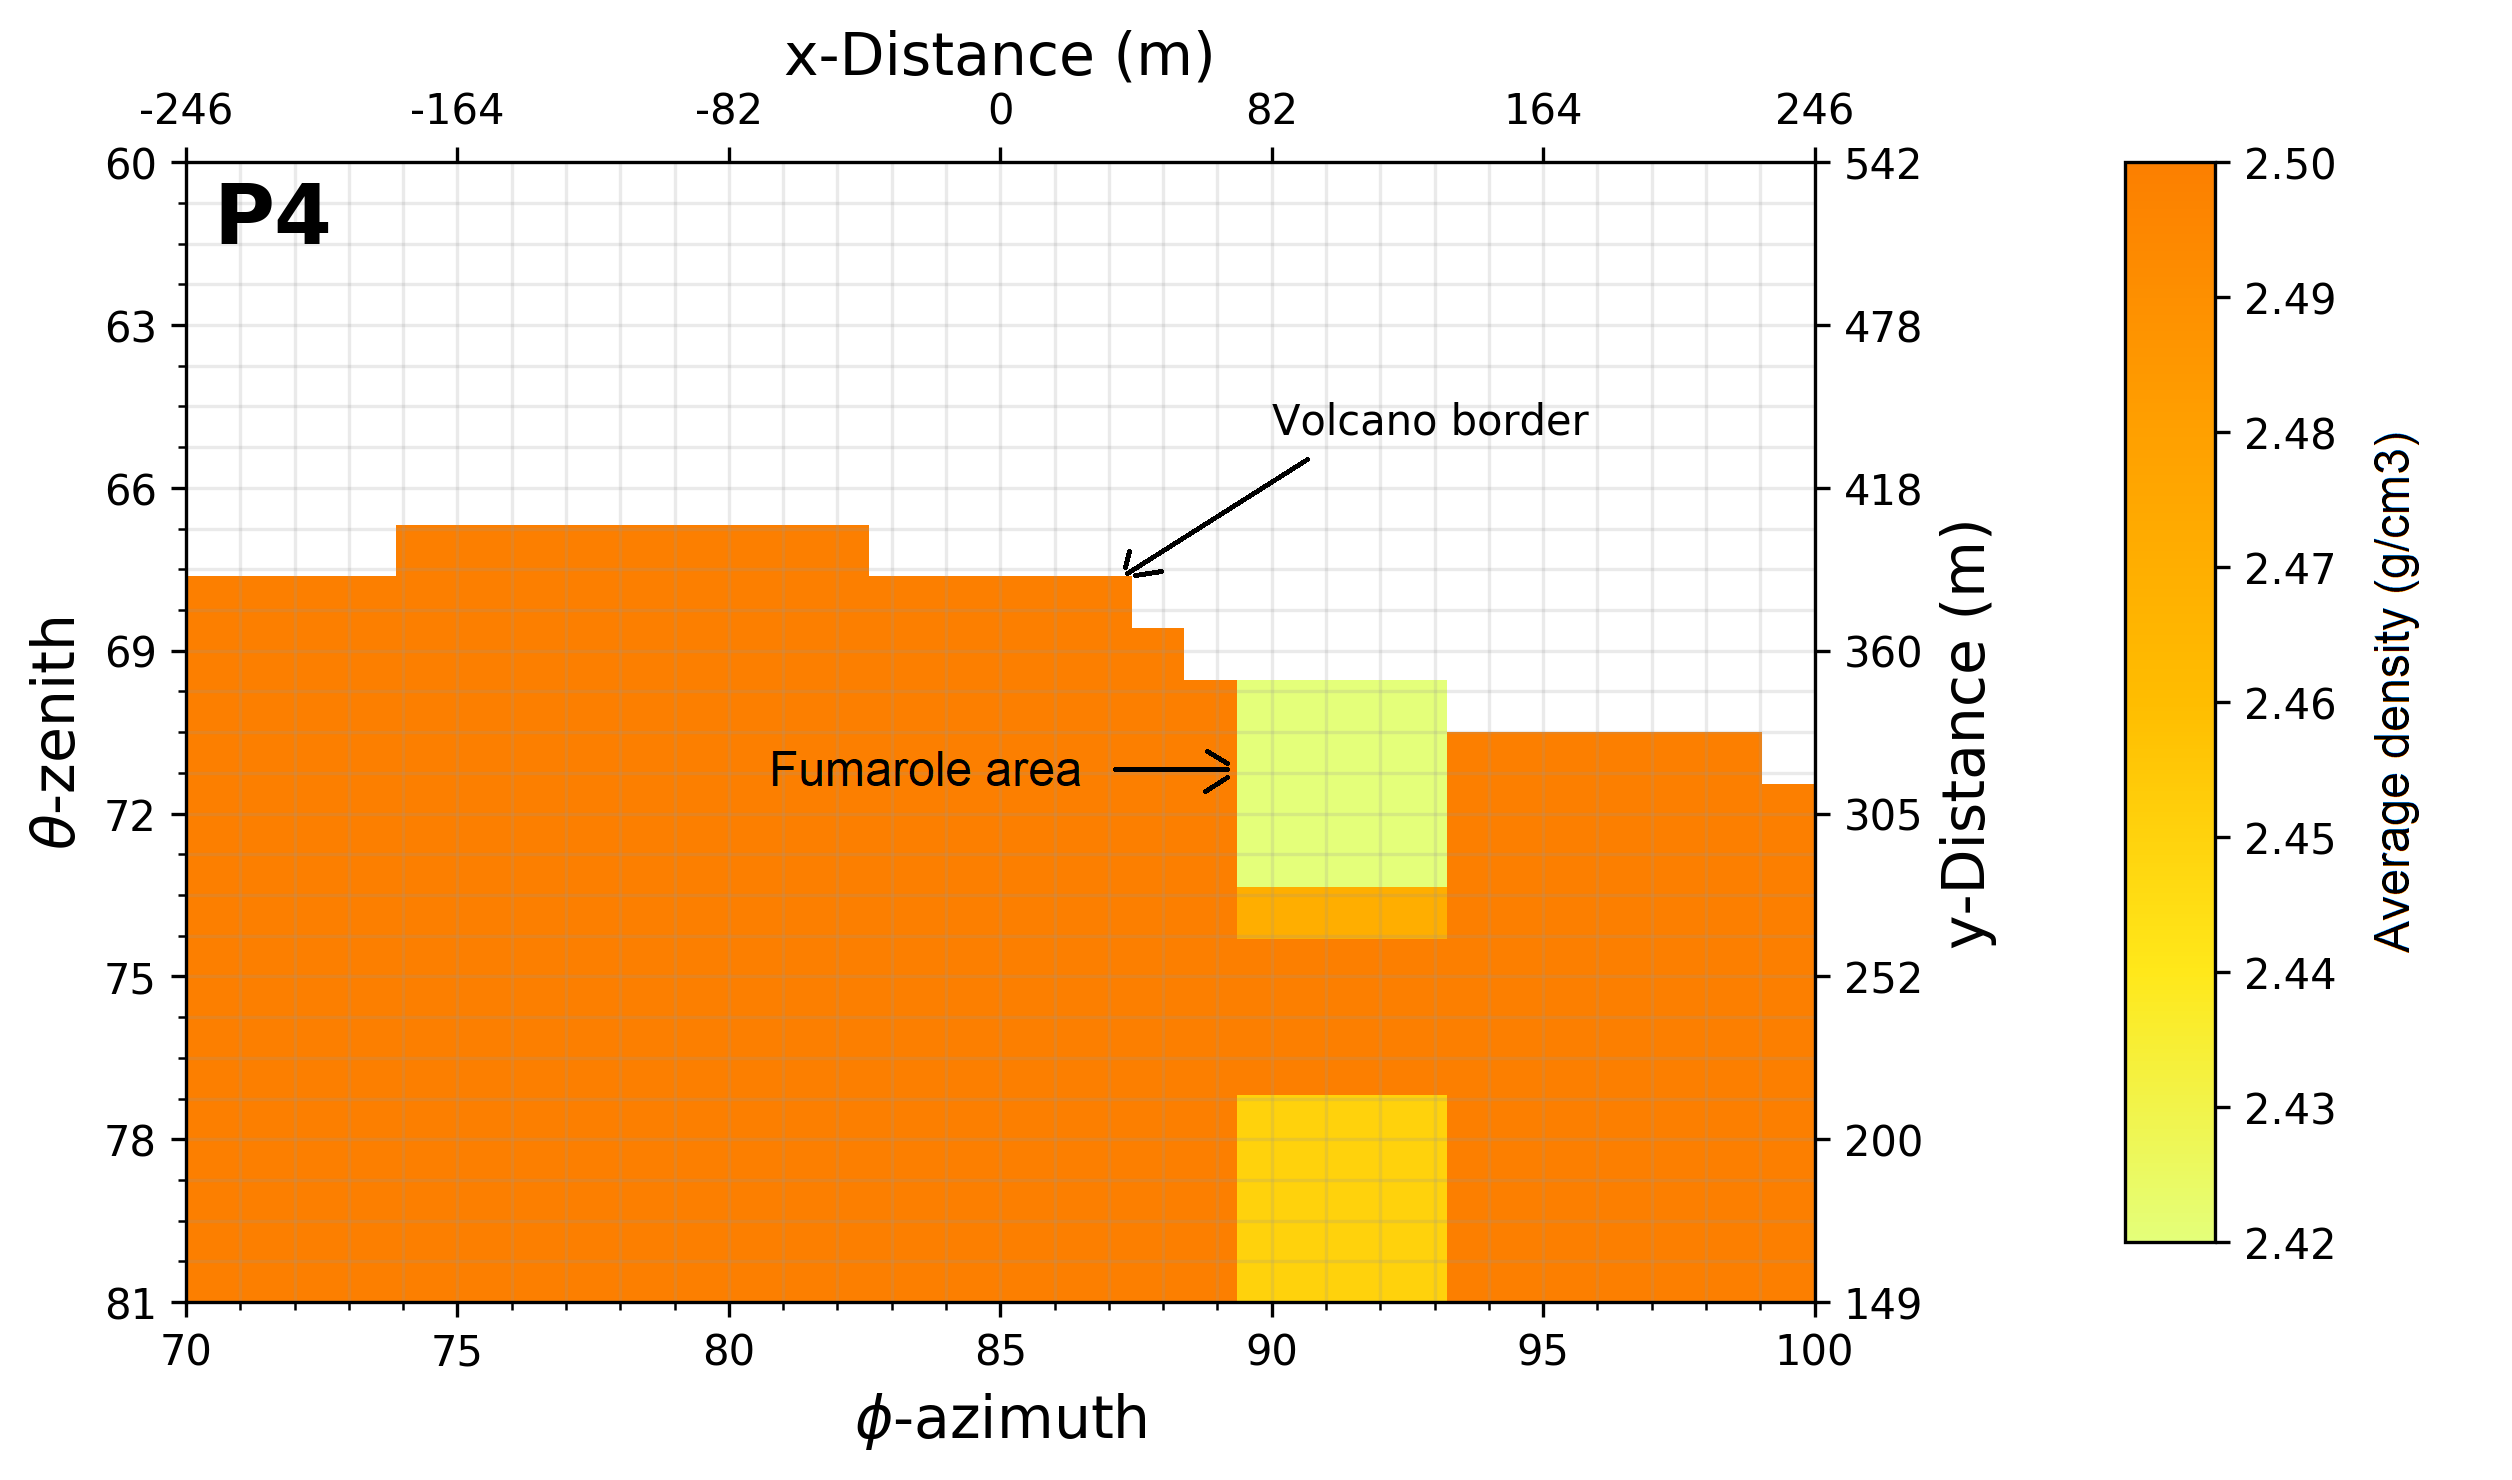
As discussed in section 3, shown in figure 5, and in the left plate of figure 12, the proposed Cerro Machín density model consists of a dacitic lava dome with an active boiling fumarole chimney in the summit area of the central dome with its fumarole duct. As for the density model, we have divided the dacitic dome into cubes ( m m m) using a digital elevation model with a resolution of m . The duct of m2, with a density of g/cm3, could contribute to the gas escape in the zone.
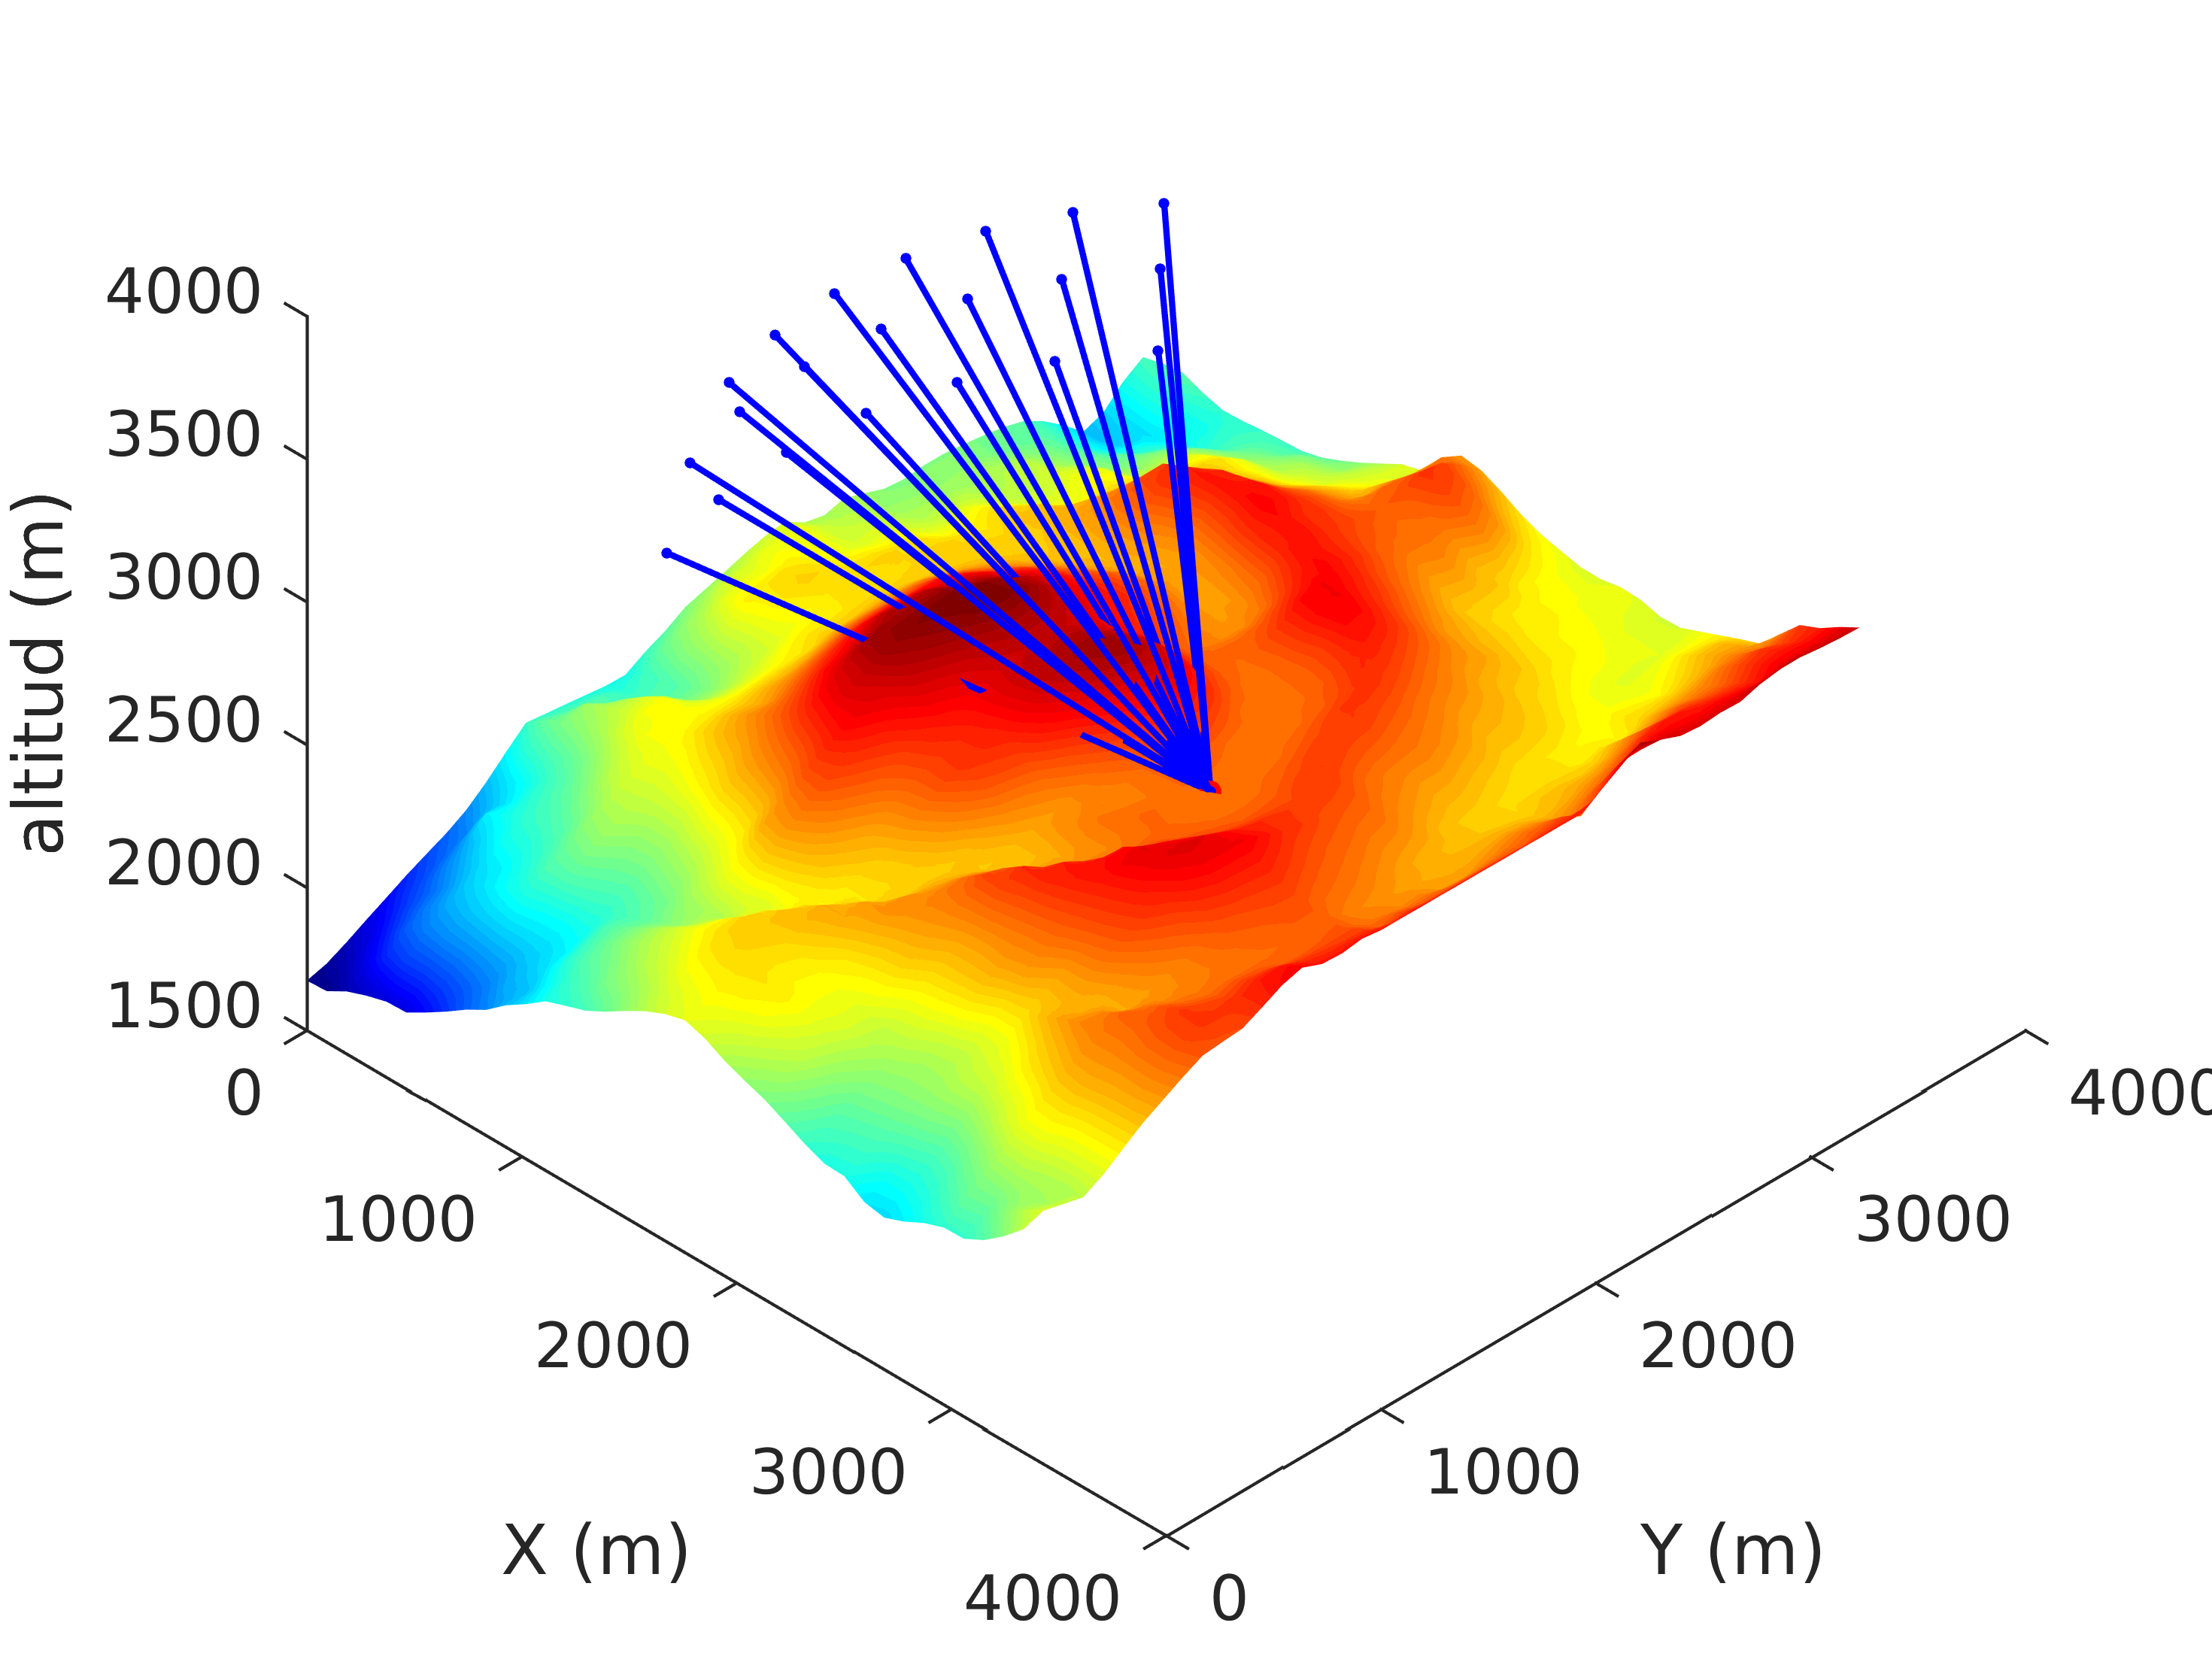
With the above geophysical density distribution pattern, our forward modelling was implemented simulating the muon flux data crossing and reaching observation point No. at the base of the Cerro Machín, m from the centre of the volcanic edifice (see figure 10, Table 1 and reference (Vesga-Ramírez et al., 2020)). The thickness of rock traversed by muons as a function of the direction of arrival is shown in figure 10, where it is seen that the maximum length travelled by muons is m.
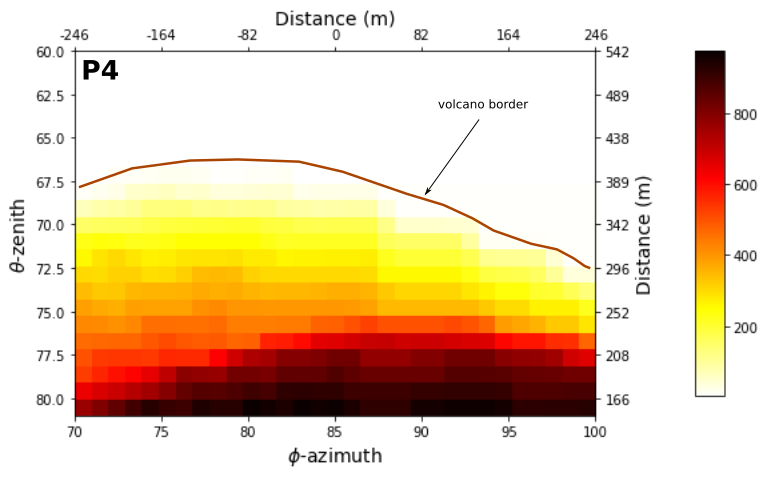
The “typical observation” time scale is days, with the pixel hodoscope, having an inter-panel distance of cm. We set a minimum statistic threshold count of muons/pixel so as to obtain images with a resolution of pixel. Notice that there are regions where the incoming muon flux is absorbed due to the volcano’s geometry, and some of the distances travelled could easily exceed meters. The statistics of muons/pixel for the above MuTe configuration is consistent with other more realistic studies ( see references (Vesga-Ramírez et al., 2020; Vásquez-Ramírez et al., 2020; Peña-Rodríguez et al., 2020; Moss et al., 2018) for further details).
From equation (10), we set and from (9) we choose obtained from a sample of cases obtained after executing the modified SAA sketched in Appendix C.
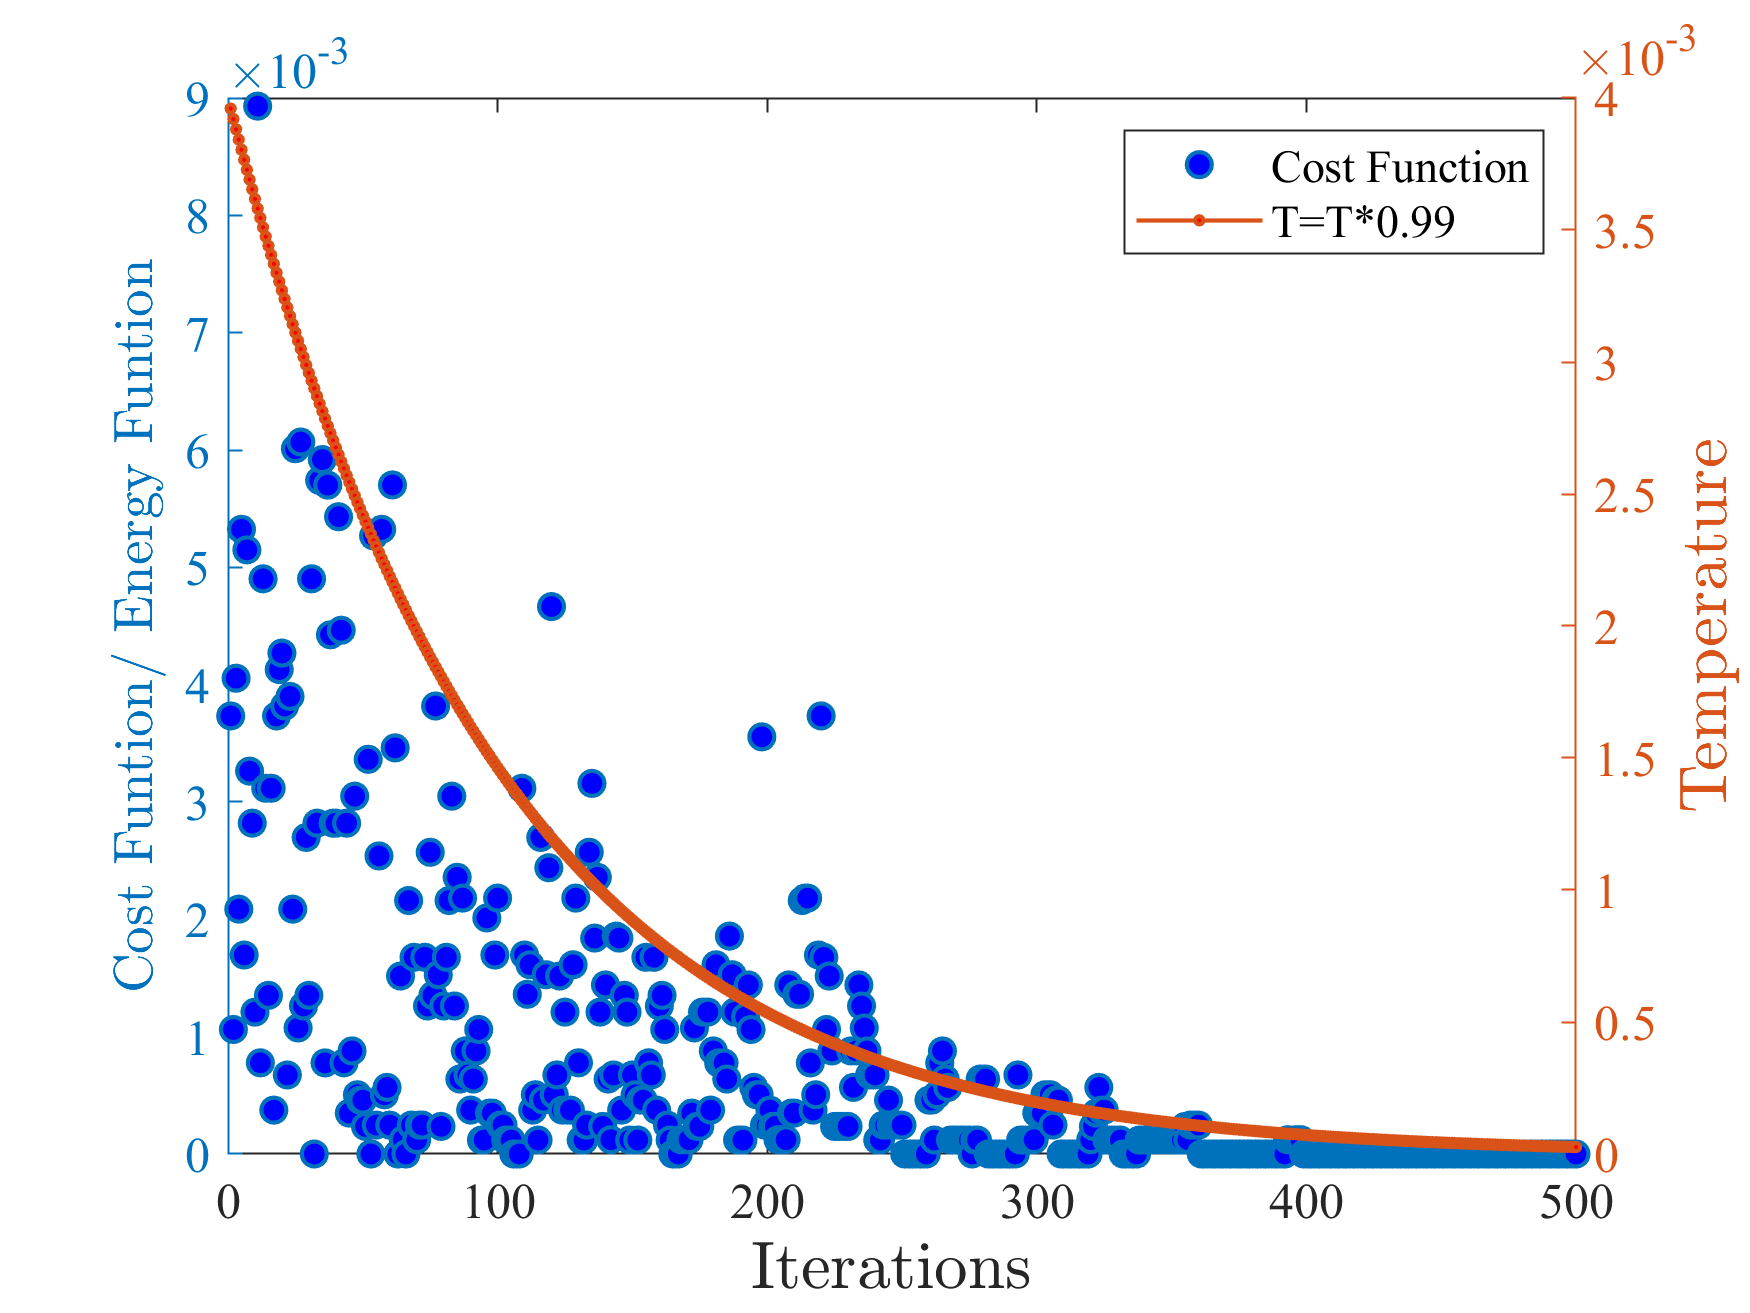
Then, we performed the geophysical inversion following the SAA obtaining the best density profile, which minimizes the cost function between the simulated and the “observed” muon numbers. In figure 11 we display the evolution of the optimization process, i.e. the decrease of the cost value –as well as the “temperature” parameter – as a function of the number of iterations. It is worth mentioning that each blue dot has an additional refinement of in the SAA execution.
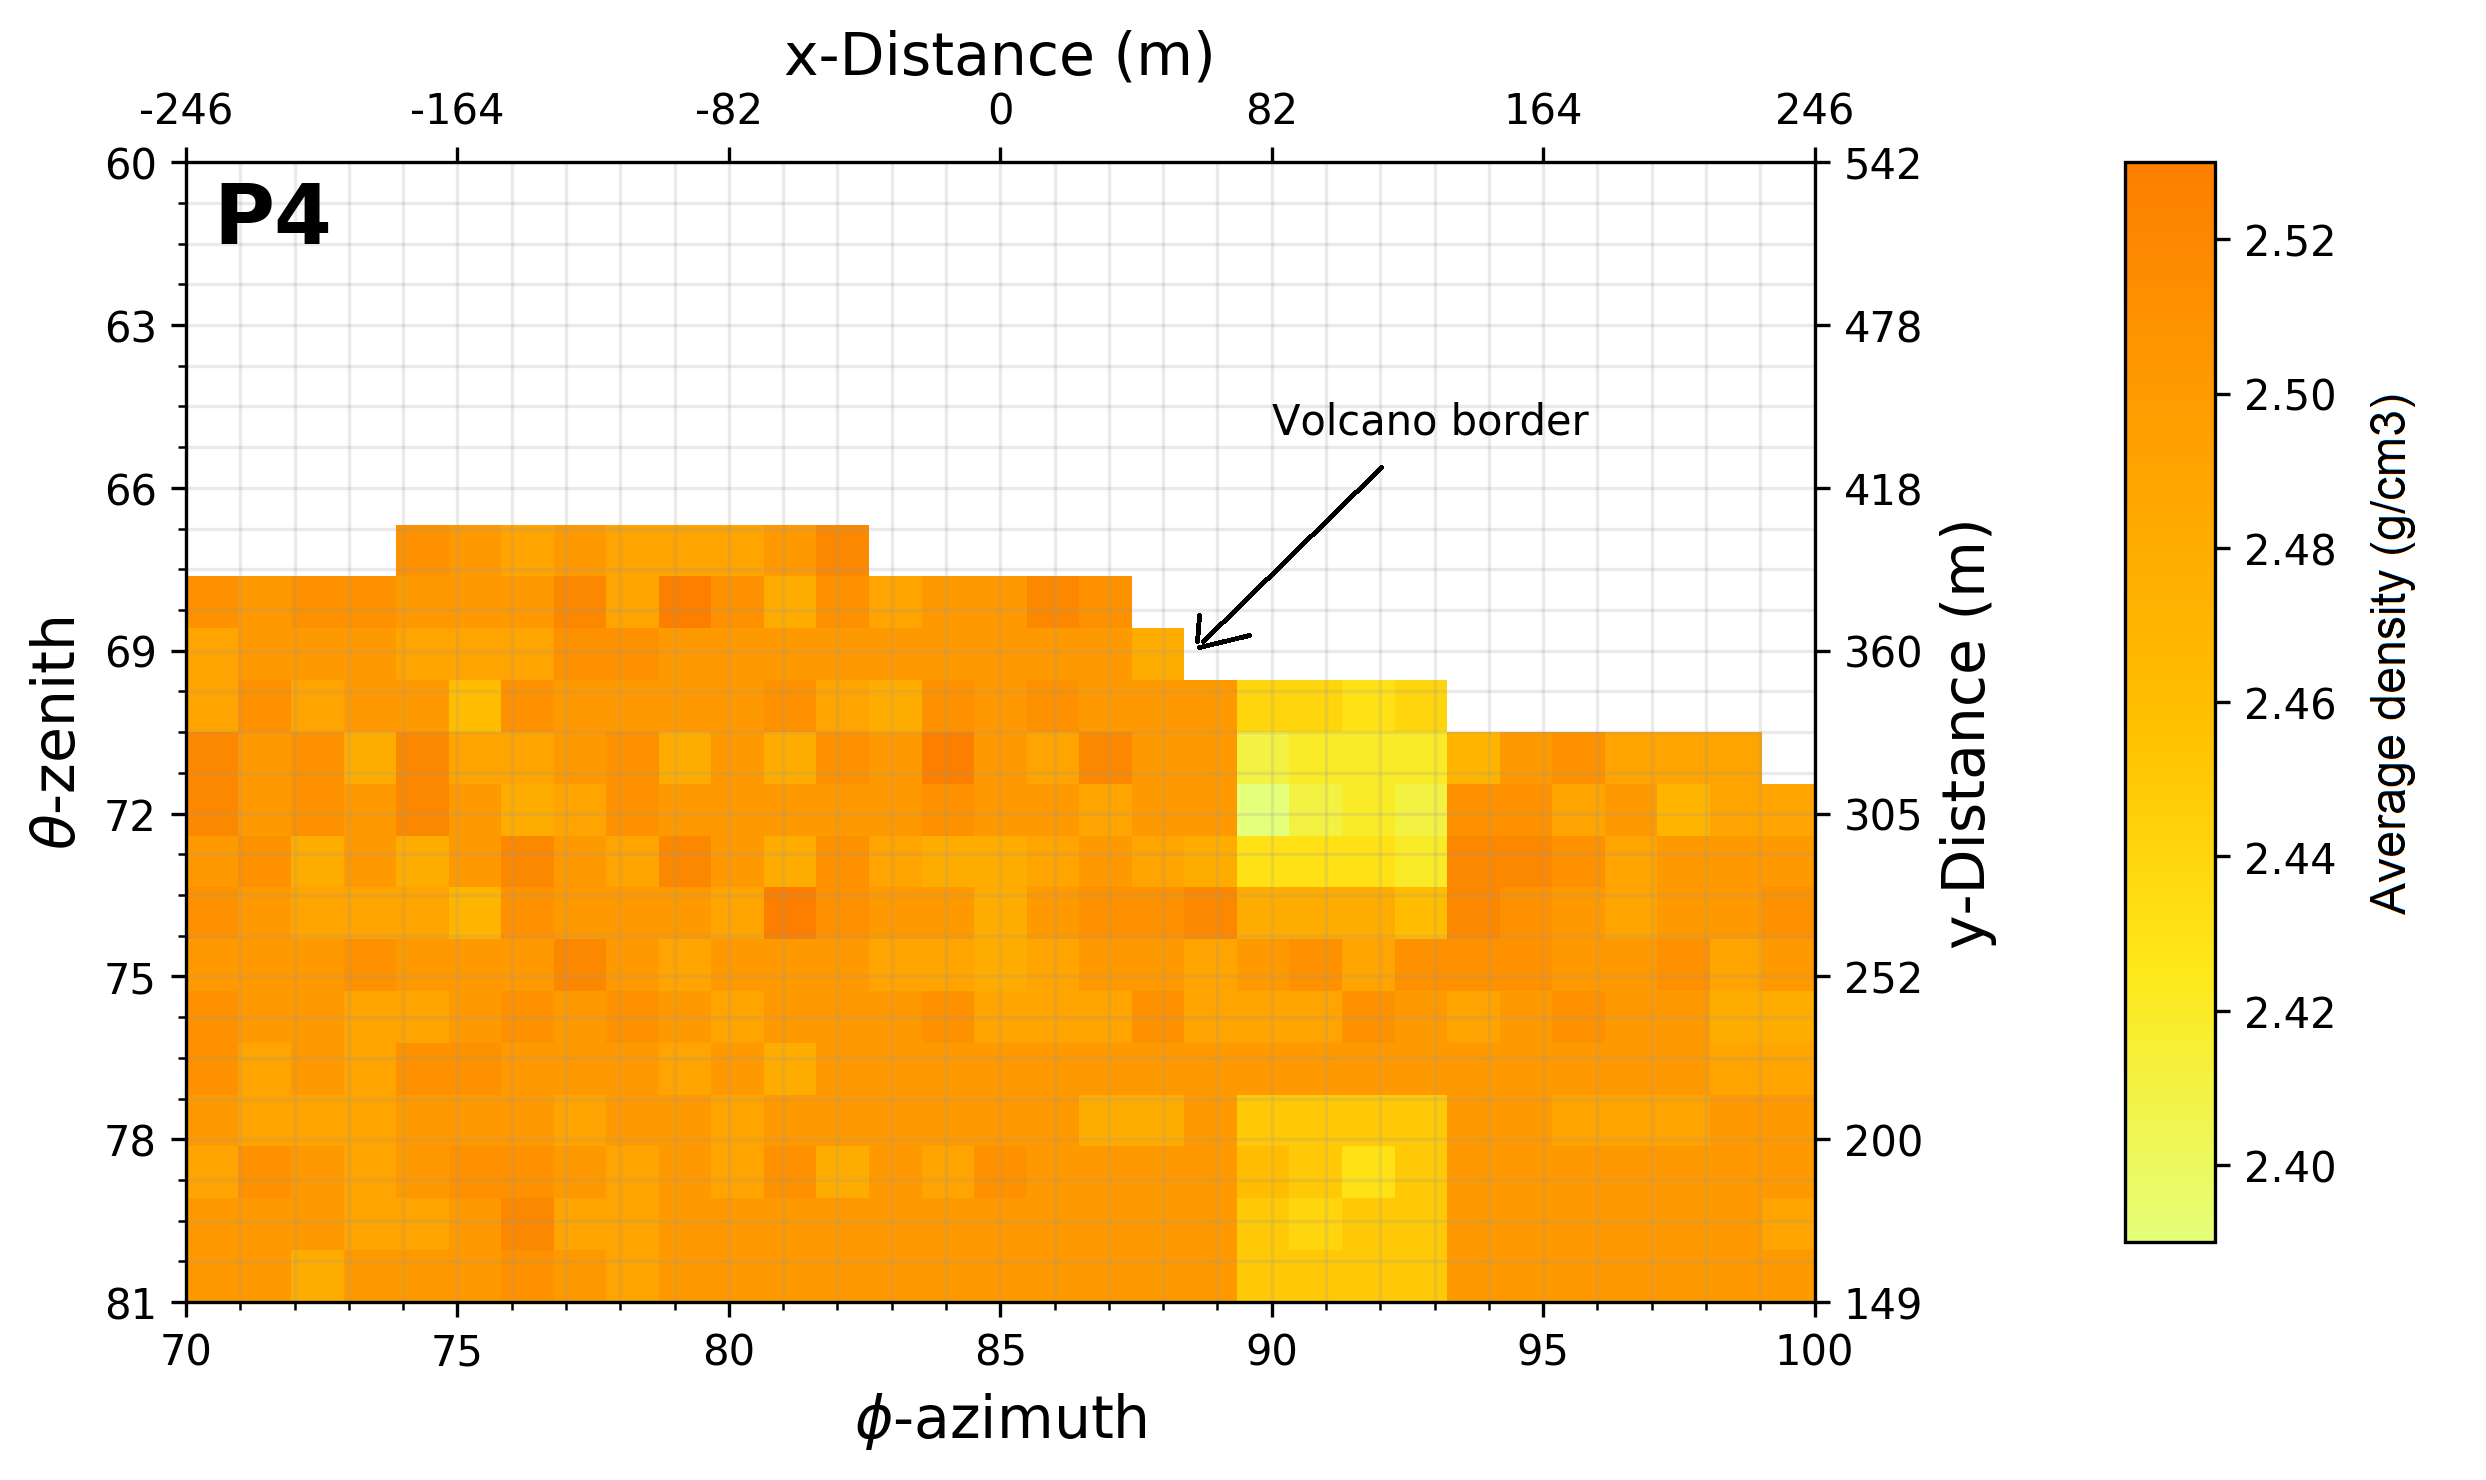
The internal density models of Cerro Machín volcano before and after the inversion are shown in figure 12. The left plate illustrates the initial density profile as seen from observation point No.4. It is a density model consisting of a dacitic lava dome with a density of g/cm3, and an active boiling fumarole duct of m2, with a density of g/cm3, (see section 3.2, figure 5, and left plate of figure 12). Notice, the contrast of densities between volcanic conduit and the surrounding rock. The left panel of this figure displays the best model obtained from the inversion.
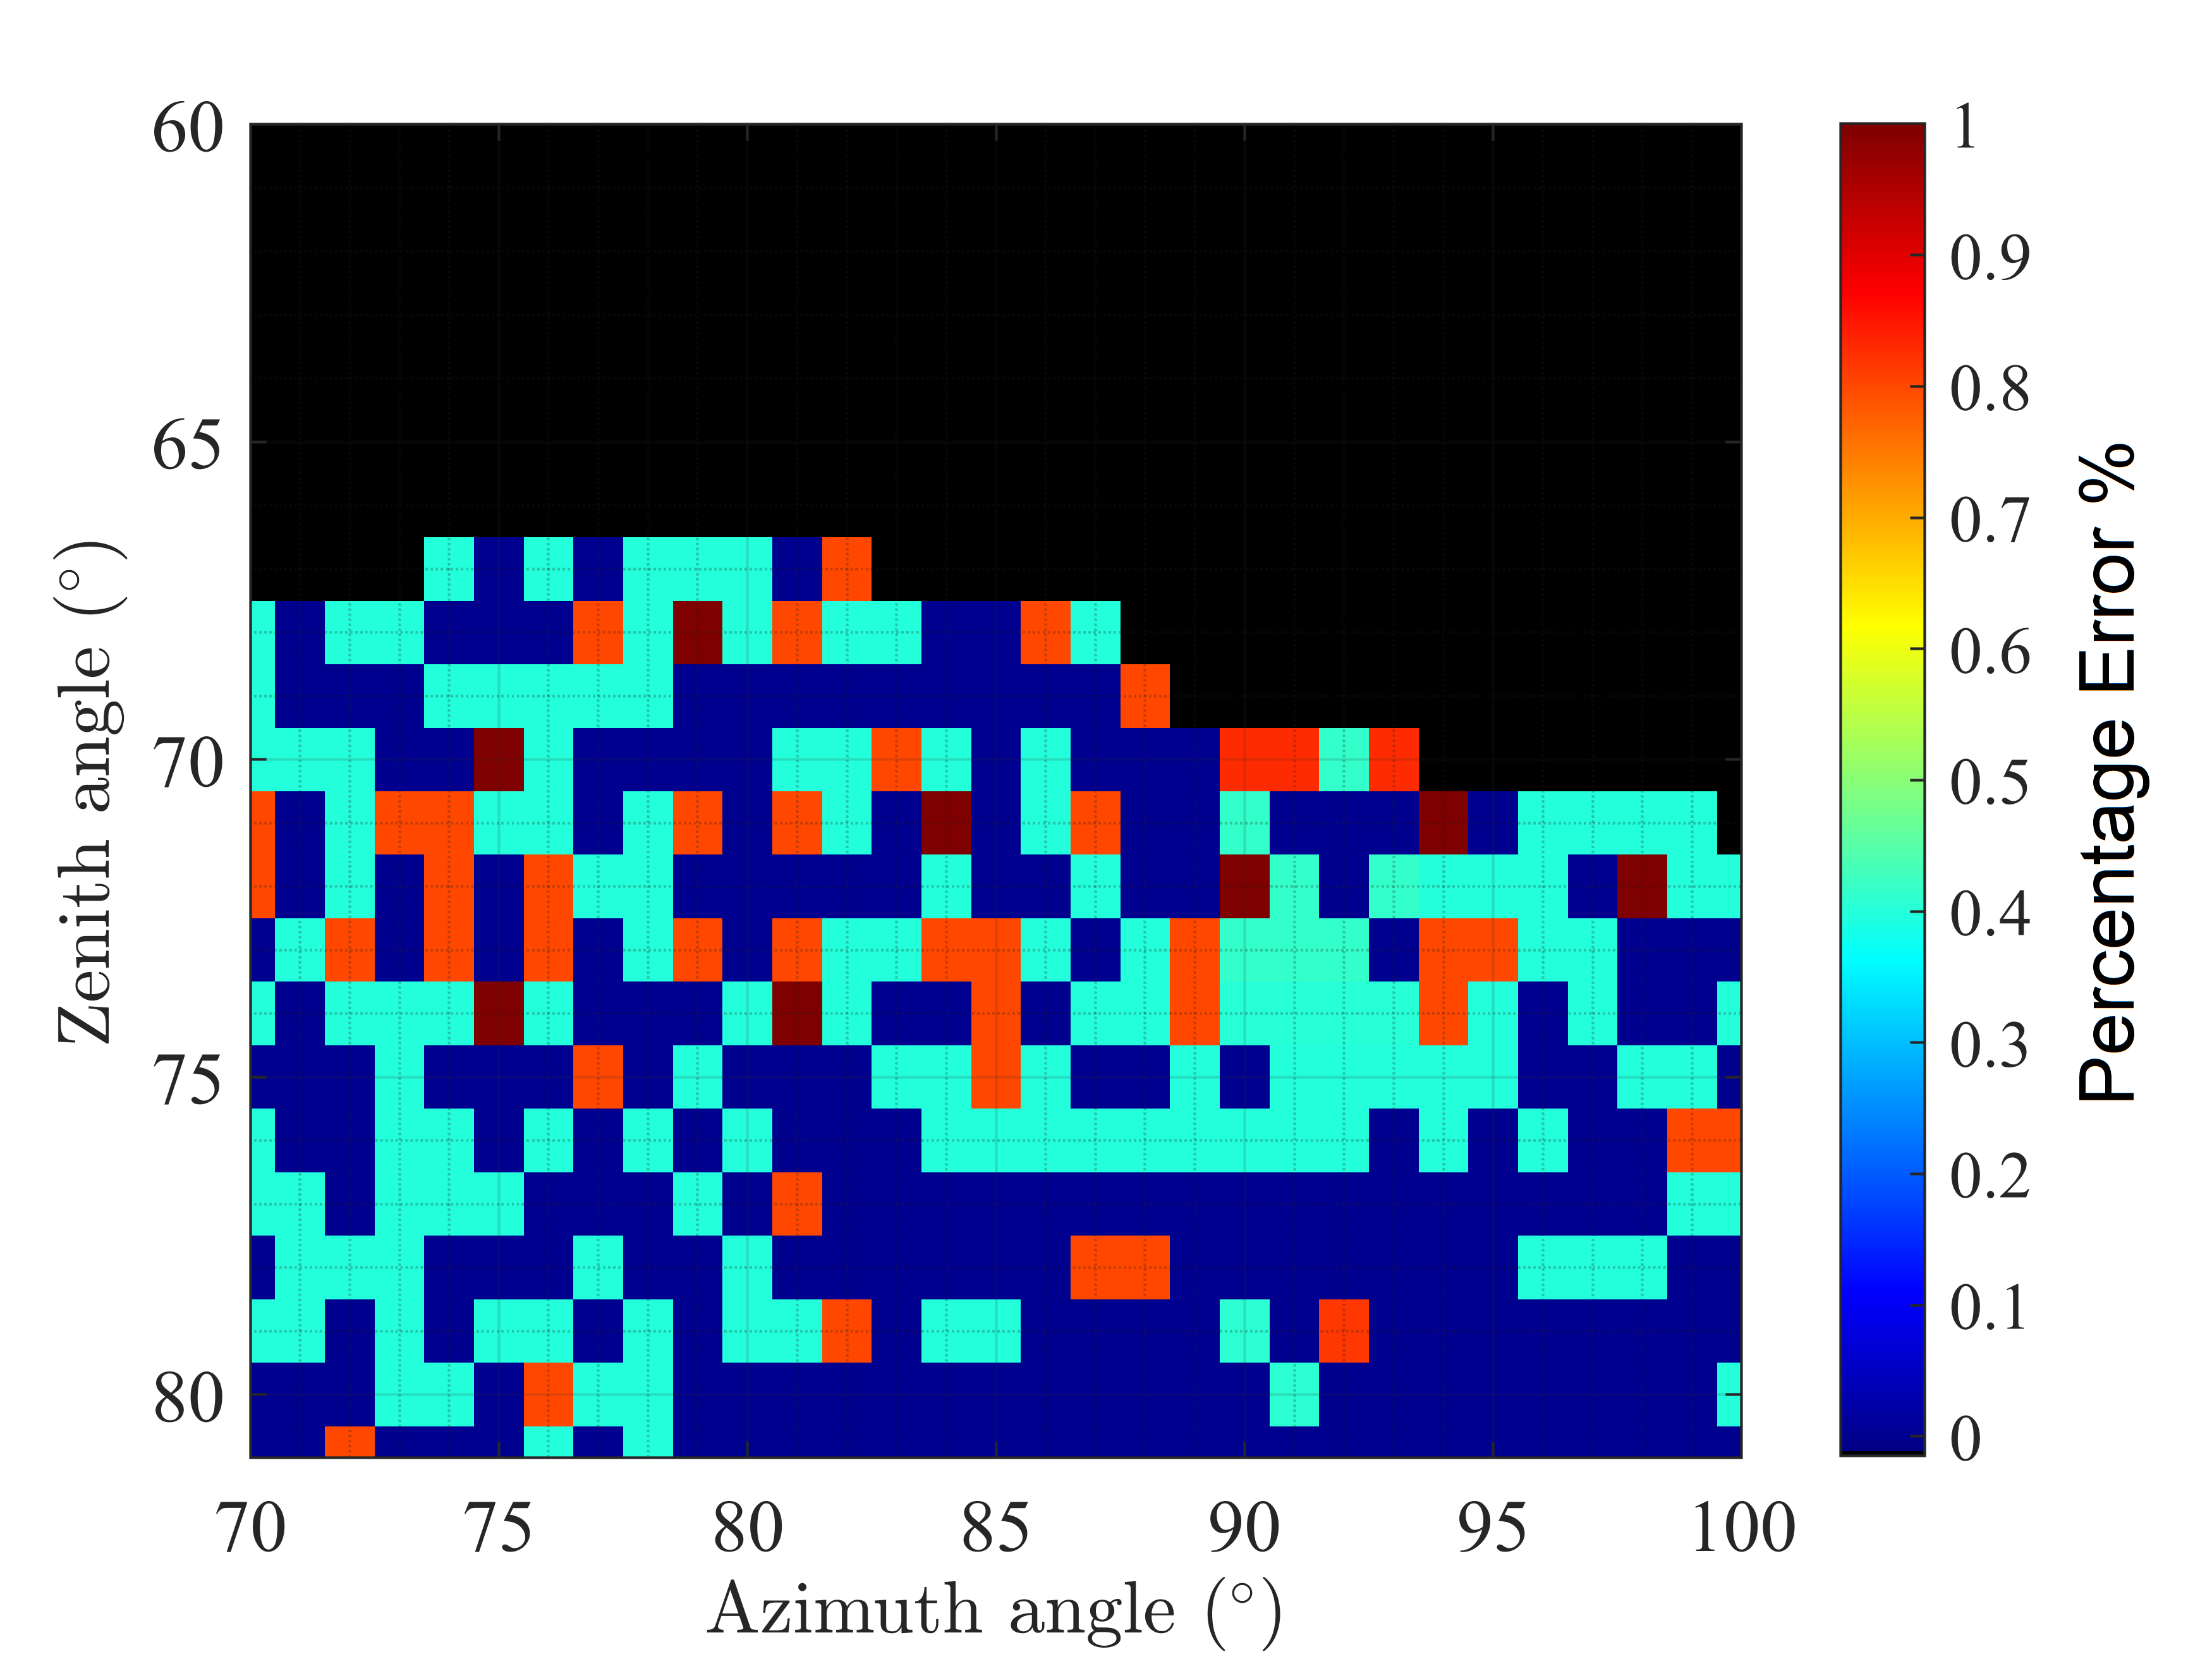
Strictly, the algorithm should be implemented starting from the detected muon number at the observation point and not from a density profile. However, because we have simulated this number of muons, we can know the precise density profile (displayed in the left plate of figure 12) and compare it with the one obtained from the inversion process. While the test scenario is synthetic, it employs a full volcano model, built from existing geological information, including the data density information collected from the field. The resulting density profile also showed a marked contrast between the volcanic duct, the embedding rock and the fumarole zone. As shown in figure 13, the obtained outcome is consistent with the known “observed” density model, having a maximum relative error of %.
6 Conclusions
The present work details an example of the Metropolis-Simulated-Annealing algorithm for the muon radiography technique. It starts from an “observed” muon flux and obtains the best associated inner density distribution function inside the Cerro Machín. This implementation allows the exploration of inner geological structures withing the first meters depth from the top of the volcano.
The estimated initial density model of the dome was obtained with GEOMODELER, adapted to the Cerro Machín topography and taking into account other geological surveys (Inguaggiato et al., 2017; Londoño and Dionicio, 2011; Londono, 2016). We have improved this model by including the rock densities of samples taken from the crater, the dome and the areas associated with fumaroles.
The results of the geophysical inversion technique are essential as they serve as a guide in showing where and how the boundaries of the 3D geologic model may need to be adjusted, so as to address density excesses or deficiencies. In order to increase the geological relevance of geophysical models, we incorporate meaningful geological data into the modelling process to guide it toward a result consistent with the observed geology. One approach that we employed in this study was to use the 3D geologic model as a constraint on the geophysical modelling. The geologic model was generated using multiple geoscience datasets, including geological and structural mapping; interpreted geological sections based on 1:25.000 scale geological maps, and field samples carried out for the project.
The inversion algorithm correctly reconstructed the density differences inside the Machín, within a error concerning our initial simulation model, giving a remarkable density contrast between the volcanic duct, the encasing rock and the fumaroles area. We can obtain this error value because we use a semi-empirical model for impinging atmospheric muons, followed by a calculation of their energy loss passing through the geologic structure. We found the minimum energy needed to cross a pre-defined thickness of rock and estimated the muon flux emerging from the volcanic building.
Future works will focus on improving the spatial coverage to increase the model’s resolution. Furthermore, given the large non-uniqueness of the problem and the limited number of sites for muography in Cerro Machín, we only interpret our model in terms of low- and high-density contrasts. We will also concentrate on the joint inversion with data from other geophysical techniques (i.e. gravimetry, electrical resistivity tomography, among others) which will have the ability to resolve densities depending on the network coverage, with a resolving power rapidly decreasing with depth.
Acknowledgments
The authors acknowledge financial support of Departamento Administrativo de Ciencia, Tecnología e Innovación of Colombia (ColCiencias) under contract FP44842-082-2015 and to the Programa de Cooperación Nivel II (PCB-II) MINCYT-CONICET-COLCIENCIAS 2015, under project CO/15/02. We are also very thankful to LAGO and to the Pierre Auger Collaboration for their continuous support. The simulations in this work were partially possible thanks to The Red Iberoamericana de Computación de Altas Prestaciones (RICAP, 517RT0529), co-funded by the Programa Iberoamericano de Ciencia y Tecnología para el Desarrollo (CYTED) under its Thematic Networks Call. We acknowledge financial support from STFC (UK), grants ST/R002606/1. We also thank the computational support from the Universidad Industrial de Santander (SC3UIS) High Performance and Scientific Computing Centre. Finally, we would like to thank Vicerrectoría Investigación y Extensión Universidad Industrial de Santander for its permanent sponsorship. DSP would like to thank the School of Physics, the Grupo de Investigación en Relatividad y Gravitación, Grupo Halley and Vicerrectoría Investigación y Extensión of the Universidad Industrial de Santander for the support and hospitality during a post-doctoral fellowship.
Appendix A
| input |
| open sky muon flux |
| distance travelled within the volcano |
| and Zenith and Azimuth angle |
| Recording time |
| Begin |
| Start with an average inner density |
| Calculate the opacity |
| Calculate the minimun energy needed to cross |
| Calculate the integrated muon flux |
| Calculate the aceptance based on the muon trajectories |
| Calculate the number of impinging muons |
| End |
Appendix B
| Input from forward modelling |
| number of observed muons |
| Begin |
| Set the initial evolution parameter |
| Generate random number |
| Select the initial simulated density model |
| Estimate the initial number of muons |
| Calculate the initial cost function |
| LOOP for from to with and step The ‘‘cooling’’ process |
| LOOP for from to with step The refinement proces |
| Generate a random number |
| Select a neighbour simulated density model |
| Estimate the number of muons for a random neighbour model |
| Calculate the cost of a random neighbour model |
| Calculate the random model energy difference |
| If |
| then |
| Set as a better density value |
| Set as better number of muons value |
| Set the better cost function value |
| else |
| Calculate the probability for the model admission |
| Generate random number |
| If |
| then |
| EndIf |
| EndIf |
| EndLOOP |
| decrease temperature after several iterations |
| EndLOOP |
| End |
Appendix C
| Begin |
| Set a particular value for the evolution parameter |
| Generatea first random number |
| Select a first density model |
| Estimate the number of muons |
| Calculate the first cost function |
| Generate a second random number |
| Select a neighbour density model |
| Estimate the number of muons for the neighbour model |
| Calculate the cost of the neighbour model |
| Calculate the random model energy difference |
| If |
| then |
| Set as a better density value |
| Set as better number of muons value |
| Set the better cost function value |
| else |
| Calculate the probability for the model admission |
| Generate random number |
| If |
| then |
| EndIf |
| EndIf |
| End |
References
- Agudelo (2016) Agudelo, A., 2016. Informe técnico de actividad de los volcanes Nevado del Huila, Puracé y Sotará, durante el periodo de Diciembre de 2016. Technical Report. Reporte Interno, Popayan, Colombia. Servicio Geológico Colombiano.
- Asorey et al. (2017) Asorey, H., Balaguera-Rojas, A., Calderon-Ardila, R., Núñez, L., Sanabria-Gómez, J., Súarez-Durán, M., Tapia, A., 2017. Muon telescope (mute): A first study using geant4, in: Revista Mexicana de Astronomía y Astrofísica Conference Series, pp. 144–144.
- Asorey et al. (2018a) Asorey, H., Calderón-Ardila, R., Carvajal-Bohorquez, C., Hernández-Barajas, S., Martínez-Ramírez, L., Jaimes-Motta, A., León-Carreño, F., Peña-Rodríguez, J., Pisco-Guavabe, J., Sanabria-Gómez, J., Suárez-Durán, M., Vásquez-Ramírez, A., Forero-Gutiérrez, K., Salamanca-Coy, J., Núñez, L., Sierra-Porta, D., 2018a. Astroparticle projects at the eastern colombia region: facilities and instrumentation. Scientia et technica 23, 391–396.
- Asorey et al. (2018b) Asorey, H., Calderón-Ardila, R., Forero-Gutiérrez, K., Núñez, L., Peña-Rodríguez, J., Salamanca-Coy, J., Sanabria-Gómez, D., Sánchez-Villafrades, J., Sierra-Porta, D., 2018b. minimute: A muon telescope prototype for studying volcanic structures with cosmic ray flux. Scientia et technica 23, 386–390.
- Asorey et al. (2015) Asorey, H., Dasso, S., Núñez, L., Pérez, Y., Sarmiento-Cano, C., Suárez-Durán, M., the LAGO Collaboration, 2015. The LAGO space weather program: Directional geomagnetic effects, background fluence calculations and multi-spectral data analysis, in: The 34th International Cosmic Ray Conference, p. 142.
- Asorey et al. (2018c) Asorey, H., Núñez, L.A., Suárez-Durán, M., 2018c. Preliminary results from the latin american giant observatory space weather simulation chain. Space Weather 16, 461–475.
- Barnoud et al. (2019) Barnoud, A., Cayol, V., Niess, V., Carloganu, C., Lelièvre, P., Labazuy, P., Le Ménédeu, E., 2019. Bayesian joint muographic and gravimetric inversion applied to volcanoes. Geophysical Journal International 218, 2179–2194.
- Barrett et al. (1952) Barrett, P.H., Bollinger, L.M., Cocconi, G., Eisenberg, Y., Greisen, K., 1952. Interpretation of cosmic-ray measurements far underground. Reviews of Modern Physics 24, 133.
- Bonechi et al. (2020) Bonechi, L., D’Alessandro, R., Giammanco, A., 2020. Atmospheric muons as an imaging tool. Reviews in Physics 5, 100038.
- Bugaev et al. (1998) Bugaev, V., Misaki, A., Naumov, V., Sinegovskaya, T., Sinegovsky, S., Takahashi, N., 1998. Atmospheric muon flux at sea level, underground, and underwater. Physical Review D 58, 054001.
- Cabrera et al. (2014) Cabrera, C., Fine-Morris, M., Pokross, M., Kish, K., Michalczyk, S., Cahn, M., Klei, H., Russo, M.F., 2014. Dynamically optimizing experiment schedules of a laboratory robot system with simulated annealing. Journal of laboratory automation 19, 517–527.
- Calderón-Ardila et al. (2020) Calderón-Ardila, R., Almela, A., Gómez-Berisso, M., Sedoski, A., Varela, C., Vesga-Ramírez, A., Asorey, H., 2020. Study of spatial resolution of muon hodoscopes for muography applications in geophysics. arXiv preprint arXiv:2006.03165 .
- Cepeda et al. (1995) Cepeda, H., Murcia, L., Monsalve, M., Méndez, R., Núñez, A., 1995. Volcán cerro machín, departamento del tolima, colombia: Pasado, presente y futuro. INGEOMINAS, Informe interno .
- Cortés (2016) Cortés, G., 2016. Informe de actividad volcánica segmento Norte de Colombia Diciembre de 2016. Technical Report. Reporte interno, Manizales, Colombia. INGEOMINAS.
- Cortés (2001) Cortés, G.P., 2001. Estudio geológico de los depósitos de lahar asociados a la actividad eruptiva del volcán cerro machín. Reporte interno, INGEOMINAS, Manizales, Colombia .
- Davis et al. (2011) Davis, K., Oldenburg, D.W., Kaminski, V., Pilkington, M., Bryman, D., Bueno, J., Liu, Z., 2011. Joint 3d inversion of muon tomography and gravity data, in: International Workshop on Gravity, Electrical & Magnetic Methods and Their Applications 2011: International Workshop on Gravity, Electrical & Magnetic Methods and Their Applications, Beijing, China, October 10–13, 2011, Society of Exploration Geophysicists. pp. 81–81.
- Desorgher (2003) Desorgher, L., 2003. MAGNETOSCOSMICS, Geant4 application for simulating the propagation of cosmic rays through the Earth magnetosphere. Technical Report. Physikalisches Institut, University of Bern. Bern, Germany.
- Gaisser (1990) Gaisser, T., 1990. Cosmic rays and particle physics. Cambridge University Press.
- Gibert et al. (2010) Gibert, D., Beauducel, F., Déclais, Y., Lesparre, N., Marteau, J., Nicollin, F., Tarantola, A., 2010. Muon tomography: Plans for observations in the lesser antilles. Earth, planets and space 62, 153–165.
- Gibert and Virieux (1991) Gibert, D., Virieux, J., 1991. Electromagnetic imaging and simulated annealing. Journal of Geophysical Research: Solid Earth 96, 8057–8067.
- González-Garcia et al. (2015) González-Garcia, J., Hauser, J., Annetts, D., Franco, J., Vallejo, E., Regenauer-Lieb, K., 2015. Nevado del ruiz volcano (colombia): a 3d model combining geological and geophysical information, in: Proceedings of the World Geothermal Congress, pp. 1–11.
- Guerrero et al. (2019) Guerrero, I., Cabrera, D., Paz, J., Estrada, J., Villota, C., Velasco, E., Fajardo, F., Rodriguez, O., Rodriguez, J., Arturo, D., Dueñas, D., Torres, D., Ramirez, J., Revelo, J., Ortega, G., Benavides, D., Betancourt, J., Tapia, A., Martínez-Caicedo, D., 2019. Design and construction of a muon detector prototype for study the galeras volcano internal structure, in: J. Phys. Conf. Ser., IOP Publishing. p. 012020.
- Heck et al. (1998) Heck, D., Knapp, J., Capdevielle, J., Schatz, G., Thouw, T., 1998. CORSIKA : A Monte Carlo Code to Simulate Extensive Air Showers. Technical Report FZKA 6019. Forschungszentrum Karlsruhe GmbH.
- Houghton and Wilson (1989) Houghton, B., Wilson, C., 1989. A vesicularity index for pyroclastic deposits. Bulletin of volcanology 51, 451–462.
- Inguaggiato et al. (2017) Inguaggiato, S., Londoño, J.M., Chacón, Z., Liotta, M., Gil, E., Alzate, D., 2017. The hydrothermal system of cerro machín volcano (colombia): New magmatic signals observed during 2011–2013. Chemical Geology 469, 60–68.
- Kaiser (2019) Kaiser, R., 2019. Muography: overview and future directions. Philosophical Transactions of the Royal Society A 377, 20180049.
- Khairuddin and Zainuddin (2019) Khairuddin, R., Zainuddin, Z.M., 2019. A comparison of simulated annealing cooling strategies for redesigning a warehouse network problem, in: Journal of Physics: Conference Series, IOP Publishing. p. 012078.
- Kirkpatrick et al. (1983) Kirkpatrick, S., Gelatt, C.D., Vecchi, M.P., 1983. Optimization by simulated annealing. science 220, 671–680.
- Laeger et al. (2013) Laeger, K., Halama, R., Hansteen, T., Savov, I.P., Murcia, H.F., Cortés, G.P., Garbe-Schönberg, D., 2013. Crystallization conditions and petrogenesis of the lava dome from the 900 years bp eruption of cerro machín volcano, colombia. Journal of South American Earth Sciences 48, 193–208.
- Lelièvre et al. (2019) Lelièvre, P.G., Barnoud, A., Niess, V., Cârloganu, C., Cayol, V., Farquharson, C.G., 2019. Joint inversion methods with relative density offset correction for muon tomography and gravity data, with application to volcano imaging. Geophysical Journal International 218, 1685–1701.
- Lesparre et al. (2012a) Lesparre, N., Gibert, D., Marteau, J., 2012a. Bayesian dual inversion of experimental telescope acceptance and integrated flux for geophysical muon tomography. Geophysical Journal International 188, 490–497.
- Lesparre et al. (2010) Lesparre, N., Gibert, D., Marteau, J., Déclais, Y., Carbone, D., Galichet, E., 2010. Geophysical muon imaging: feasibility and limits. Geophysical Journal International 183, 1348–1361.
- Lesparre et al. (2012b) Lesparre, N., Gibert, D., Marteau, J., Komorowski, J.C., Nicollin, F., Coutant, O., 2012b. Density muon radiography of la soufriere of guadeloupe volcano: comparison with geological, electrical resistivity and gravity data. Geophysical Journal International 190, 1008–1019.
- Londoño and Dionicio (2011) Londoño, J., Dionicio, V., 2011. Tomografía sísmica regional 3d de onda p de la parte central de colombia: Nuevos aportes a la estructura interna de colombia, in: Proceedings of XIII Congreso Colombiano de Geología.
- Londono (2016) Londono, J.M., 2016. Evidence of recent deep magmatic activity at cerro bravo-cerro machín volcanic complex, central colombia. implications for future volcanic activity at nevado del ruiz, cerro machín and other volcanoes. Journal of volcanology and Geothermal Research 324, 156–168.
- Mahdi et al. (2017) Mahdi, W., Medjahed, S.A., Ouali, M., 2017. Performance analysis of simulated annealing cooling schedules in the context of dense image matching. Computación y Sistemas 21, 493–501.
- McNutt (1996) McNutt, S., 1996. Seismic monitoring and eruption forecasting of volcanoes: a review of the state-of-the-art and case histories, in: Monitoring and mitigation of volcano hazards. Springer, pp. 99–146.
- Metropolis et al. (1953) Metropolis, N., Rosenbluth, A.W., Rosenbluth, M.N., Teller, A.H., Teller, E., 1953. Equation of state calculations by fast computing machines. The journal of chemical physics 21, 1087–1092.
- Mosquera (1978) Mosquera, D., 1978. Geología del cuadrángulo k8 manizales. Santa-Fé de Bogotá, INGEOMINAS (Inst. Nac. Invest. geol. miner.) .
- Mosquera et al. (1982) Mosquera, D., Núñez, A., Vesga, J., 1982. Mapa geológico preliminar de la plancha 244, ibagué. Instituto de Investigaciones Geológico-Minero de Colombia 1.
- Moss et al. (2018) Moss, H., Vesga-Ramírez, A., Kudryavtsev, V., Núñez, L.A., Sierra-Porta, D., 2018. Muon Tomography for the Cerro Machín Volcano. Technical Report. Department of Physics & Astronomy, University of Sheffield. Sheffield, United Kingdom.
- Muñoz (2017) Muñoz, E., 2017. Informe mensual de actividad de los volcanes Galeras,Cumbal,Chiles y Cerro Negro, Las Ánimas, Dona Juana y Azufral. Technical Report. Reporte interno, Pasto, Colombia. INGEOMINAS.
- Munoz (1992) Munoz, F., 1992. Local earthquake tomography for lateral velocity variations and hypocenters at Nevado del Ruiz Volcano-Colombia. Ph.D. thesis. MS thesis, Arizona State University, Tempe.
- Murcia et al. (2008) Murcia, H., Hurtado, B., Cortés, G., Macías, J., Cepeda, H., 2008. The~ 2500 yr bp chicoral non-cohesive debris flow from cerro machín volcano, colombia. journal of Volcanology and Geothermal Research 171, 201–214.
- Nagihara and Hall (2001) Nagihara, S., Hall, S.A., 2001. Three-dimensional gravity inversion using simulated annealing: Constraints on the diapiric roots of allochthonous salt structures. Geophysics 66, 1438–1449.
- Nishiyama et al. (2017) Nishiyama, R., Miyamoto, S., Okubo, S., Oshima, H., Maekawa, T., 2017. 3d density modeling with gravity and muon-radiographic observations in showa-shinzan lava dome, usu, japan. Pure and Applied Geophysics 174, 1061–1070.
- Nishiyama et al. (2014) Nishiyama, R., Tanaka, Y., Okubo, S., Oshima, H., Tanaka, H., Maekawa, T., 2014. Integrated processing of muon radiography and gravity anomaly data toward the realization of high-resolution 3-d density structural analysis of volcanoes: Case study of showa-shinzan lava dome, usu, japan. Journal of Geophysical Research: Solid Earth 119, 699–710.
- Okubo and Tanaka (2012) Okubo, S., Tanaka, H., 2012. Imaging the density profile of a volcano interior with cosmic-ray muon radiography combined with classical gravimetry. Measurement Science and Technology 23, 042001.
- Olive et al. (2014) Olive, K., et al., 2014. Review of particle physics. Chinese Physics C 38. doi:10.1088/1674-1137/38/9/090001.
- Otubamowo et al. (2012) Otubamowo, K., Egunjobi, T., Adewole, A., 2012. A comparative study of simulated annealing and genetic algorithm for solving the travelling salesman problem .
- Peña-Rodríguez et al. (2020) Peña-Rodríguez, J., Pisco-Guabave, J., Sierra-Porta, D., Suárez-Durán, M., Arenas-Flórez, M., Pérez-Archila, L., Sanabria-Gómez, J., Asorey, H., Núñez, L., 2020. Design and construction of MuTe: a hybrid muon telescope to study colombian volcanoes. Journal of Instrumentation 15, P09006–P09006.
- Peña-Rodríguez et al. (2019) Peña-Rodríguez, J., Vásquez-Ramírez, A., Sanabria-Gómez, J.D., Núñez, L., Sierra-Porta, D., Asorey, H., 2019. Calibration and first measurements of mute: a hybrid muon telescope for geological structures, in: 36th International Cosmic Ray Conference (ICRC2019).
- Peprah et al. (2017) Peprah, A.K., Appiah, S.K., Amponsah, S.K., et al., 2017. An optimal cooling schedule using a simulated annealing based approach. Applied Mathematics 8, 1195.
- Pessel and Gibert (2003) Pessel, M., Gibert, D., 2003. Multiscale electrical impedance tomography. Journal of Geophysical Research: Solid Earth 108.
- Piedrahita et al. (2018) Piedrahita, D.A., Aguilar-Casallas, C., Arango-Palacio, E., Murcia, H., Gómez-Arango, J., 2018. Estratigrafía del cráter y morfología del volcán cerro machín, colombia. Boletín de Geología 40, 29–48.
- Procureur (2018) Procureur, S., 2018. Muon imaging: Principles, technologies and applications. Nuclear Instruments and Methods in Physics Research Section A: Accelerators, Spectrometers, Detectors and Associated Equipment 878, 169 – 179. URL: http://www.sciencedirect.com/science/article/pii/S0168900217308495, doi:https://doi.org/10.1016/j.nima.2017.08.004. radiation Imaging Techniques and Applications.
- Reyna (2006) Reyna, D., 2006. A simple parameterization of the cosmic-ray muon momentum spectra at the surface as a function of zenith angle. arXiv preprint hep-ph/0604145 .
- Rosas-Carbajal et al. (2017) Rosas-Carbajal, M., Jourde, K., Marteau, J., Deroussi, S., Komorowski, J.C., Gibert, D., 2017. Three-dimensional density structure of la soufrière de guadeloupe lava dome from simultaneous muon radiographies and gravity data. Geophysical Research Letters 44, 6743–6751.
- Rueda (2005) Rueda, H., 2005. Erupciones plinianas del Holoceno en el Volcán Cerro Machín, Colombia. Estratigrafía, petrografía y dinámica eruptiva. Master thesis. Universidad Nacional Autónoma de México. México.
- Sánchez (2014) Sánchez, P.A.H., 2014. El riesgo: realidad virtual. deslizamientos activados por amenaza sísmica volcánica del volcán cerro machín. Entorno Geográfico .
- Sarmiento-Cano et al. (2020) Sarmiento-Cano, C., Suárez-Durán, M., Calderón-Ardila, R., Vásquez-Ramírez, A., Jaimes-Motta, A., Dasso, S., Sidelnik, I., Núñez, L.A., Asorey, H., 2020. Performance of the lago water cherenkov detectors to cosmic ray flux. arXiv preprint arXiv:2010.14591 .
- Tanaka (2016) Tanaka, H., 2016. Visualization of the internal structure of volcanoes with cosmic-ray muons. Journal of the Physical Society of Japan 85, 091016.
- Tanaka et al. (2007) Tanaka, H., Nakano, T., Takahashi, S., Yoshida, J., Ohshima, H., Maekawa, T., Watanabe, H., Niwa, K., 2007. Imaging the conduit size of the dome with cosmic-ray muons: The structure beneath showa-shinzan lava dome, japan. Geophysical Research Letters 34.
- Tanaka and Oláh (2019) Tanaka, H.K.M., Oláh, L., 2019. Overview of muographers. Philosophical Transactions of the Royal Society A: Mathematical, Physical and Engineering Sciences 377, 20180143.
- Tapia et al. (2016) Tapia, A., Dueñas, D., Rodriguez, J., Betancourt, J., Caicedo, D., 2016. First monte carlo simulation study of galeras volcano structure using muon tomography. PoS(ICHEP2016) 885 , 1–4.
- Tarantola and Valette (1982) Tarantola, A., Valette, B., 1982. Inverse problems= quest for information. J. geophys 50, 150–170.
- Thompson et al. (2020) Thompson, L.F., Stowell, J.P., Fargher, S.J., Steer, C.A., Loughney, K.L., O’Sullivan, E.M., Gluyas, J.G., Blaney, S.W., Pidcock, R.J., 2020. Muon tomography for railway tunnel imaging. Phys. Rev. Research 2, 023017. URL: https://link.aps.org/doi/10.1103/PhysRevResearch.2.023017, doi:10.1103/PhysRevResearch.2.023017.
- Thouret et al. (1995) Thouret, J.C., Cantagrel, J., Robin, C., Murcia, A., Salinas, R., Cepeda, H., 1995. Quaternary eruptive history and hazard-zone model at nevado del tolima and cerro machin volcanoes, colombia. Journal of volcanology and geothermal research 66, 397–426.
- Uchida et al. (2009) Uchida, T., Tanaka, H.K., Tanaka, M., 2009. Space saving and power efficient readout system for cosmic-ray muon radiography. IEEE Transactions on Nuclear Science 56, 448–452.
- Useche-Parra and Avila-Bernal (2019) Useche-Parra, J., Avila-Bernal, C., 2019. Estimation of cosmic-muon flux attenuation by monserrate hill in bogota. Journal of Instrumentation 14, P02015.
- Vargas et al. (2005) Vargas, C.A., Kammer, A., Valdes, M., Rodríguez, C.E., Caneva, A., Sánchez, J.J., Arias, E., Cortes, C.A., Mora, H., 2005. New geological and geophysical contributions in the section ibague-armenia, central cordillera-colombia. Earth sciences research journal 9, 99–109.
- Vásquez-Ramírez et al. (2020) Vásquez-Ramírez, A., Suárez-Durán, M., Jaimes-Motta, A., Calderón-Ardila, R., Peña-Rodríguez, J., Sánchez-Villafrades, J., Sanabria-Gómez, J., Asorey, H., Núñez, L., 2020. Simulated response of mute, a hybrid muon telescope. Journal of Instrumentation 15, P08004.
- Vesga-Ramírez et al. (2020) Vesga-Ramírez, A., Sierra-Porta, D., Peña-Rodríguez, J., Sanabria-Gómez, J., Valencia-Otero, M., Sarmiento-Cano, C., Suárez-Duran, M., Asorey, H., Núñez, L., 2020. Muon tomography sites for colombian volcanoes. Annals of Geophysics 63, 661.
- Villagómez et al. (2011) Villagómez, D., Spikings, R., Magna, T., Kammer, A., Winkler, W., Beltrán, A., 2011. Geochronology, geochemistry and tectonic evolution of the western and central cordilleras of colombia. Lithos 125, 875–896.
- Weber (2000) Weber, Z., 2000. Seismic traveltime tomography: a simulated annealing approach. Physics of the Earth and Planetary Interiors 119, 149–159.