Transient energy growth in the ageostrophic Eady model
Abstract
The problem of optimal initial disturbances in thermal wind shear is revisited and extended to include non-hydrostatic effects. This systematic study compares transient and modal growth rates of submesoscale instabilities over a large range of zonal and meridional wave numbers, aspect ratios, and different Richardson number regimes. Selection criteria were derived to remove spurious and unresolved instability modes that arise from the eigenvalue problem and we generalize the study of the hydrostatic Eady problem by Heifetz:03; heifetz2007generalized; heifetz2008non to thin fronts, characterized by large aspect ratios. Such fronts are commonly found at the early stages of frontogenesis, for example, in the ocean mesoscale eddies and near the eye wall of hurricanes. In particular, we show that transient energy growth rates are up to two orders of magnitude larger than modal counterparts for a wide range of Richardson number and that the effects of transient energy gain become even greater when non-hydrostatic effects become important and/or for large Richardson numbers. This study also compares the dominant energy pathways contributing to the energy growth at short and long times. For symmetric modes, we recover the inertia-gravity instability described in Xu:07. These mechanisms are shown to be the most powerful mediator of vertical transport when compared with the fastest growing baroclinic and symmetric modes. These results highlight the importance of transient processes in the ocean and the atmosphere.
keywords:
Stratified flows, rotating flows, instability.1 Introduction
Density fronts, which are defined as regions of large density gradients, are features ubiquitous in the ocean and the atmosphere. For instance western boundary currents, such as the Gulf Stream and the Kuroshio, are the site of large-scale meanders resulting in mesoscale eddies, which are typically km in horizontal length scale with Rossby numbers smaller
than unity. These eddies draw energy from the geostrophic flow by converting potential into kinetic energy (Gnanadesikan:05; Wolfe:08; Thomas:13; Zemskova:15). The kinetic energy in these eddies can in turn dissipate through submesoscale instabilities (typically smaller than km), in addition to other mechanisms such as bottom drag, but the transient dynamics of the submesoscale instabilities are still not completely understood (Thomas:13; Stamper:17).
These submesoscale processes enhance the vertical transport in the upper ocean and have an impact on phytoplankton and the biological pump, and their energetics need to be explored further
(Taylor:11; Omand:15; sarkar2016interplay; brannigan2017submesoscale; ramachandran2018submesoscale).
Small-scale perturbations have also been identified as an energy source for geophysical shear flows with undisturbed background state, such as the Earth’s midlatitude jets (farrell1993stochastic_b) and zonal winds in gaseous planets (vasavada2005jovian), with a particular interest on the effect of these perturbations on cyclogenesis.
However, the stability and dynamics of the fronts where small-scale instabilities are confined in narrow regions have received less attention than the small aspect ratio and hydrostatic counterpart.
Larger aspect ratios are particularly common in hurricane boundary layers (ellis2010helical; foster2013signature) and tornados (nolan2017tornado).
This confinement reduces the spatial support for large baroclinic geostrophic instabilities where non-hydrostatic effects are known to damp geostrophic-type motions (Stone:70). Hence ageostrophic-type modes, characterized by short wavelength and critical regions associated with intense shear, are expected to play a dominant role in the submesoscale transition process.
The role of submesoscale instabilities was first identified by Solberg:36 in the case of symmetric modes
and later by Eady:49 for baroclinic modes and finally by Chandrasekhar:61 for Kelvin-Helmholtz type waves. The stability of fronts and normal growth rates of instabilities were extensively analyzed using asymptotic theory for a linear thermal wind shear (Stone:66; Stone:70; Stone:71). In general, baroclinic instabilities include any instabilities that arise in a rotating fluid which is stratified due to horizontal density gradients. Here, to be consistent with Stone’s work and subsequent analyses done in his footsteps (e.g. MolemakerM:05; Stamper:17), we refer to baroclinic instabilities as those that occur independently of perturbations in the meridional direction and draw energy from potential energy of the flow to distinguish them from symmetric modes
that are independent of zonal perturbations and draw energy from the kinetic energy field.
A geostrophic current is symmetrically unstable when its potential vorticity has the opposite sign of local Coriolis parameter (Thomas:13), but the unstable modal growth rate is nonzero only when for a basic state in thermal wind shear balance with no vertical vorticity (Stone:66). Baroclinic instabilities are divided into geostrophic and ageostrophic types. While these instabilities are technically geostrophic only for as described by Eady:49, we again follow Stone’s convention in referring to any baroclinic instabilities at any value of Ri with large wavelength and large modal growth rates as geostrophic, while the ageostrophic ones occur at much smaller length scales and have smaller growth rates. The geostrophic and ageostrophic instabilities also have different structures of the eigenspectra, as will be discussed in detail in §2.3 and §4.1. In particular, the geostrophic-type instabilities have only one eigenmode with the largest real part of eigenvalue while the ageostrophic-type instabilities have two eigenmodes with the largest equal real part but different imaginary parts of the eigenvalue. Ageostrophic modes have been previously overlooked, but it has been shown that they may play an important role in restratification of ocean mixed layer (Boccaletti:07) and loss of balance (MolemakerM:05).
Heifetz:03 generalized the notion of stability in baroclinic shear flows in the large Richardson (strongly stratified) regime using a formulation based on primitive equations.
In a second study, heifetz2007generalized showed that the non-normal coupling between stable (Rossby- or inertio-gravity) waves and unstable geostrophic modes results in energy gain which exceeds that provided by the modal growth alone in the hydrostatic limit. heifetz2008non also extended their analysis to symmetric modes
and showed the optimal transient growth exceeding that predicted by normal symmetric mode analysis and yielding potentially a much faster generation of slantwise convection. However, the extra gains that they report are at most a factor two, which is relatively small compared to the extra optimal gain observed for the geostrophic and ageostrophic type modes.
For all cases, this shear-driven transient energy growth is known to be the bypass transition to turbulence, which in turn was developed by the hydrodynamic community for asymptotically stable shear flows by schmid2012stability. Finite amplitude perturbations that undergo transient growth may reach an amplitude that is sufficiently large to allow positive feedback through nonlinear interactions that amplify the growing disturbances.
In the present study, we consider a generalization of Heifetz:03; heifetz2007generalized by taking it to the non-hydrostatic limit commonly found during frontogenesis that induces finite thicknesses of the front leading to geostrophic shear with large aspect ratios.
While oceanic flows are generally characterized by small aspect ratios (defined here as the ratio of the vertical to horizontal length scales), commonly found between and , atmospheric flows can have aspect ratios of the order of unity (nolan2017tornado) and the nonhydrostatic effects may be important.
Stone:71 theoretically derived the nonhydrostatic effects on the most unstable modes for the linear thermal wind shear framework. This work found that the temporal energy growth rates are progressively suppressed as the aspect ratio increases for all instability types. However, it is possible that for a short-term, the energy gain is not as affected by non-hydrostatic conditions. The latter may even provide a route for the transient growth of perturbations
which will be one of the main focus of this study. For instance, the energy gain of short-lived near-surface streaks in the hurricane boundary layer that enhance wind speed and vertical transport could be attributed to such non-normal transient growth dynamics (drobinski2003origin).
Unstratified simple shear flows such as plane Couette or plane Poiseuille configurations are known to be subject to two types of transient growth phenomena. In his original work, Orr:07 showed that in the case of a simple inviscid parallel shear flow, perturbations with a non-zero streamwise wavenumber could produce transient growth through the kinematic deformation of the perturbation vorticity by the baseflow advection and shear.
Later, farrell1993optimal derived an analytic solution for the Orr temporal growth rate, for two-dimensional perturbations in a constant, unstratified linear shear.
ellingsen1975stability recognized that a finite disturbance independent of the streamwise coordinate (i.e. with a spanwise wavenumber with respect to the shear) may lead to instability of linear flow, even though the basic velocity does not possesses an inflection point. This mechanism, later denoted as lift-up effect, is a key process in the laminar-turbulent transition in shear flows and in fully developed turbulence (brandt2014lift).
The energy growth mechanisms in stratified and rotating sheared flows have been addressed in several previous works, such as farrell1993stochastic_a; bakas2009gravity_a; bakas2009gravity_b; park2017instabilities. These works identified several mechanisms responsible for the energy growth that vary depending on the configuration of the background flow and the stratification. In particular, park2017instabilities noted that there exist two mechanisms types for transient energy growth analogous to the lift up and the Orr mechanisms in homogeneous fluids but with the additional effect of density perturbations.
In this work, we explore the transient energy growth mechanisms for different Richardson number regimes over a range of zonal and meridional wavenumbers with respect to the height or depth of the front. In particular, we assess the additional contribution of the energy transfer from the background flow to the perturbations through the wave reflection off the domain boundaries and critical layers.
The local stability properties and loss of balance induced by baroclinic modes and their dependence on Rossby numbers in thermal wind balance was first computed numerically using a finite difference matrix-type approach to this eigenvalue problem rather than an iterative shooting method with an initial eigenvalue guess by MolemakerM:05. They showed that they could capture the instability modes predicted by Stone:70 and that these modes explained in part how a highly balanced large-scale circulation
may dissipate energy through a local forward energy cascade into unbalanced motions. Nakamura:88 showed that ageostrophic modes are identified within the inertial critical layer which is sustained by the resonance between one of the boundary modes and the inertial gravity waves.
The latter observation implies that computing the eigenspectrum in the non-hydrostatic and inviscid limit based on MolemakerM:05 formulation may lead to spurious or unresolved eigenfunctions in the critical layers. The computation of optimal initial disturbances and optimal energy gain using a singular value decomposition method described by Schmid:14 requires the interaction of all modes, not only modes with non-zero energy growth rate. As some of the obtained eigenfunctions may be spurious or unresolved, it is necessary to determine the criteria for the selection of the only physical and resolved eigenmodes appropriate for the these computations.
In the present paper, we start from a one-dimensional finite difference approximation of the linearized Euler equation for a flow in thermal wind balance following Stone:66; Stone:70; Stone:71, and compute optimal energy growth for a range of Richardson number values as well as wavenumbers in both horizontal directions. We overcome the problem of critical layers by performing a careful selection of the appropriate modes used in the Galerkin-type projection to compute the optimal initial disturbance. In particular, we provide selection criteria that allow for discarding the spurious eigenfunctions. The energy budget and nonlinear development of the optimal initial conditions are computed using three-dimensional non-hydrostatic direct numerical simulations (DNS) of the Navier-Stokes equations.
The rest of the paper is organized as follows: §2 presents the numerical methods and setup of the problem, transient growth and the selection criteria for the eigenfunctions are explained in §3. Results for the linear optimal dynamics are summarized in §4, whereas three-dimensional simulations are given in §5 and conclusions are drawn in §6.
2 Theoretical formulation
2.1 Problem set-up
The present formulation is based on Stone:70; Stone:71 and considers the dynamics of a non-hydrostatic and rotating inviscid fluid in the Boussinesq limit where is the Coriolis frequency. The governing conservation equations for the zonal velocity , meridional velocity , vertical velocity , hydrodynamic pressure , and buoyancy (where is the gravitational acceleration) are
| (1) |
where , and is the vertical unit vector positive upward. The domain is unbounded in (zonal) and (meridional) directions with solid vertical boundaries at , where we impose the boundary condition . The base buoyancy field has constant vertical stratification and gradient in the meridional direction. The base state has zero meridional and vertical velocities and the zonal velocity has a constant vertical shear in a thermal wind balance (vallis).
The governing equations (1) are non-dimensionalised following the time and length scales prescribed in Stone:71 such that
| (2) |
where is the maximum zonal velocity and is the Brunt-Väisälä frequency. The base state variables in the non-dimensional form become:
| (3) |
where is the Richardson number.
The non-dimensionalized system (1) once linearized around the base state becomes
{subeqnarray}
∂u∂t+ U∂u∂x + w ∂U∂z -v + Ri ∂p∂x&=0,
∂v∂t+ U ∂v∂x +u + Ri ∂p∂y=0,
δ^2 (∂w∂t + U ∂w∂x) - Ri b + Ri ∂p∂z =0,
∂b∂t + U∂b∂x - vRi +w =0,
∂u∂x + ∂v∂y +∂w∂z =0.
where the second control parameter is a measure of the aspect ratio divided by the Rossby number as the horizontal length scale is . Note that the deviation from hydrostatic equilibrium is determined by the value and provides a rescaling of the vertical velocity and the buoyancy perturbation with respect to the horizontal components in the case of finite length scales.
This number also corresponds to the squared aspect ratio when choosing as a horizontal length scale as in MolemakerM:05.
2.2 Stability analysis
The solution for the stability is sought in term of linear perturbation variables, denoted by the superscript such that:
| (4) |
where and are zonal and meridional wave numbers, respectively and where is the eigenvalue. Substituting the ansatz (4) in system (3), the eigenvalue problem consists of a coupled system of ordinary differential equations, expressed in terms of -dependence only for the perturbation variables with
{subeqnarray}
i (ω+ αU)~u - ~v + ~w + i αRi ~p &= 0,
~u + i (ω+ αU) ~v + i βRi ~p = 0,
i δ^2 (ω+ αU) ~w + Ri d ~pd z - Ri ~b = 0,
- ~vRi + ~w + i (ω+ αU) ~b = 0,
i α~u + i β~v + d ~wd z = 0.
The eigenvalue problem (4) is reduced to three equations for the vertical velocity , buoyancy , and vertical vorticity
equations and reads
{subeqnarray}
i ω(d2dz2 - k^2 δ^2) ~w &= -i αU (d2dz2 - k^2 δ^2) ~w - k^2 Ri ~b + d ~ηdz,
i ω~b = (i βk2Riddz - 1) ~w - i αU ~b + i αk2Ri ~η,
i ω~η = - (i β+ ddz) ~w - i αU ~η,
where , which in a matrix form become
| (5) |
where , and and are matrices given by
and
and where and the boundary conditions
| (6) |
The coupled eigenvalue problem (4) is discretised finally using second-order finite differences with equally-spaced grid points along the vertical direction as in MolemakerM:05,
giving rise to a matrix-type eigenvalue problem that can later be used to perform transient growth analysis (schmid2012stability).
In the next subsection, we analyze the asymptotic properties of the eigenvalue problem originally formulated in Stone:71 for the vertical velocity only, equivalent to the system (4a-c). In particular, we carry out dispersion relation analyses for this particular system to identify and then separate the resolved from the spurious modes.
2.3 Eigenvalue spectrum and modes selection
In his original work, Stone:71 showed that (4) could be combined into a single equation for the vertical velocity which writes
| (7) |
where , and used asymptotic arguments to compute approximations of both geostrophic and ageostrophic modes. As can be readily seen from the terms containing in equation (7), the eigenvalue problem turns out to have multiple critical points that occur at . Therefore, one would expect to observe different branches associated with each critical solution in the eigenspectrum.
This was previously observed by several authors (Nakamura:88; Heifetz:03) who already suggested that certain branches, associated with particular physical phenomena, could be removed.
More precisely, Heifetz:03 used Nakamura:88 analysis to identify continuous branches associated with critical layers. Heifetz:03 chose to reintroduce viscosity to stabilize these eigenfunctions and smooth the jump across the critical points. In their subsequent study, heifetz2007generalized show in their figure 1 that there exist a strong non-orthogonality that is likely to deteriorate with increasing the number of discretization points in the matrix used to solve the eigenvalue problem. The interactions between modes that are orthogonal to each other do not contribute to the energy of the system, whereas non-orthogonal modes have additional contribution to the energy gain.
The importance of this orthogonality condition between modes was reinforced by the study of MolemakerM:05 who also mentioned that a large number of discretization points were necessary to obtain accurate eigenvalues.
In addition, Heifetz:03 noted that it was necessary to remove modes that do not contribute to transient growth but appear in the solution as non-fully resolved marginally oscillatory modes. These modes, also known as Poincaré waves (cf. Heifetz:03, pg. 59-60), are the inertio-gravity waves in the absence of shear which are pure harmonic waves.
In this study, we have chosen not to reintroduce viscosity. Instead, we derive dispersion relations for both inertia-gravity waves and the rotational singular modes, associated with the critical layers at , which allows for computing the ranges of their values. Based on these ranges, it is possible to select the appropriate subspace of eigenmodes from the full eigenspectra to compute the transient growth rates.
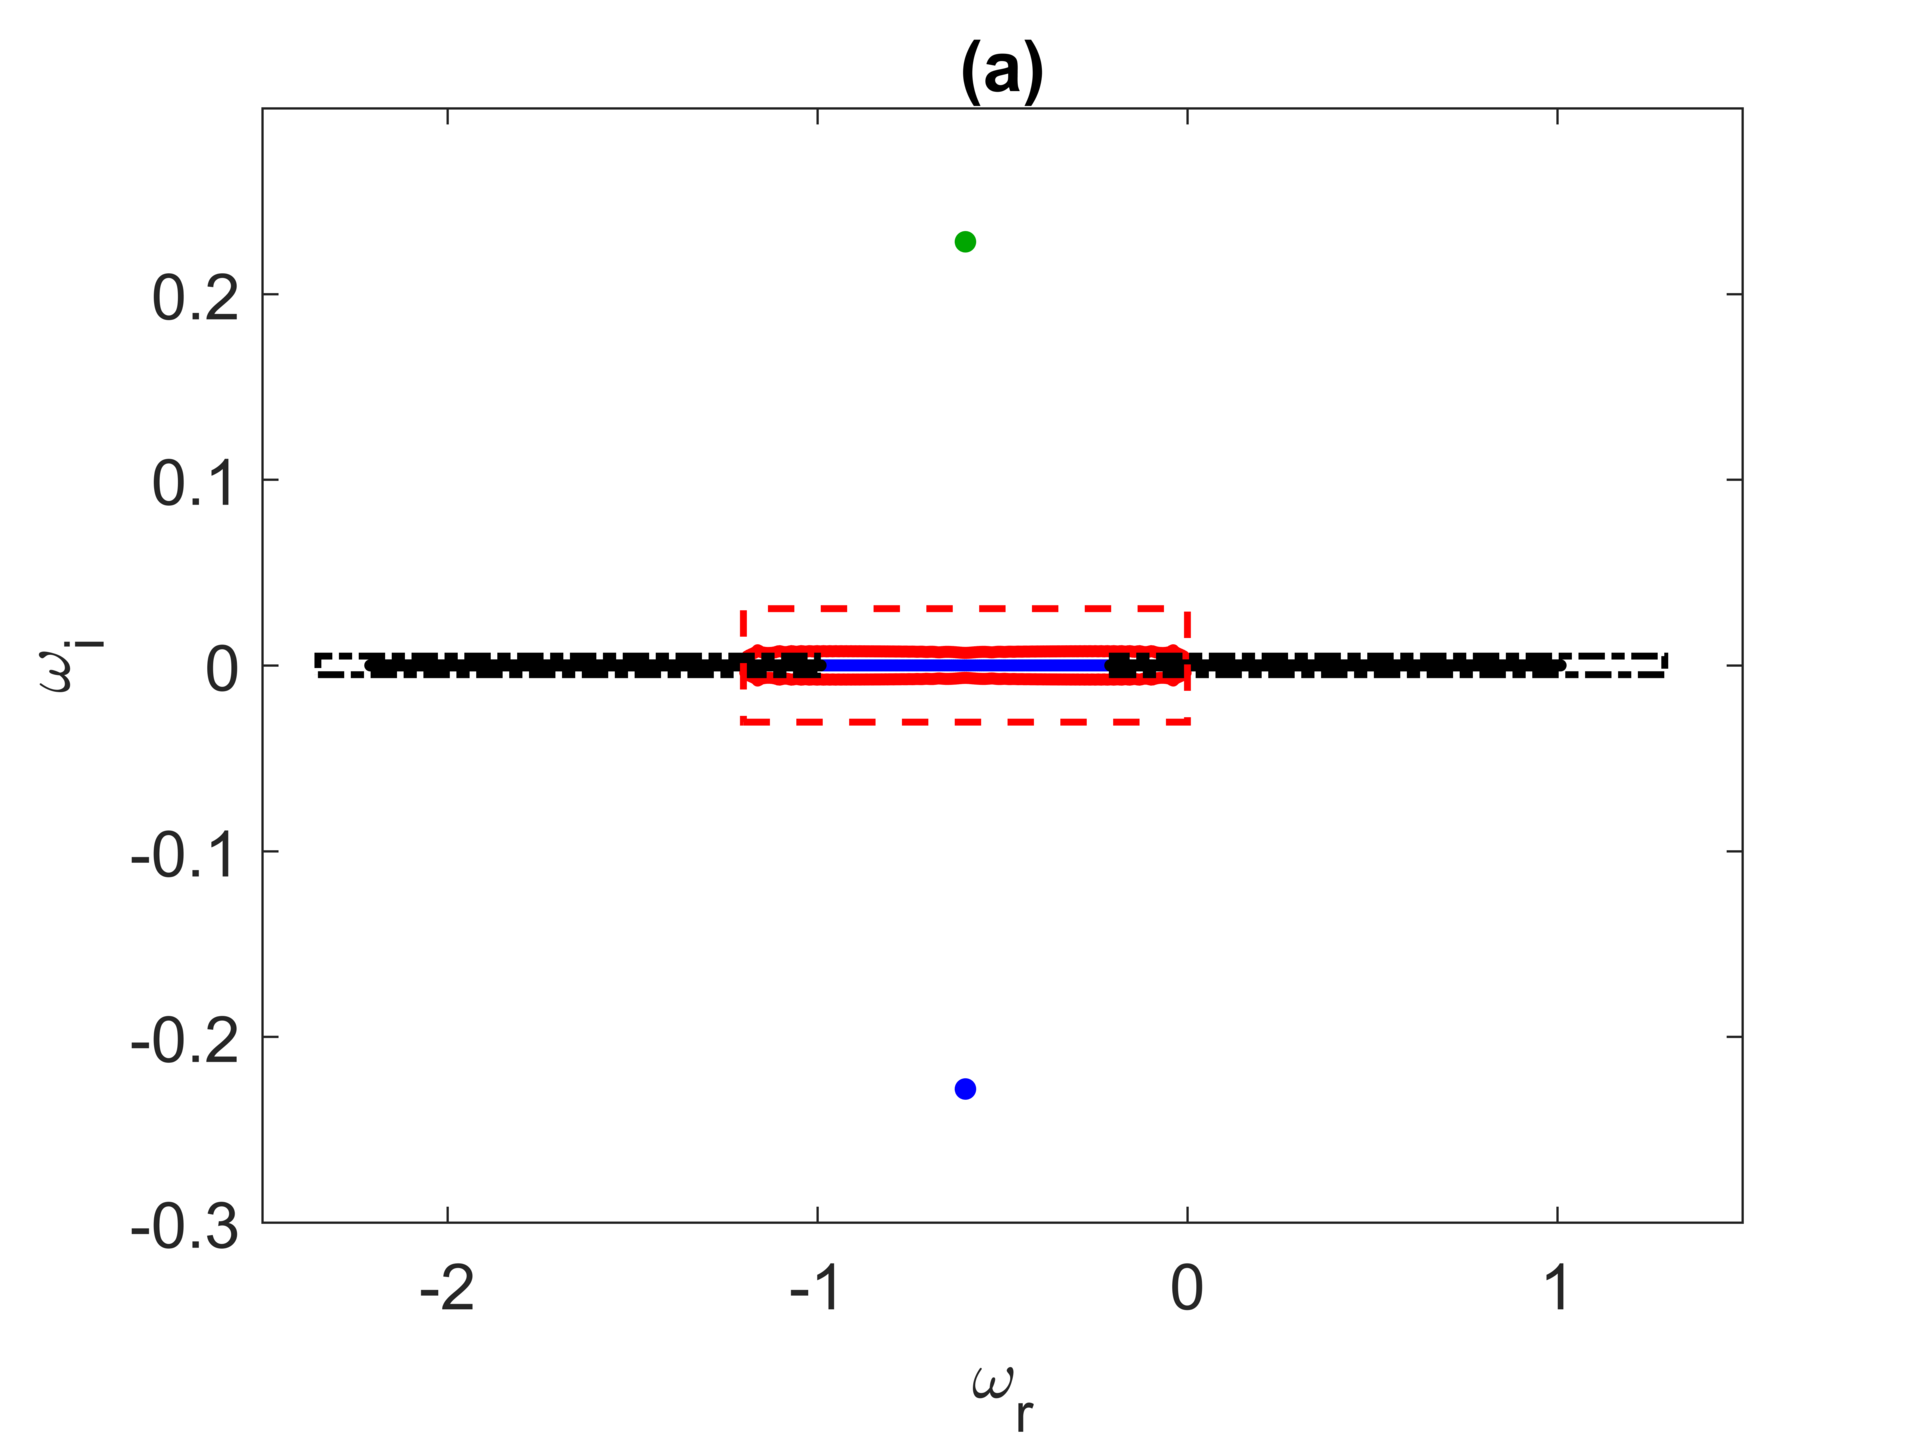
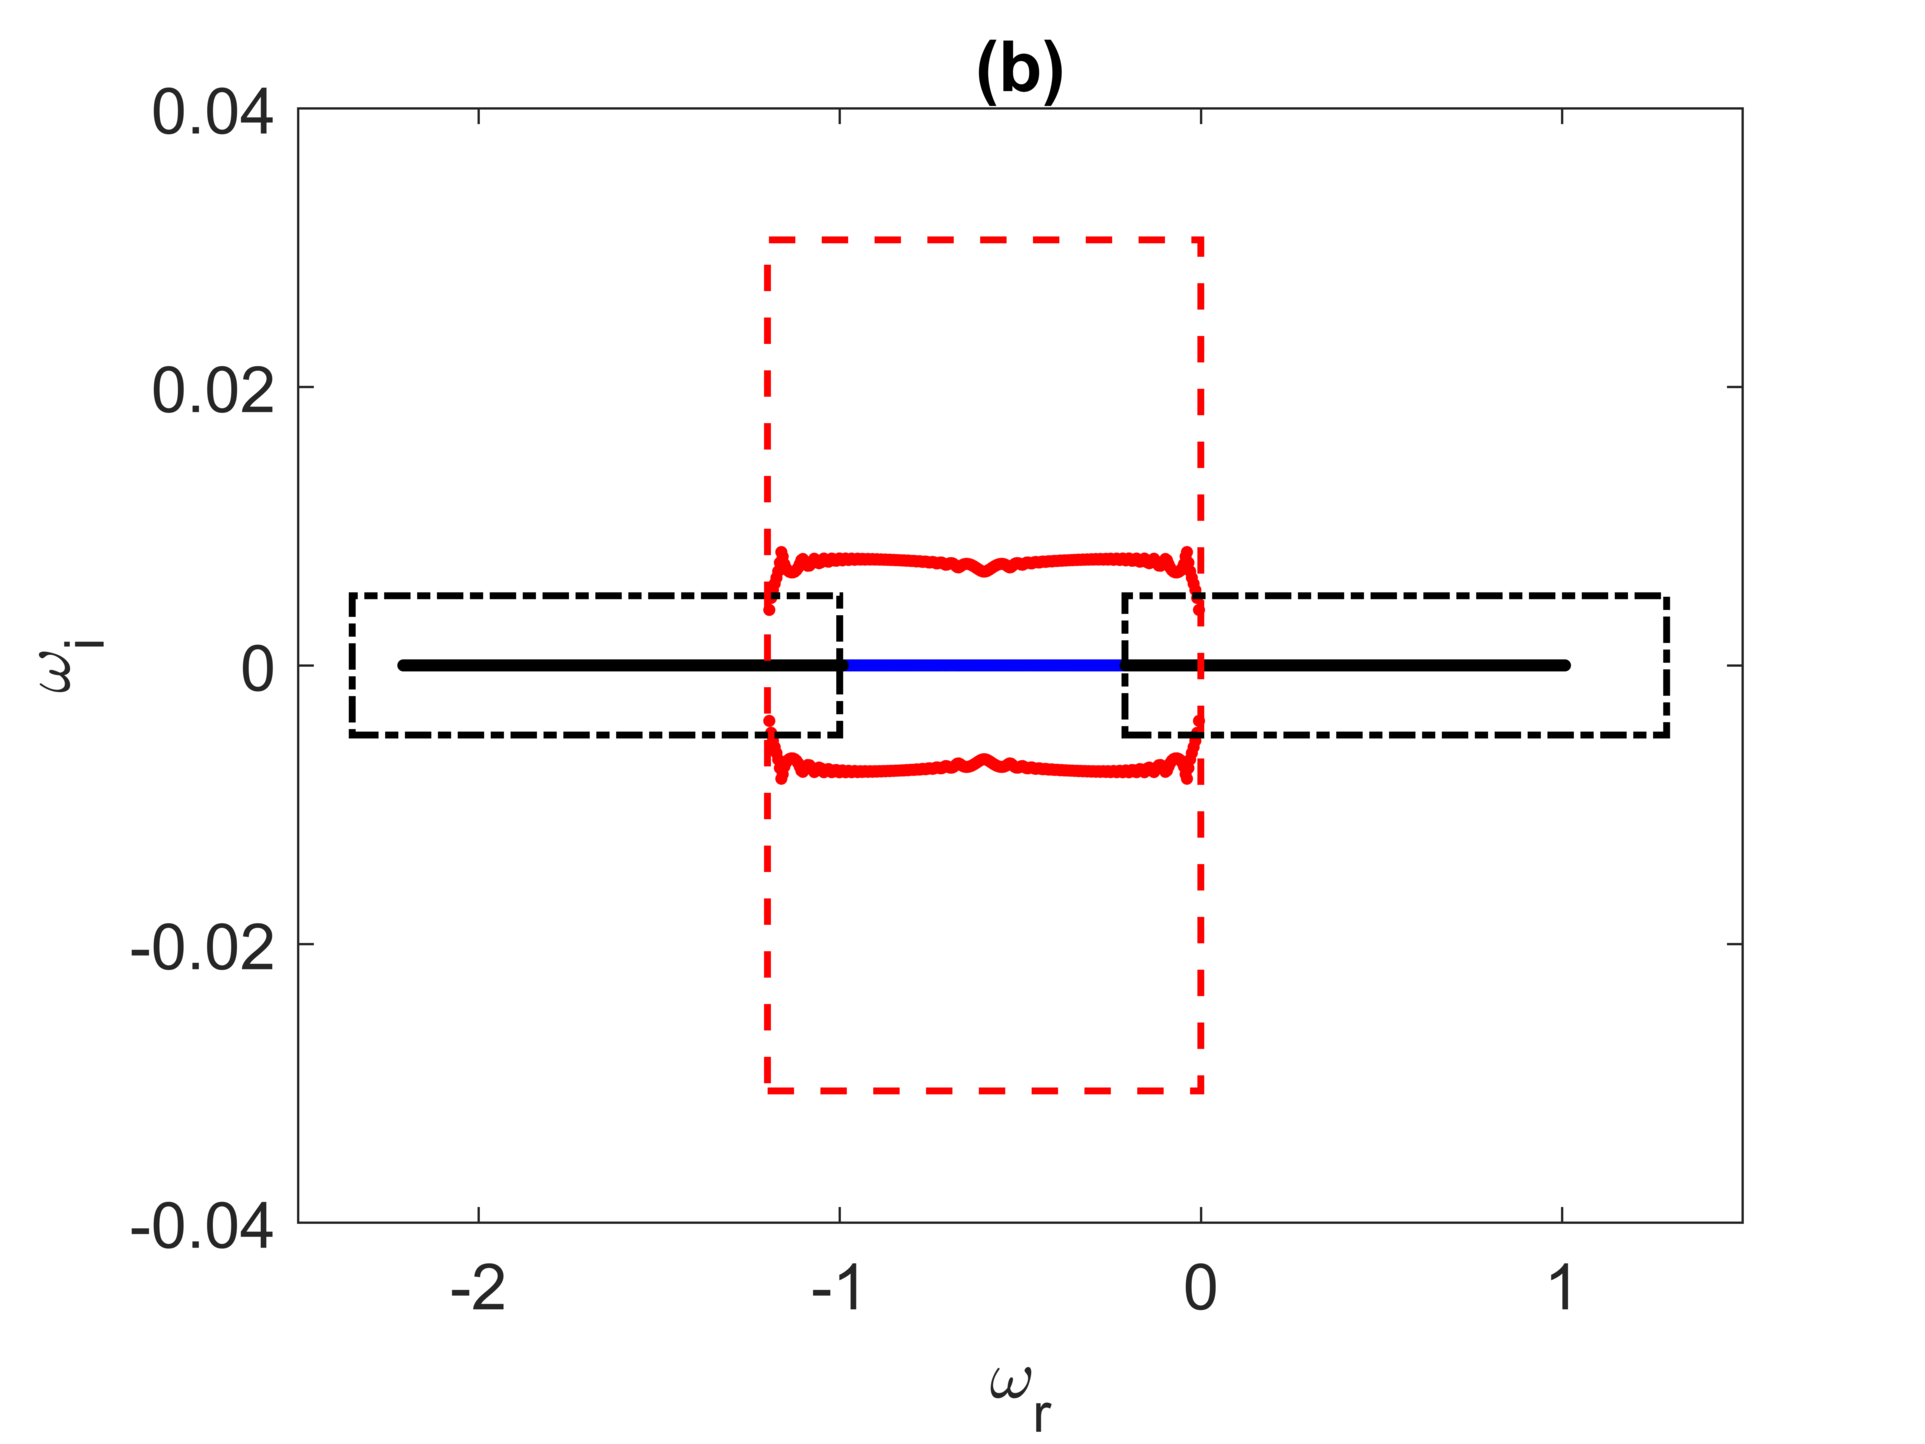
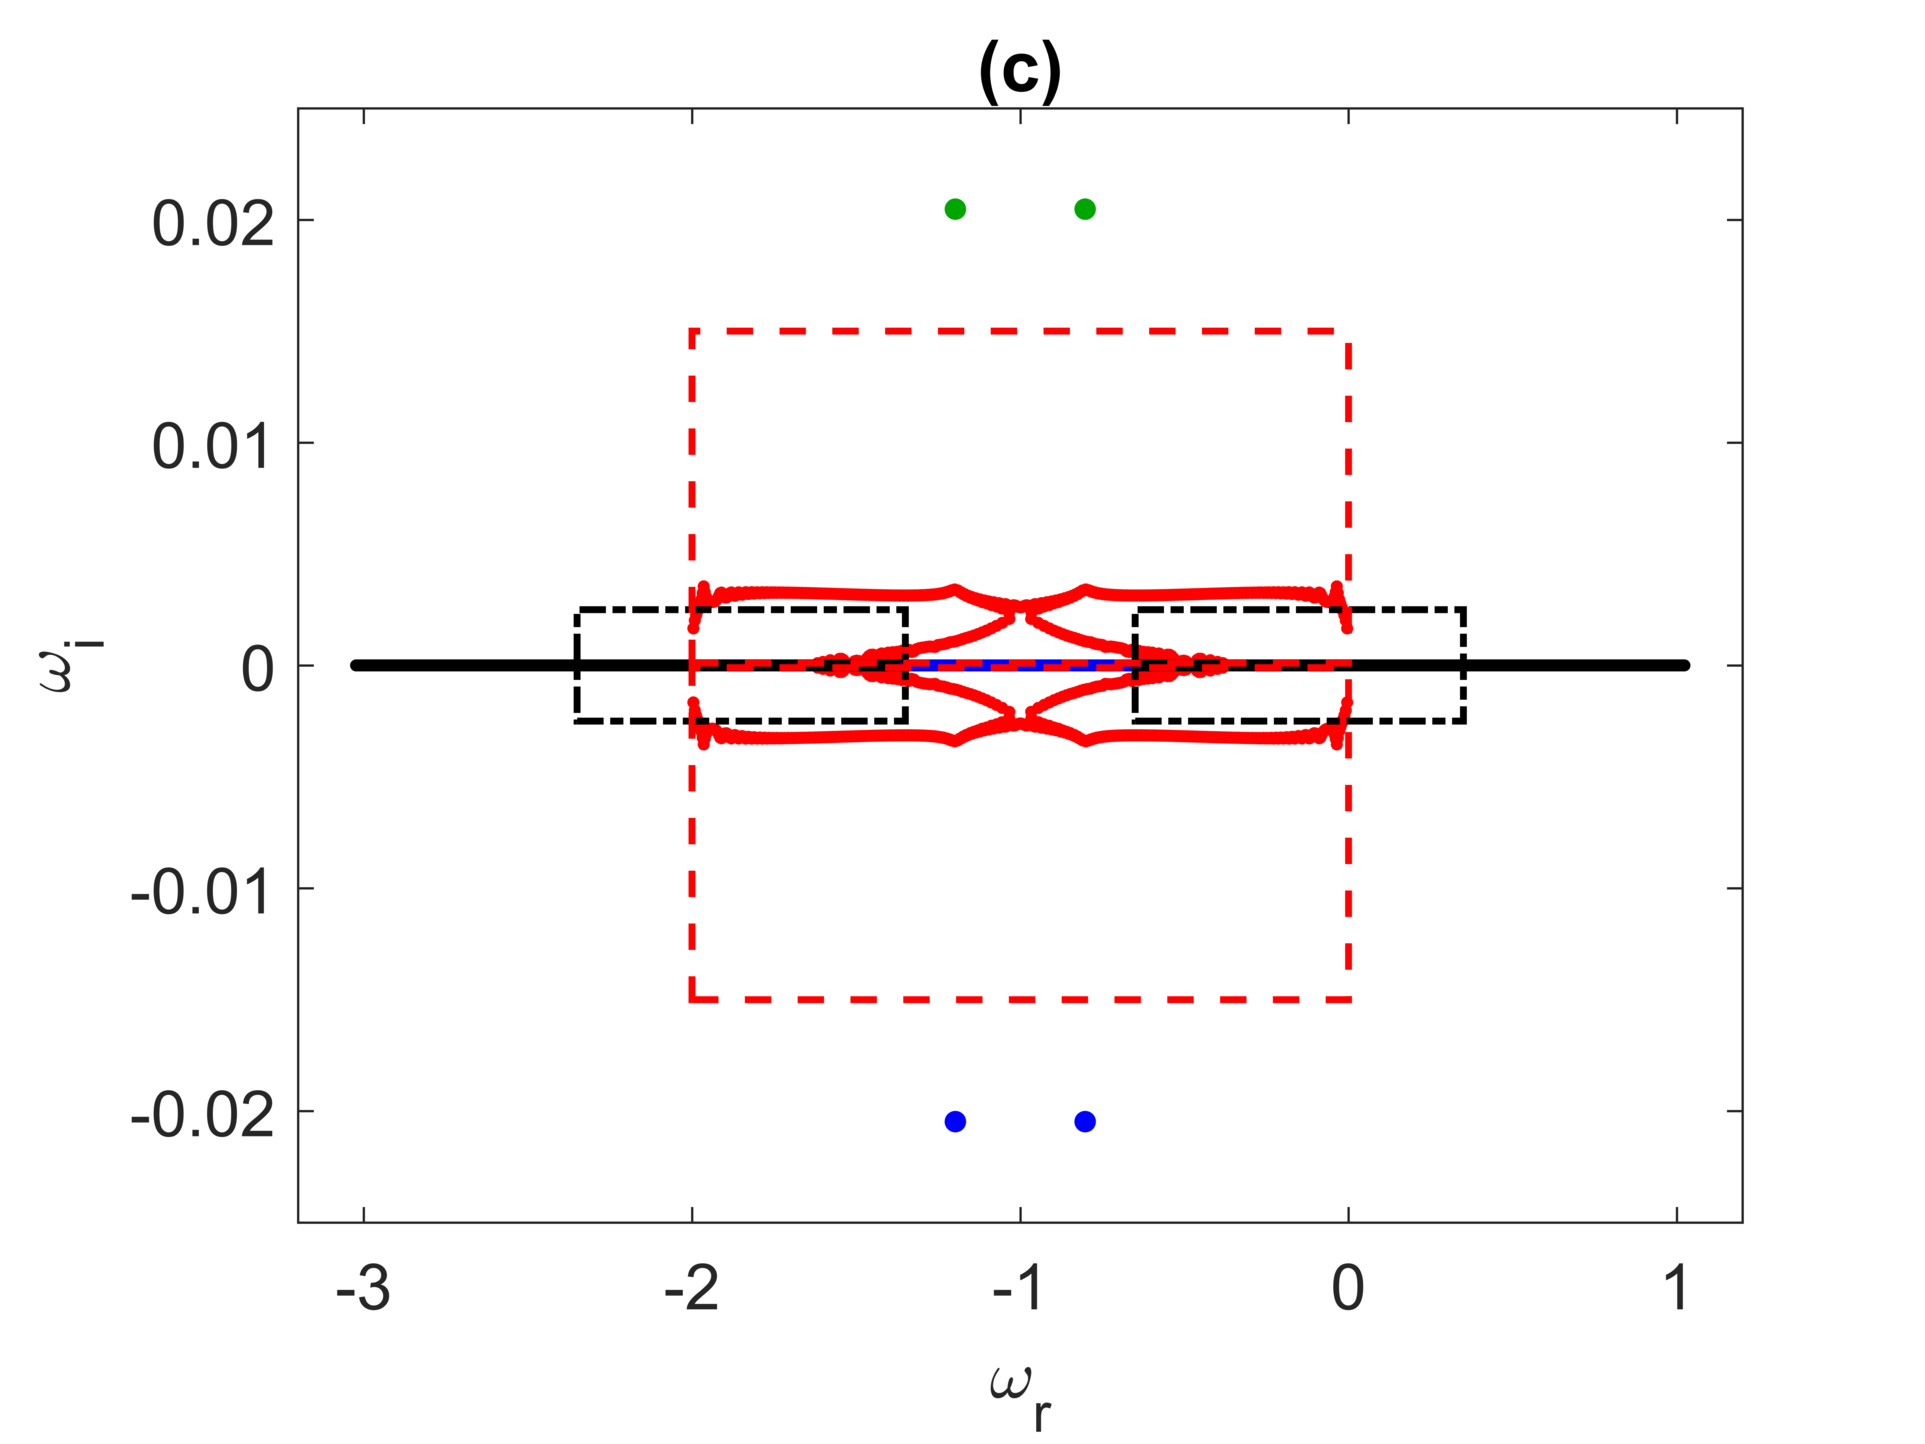
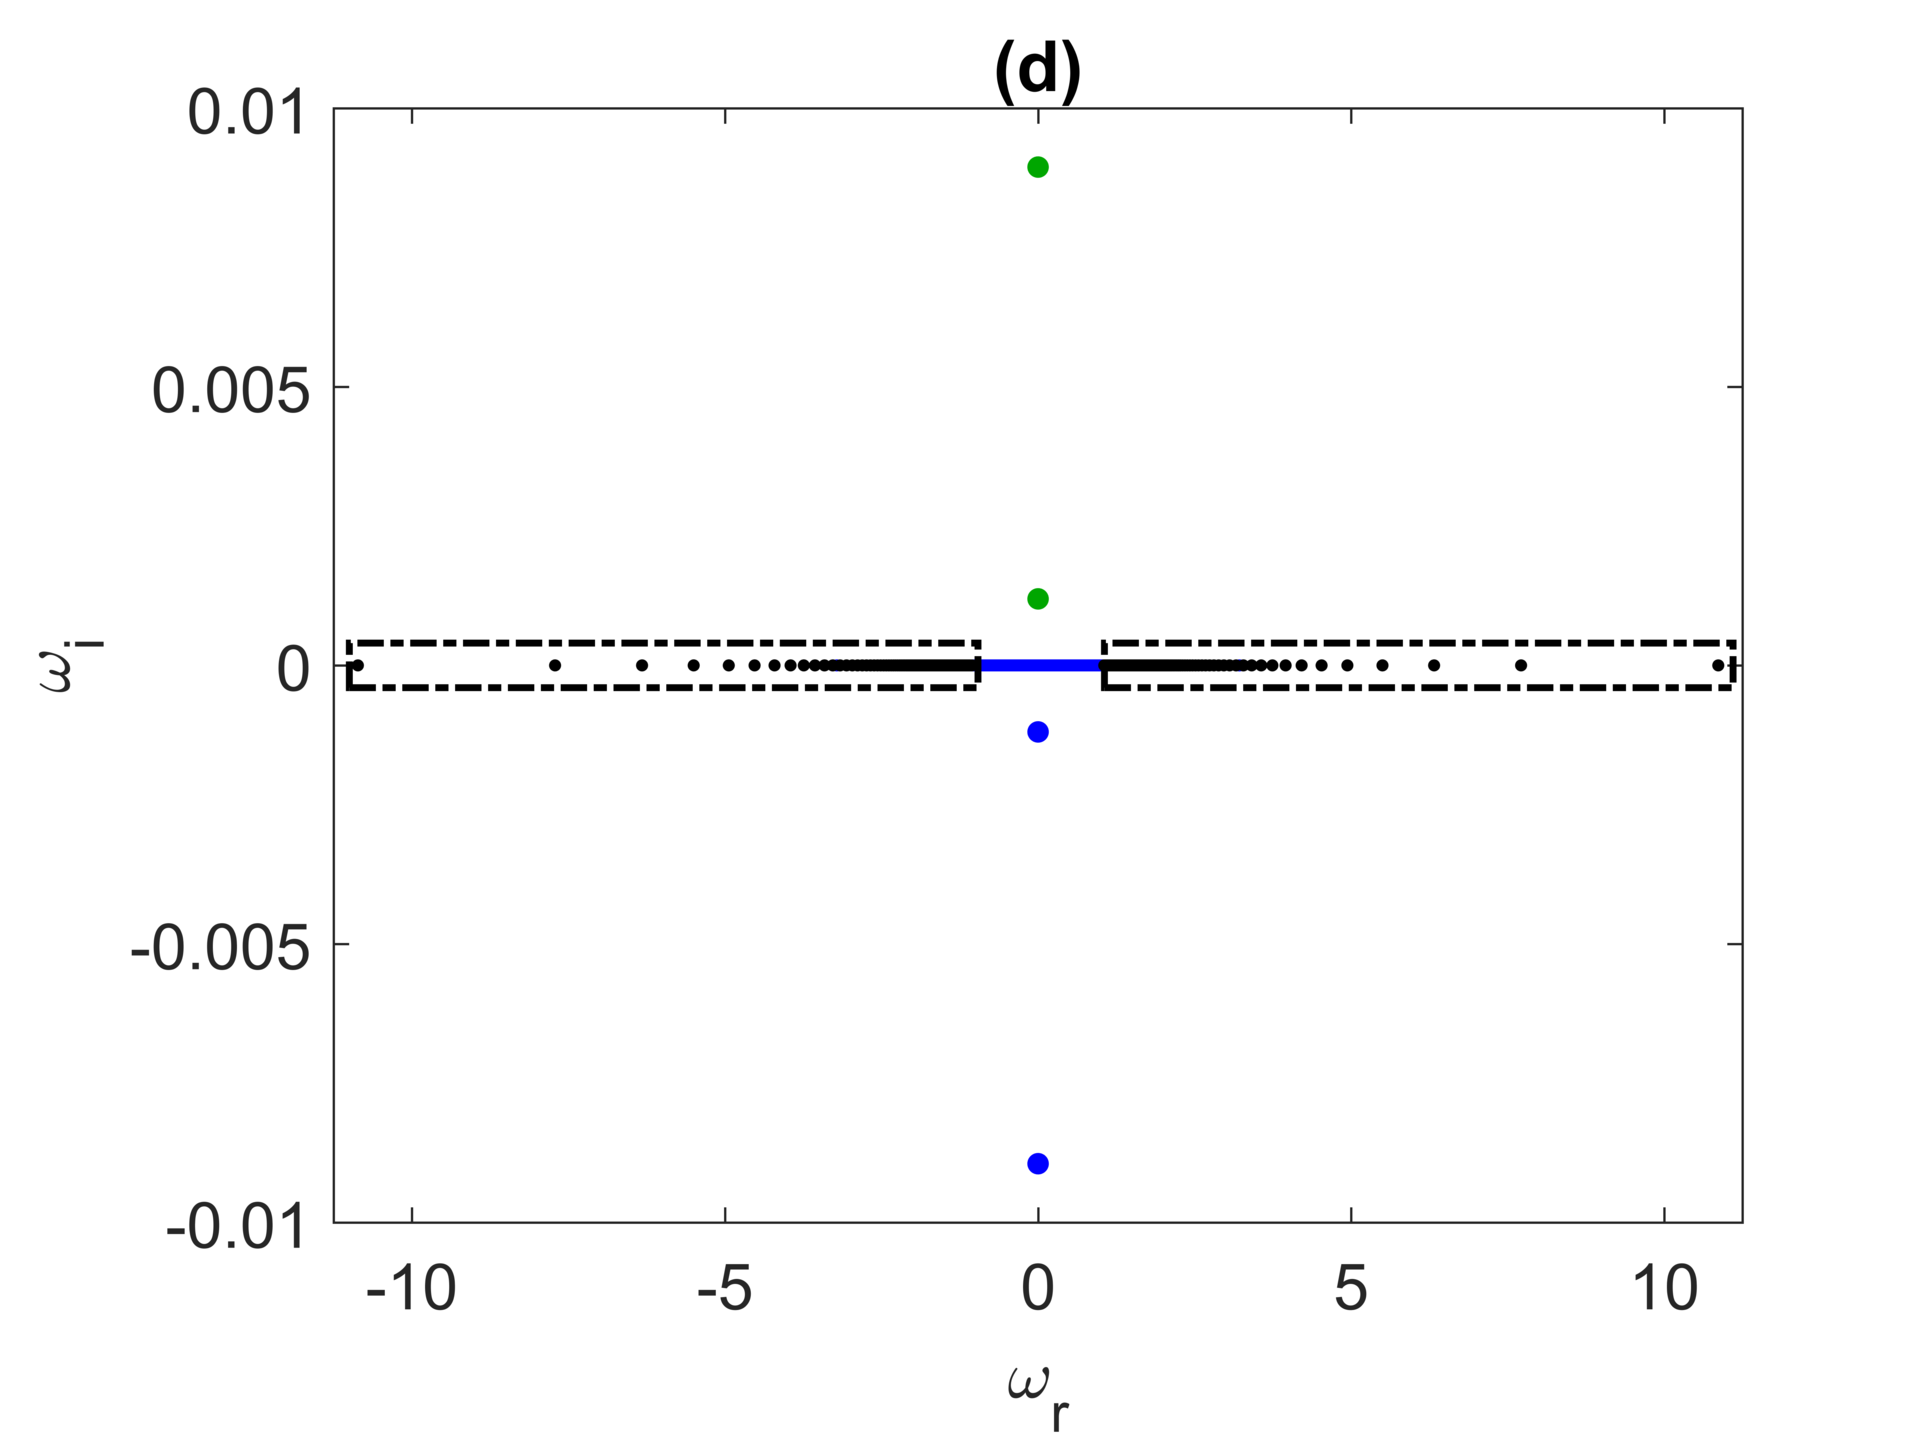
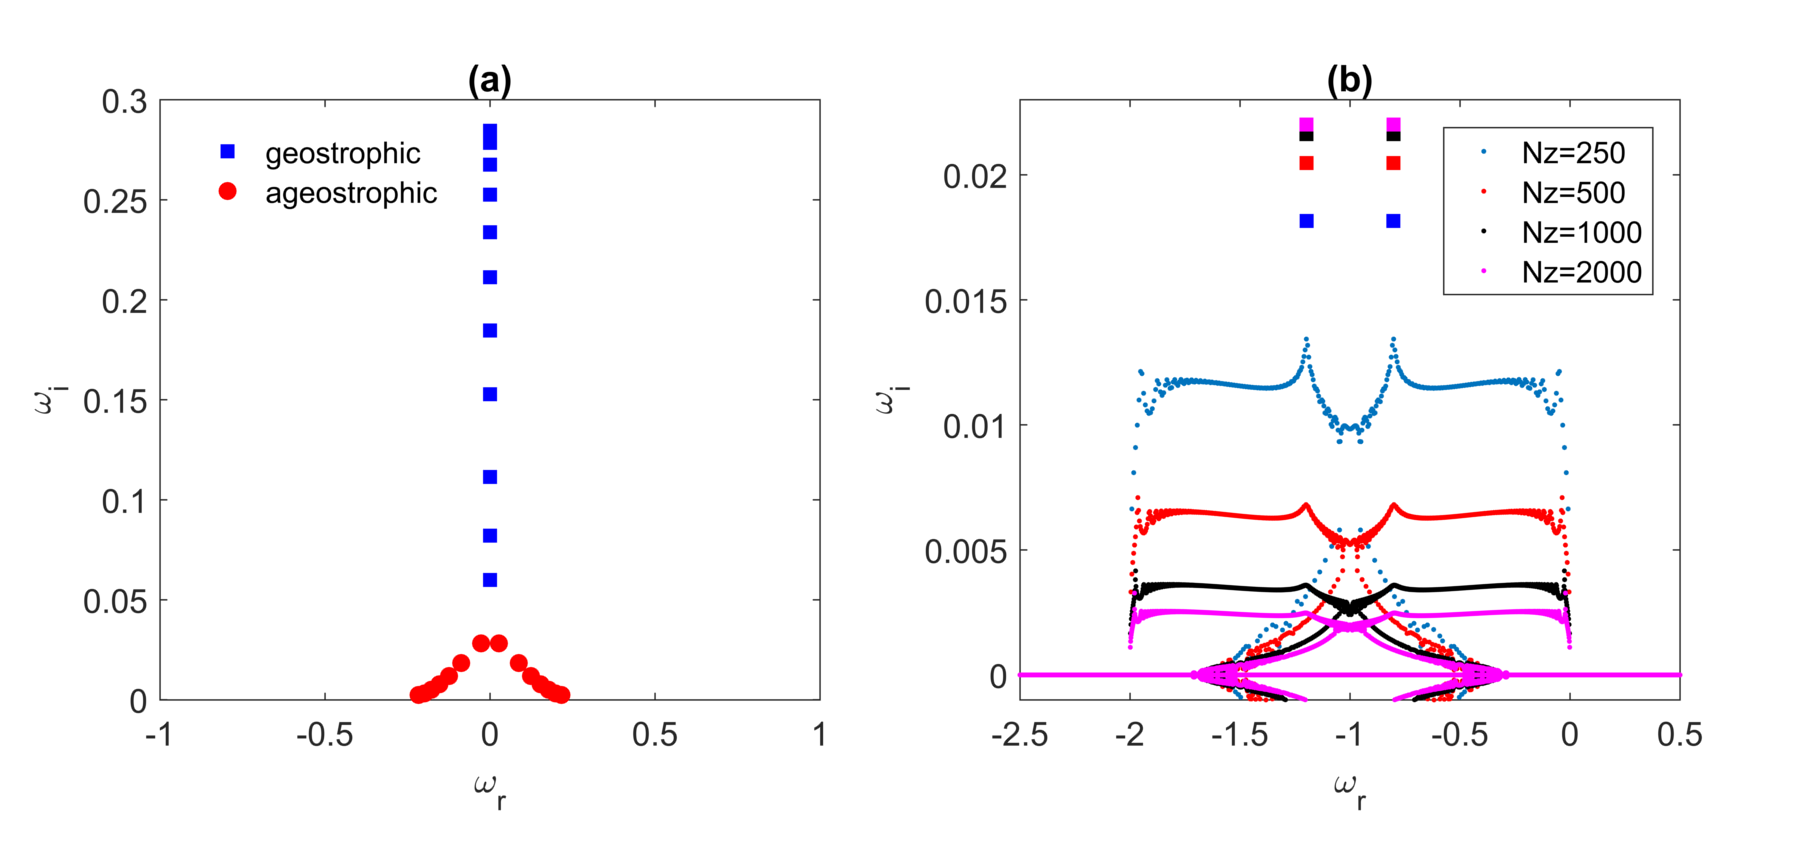
Figure 1 shows eigenspectra for the solution to the system of equations (4) for a characteristic case where , , , and , which is a geostrophic mode. As previously discussed in Heifetz:03, the eigenspectrum consists of four separate branches, which are detailed below, separated into modes that are to be discarded because they are spurious and unresolved or the physical modes that are numerically resolved and used to compute transient growth:
-
•
In Figure 1(b), two branches are shown by black dots with purely real frequencies, the ranges for which are calculated in the next subsection. These modes are the inertia-gravity waves (i.e. Poincaré modes), which are sinusoidal in nature and therefore orthogonal with respect to the other modes. They are associated with critical layers corresponding to , as will be derived in the next subsection.
-
•
Rotational singular modes are shown by red dots. These modes are associated with critical layers (i.e. ) and have and non-zero . Their frequency and growth rates are within a red dashed box, which will be defined in the following subsection. From Stone:70, we know that there is only one unstable mode at these parameter values (, , Ri, and ). These additional modes with non-zero growth rates, as will be shown later, are spurious, and arranged in a ring-type structure.
-
•
The most unstable mode with corresponding to the previous calculations by Stone:70; Stone:71 and is shown in green.
-
•
The remainder of the spectra is shown in blue and corresponds to physical modes numerically captured by our discretization and whose growth rate is zero as computed by Stone:70.
The geostrophic (fig. 1(a,b)), ageostrophic (fig. 1(c)), and symmetric (fig. 1(d)) modes have eigenspectra with similar anatomy. Note that for symmetric modes, , meaning that the rotational singular modes are not present in the eigenspectrum, and the unstable modes have . For the values of chosen, there are two unstable modes with , which are discussed in §4.1.
For parameter values corresponding to the ageostrophic modes, there are two modes that have the most unstable growth rates, with symmetrically distributed about . These modes result from the two critical layers discussed in Nakamura:88 in the ageostrophic regime, and are also found in the eigenspectrum for large by heifetz2007generalized. Analogously, Nakamura:88 finds one critical layer in the geostrophic regime, corresponding to a singular unstable mode shown in figure 1(a). The most unstable modes collapse on to a curve when they are rescaled by , such that , which is shown in figure 2(a) over a range of values for , , . The structure of the rescaled modes resembles the steering level analysis on Nakamura:88 with one steering level (singular unstable mode) for the geostrophic modes, and two steering levels (two unstable modes) for the ageostrophic modes.
The selection criteria are explained in the following subsections using asymptotic expansions for both the inertial gravity waves and the critical layer modes using dispersion relations. The singular behavior of critical layers will translate into spurious eigenvalues and eigenvectors with strong oscillations in the vertical direction. The idea in the following is to identify these spurious modes by finding a range of wave frequencies that represent them in terms of the vertical wavenumber , whose range depends on the number of the vertical discretization points of the domain.
2.4 Inertia-gravity waves
Transient growth arises from the non-normality between eigenvectors. Normal modes that do not project onto the initial optimal perturbation may therefore be discarded prior to computing the optimization procedure for transient growth. In particular, modes with a large wavenumber in the vertical direction are likely to
be poorly resolved by the present numerical approach and it is of advantage to identify and remove these modes from the subspace considered for the transient growth analysis.
Inertia-gravity waves, also known as Poincaré waves, are normal by nature and can be recovered from Stone’s equation. Starting with the dimensional form of (7)
| (8) |
we seek shear-independent solutions of (8) in the near quasi-geostrophic limit (i.e. ) and the non-dimensional form of (8) reduces to the vertical velocity equation
| (9) |
which is a modified version of the Poincaré wave equation from Heifetz:03, with a Doppler shift of the eigenvalue frequencies by . These modes correspond to large oscillations in the vicinity of the critical layers associated with . The dispersion relation is recovered by setting and and
| (10) |
where is the vertical wave number for the short-wavelength oscillations in the vicinity of the critical layers, which depends on the vertical discretization . The modes with this dispersion relation 10 are shown in black in figure 1 within the dash-dotted boxes.
2.5 Critical layers
The above dispersion relation allows for discarding the Poincaré modes located along the real axis but there remain complex conjugate eigenvalues in the vicinity of the Doppler-shifted frequency, shown in red in figure 1. These modes were highlighted by Nakamura:88, damped using viscosity in Heifetz:03 and are solutions of (7) in the near quasi-geostrophic limit. Following Nakamura’s approach (Nakamura:88), is the wave speed and . Equation (8) is non-dimensionalized in the neighborhood of the critical altitude where :
| (11) |
In this limit, the dependence on which drops as we seek for solutions . In the dimensional form, after dividing through by , equation (8) becomes
| (12) |
which in non-dimensional form becomes
| (13) |
The resulting dispersion relation of the Taylor-Goldstein type equation (13) is found to be the same as the Eady:49 problem (i.e. the near quasi-geostrophic approximation of (4) from Nakamura:88). Thus, we derive our selection criteria by considering the solution of (13) where again, and . This is equivalent to solving the dispersion relation
| (14) |
The eigenmodes that are solutions to (13) are shown in figure 1(a,b) with red circles, and the range for their real and imaginary parts can be obtained from the dispersion relation (14) shown by the dashed red boxes.
The range of of these spurious modes is always (corresponding to and ), as has been previously noted by Heifetz:03, because these modes are associated with the critical layers arising from the singularity in (7). Hence, these modes are spurious, resulting from the numerical discretization of strong oscillations in the vertical direction near critical layers.
The range of in (14) is a function of , which depends on the number of vertical discretization points ( because these oscillations have wavelengths smaller than ). It is worth noting that the growth rates of the spurious modes increase linearly with increasing mesh sizes .
While we cannot compute the exact values of for each of the spurious modes from (14) because we do not a priori know the vertical wavenumber of each oscillation at each critical layer, we can obtain a range of growth rates for these spurious modes that guides our selection of the physical modes, and allows us to draw the dashed red boxes in figure 1.
As we increase , the number of discretization points in the vertical, the growth rates of these spurious modes are dampened but do not converge, unlike those of the physical modes (indicated in green in figure 1) that converge with finer discretizations. The decrease in the growth rates of these unphysical modes is consistent with the dispersion relation (14), in which the imaginary part decreases with increasing (or finer mesh discretization due to larger ). An example to illustrate this phenomenon is shown in figure 2(b) for a test case with , , , . For these spurious modes, as , so their growth rates (and their large contribution to transient growth) can be eliminated with sufficiently high discretization (MolemakerM:05), but the computational time for the direct method that solves for all eigenvalues increase with the cubic power of the order of the matrix ( for our reduced system (4)).
However, utilizing the dispersion relation 14, we can identify and eliminate the spurious modes at substantially coarser grid resolution without sacrificing the accuracy of the solution.
The unphysical modes, such as the ones that we find, are also known to occur when the number of independent variables in the incompressible Navier-Stokes equations is reduced via algebraic constraints (Manning:07), as is the case in this paper where we obtain the reduced system (5).
These modes arise from the numerical approximations, in particular in the vicinity of critical layers, and do not converge as the mesh is refined (Walters:83). They have previously been found in many hydrodynamic stability problems, including the numerical solutions of the Orr-Sommerfeld equations for viscid shear flows (Gary:70; Orszag:71; Gardner:89).
As a result, the only modes considered for the transient growth analysis are depicted in blue in figure 1 together with the unstable mode(s) in green. We show in the following that these modes represent an appropriate subspace for inviscid transient growth calculations. The selected spectra avoid spurious eigenvalues and carefully select resolved eigenvalues in a systematic manner.
3 Transient growth
The system of equations that, when linearized, forms the eigenvalue problem (5) and can be generally expressed as an initial value problem, which in the matrix form writes:
| (15) |
Its solution is given by the matrix exponential:
| (16) |
In the remaining, we seek to maximize the energy gain defined by
| (17) |
for a given time of optimization over all non-zero initial conditions. The norm is the integral of the energy at time and is the energy of the initial condition , given by the scalar product . In terms of dimensional variables, , it is defined over the computational domain such that
| (18) |
and is the sum of kinetic and available potential energies (Lorenz:55; Passaggia:17; scotti2019diagnosing). The non-dimensionalised energy norm is
| (19) |
and expressing the perturbation velocities and in terms of perturbation vertical vorticity , the non-dimensional energy norm is
| (20) |
with the energy norm matrix
The matrix is positive definite and has a Cholesky decomposition such that for some matrix (schmid2012stability), and the energy norm for some vectors and can be converted to the -norm such that
| (21) |
The optimal transient growth can then be expressed as
| (22) |
where is the diagonal matrix containing the eigenvalues obtained by calculating the normal modal growth after discarding the spurious vectors. The singular value decomposition of the matrix yields matrices , , and . The largest singular value corresponds to , whereas the initial conditions associated with the maximum amplification at time are found in the first column of matrix . The resulting perturbation fields are contained in the first column of matrix .
4 Results
4.1 Normal Modal Growth
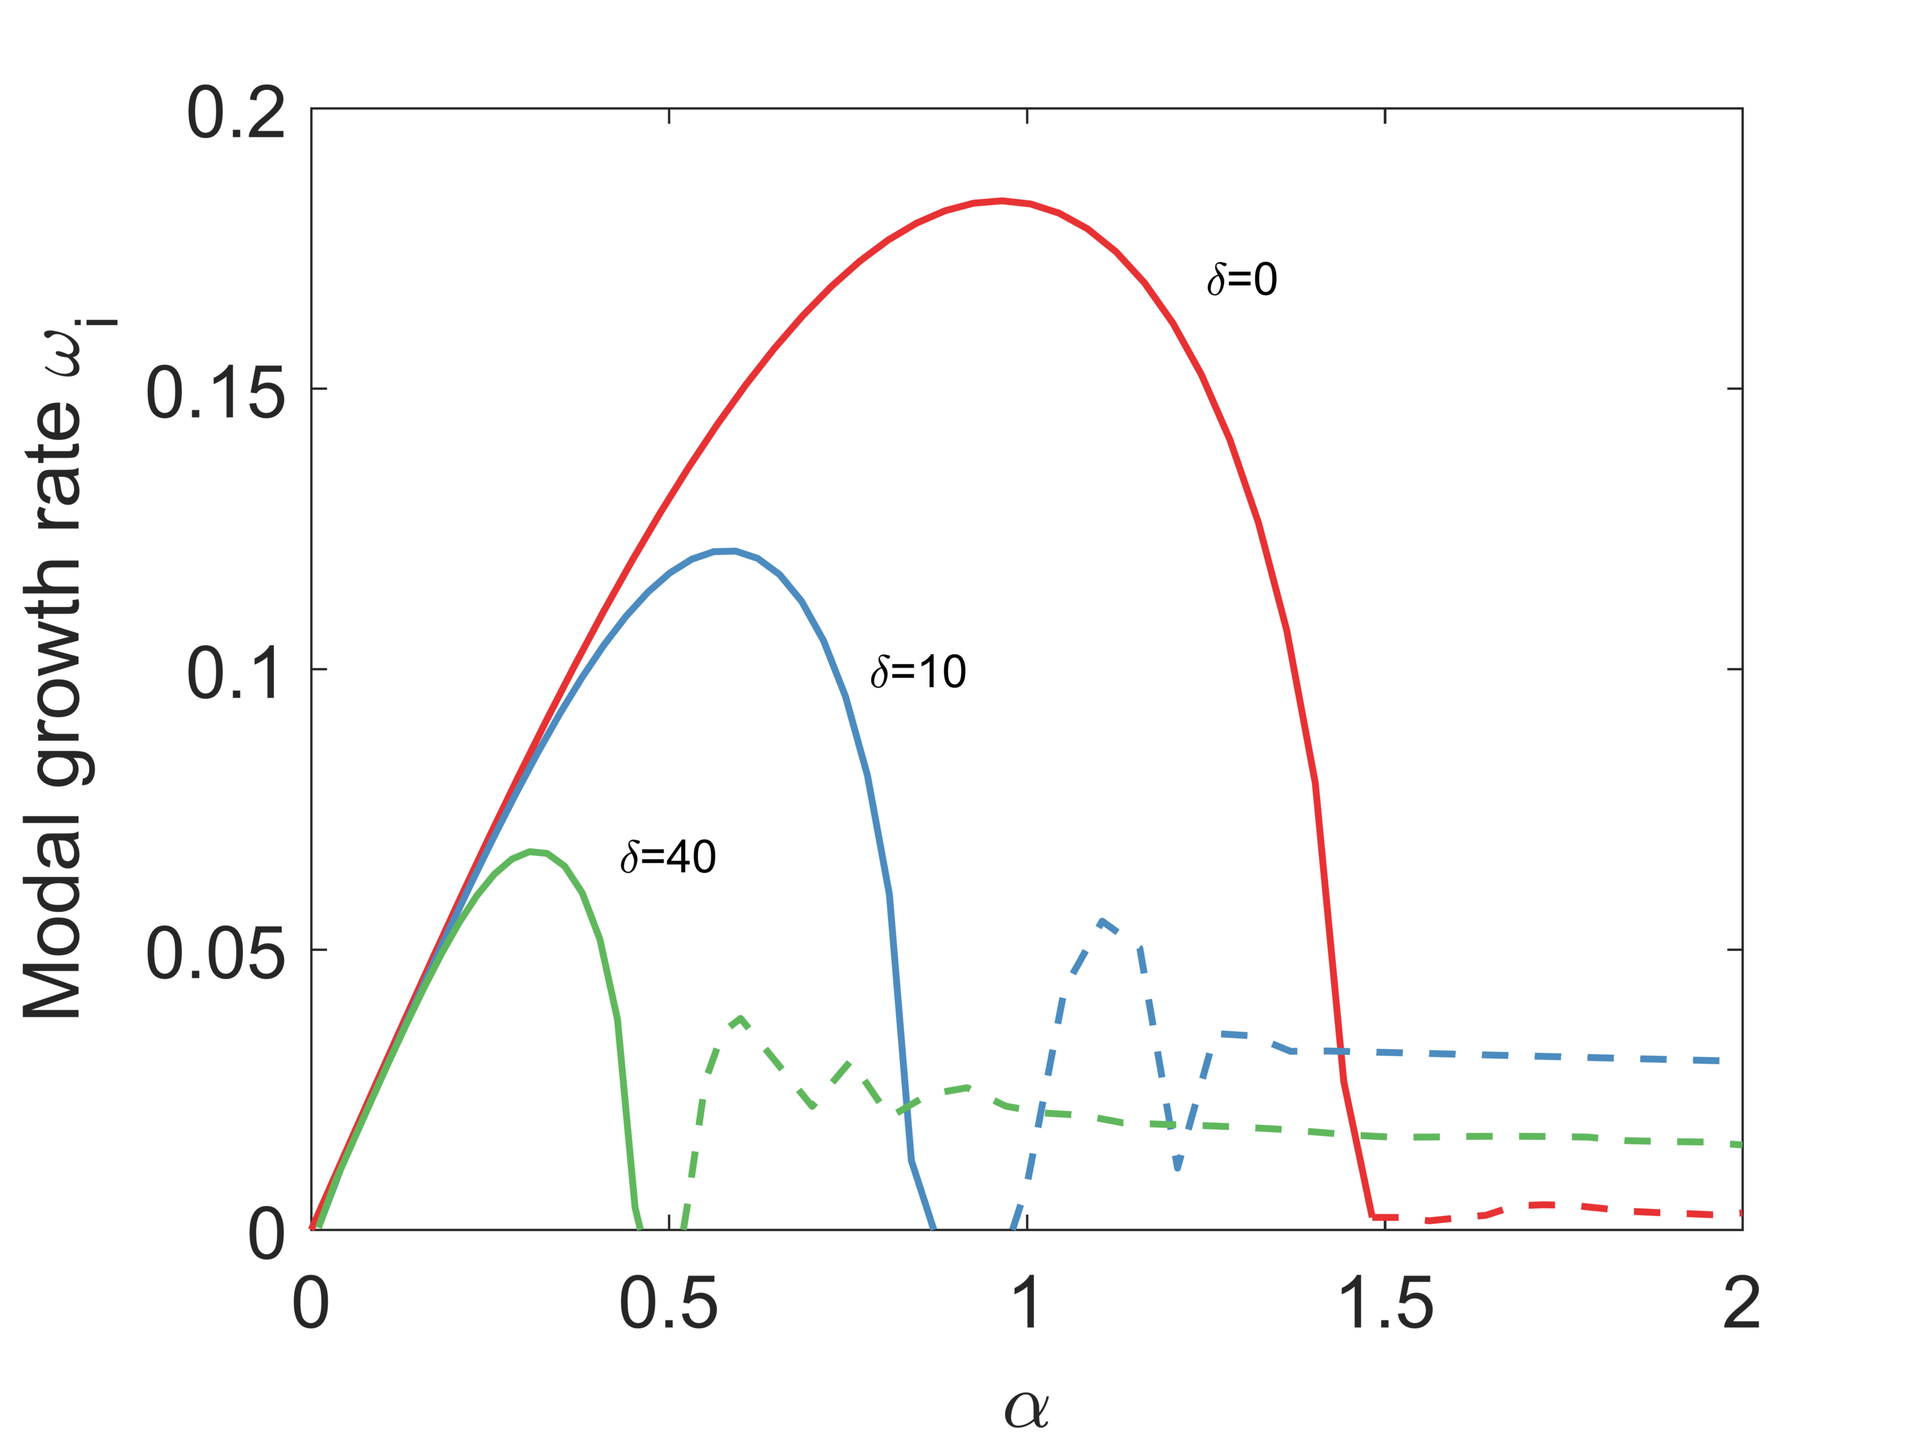
We begin with the validation of our approach and seek to reproduce the theoretical eigenspectrum of Stone:70; Stone:71 and the numerical solution of MolemakerM:05 with respect to our solution strategy considering the coupled velocity-vorticity-buoyancy in system (4). We employ the finite differences-type scheme used by MolemakerM:05 who studied the coupled velocity-pressure system and we calculate the normal mode growth rates for different values of Ri, and . Figure 3(a) shows across values for and , corresponding to Figure 1 in Stone:70, where it is worth noting that the normal mode growth rates are lower under nonhydrostatic conditions ().
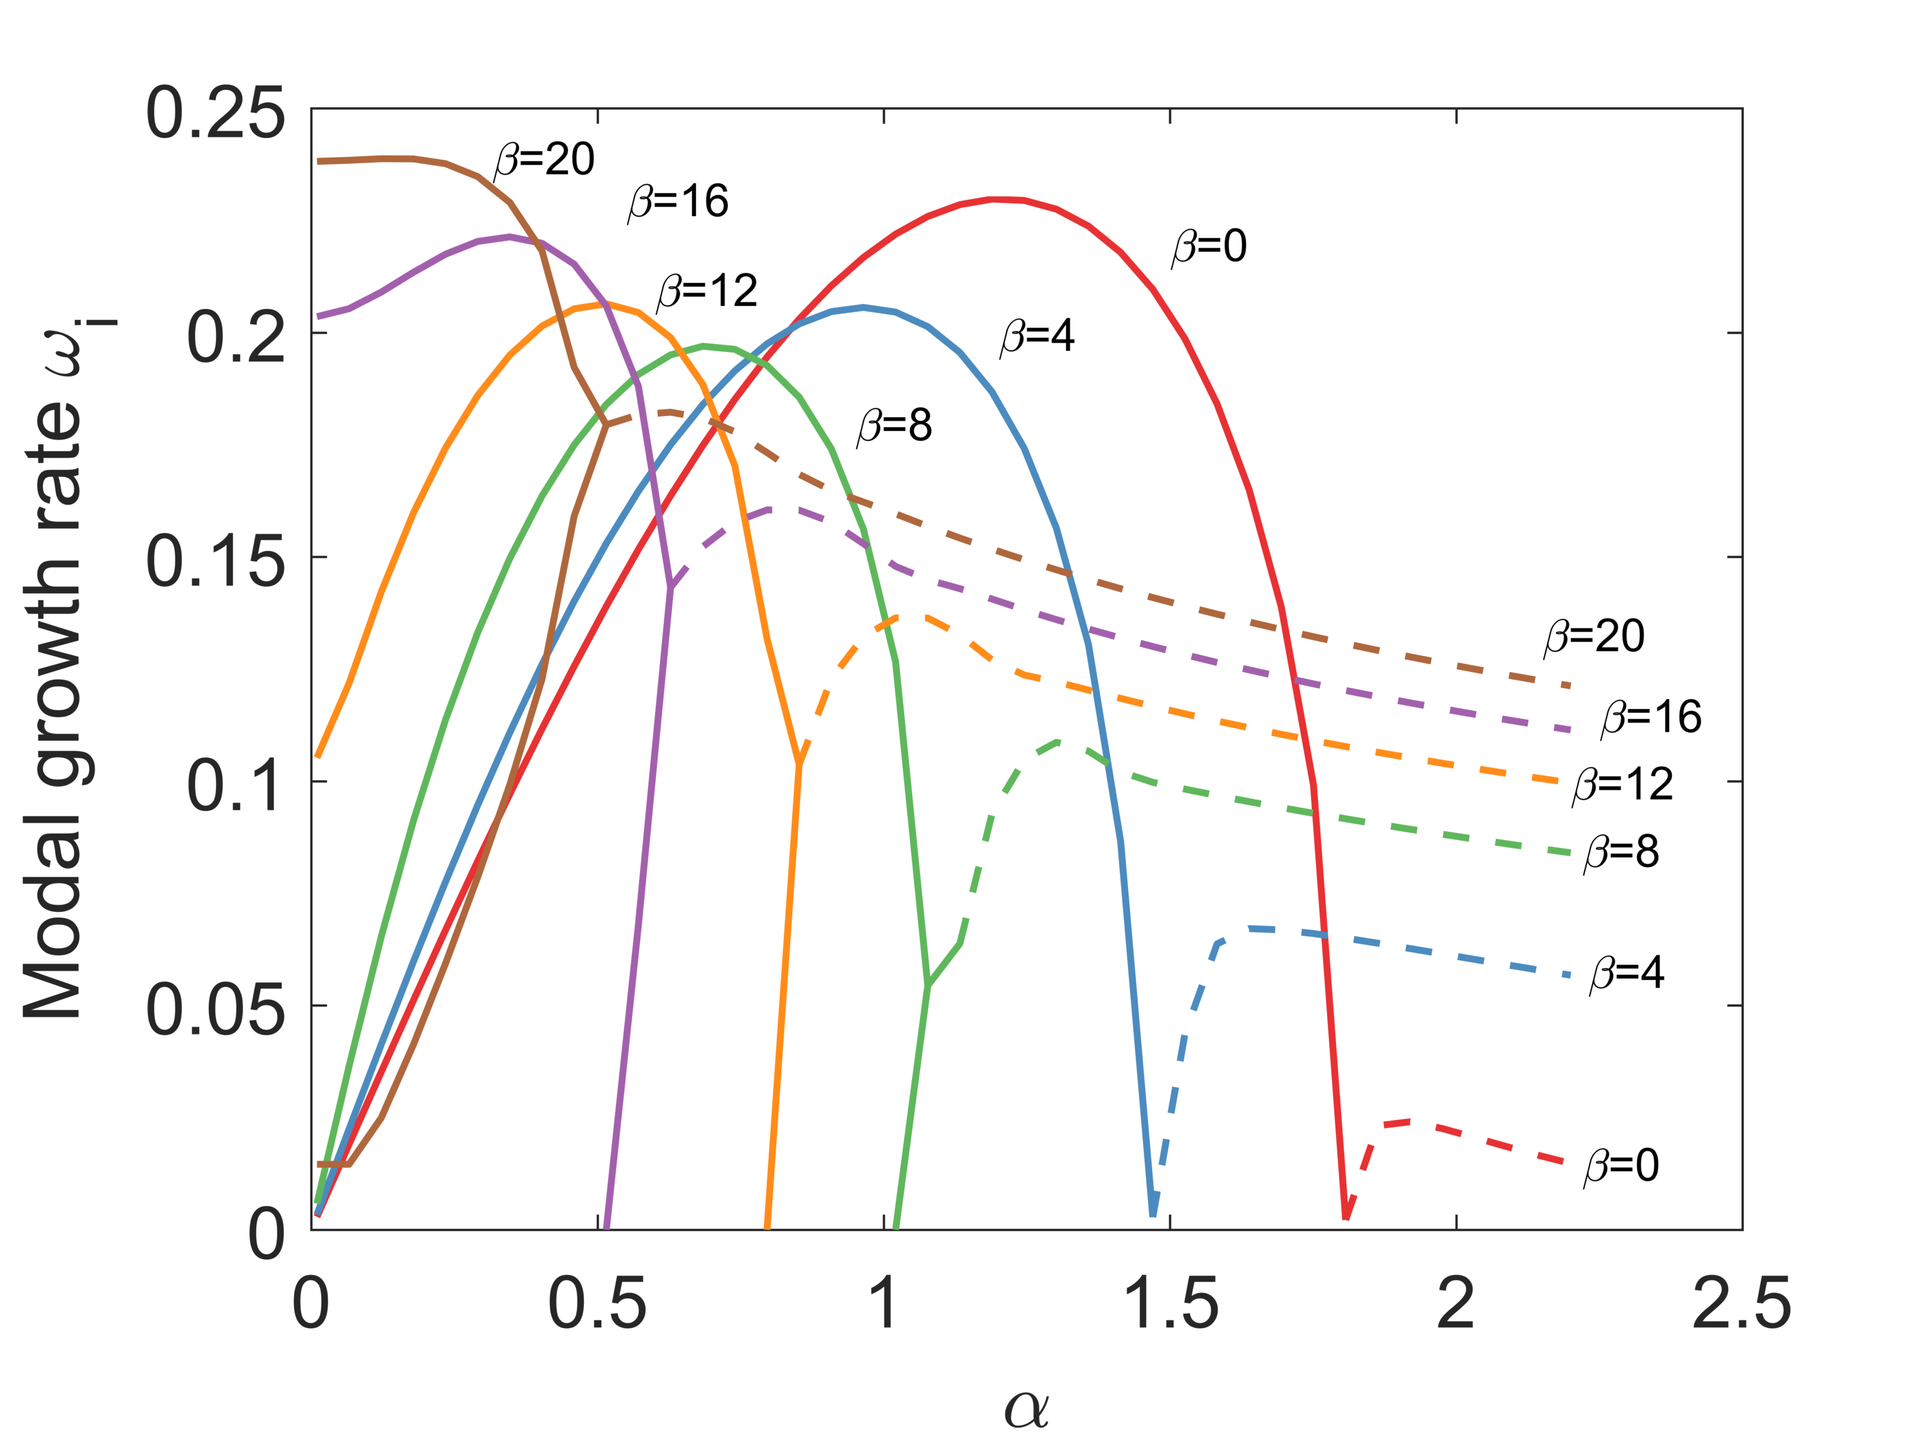
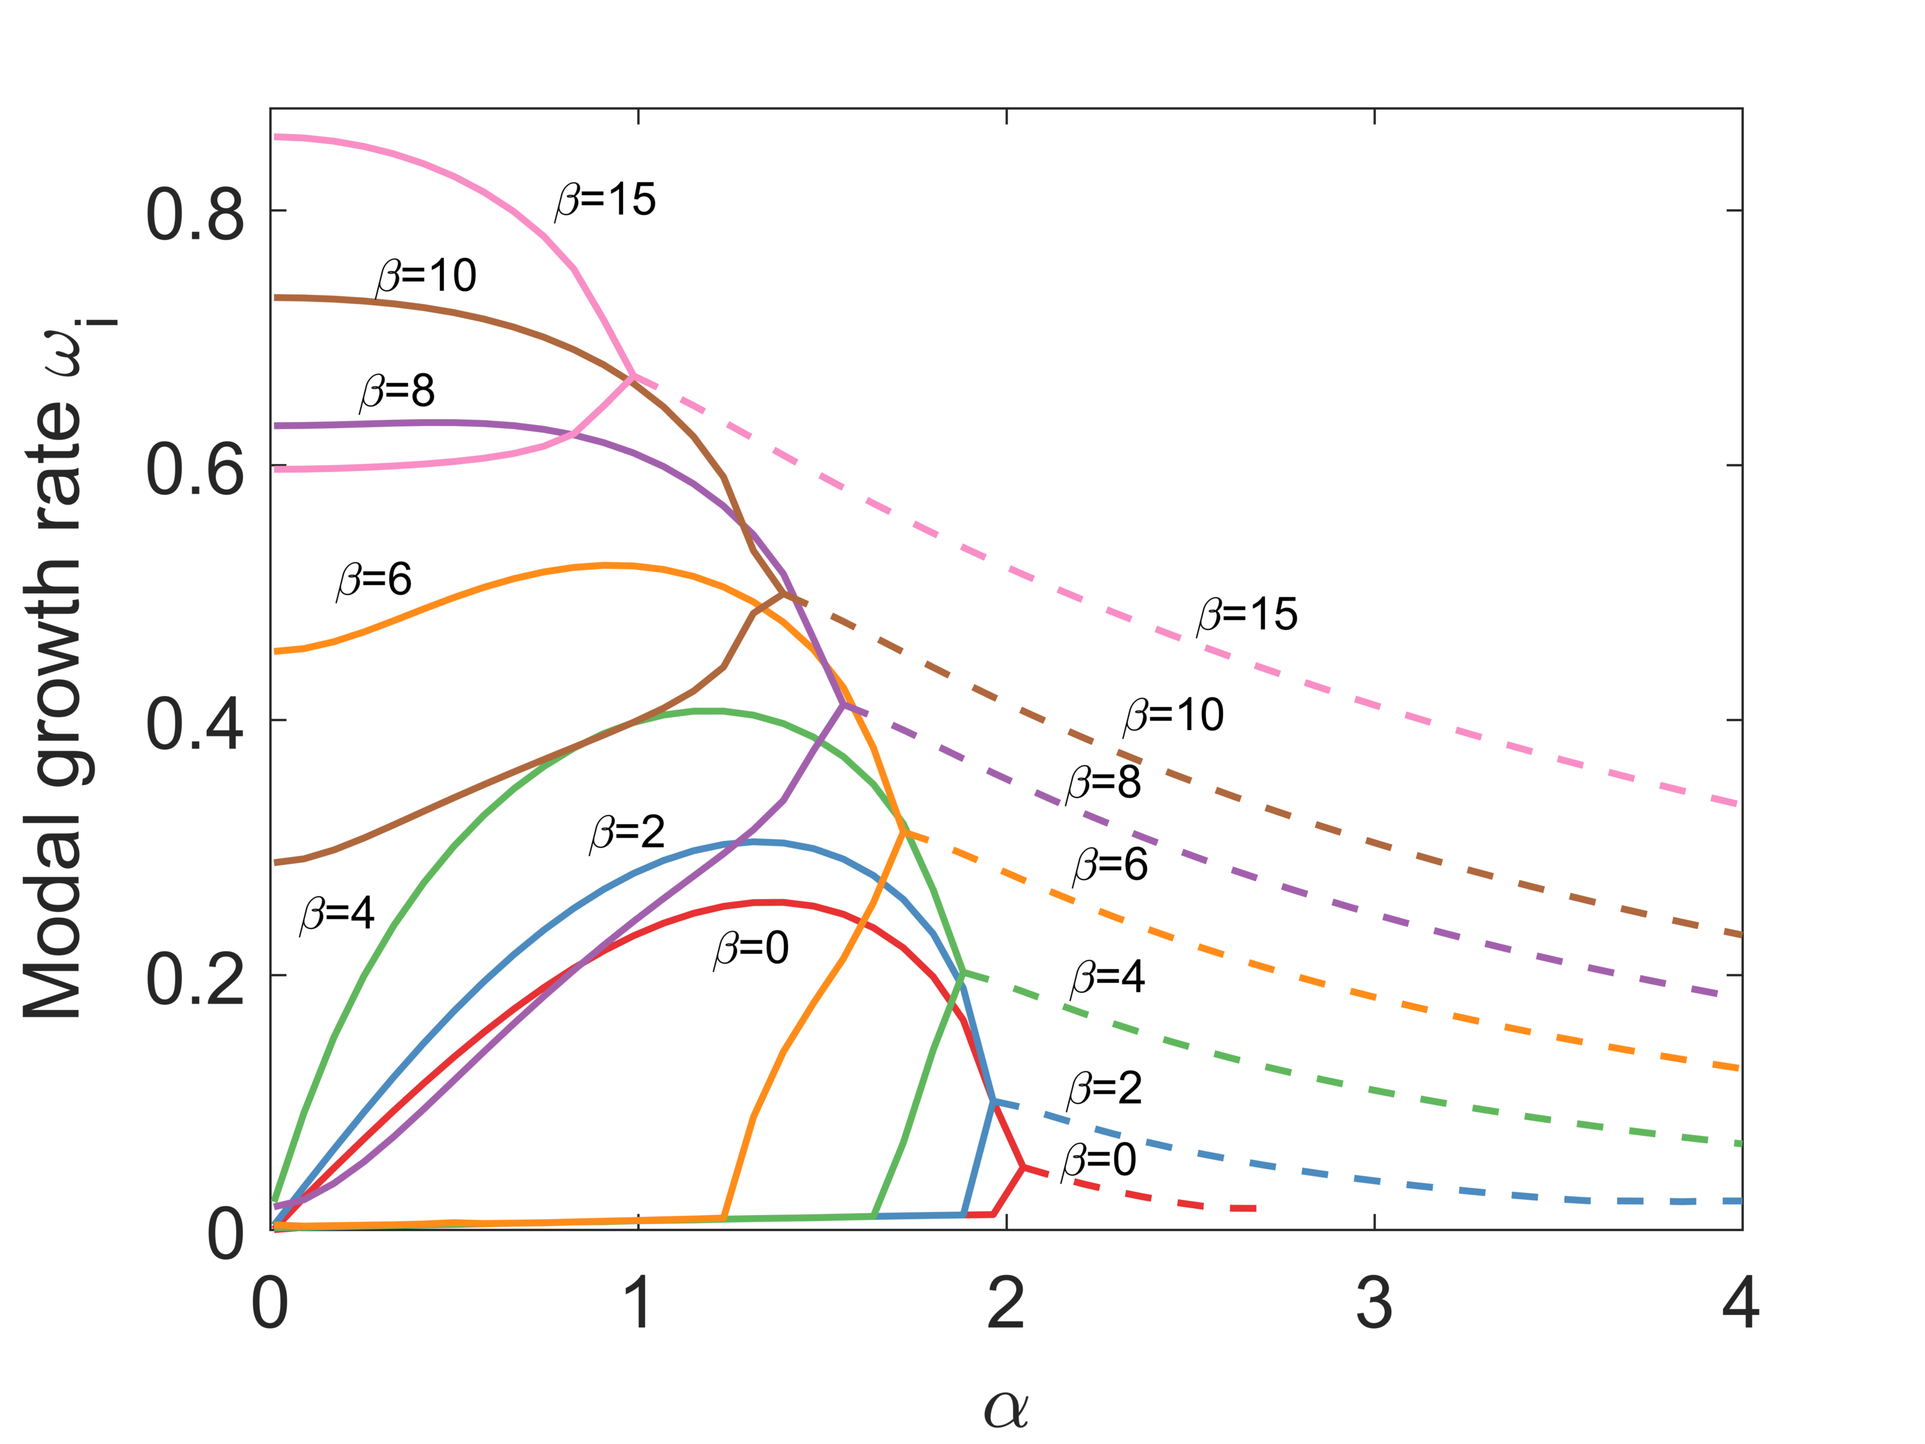
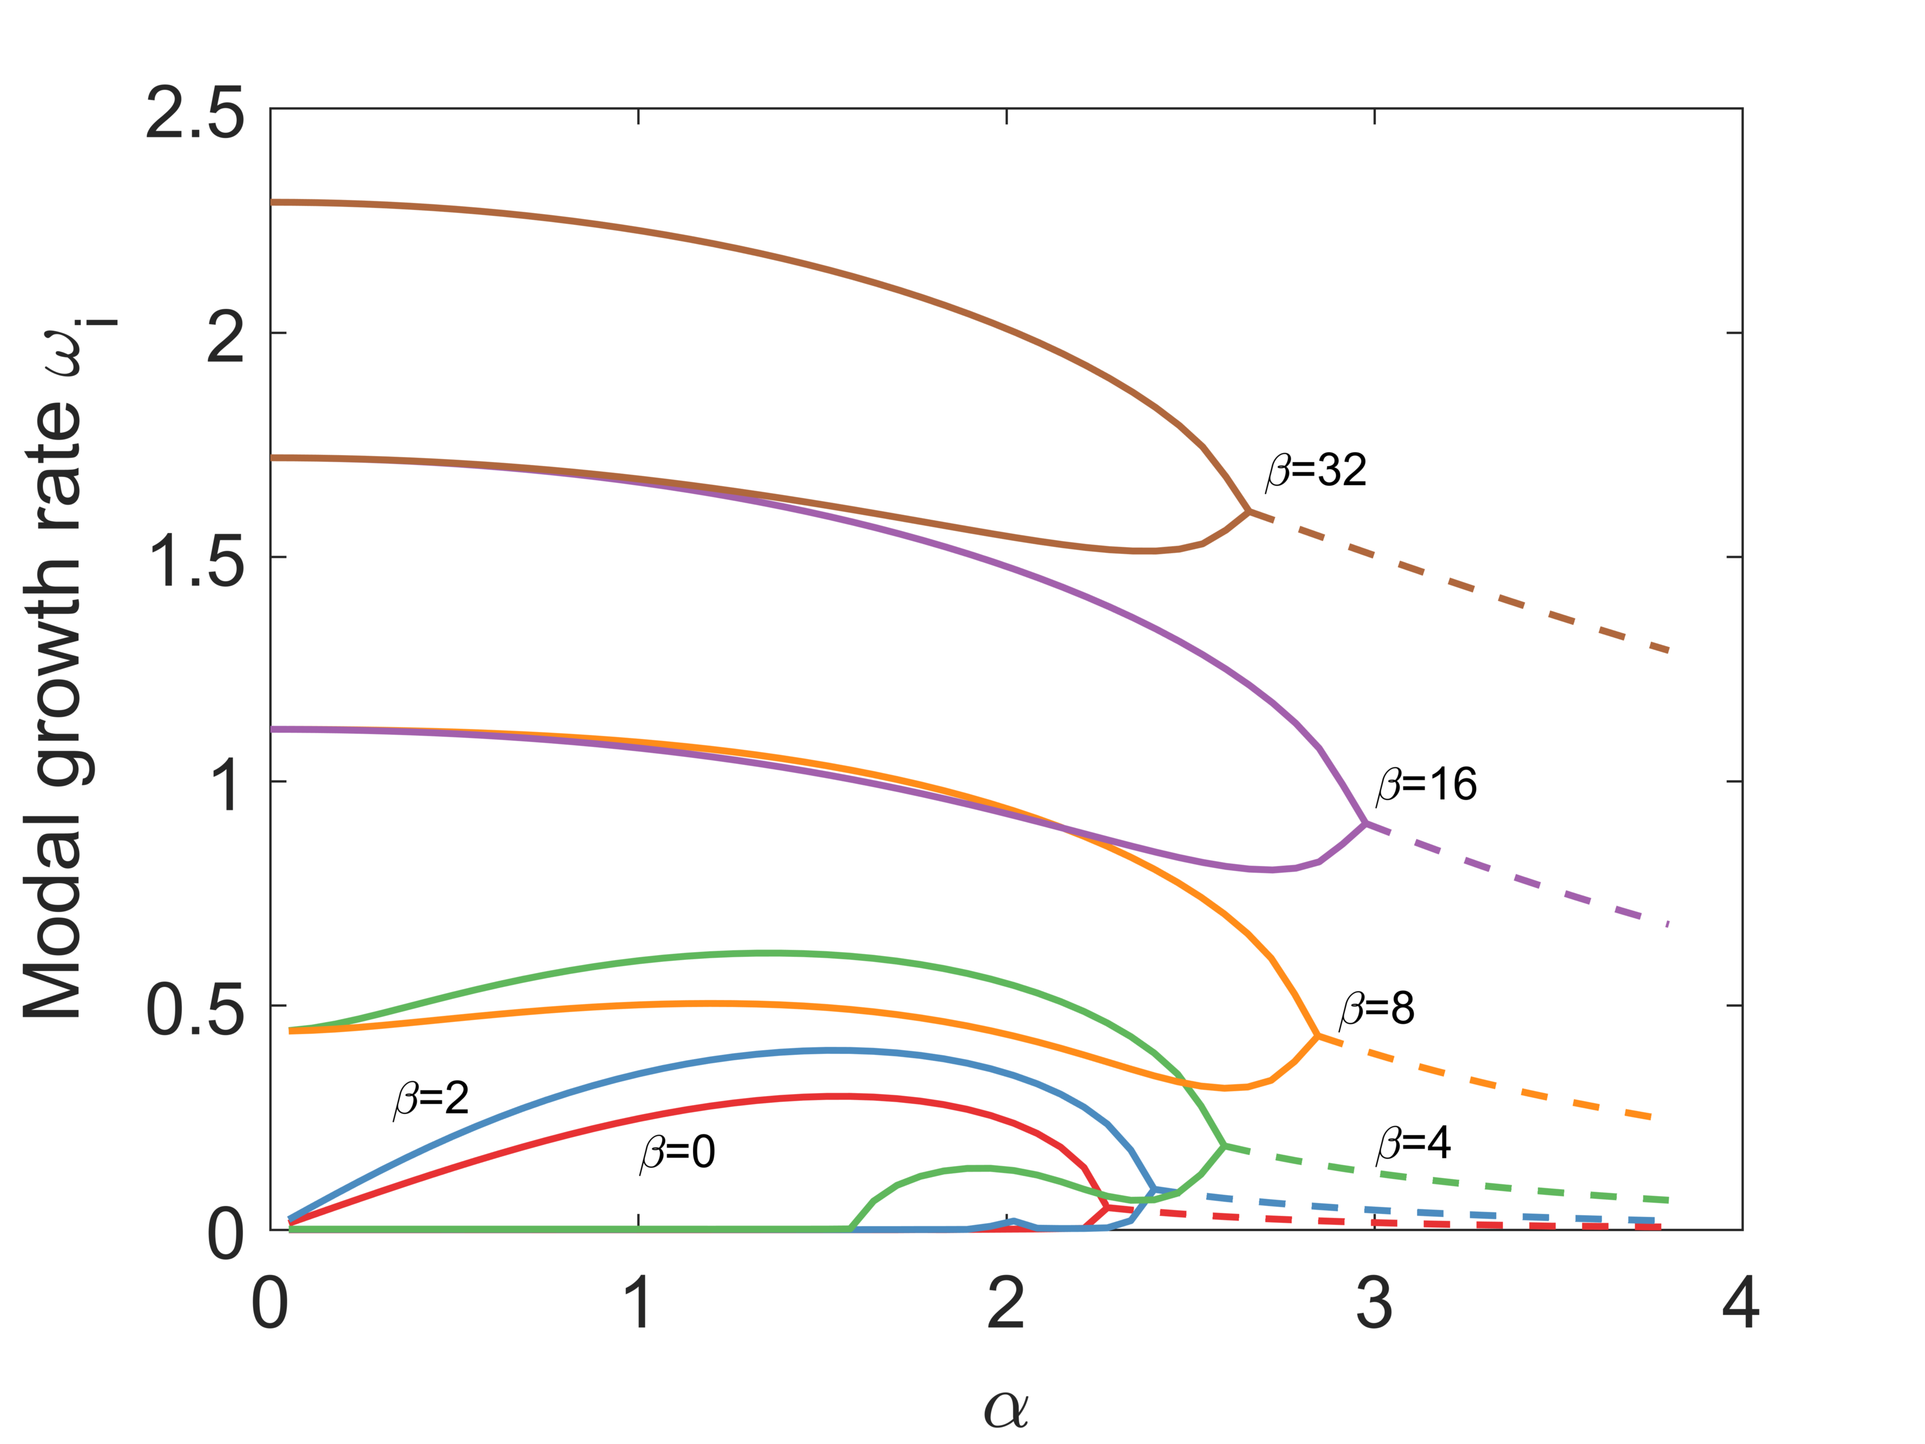
Figures 3(b-d) show a sweep over both zonal and meridional wave numbers under hydrostatic conditions for decreasing values of Ri, and correspond to figures 3, 4, and 5 from Stone (1970), respectively.
In (figure 3(b)), we see a transition between regime where baroclinic instabilities dominate and the regime where
unstable symmetric modes
become prominent. At lower values, the maximum modal growth rate occurs when and decreases with increasing values, and there are no
unstable symmetric modes
as there is no growth when the zonal wavenumber is zero. At higher values, this growth rate is non-zero for , indicating the presence of
unstable symmetric modes. At lower Ri values (e.g. , figure 3(c)), these instabilities become significant for smaller meridional wave number values.
For each given value, there are two sets of instabilities: geostrophic for smaller values (shown in solid lines) and ageostrophic for larger values (shown in dashed lines). Stone:70 discussed the possibility of small ageostrophic growth rates even for ; while Stone:70 was unable to verify their existence numerically, these smaller growth rates were later calculated by MolemakerM:05, who utilized a high-resolution grid, finer than the number of discretization points used in the present study. We also find the ageostrophic modes for as shown in figure 3(a), which become more significant in the nonhydrostatic regime.
For , there can be more than one unstable eigenmode for certain combinations of and values. The growth rates for the first two non-zero unstable eigenmodes are plotted in figures 3(b-d) for and , respectively. These eigenmodes join together at an intermediate value and continue as an ageostrophic instability for increasing zonal wave number values . There are
unstable symmetric modes
present at these values of Ri, indicated by the increasing growth rate for and large values. However, in the case of small , there still exists the dominance of the geostophic instabilities whose growth rate peaks at and decreases with increasing values of .
Figure 3(d) shows the modal growth rates for . Both first and second eigenmodes are significantly greater than those at lower Ri values for all combinations of and . This regime is dominated by
unstable symmetric modes
while their growth rates increase with for all values of .
4.2 Non-modal growth
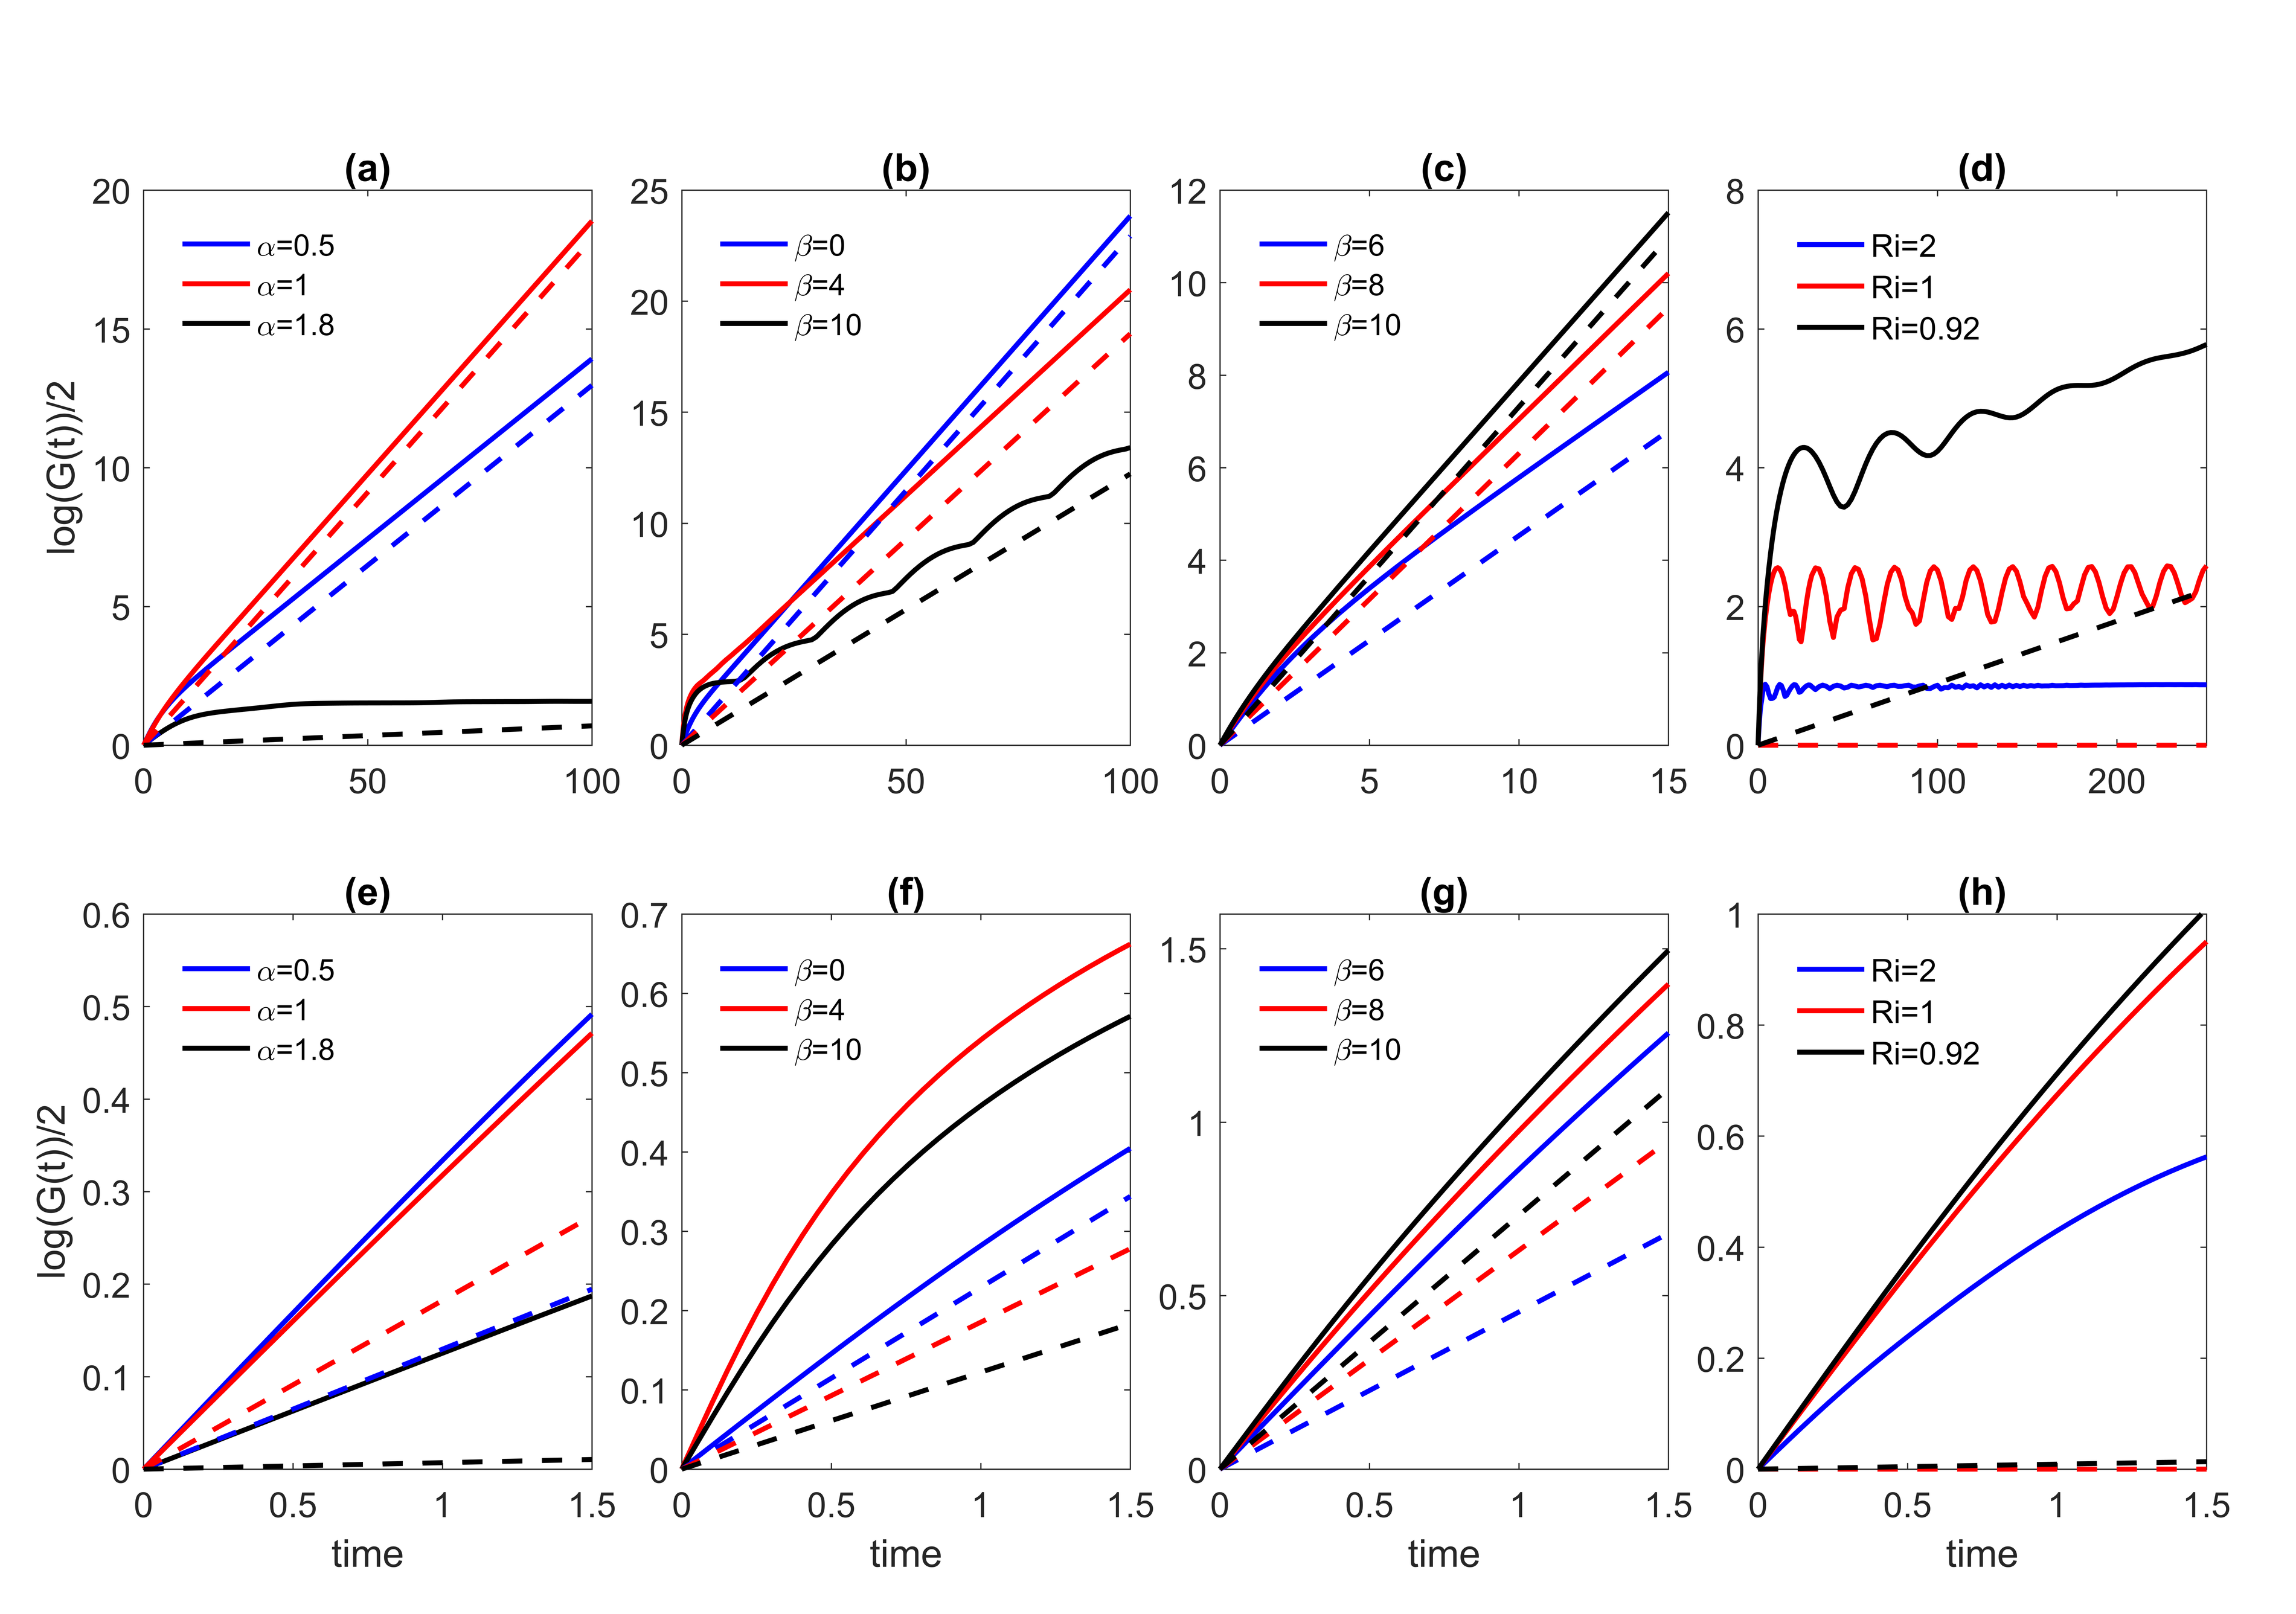
A natural approach to validate the optimal transient growth calculation is to consider the long time asymptotics where for optimization horizons , the associated transient growth rate should asymptotically converge to the most unstable normal-mode growth rate. Hence we study the long-time dynamics for and observe the optimal energy gain rate approaching the normal growth rate , calculated in §4.1. Figure 4 shows the optimal energy growth (solid lines) and the normal modal growth (dashed lines) for different combinations of Ri, , and . For short optimization times, shown in the zoomed-in bottom panels of figure 4, the energy gain can exceed the modal energy gain provided by the modal growth rate quite significantly, indicating the effect of additional non-normal mechanisms, but as , the slope of the optimal growth approaches asymptotically that of the modal growth rate .
We first compare geostrophic and ageostrophic instabilities of pure baroclinic instabilities () across at in fig. 4(a,e) and of mixed modes across values with at in fig. 4(b,f). Mixed modes refer to the three-dimensional instabilities where and .
The growth rates of the ageostrophic instabilities are much more amplified by the transient dynamics than those of the geostrophic modes. At (fig. 4(e)), the modal growth rate for the ageostrophic mode () is 18-25 times smaller than the rates of geostrophic modes (), but its short time optimal energy growth is only one-third of that of the geostrophic modes. For the mixed modes at (fig. 4(f)), the ageostrophic mode () has optimal energy gain comparable to that of the mixed geostrophic mode () and greater than that of the pure geostrophic mode () at short time, despite having half the modal growth rate.
The temporal evolution of the energy growth for the unstable symmetric modes
() are shown in fig. 4(c,g) at . The highest rate of the energy growth rate amplification by transient dynamics occurs at low value: short-term optimal energy gains for symmetric modes with increasing are almost equal even though the modal growth rates vary significantly at for each of the respectively.
Figure 4(e,h) shows
unstable symmetric modes
for different across the stability boundary (see figure 5) from Stone:70. While the linear stability analysis predicts no energy growth at , we observe considerable non-zero transient energy growth at for several inertial periods.
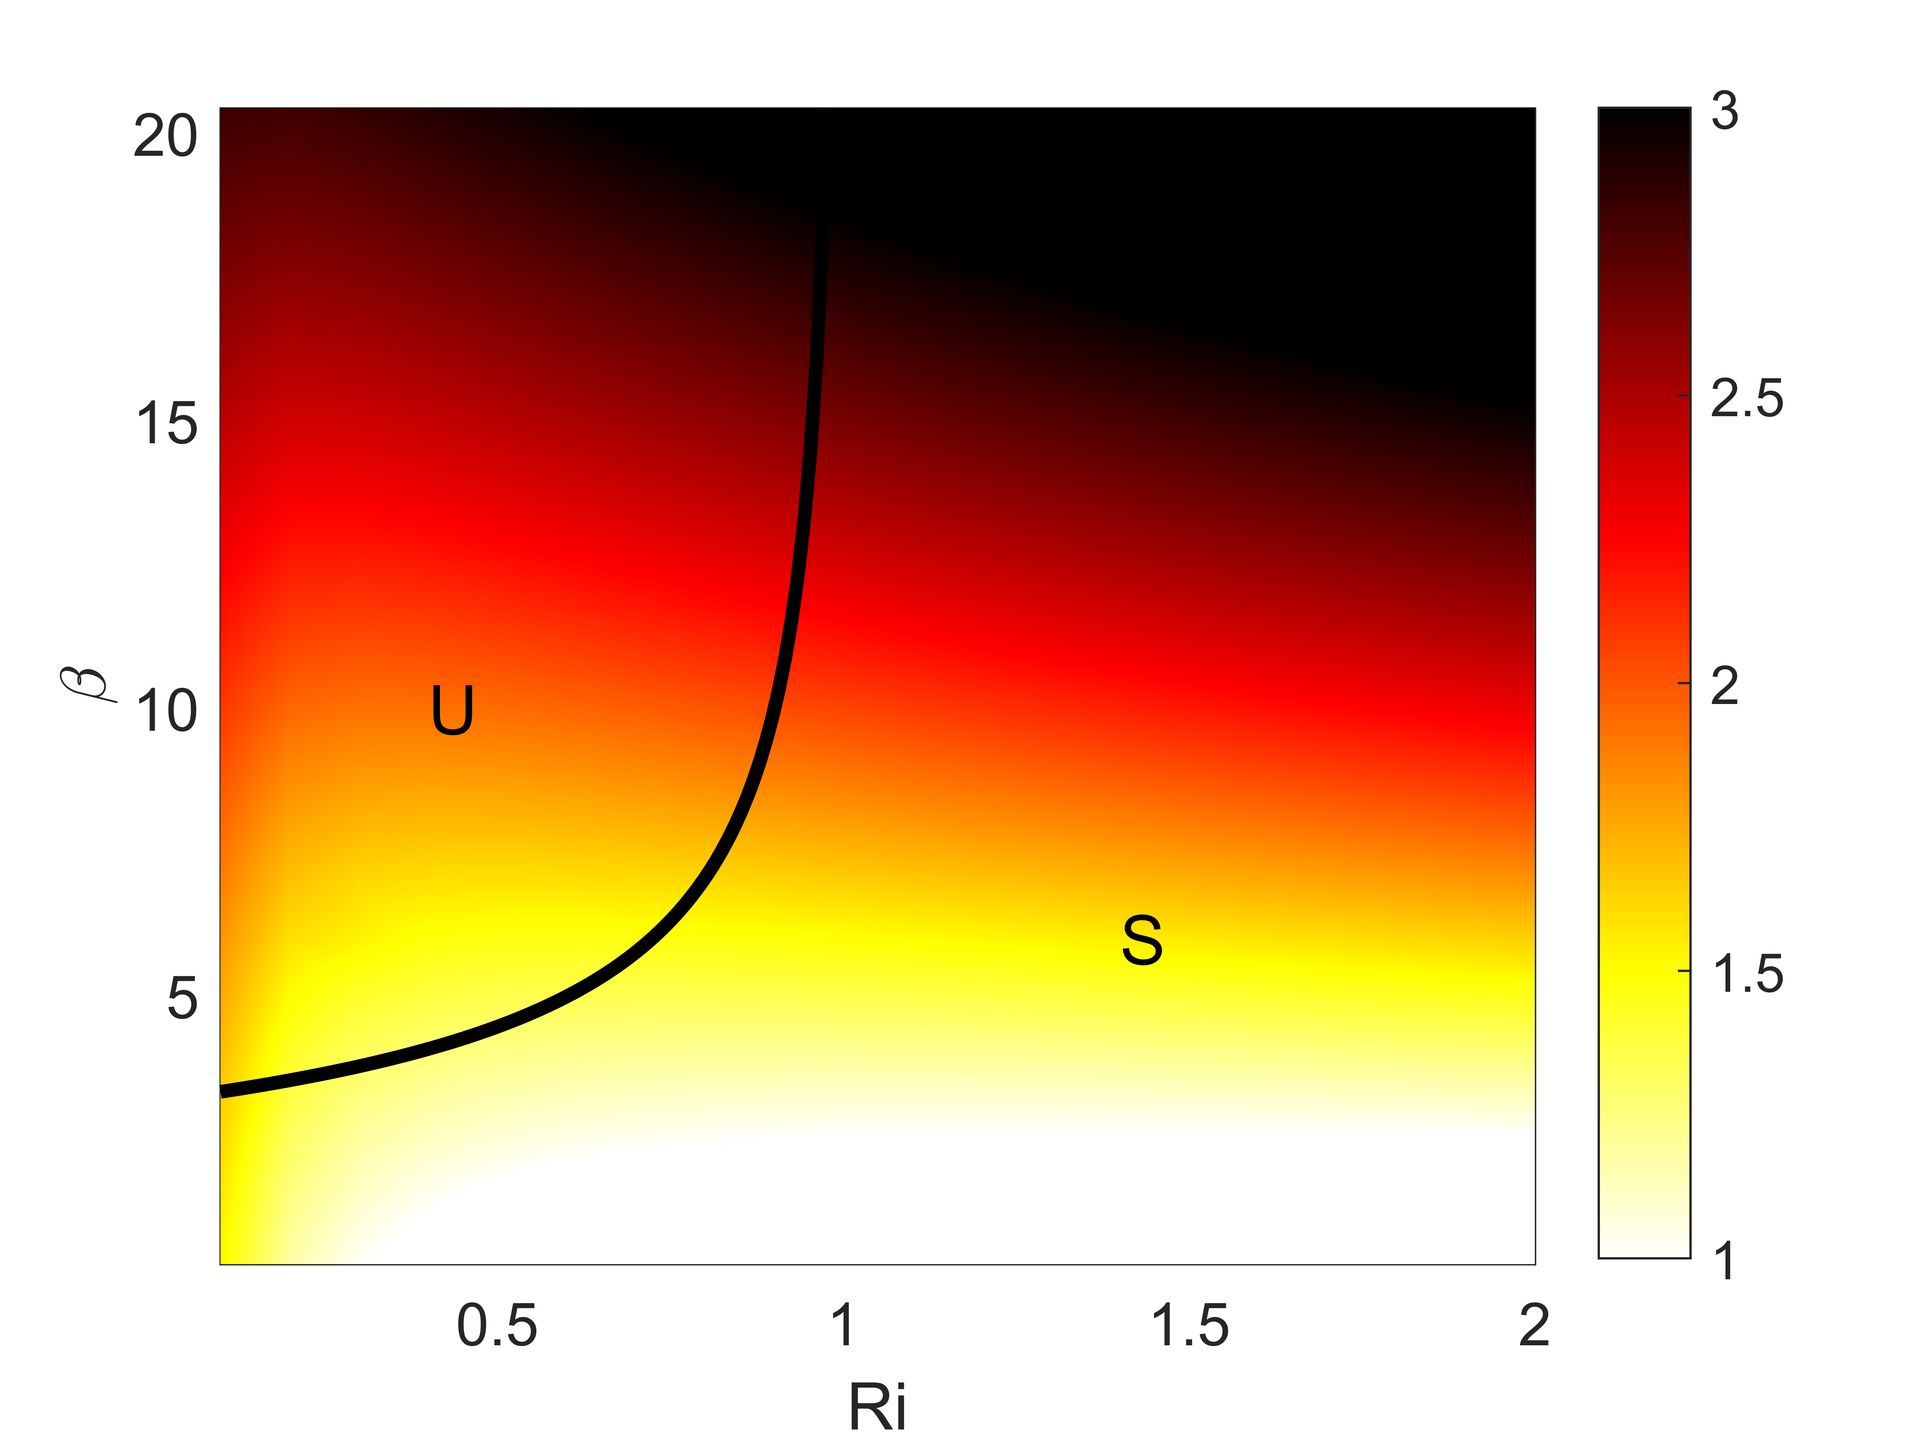
Transient growth rates at for
unstable symmetric modes
over a range and are shown in figure 5. This optimization target time is chosen here as it represents half an inertial period , which is within the range of the timescale for which the submesoscale instabilities occur (compared with the mesoscale instabilities that occur at timescales greater than the inertial period ) (Boccaletti:07). The black curve is a theoretical boundary calculated from equation (4.8) in Stone:71, which prescribes values of as a function of Ri where modal growth rates decrease down to zero. For values of Ri and to the right of this curve (region marked by ”S”), modal growth rates for
unstable symmetric modes
are zero, but as figure 5 shows, transient growth rates can be significant outside of this boundary, even for .
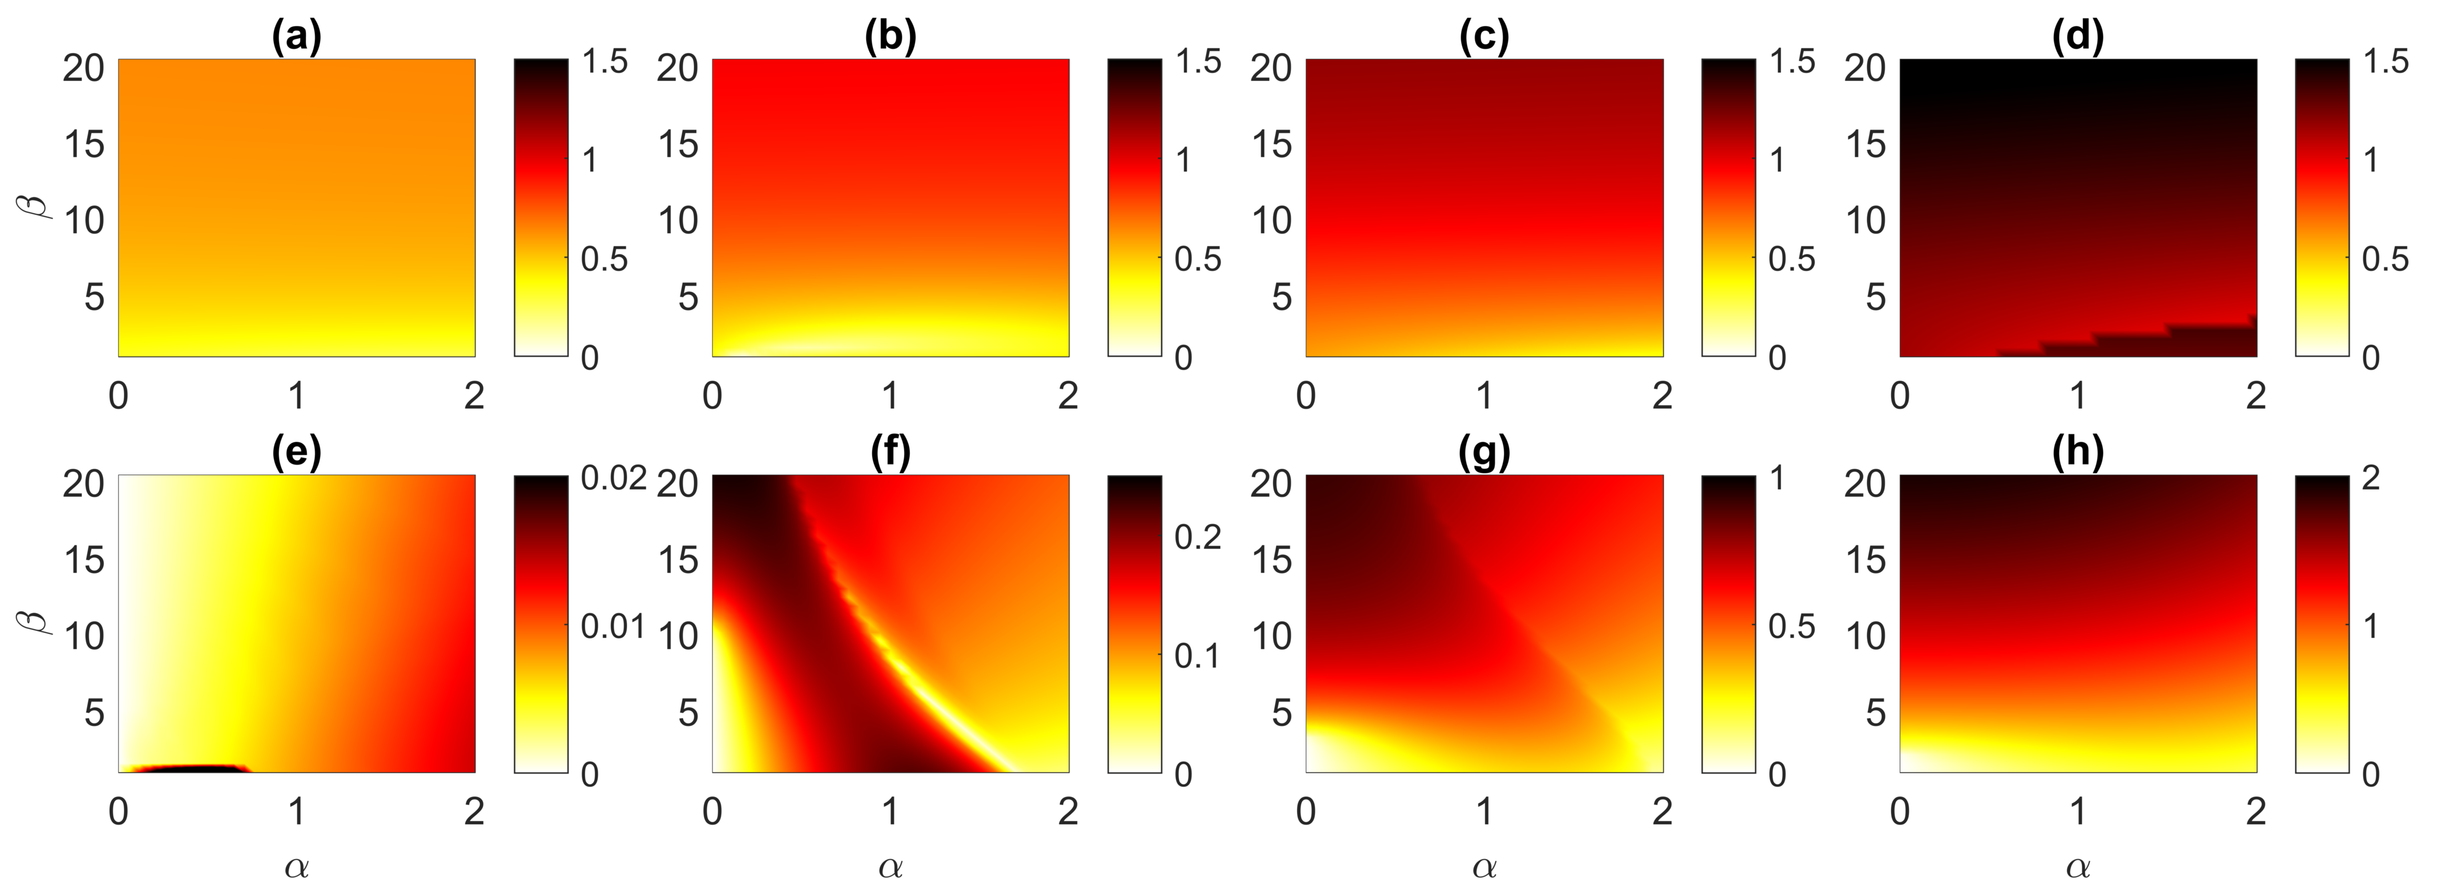
We conduct parameter sweeps over and for transient (at ) and normal growth rates shown in the top and bottom panels of figure 6, respectively. The growth rates are computed at (a,e), (b,f), (c,g), and (d,h) to compare different regimes. As Ri decreases, both transient growth and normal growth rates increase, but the amplification of the normal growth rate by the transient dynamics decreases. In general, we find that transient growth rates at a given Ri are mostly independent of and increase with , while the normal growth rates are more complex functions of both and . Transient growth especially exceeds modal growth at high Richardson numbers for modes with moderate to large meridional wavenumbers , including the three-dimensional modes where . In contrast, pure geostrophic modes (small , ) do not seem to gain as much from the transient growth. The transient growth rates of
unstable symmetric modes
are much larger (up to several orders of magnitude) than the modal growth rates at higher and/or at lower . When is small (fig. 6(c,d,g,h)),
unstable symmetric modes
have substantial modal growth rates, and the transient growth rates are only larger by about a factor two.
These results are in agreement with the study of heifetz2007generalized who considered few cases of horizontally isotropic perturbations such as () at . In the case , they report a maximum instantaneous growth rate at which is very close to the value of that we report in figure 6(b) at . We find transient growth rates of and for and , respectively, which also agree with values in heifetz2007generalized ( and , respectively). Note that Heifetz:03; heifetz2007generalized; heifetz2008non report the instantaneous transient growth rates (i.e. at ), whereas we compute optimal growth rates at , which is lower than the instantaneous growth rate.
4.3 Non-hydrostatic effects on transient growth
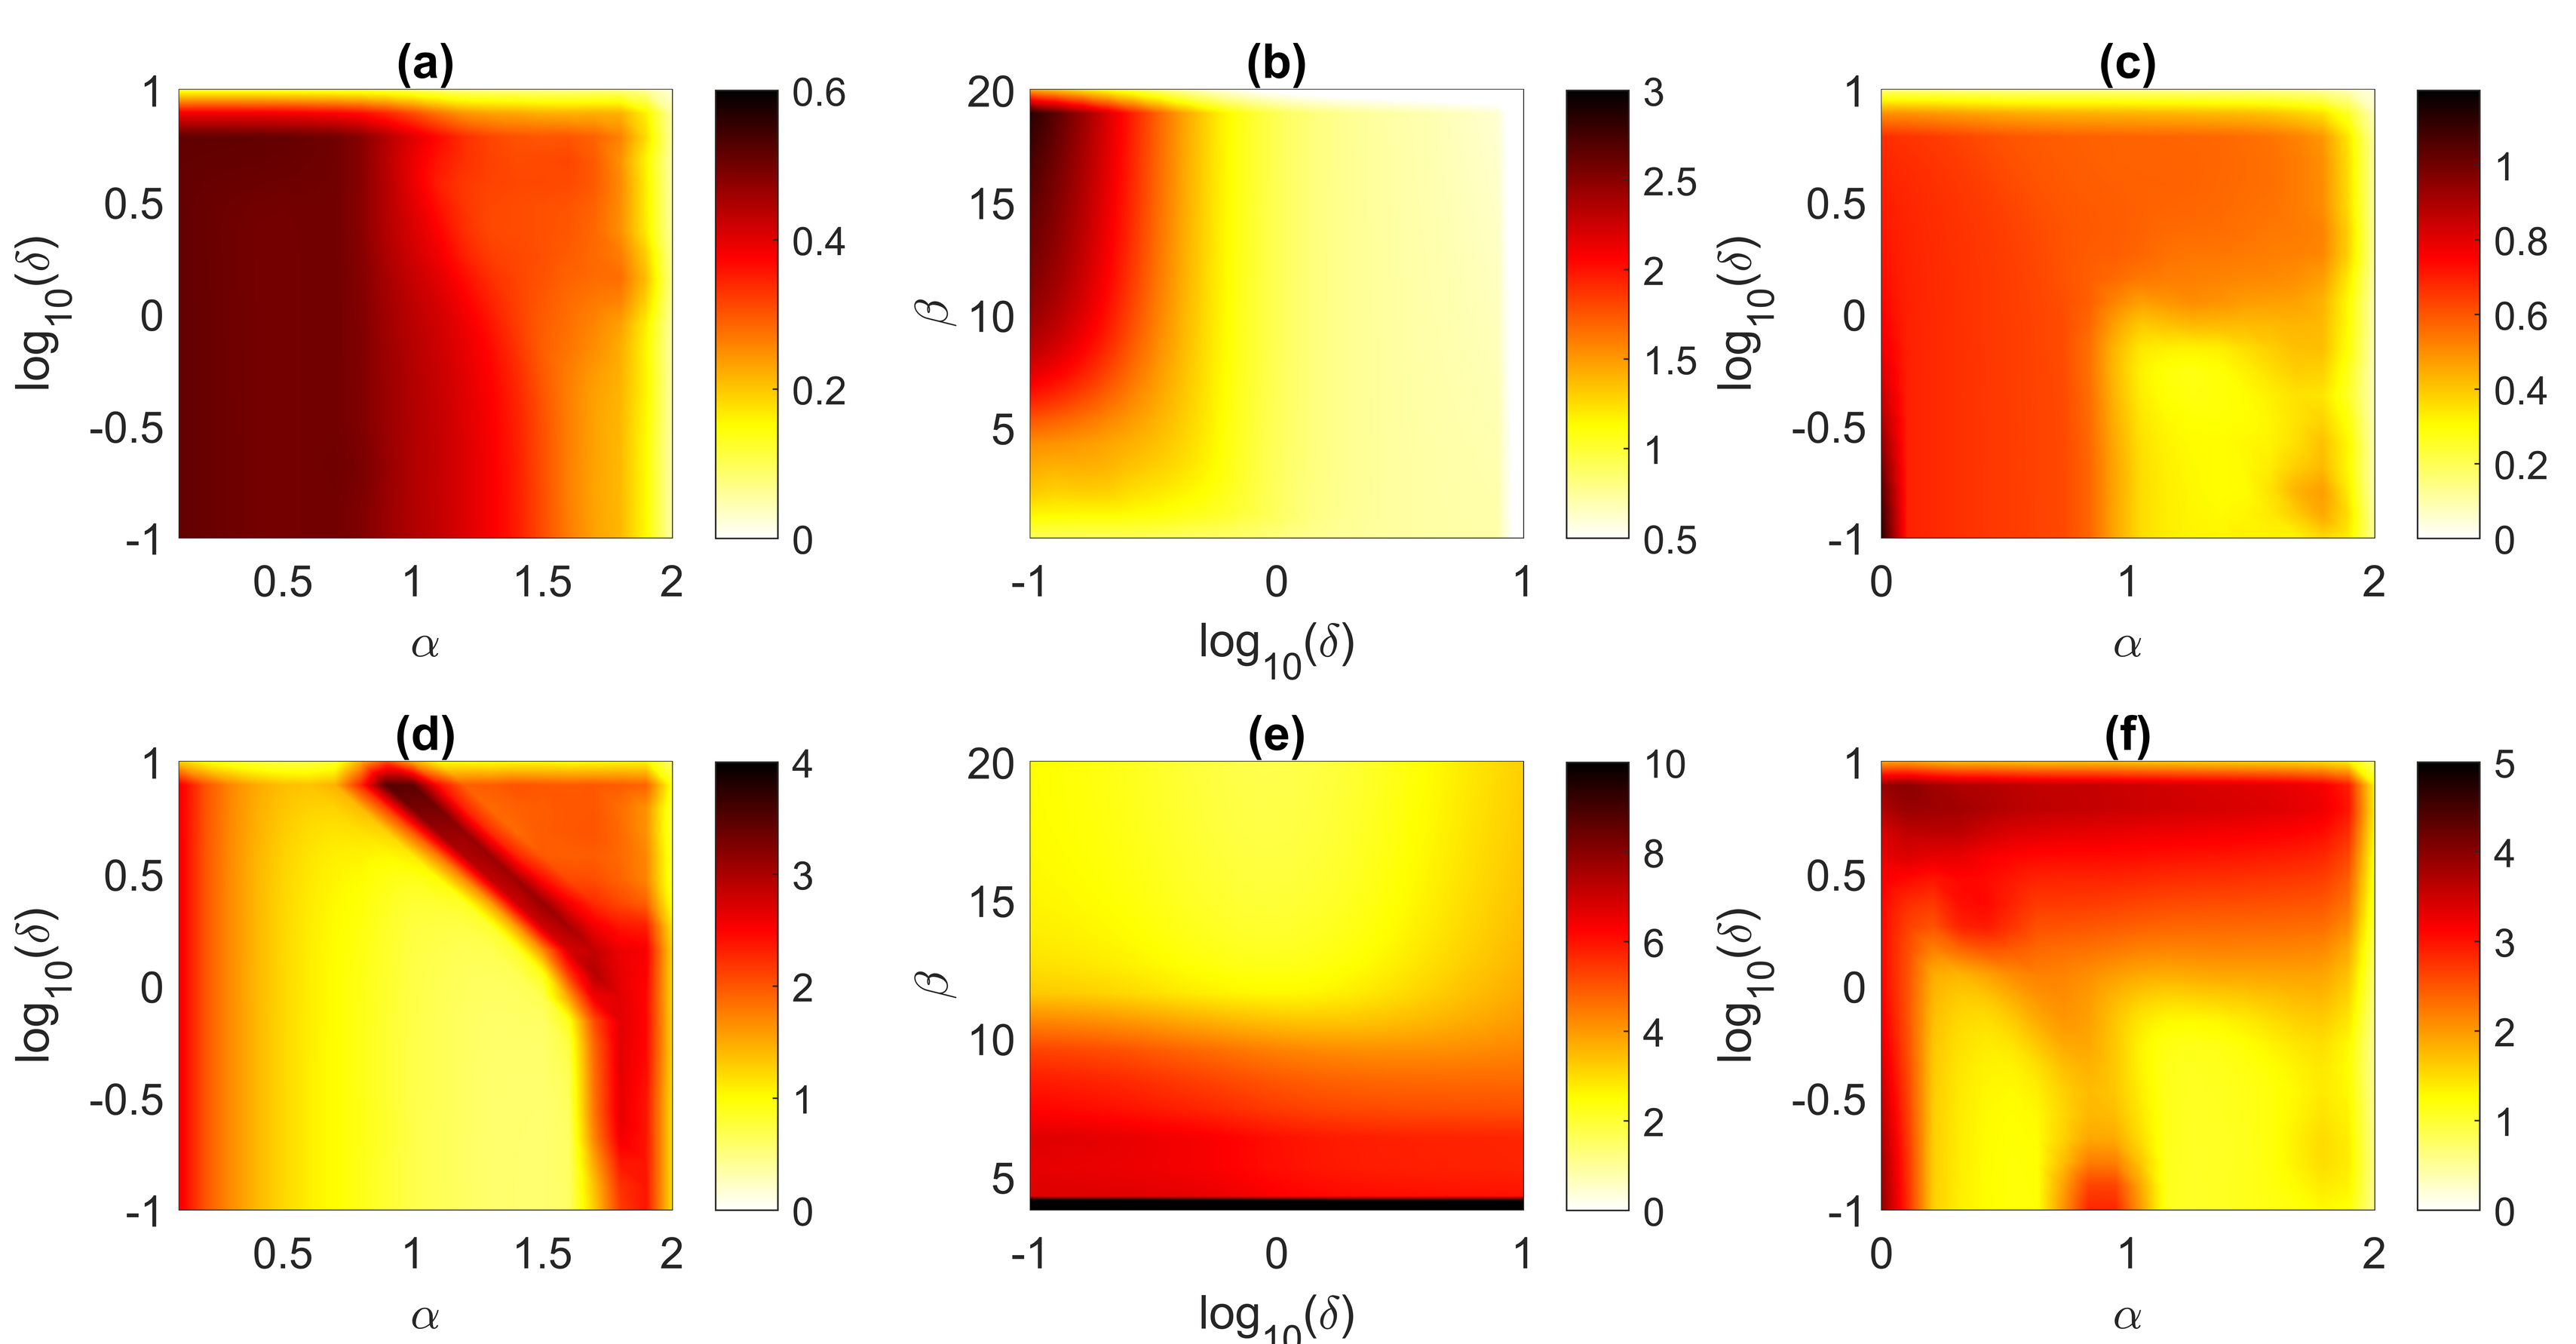
The non-hydrostatic effects have been previously overlooked, mainly because the coupled system (4) in the limit allows for reducing the number of variables and efficiently solve the associated eigenvalue and generalized stability problems (cf. Heifetz:03; heifetz2007generalized; heifetz2008non).
In this section, we study the nonhydrostatic effects by varying the parameter , which for a fixed Ri is equivalent to varying the aspect ratio . In an ocean mixed layer of at mid-latitudes values can reach up to , which corresponds to the ocean values reported in Boccaletti:07 off the coast of California and in the Gulf Stream (callies2015seasonality).
However, the dynamics at or greater may be significant, for instance in the eye wall region in the case of tornadoes (nolan2017tornado) and hurricanes (worsnop2017gusts). The average aspect ratios of the hurricane boundary layer rolls reported in observations for the Atlantic hurricanes (foster2013signature) and Pacific typhoons (ellis2010helical) fall around but can exceed unity, and these rolls can have significant impact on the vertical momentum flux in hurricanes (morrison2005observational).
Using asymptotic analysis, Stone:71 showed that for baroclinic instabilities, modal growth rates are reduced as increases (see figure 3(a)). We, therefore, analyzed the effect of non-zero values of on the transient growth dynamics, which generalizes the findings of Heifetz:03; heifetz2007generalized; heifetz2008non. While for the geophysical applications, may be the upper bound, we generalize our findings for to fully investigate the nonhydrostatic effects.
Top panels in figure 7 shows how transient growth rates found at are affected by , and bottom panels show the amplification of modal growth rates by optimal linear dynamics for selected parameter spaces at . Figures 7(a,d) focus on baroclinic instabilities with , figures 7(b,e) on
unstable symmetric modes
with , and figures 7(c,f) explore mixed modes with and . The transient growth rates are mostly independent of and are larger at lower values. The structure of is influenced by the dependence of modal growth rates on and .
Transient growth rates do not change significantly with or values, except in the small regime in which increases with . At low values for all , , whereas transient growth rates are nonzero. The amplification of modal growth rates by optimal perturbation decreases with with less significant dependence on .
4.4 Energy budget of transient and modal growth
We further investigate the effect of transient growth on the energy transfers with an emphasis on the partition between shear production and buoyancy fluxes. One of the important aspects of transient growth is to provide alternative mechanisms for vertical transport or the vertical restratification. In particular we quantify the ratio of horizontal buoyancy flux to the production of kinetic energy. While the first redistributes potential energy in the horizontal direction, the second relates to the amount of vertical transport.
The equation for the rate of change of energy can be re-written as:
| (24) |
Multiplying the non-dimensional linearized governing equations (4)(a-d) by respectively, we get an expression for the energy rate of change
| (25) |
where the three terms on the right are shear production, meridional buoyancy flux, and horizontal energy transport. Here, the terms are non-dimensional and the background shear in the shear production term .
It should be noted that the last term does not play a role in the energy balance equation and only characterizes the zonal advection of energy.
This analysis is somewhat different than the analysis of Stamper:17 where they only characterize the kinetic energy budget. Instead we consider the total energy budget where the vertical buoyancy flux cancels out.
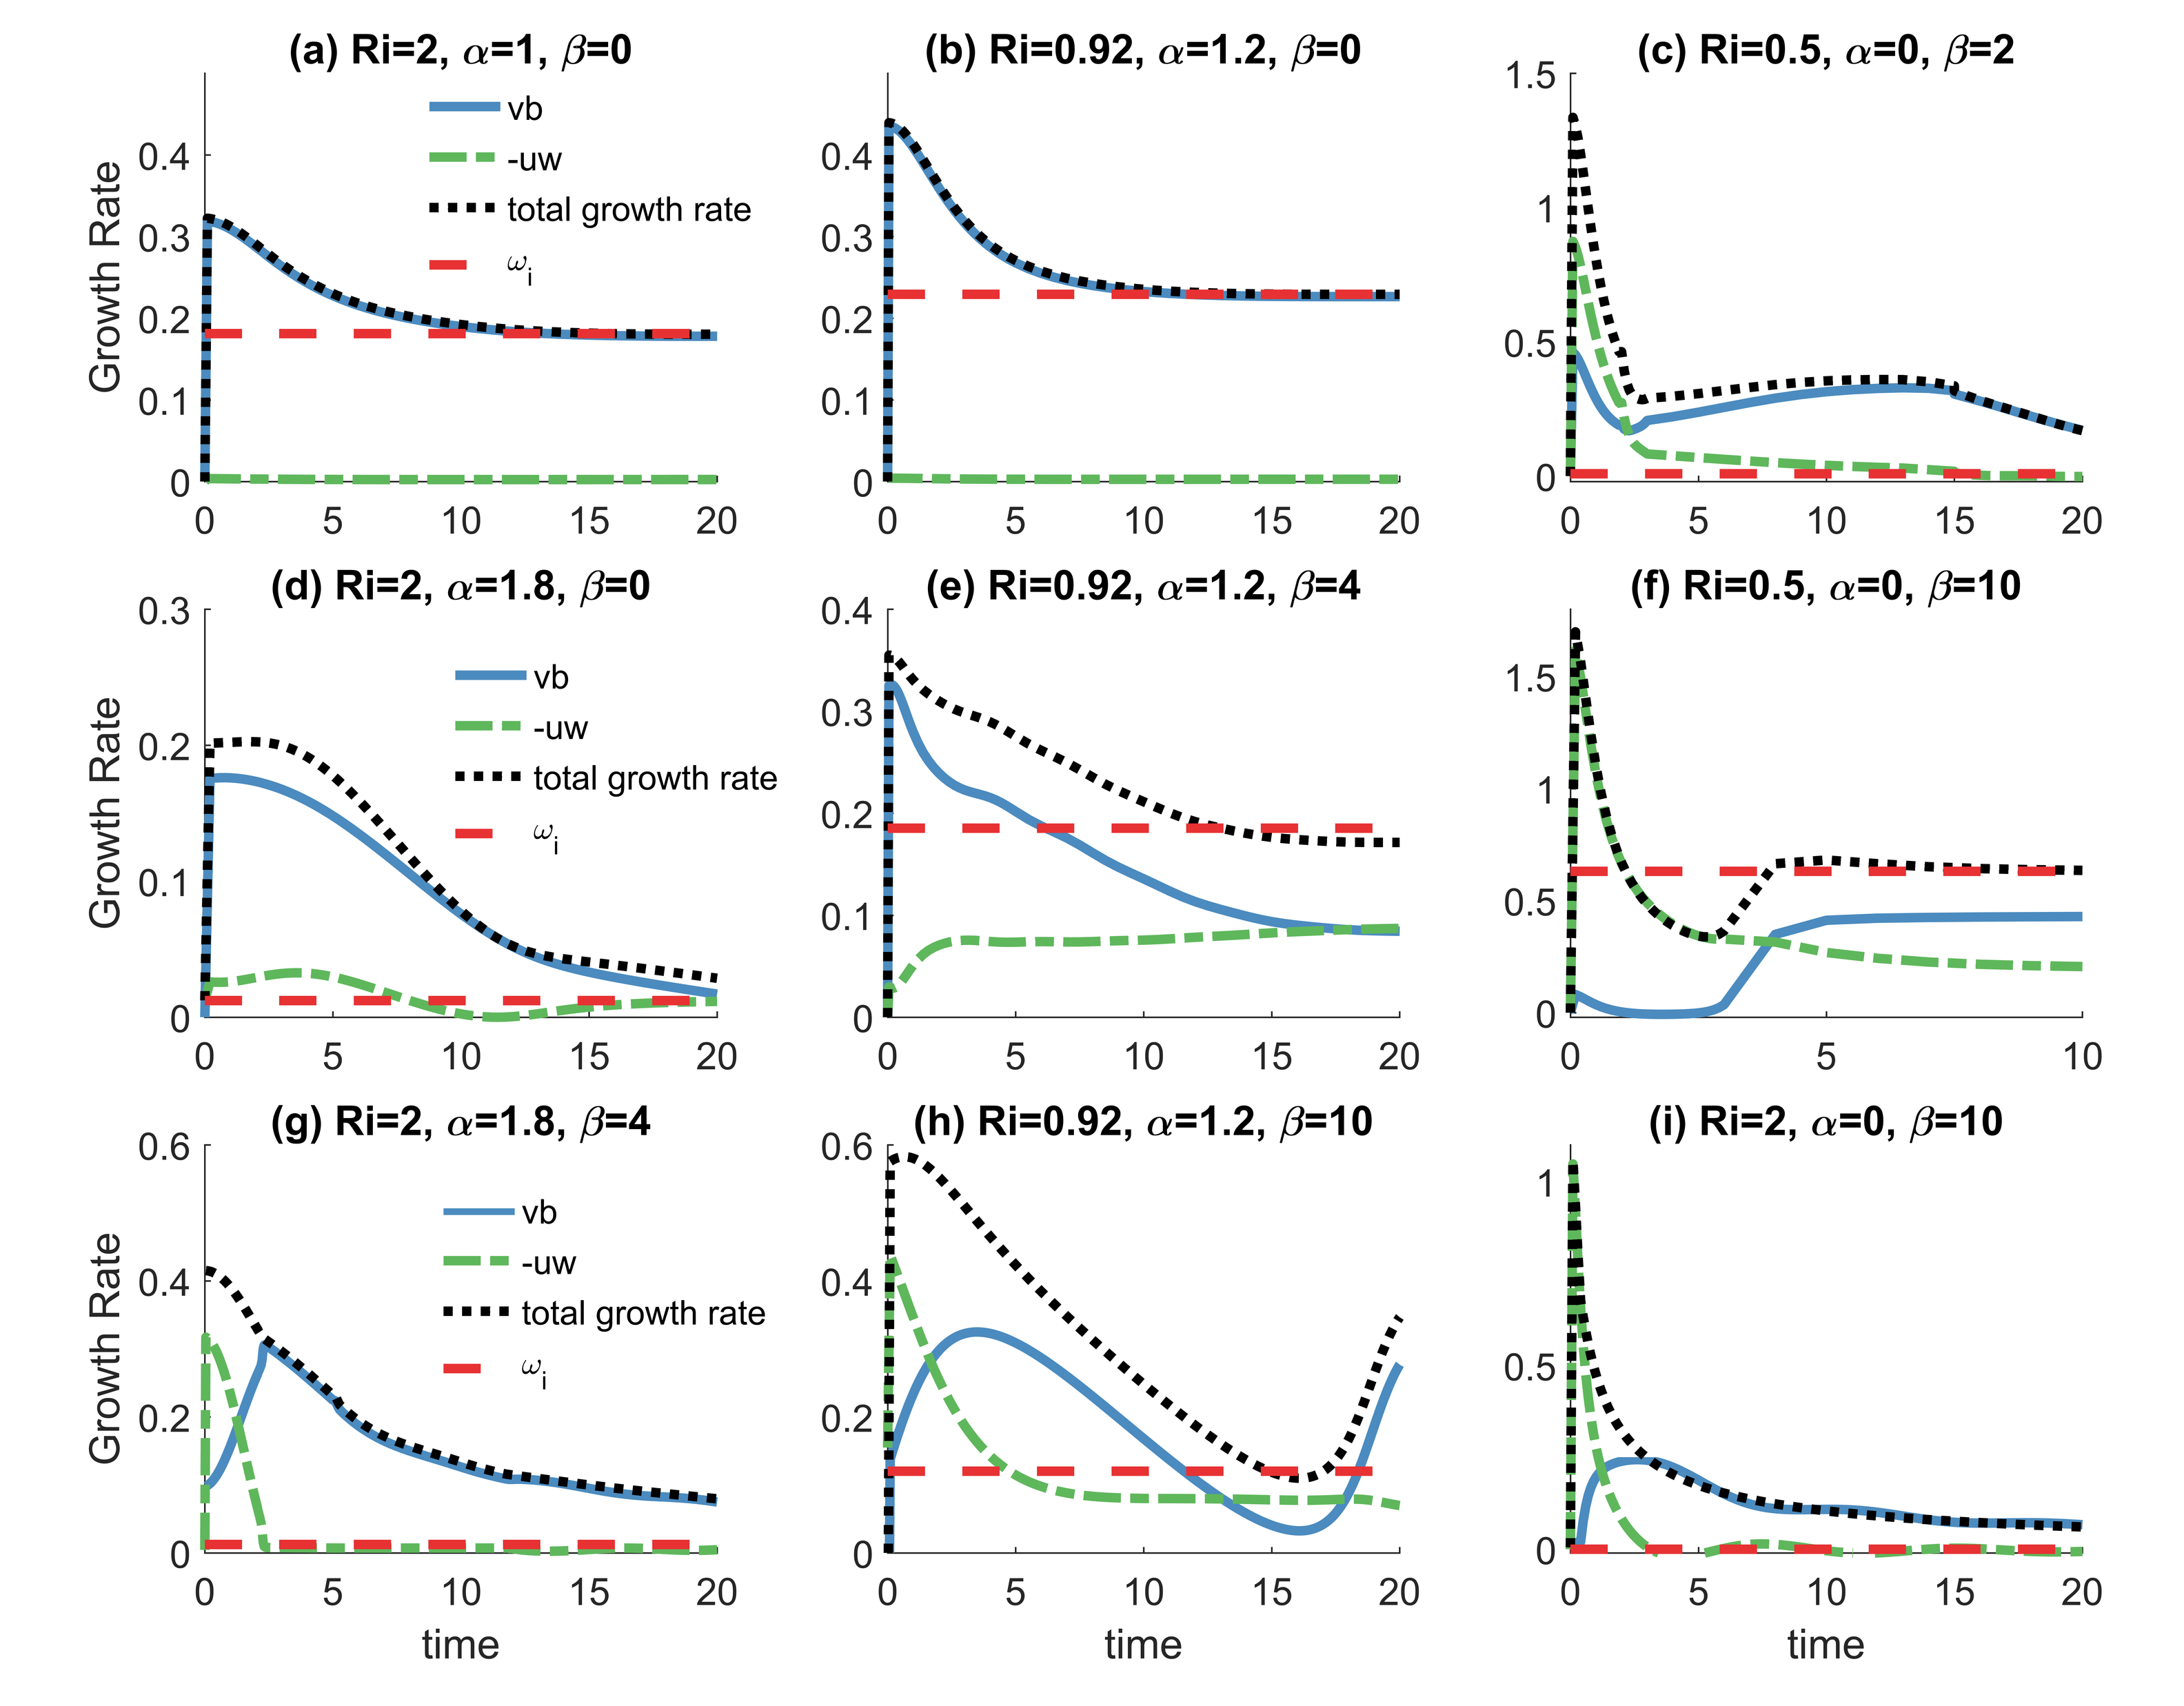
Figure 8 shows the time series of instantaneous growth rate split between the meridional buoyancy flux and shear production along with the modal growth rate for selected cases presented in figure (4). The left panel plots show (a) geostrophic () and (d,g) ageostrophic (, ) modes for . The middle panel shows (b,e) geostrophic (, ) and (h) ageostrophic () modes for . The right panel plots show symmetrically unstable modes () for (c,f) with values: (c) and (f) , and (i)
As , the growth rate approaches , validating our calculations.
For geostrophic modes at (figure 8(a)) and (figure 8(b)), the meridional buoyancy flux dominates over the the shear production, which is close to zero, consistent with results presented in the middle panels of figure 7 in heifetz2007generalized at . In contrast, in the case of ageostrophic modes, for which energy growth is much more amplified by the optimal linear dynamics than for geostrophic modes, the proportion of energy gain from shear production becomes greater (figure 8(d)) or even exceeds the energy gain from meridional buoyancy flux (figure 8(g,h)). This result is also qualitatively consistent with heifetz2007generalized (cf. their figure 7 bottom panels) for .
We observe that the increase in the proportion of energy gain from shear production at short time can be obtained through transition from the geostrophic to ageostrophic instability regime by increasing (compare figs. 8(a,d)) or increasing (compare progression in figs. 8(d,e) and in (b,e,h)). However, at long time, the energy gain is primarily drawn from the meridional buoyancy flux. Our analysis here shows that there is strong vertical momentum flux characteristic of ageostrophic modes at short-time , in contrast with geostrophic instabilities for which the dominant meridional buoyancy flux that distributes the lateral buoyancy gradient horizontally. This difference in the energy pathways between geostrophic and ageostrophic modes is important because, as Boccaletti:07 noted, the ageostrophic instabilities could be significant due their timescales being less than the geostrophic adjustment timescale ().
For
unstable symmetric modes, the contribution of shear production to energy gain also increases with increasing value (compare figs. 8(c,f)). However, at longer time, contribution from buoyancy flux becomes equal to or exceeds the shear production (see figs. 8(c,f,i)). grisouard2018extraction similarly showed a significant contribution from the energy drawn from the potential energy of the mean flow in two-dimensional numerical simulations of unstable symmetric modes. We will further explore this behavior in the next section using the optimal initial conditions for the growth in the finite amplitude regime.
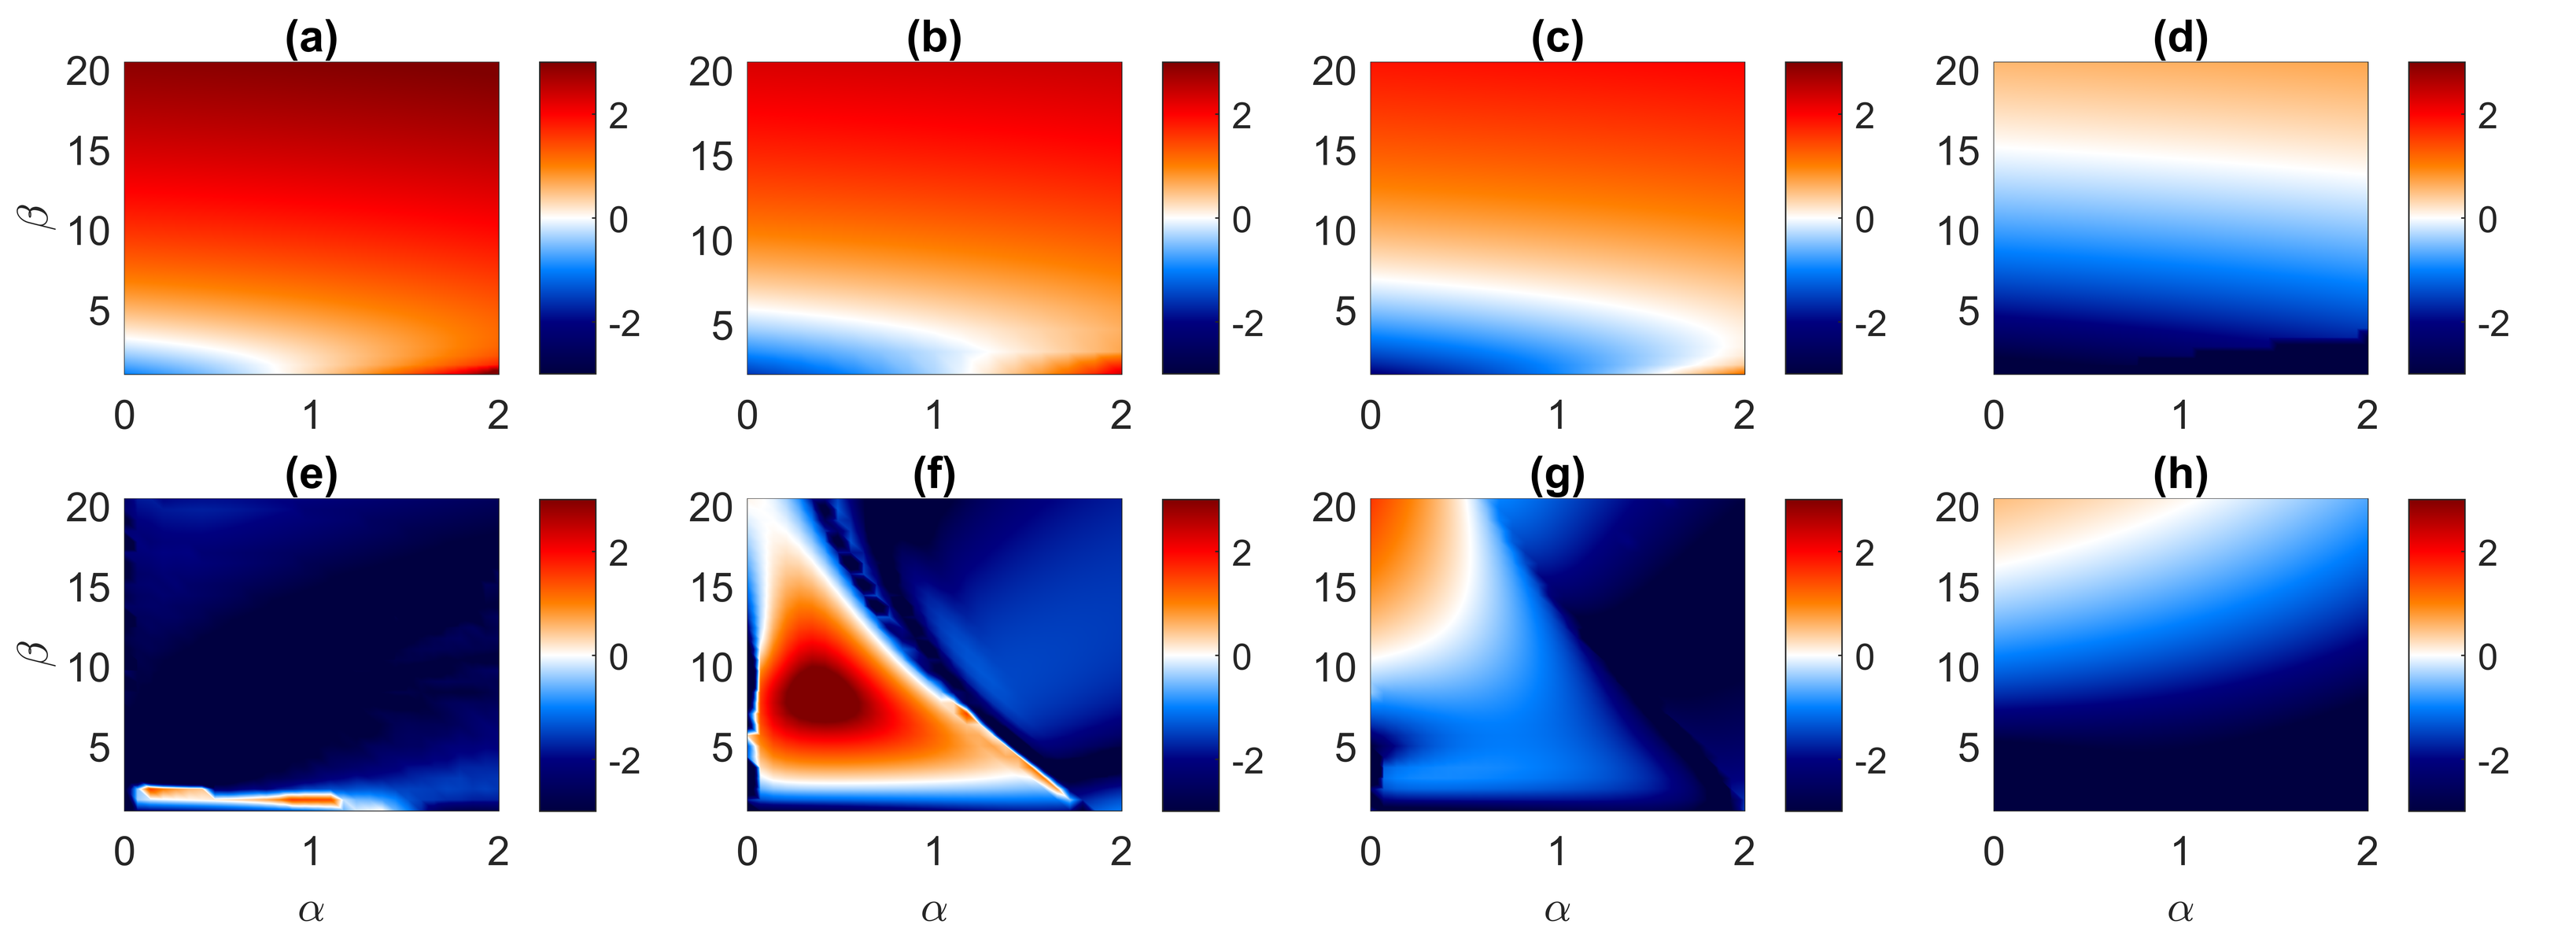
As shown from the energy norm in (25), we only need to consider the ratio of shear production to meridional buoyancy flux to characterize the exchanges in energy. Figure 9 shows the log of the ratio, , defined as
| (26) |
for various values of Ri as functions of and . The top panel (figures 9(a-d)) shows log() calculated at short times of optimization , whereas the bottom (figures 9(e-h)) shows log() for normal growth. The patterns of ratio of shear production stress to buoyancy flux are strikingly different between normal mode and transient growth dynamics. Figure 9(g) matches to figure 2(a) in Stamper:17.
For transient growth, this ratio is higher at larger Ri; as Ri decreases, the region where the meridional buoyancy flux is greater than shear production grows. This progression can be explained by the transition from geostrophic to ageostrophic modes occurring at larger as decreases (see figure 3).
At optimization time , for (figure 9(a)), the shear production is greater than the buoyancy flux for almost all values of and , except in a small region at low and values, where the two energy fluxes are roughly equal or the meridional buoyancy flux is dominant. This corresponds to the region of higher normal mode growth rate in figure 9(a) due to geostrophic baroclinic instabilities.
At intermediate Ri values (), the buoyancy flux is dominant where both and are small (figures 9(b-c)). Shear production becomes more dominant as
unstable symmetric modes
become stronger (large values) and/or as ageostrophic instabilities emerge (large values).
At low Ri values (), the region where the meridional buoyancy flux is dominant is larger than at higher Ri values (figure 9(d)). Vertical stratification becomes weaker as Ri decreases, while the horizontal buoyancy gradient that could drive the meridional buoyancy flux increases. Numerical simulations by arobone2015effects similarly showed that near-symmetric unstable modes
generate flows that do not align with isopycnals and draw energy from the available potential energy reservoir of the background flow for several initial inertial periods.
However, as increases,
unstable symmetric modes
become more dominant and becomes greater than .
This analysis shows that in the asymptotic limit as , the meridional transport overwhelms the shear production for a large portion of the parameter space (see figs. 9(e-h)) with the exception of some mixed modes at and small regions of large- unstable symmetric modes at low . However, we stress that it is not the case for the linear optimal perturbations, where for symmetric modes with large values of and ageostrophic modes with large and/or values, the shear production is either equally important to or dominates the energetic dynamics.
4.5 Mechanisms of transient growth
In order to investigate the difference in amplification of growth rates by transient growth in geostrophic, ageostrophic and symmetric modes, we study the evolution of the eigenvectors’ profiles associated with the most unstable eigenmodes and optimal initial conditions that lead to optimal growth. As discussed in §4.4, the shear production is a greater contributer to the energy budget than the meridional buoyancy flux at short-times for ageostrophic modes and symmetric modes. For this family of modes, the amplification of modal growth rates by transient dynamics is also greater than for geostrophic modes, for which meridional buoyancy flux is dominant over the shear production. In this section, we explore the mechanisms that are responsible for the differences in transient growth between each family of modes.
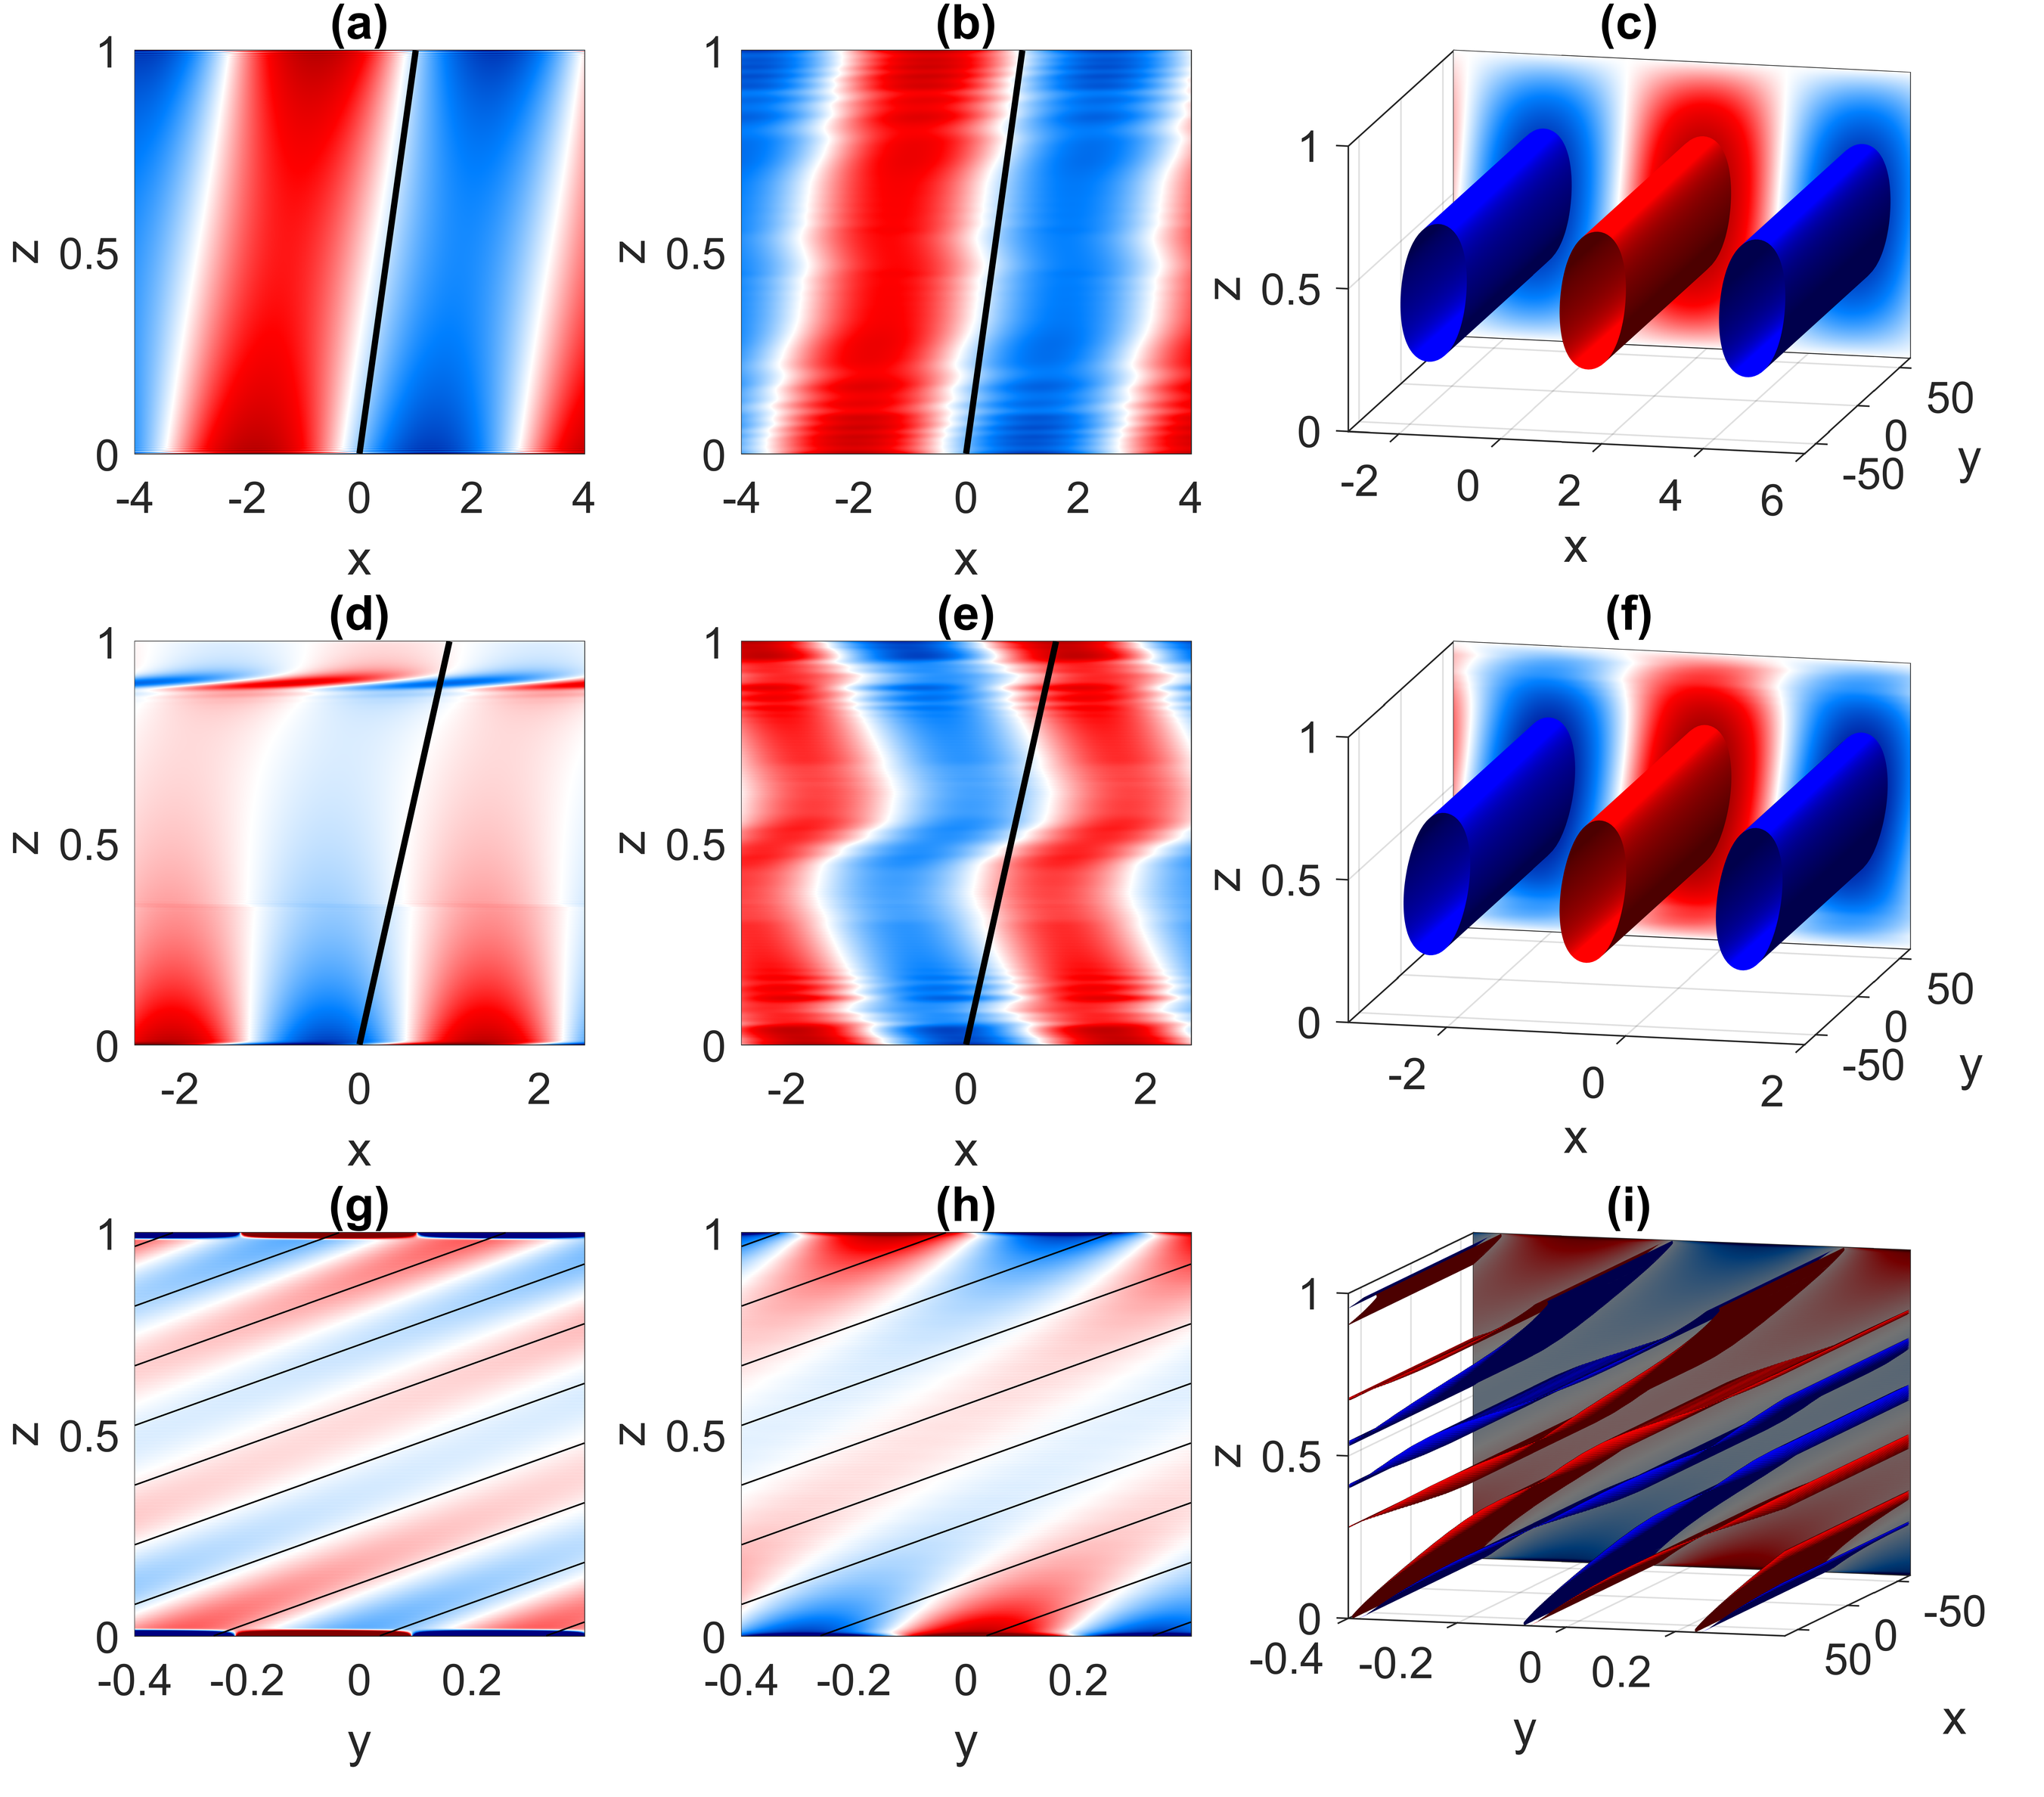
Figure 10 shows buoyancy cross-sections of strongly amplified representative unstable modes in the left panels, buoyancy cross-sections of initial conditions leading to optimal perturbation at in the middle panels, and three-dimensional structures of optimal initial conditions for vertical velocity in the right panels. All modes shown are for and . The geostrophic mode with has vortices that are uniform in the meridional direction with -dependent vertical velocity perturbations (figure 10(c)), and the buoyancy profiles for both the most unstable eigenmode and the optimal initial conditions that are aligned with the background shear,
indicated by black lines in figures 10(a,b), respectively.
We observe that both modal and optimal transient energy predominantly grows due to the meridional buoyancy flux (i.e. given by ) for the geotrophic modes (see fig. 8(a)) and there is not as great of an amplification of growth rates by optimal perturbations (the transient growth rate is only twice the modal growth rate for this test case).
Buoyancy cross-sections and vertical velocity structure for ageostrophic mode with are shown in figures 10(d-f). The vertical velocity forms meridionally-uniform vortices similar to those of the geostrophic mode, but they are sheared near the vertical boundaries. The buoyancy profiles are significantly different between the most unstable mode and the optimal initial perturbation. Shear production (i.e. given by has a non-zero contribution to the energy growth at short times for the optimal perturbations and the modal growth rates are substantially amplified by the optimal perturbations (the transient growth rate is times greater for this test case).
For a flow with a background thermal wind balance, wave-like instabilities can undergo critical reflection off horizontal surfaces and can lead to the irreversible energy exchange with the background flow (grisouard2015critical; grisouard2016energy). These reflections can be of three types, depending on the wave frequency: 1) backward reflection (), 2) critical reflection (), and 3) forward reflection (). Here we use wave frequency non-dimensionalized by . As noted by Nakamura:88, critical layers can also serve as horizontal surfaces for the reflections of the instabilities in addition to the top and bottom boundaries.
In figure 11, the temporal evolution of the remainder between the optimal initial condition and the most unstable mode are shown to determine whether reflections, observed by grisouard2015critical; grisouard2016energy occur for these instabilities. This residual perturbation was computed using the expression where the adjoint mode is solution of the adjoint eigenvalue problem .
For baroclinic instabilities (geostrophic and ageostrophic), all of the retained modes, except the ones with nonzero growth rate, are purely imaginary and have frequencies .
For the geotrophic mode test case (), the retained waves have frequencies , meaning that we would expect backward and near-critical reflections, which we observe in figure 11(a-c). As shown by grisouard2016energy, there is a net transfer of energy from the background flow to the perturbations through the exchange of potential energy as a result of these reflections, which is consistent with our finding of the meridional buoyancy flux primarily contributing to the transient energy growth for the geostrophic modes. Because there is not a significant difference between the optimal initial condition and the most unstable eigenmode, the energetic contributions and the wave reflections are small.
The ageostrophic modes have larger , and thus, the frequencies of the retained modes span the regimes for the backward, critical and forward reflections. The contribution from the critical reflections are clearly shown in figure 11(d-f) for the ageostrophic mode test case () through the intensification of the wave reflection contribution at the top and bottom boundaries and at the critical layers in the middle of the domain. The analysis of the energy budget by grisouard2016energy showed that for higher wave frequencies in the forward reflection regime, there is transfer of kinetic energy from the background flow to the perturbations, which is consistent with the additional transient energy growth from the vertical shear production that we observe. Additionally, the critical and near-critical reflections have higher energy flux from the background flow (grisouard2016energy). The ageostrophic instabilities have modes that span a much wider range of frequencies than geostrophic modes with smaller values (and frequencies are in the range
), which allows the ageostrophic instabilities to potentially have more modes with the critical and near-critical reflections, explaining the greater energy growth rate amplification by the transient growth for ageostrophic modes compared with the geostrophic modes.
Finally, the test case for symmetric mode (figures 10(g-i)) with in the large Ri regime is predicted to have zero energy growth rate by the asymptotic analysis by Stone:70. We find that the buoyancy profile, as shown in figure 10(g), and velocity profiles (not shown) for the first normal mode are aligned with the background stratification and shear. However, the optimal initial perturbation profile for buoyancy is steeper than the background stratification profile. This mechanism relates to the fast-propagating modes interaction described in xu2007modal and Xu:07, who found that in the regime outside of the modal instability, the initial transient energy growth is driven by the interaction between the fastest propagating modes, whereas at a later time, the energy is generated by the slowest propagating modes and causes oscillations in energy (cf. figure 4(d)). In this case, cross-band circulation is tilted in the opposite direction of the surfaces of constant buoyancy, and the energy gain is driven by the perturbation buoyancy restoring force (Xu:07). Hence the remainder of the eigenspectrum does not appear to play a significant role in the transient growth process and the energy growth can be essentially associated with an inertia-gravity instability, resulting in the exchange of kinetic energy between the perturbation and the thermal wind shear through vertical momentum flux. This inertia-gravity instability is subject to critical reflection at the top and bottom boundaries. At a later time, the contribution to the energy growth from meridional buoyancy flux becomes dominant (cf. fig. 8(i)), corresponding to the backward reflection as seen in figure 11(i). heifetz2008non argued that the generalized growth of unstable symmetric modes is relatively small. However, for large Richardson numbers, non-normal growth rates of unstable symmetric modes are larger than the generalized growth rates of both baroclinic geostrophic and ageostrophic instabilities despite symmetric modes being asymptotically stable. In the case of fronts in the atmosphere, heifetz2008non argued that such mechanisms can be found in the form of frontal lifting, or by orography. Analogously, in the ocean, the front could be forced at the lower boundary through internal tides originating from the bottom or wind stresses forcing the front through the surface.
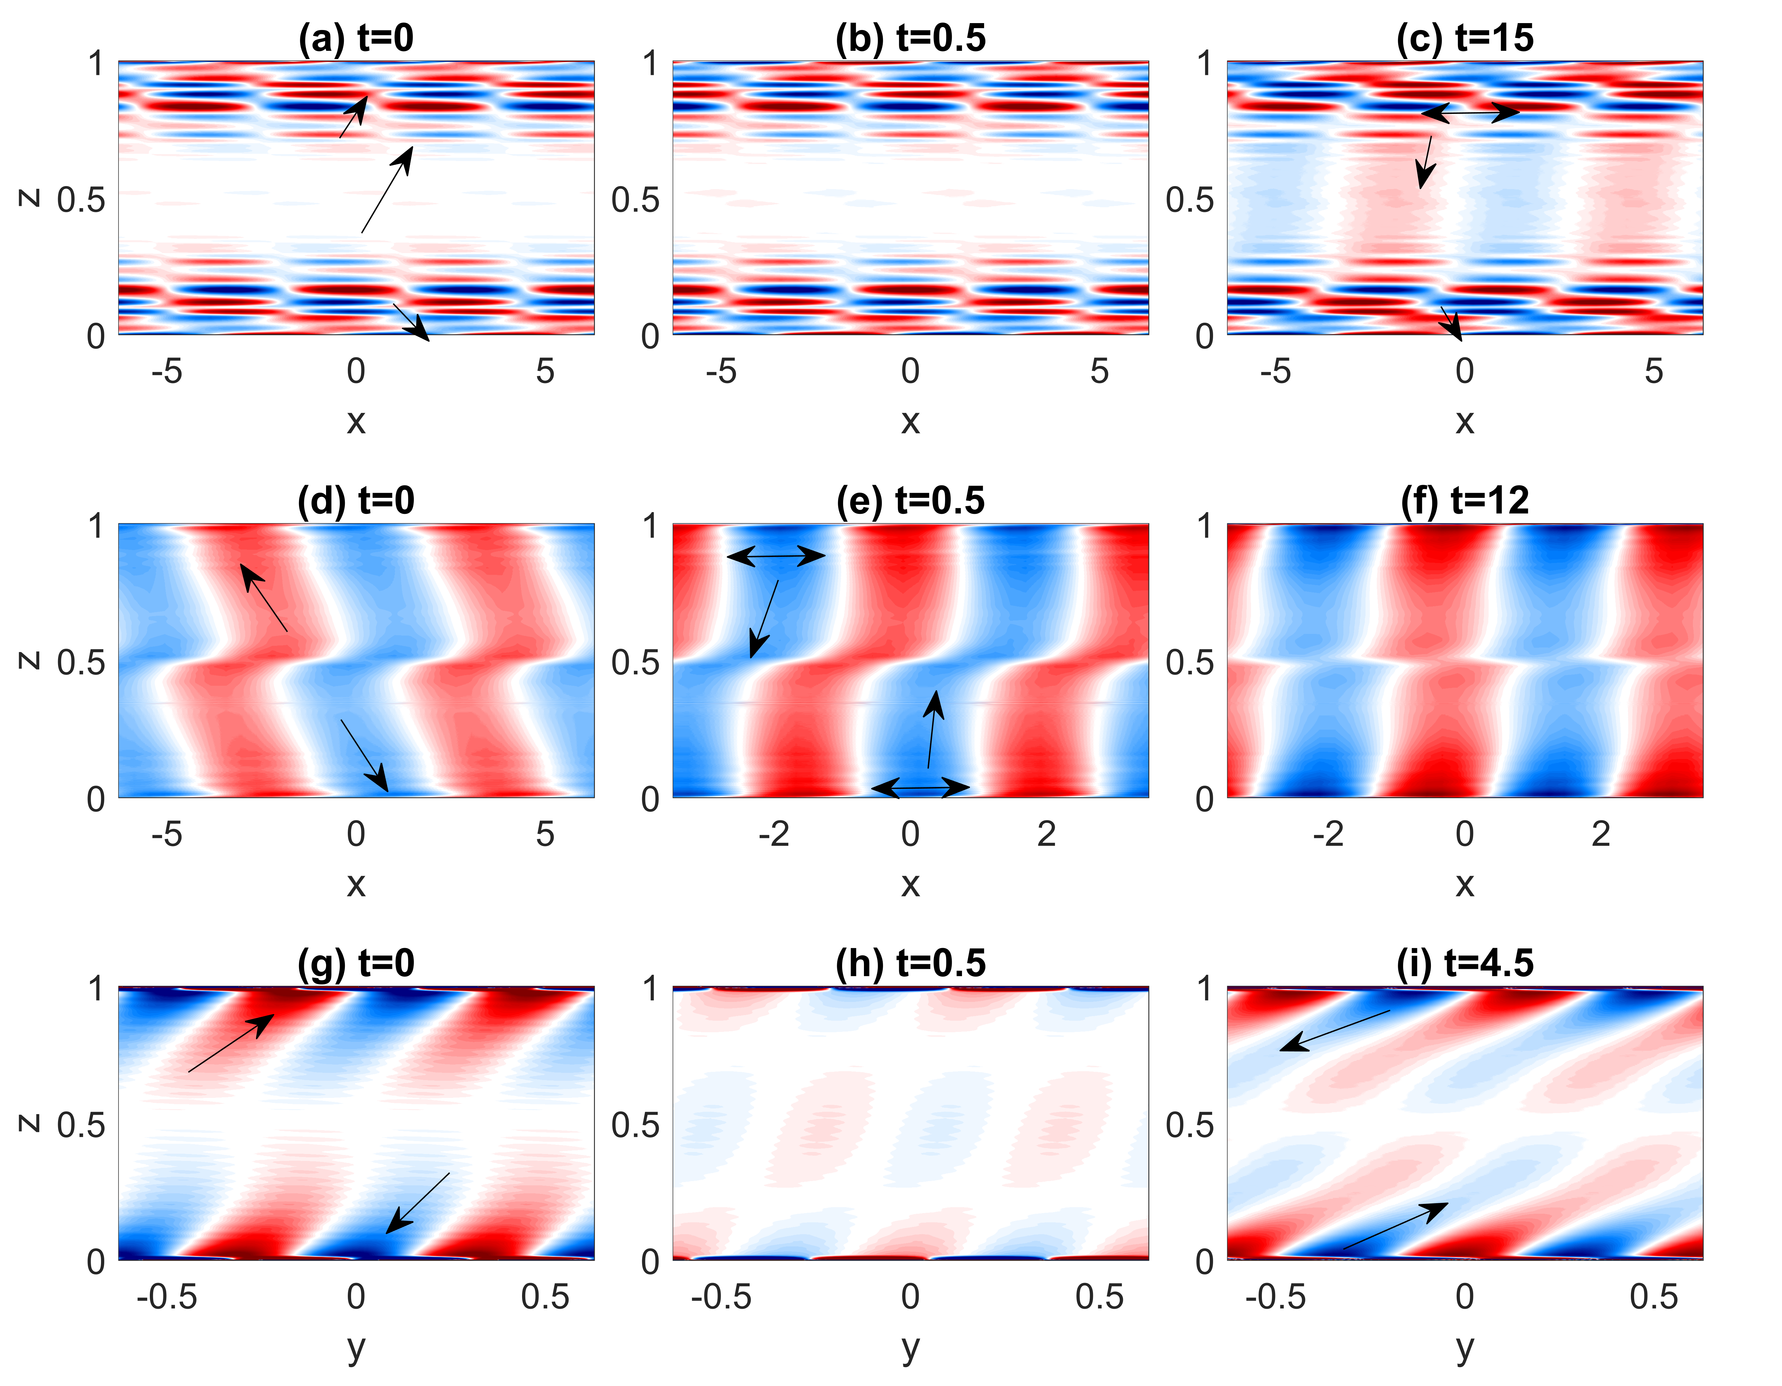
5 Three-dimensional simulations
In this last section, we investigate whether the linear transient growth dynamics are observed in the full nonlinear evolution, in particular whether we would observe the enhanced short-term energy growth predicted by the linear stability theory. We conduct DNS of a flow in a thermal wind balance initially perturbed by . The vertical profiles of the perturbations are either the most unstable mode or the linear optimal perturbation initial condition calculated for the optimization time . We use three test cases at and for 1) geostrophic (), 2) ageostrophic (), and 3) symmetric () instabilities, for which the initial perturbation conditions are shown in figure 10. We additionally conduct simulations initialized with random vertical velocity and buoyancy profiles in order to evaluate whether the growing perturbations project onto the optimal modes, which is a more relevant case in the ocean or the atmosphere. The initial conditions of the optimal perturbations and random perturbations for were normalized such that their maximum magnitudes matched those of the eigenfunction corresponding to the most unstable eigenmode for each instability type.
We solve the non-hydrostatic, incompressible Navier-Stokes equations in the Boussinesq limit, nondimensionalized using (2), which are equivalent to (3) with additional non-linear and viscous terms
+ U∂u∂x + w ∂U∂z -v + Ri ∂p∂x - 1δRe (δ^2 u_xx + δ^2 u_yy + u_zz) &=0
D vD t+ U ∂v∂x +u + Ri