Short-term predictions of country-specific Covid-19 infection rates based on power law scaling exponents
Abstract
The number of corona virus (COVID-19) infections grows worldwide. In order to create short term predictions to prepare for the extent of the global pandemic we analyze infection data from the top 25 affected countries. It is shown that all country-specific infection rates follow a power law growth behavior and the scaling exponents per country are calculated. We find two different growth patterns: either steady power law growth from the very beginning with moderate scaling exponents of 3-5 or explosive power law growth with dramatic scaling exponents of 8-11. In the case of the USA we even find an exponent of 16.59. By means of data analysis we confirm that instituting strict measures of lock-downs combined with a strong adherence by the population are effective means to bring the growth rates down. While many countries have instituted measures there are only three countries (Denmark, Norway, and South Korea) so far where such lock-downs led to a significant reduction of the growth rate. In the case of Denmark we calculate the reduction of the scaling exponents to move from 6.82 to 1.47.
Introduction
Since the identification of a novel novel corona virus (COVID-19) in Wuhan, China in December 2019 the virus kept spreading rapidly throughout the world resulting in a global pandemic. As of March 25th 10:30 CET 424,048 people in over 170 countries and regions have been infected WHO . Due to its high infectivity no slowing down of the spread is currently in sight. A medical cure or vaccine is not available yet. This pandemic brings health care systems worldwide to their limits. The mortality rate is calculated to be 2.5% Lai et al. (2020) (comparison: SARS 9.6% Smith (2006) and H1N1 influence 0.6%Vaillant et al. (2009)). As the number of infections rises many governments around the world have instituted drastic lock-downs and curfews and called for social distancing and work from home to reduce the rate at which the virus spreads.
The severity of the infections with the COVID-19 is not evenly distributed with respect to age. While children do not seem to be affected much the risk of complications and negative progression seems to increase with increasing age – the elderly population (70+) being affected most (5-11% mortality rate) Jung et al. (2020). Preexisting health conditions such as cardiovascular diseases, diabetes, respiratory diseases or cancer Driggin et al. (2020); Jung et al. (2020) and smoking Vardavas and Nikitara (2020) seem to increase the risk of complications as well.
In order for health care systems to be able to predict the short term and longer term number of infected patients different models have been used. Epidemiological analysis models assumes an exponential growth and a fixed reproduction number , i.e. the number of people infected by a sick person. For and an incubation time the total number of infections is assumed to grow exponentially
This approach is the basis for a number of different predictive studies such as Zhao et al. (2020); Schmitt (2020).
Other approaches to estimate and predict the number of infections are for example based on ’mechanistic-statistical’ approaches coupling a SIR ODE model describing the unobserved epidemiological dynamics combined with a probabilistic model describing the data acquisition process and a statistical inference method Roques et al. (2020), time series modeling Deb and Majumdar (2020), iterative maps Botha and Dednam (2020), or agent based simulations Chang et al. (2020) as well as logistic mapsHermanowicz (2020); Roosa et al. (2020).
The problem with exponential approaches is that it assumes that any infected person will infect the same number more people not taking into account the human tendency to live and work in relatively closed groups. Therefore such models tend to overestimate the number of infected people as time progresses, simply because there are no more new people to infect in the individuals particular group. On the other hand if the disease were to spread only at the periphery of a compact region of infections then a parabolic growth would be expected Brandenburg (2020). It is thus to be assumed that after an initial short exponential growth a slow down should be observed where the growth of newly infected people increases less than exponentially but probably faster than as humans are not generally limited to the confines of a compact region. Given what is known about human interactions and structures mostly showing small world phenomena and scale free networks Watts and Strogatz (1998); Watts (2004) the assumption of a power law behavior is reasonable. Early analysis in February 2020 Ziff and Ziff (2020) showed this indeed to be true. After a short initial exponential growth period the number of infections, as well as the number of recovered and deceased patients follows a power law:
In the case of the infection spreading in China the exponent was determined to be Ziff and Ziff (2020) and Li et al. (2020) (with more data). In an update to Ziff and Ziff (2020) it was suggested to take the saturation and slow down in the rate of new infections into account by tapering off the growth with an exponential slow down as suggested in Vazquez (2006)
with and days. As a second parameter is introduced the original scaling exponent changes slightly to as a result of the fitting procedure.
Method
All data related to COVID-19 was downloaded from the publicly available JHU-CSSE (2020) data source provided continuously by the Johns Hopkins University Center for Systems Science and Engineering (JHUCSSE) CSSE . Aggregate data calculation for countries with different regions or states were performed after collecting by a simple summation over all associated regions or provinces (for the countries USA, China, and Canada). The data for Australia was omitted because the aggregated data in CSSE did not correspond to the value given in WHO .
We have selected the data sets with the 25 most infections as presented in WHO on 2020-03-24 11:00 CET. The countries and their infection counts are given in Table I.
| Country | #infections (2020-03-24) |
|---|---|
| China | 81588 |
| Italy | 63927 |
| USA | 46481 |
| Spain | 35212 |
| Germany | 30081 |
| Iran | 24811 |
| France | 20149 |
| South Korea | 9037 |
| Switzerland | 8795 |
| United Kingdom | 6733 |
| Netherlands | 4767 |
| Austria | 4742 |
| Belgium | 4269 |
| Norway | 2647 |
| Canada | 2088 |
| Portugal | 2060 |
| Sweden | 2059 |
| Brazil | 1960 |
| Denmark | 1703 |
| Israel | 1656 |
| Malaysia | 1624 |
| Turkey | 1529 |
| Japan | 1140 |
| India | 511 |
| Russia | 444 |
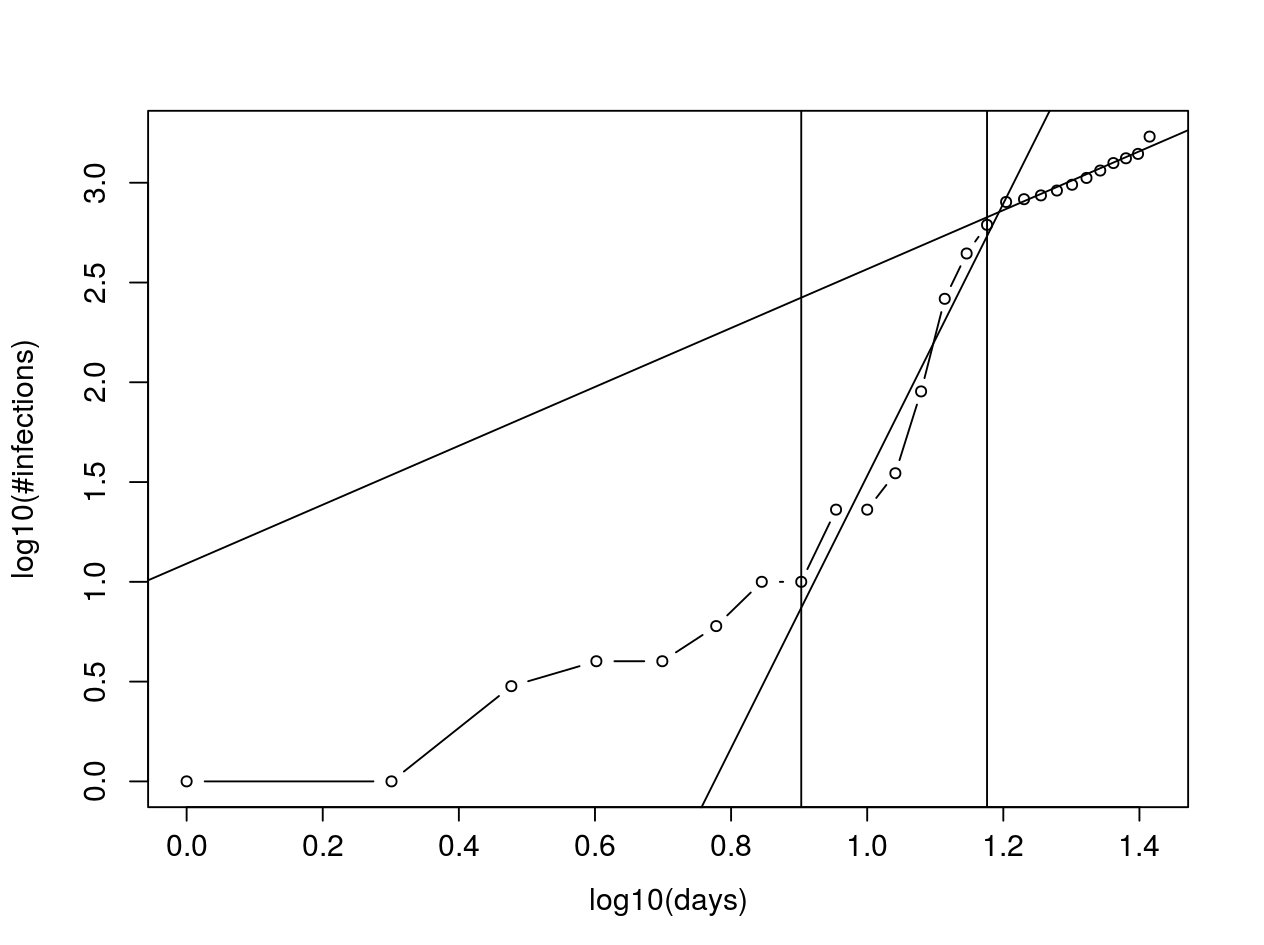
We have plotted the data for each country in a log-log plot and determined the range of power-law behavior. From there the scaling exponent for each country was extracted. As an example the data for Germany is shown in a log-log plot in Fig. 1. The range used to extract the scaling exponent is denoted with two vertical lines. The best fit line (determined by linear regression) is superimposed on the data points. In Fig. 2 the short term prediction of the total number of infections is superimposed onto the data points for the the next 7 days.
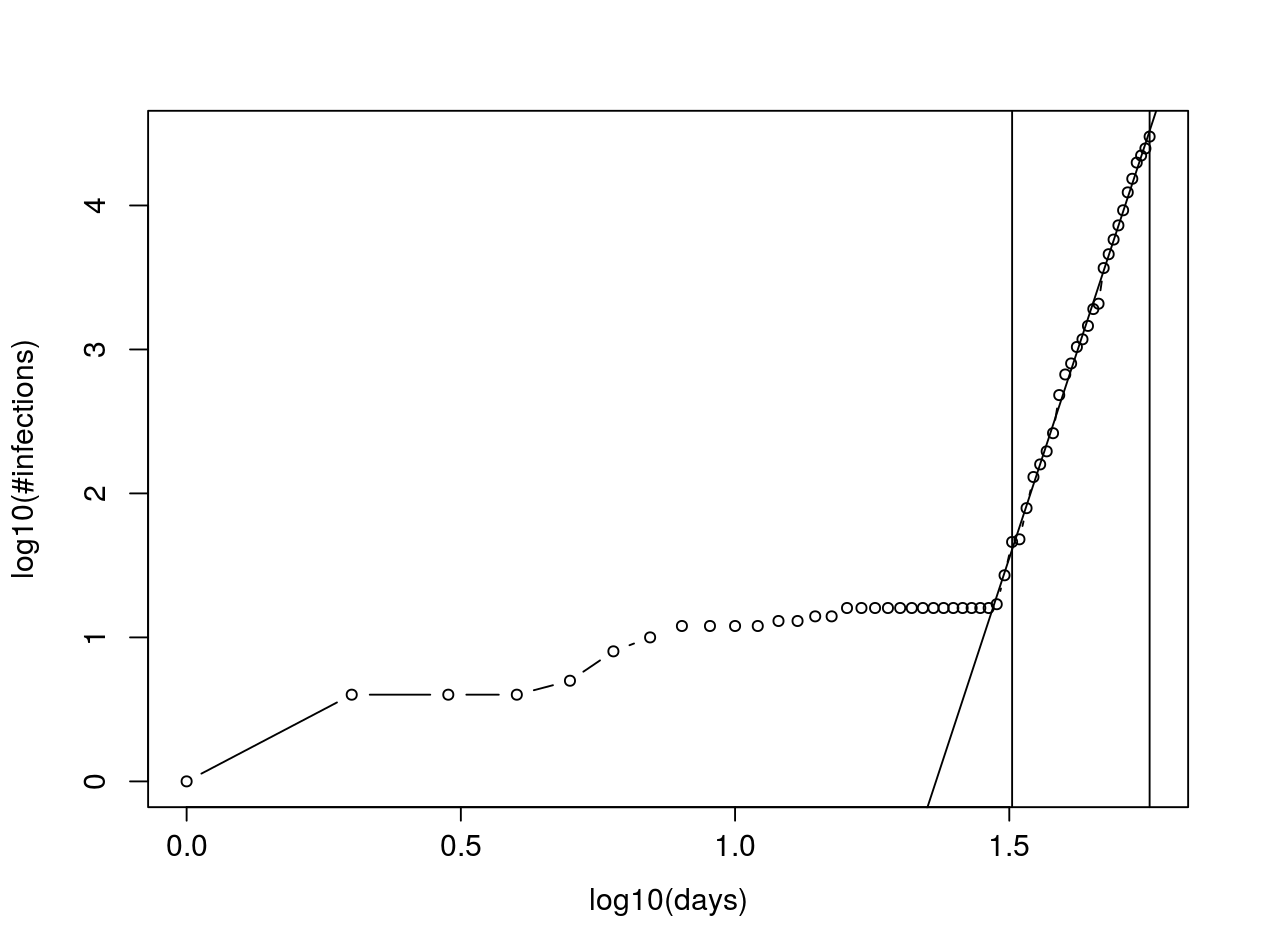
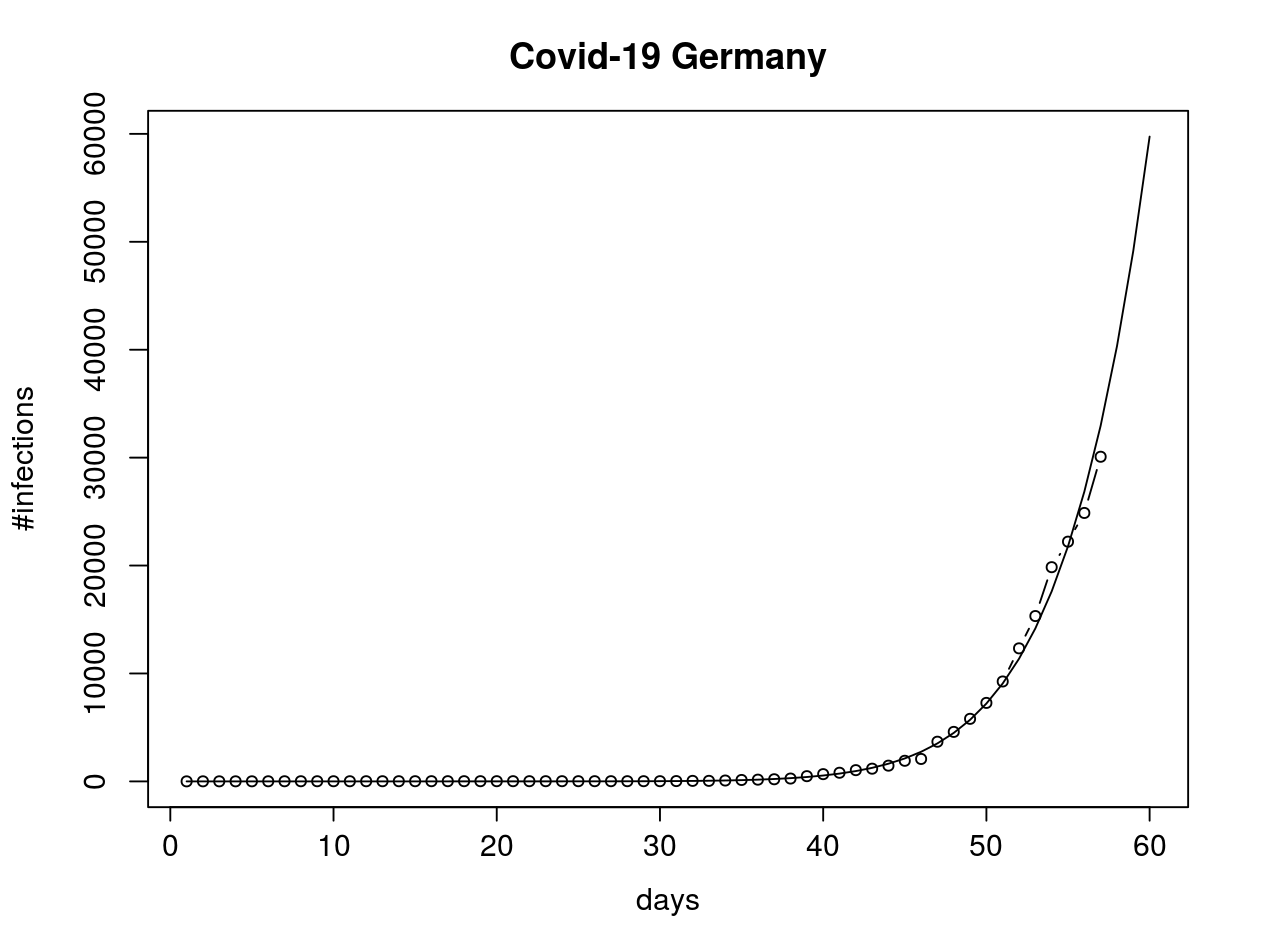
The scaling exponent for Germany was found to be .
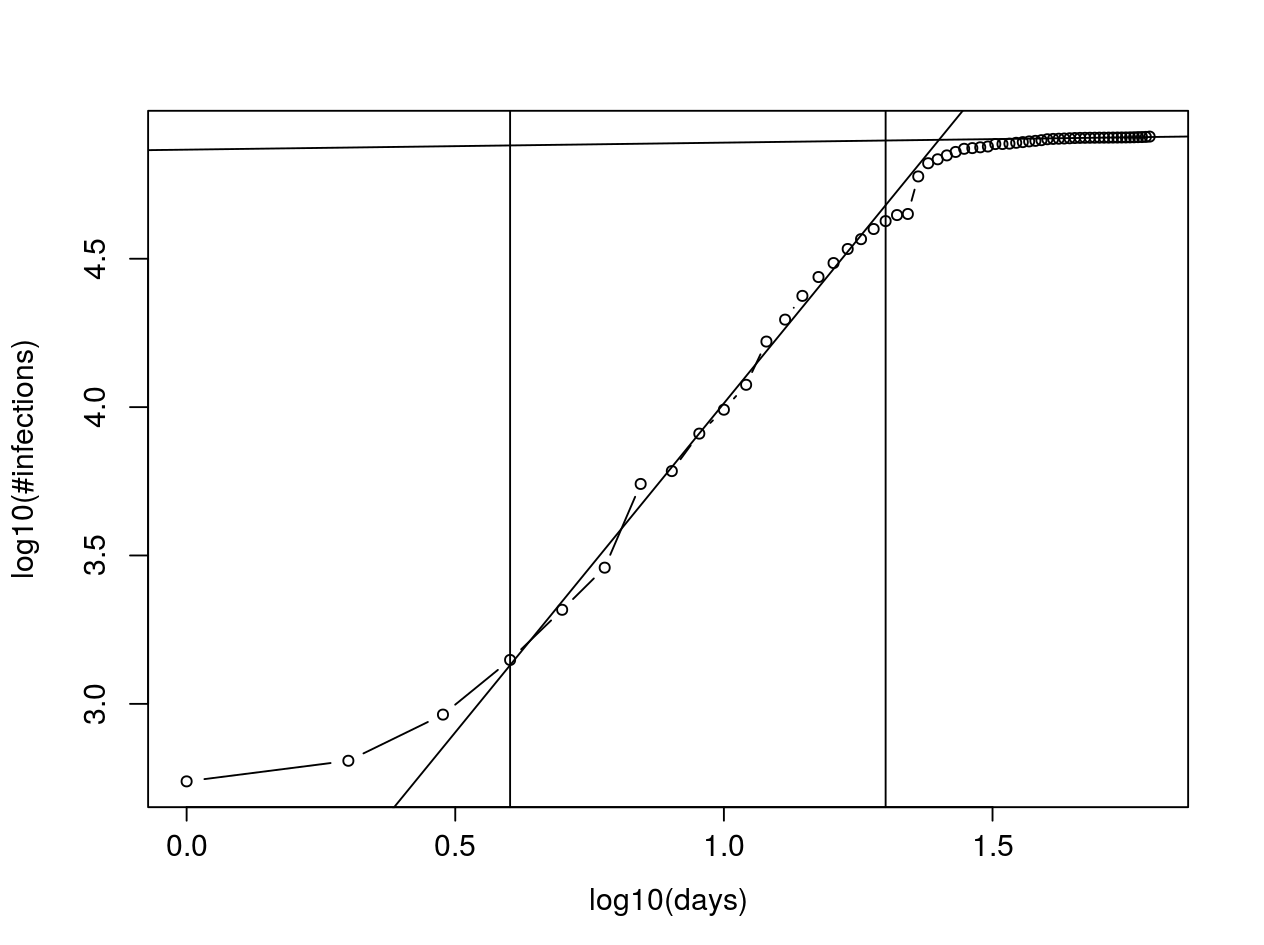
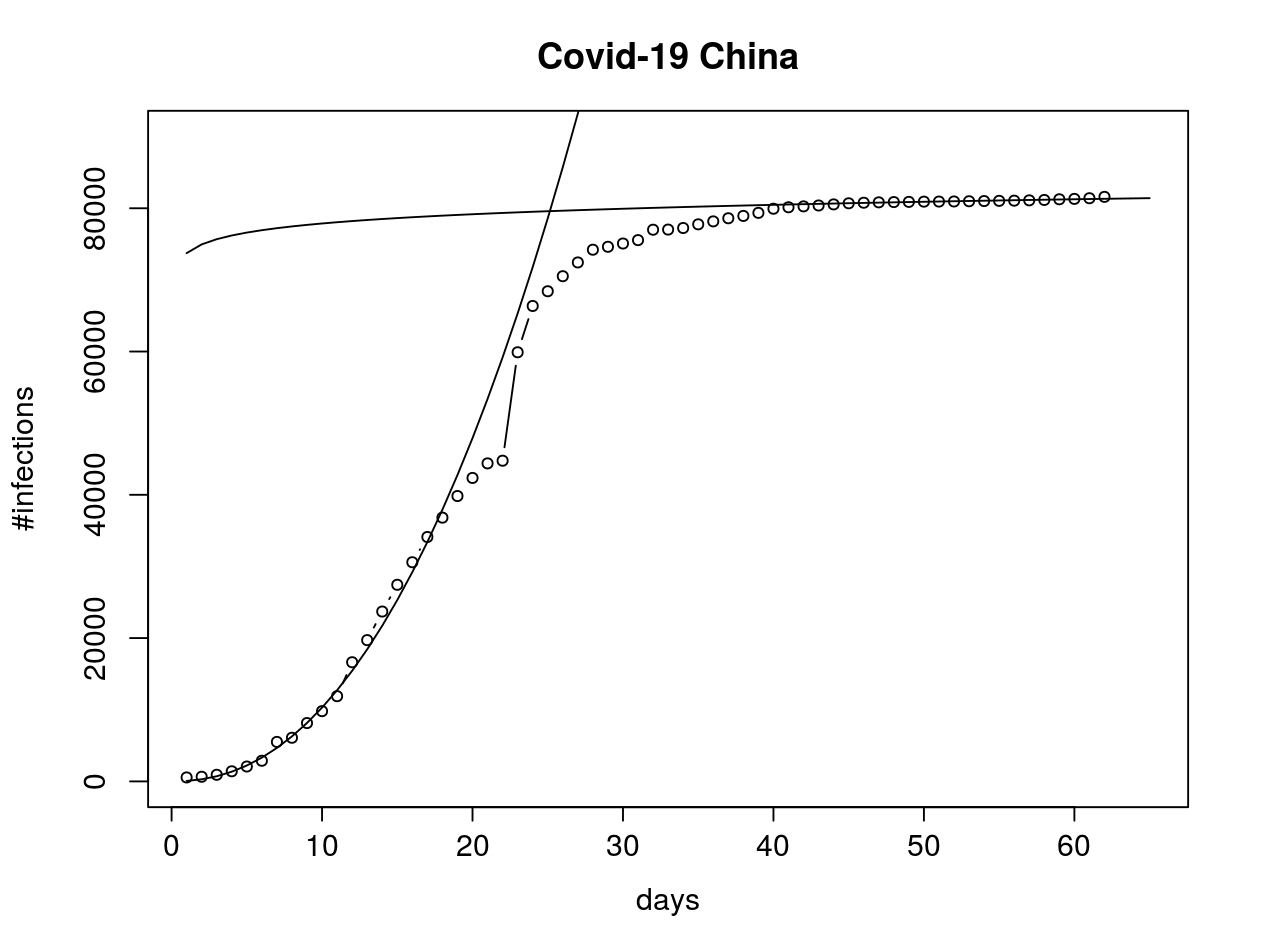
In order to cross-check the validity of the determined scaling exponent we have recalculated the scaling exponent for China in the power law range and found in excellent agreement with Ziff and Ziff (2020). Fig. 3 shows the log-log plot for China.
Since no country apart from China exhibits signs of a saturation we have used the simple power law fit instead of the cutoff power law fit Vazquez (2006) to determine all scaling exponents.
Results
We have extracted the scaling exponents for all the countries in Table I. As of 2020-03-24 there was only China which showed a saturation of the total number of infections. All the other countries have not reached yet such a level. We could distinguish three different stages:
-
1.
Growth stage: the total number of infections is in the power law range and a single scaling exponent could be extracted. Currently most countries fall into this category.
-
2.
Slow down stage: due to government imposed strict measures to slow down the spread of the virus the initial power law range split into a second one with a smaller scaling exponent. The total number is still increasing as a power law but more slowly than before. We have found only three countries where this was the case: Denmark, Norway, and South Korea.
-
3.
Saturation stage: the power law regime has ended and the total number of infections slows down to small numbers close to 0. This was only the case for China (see Fig. 3 and Fig. 4).
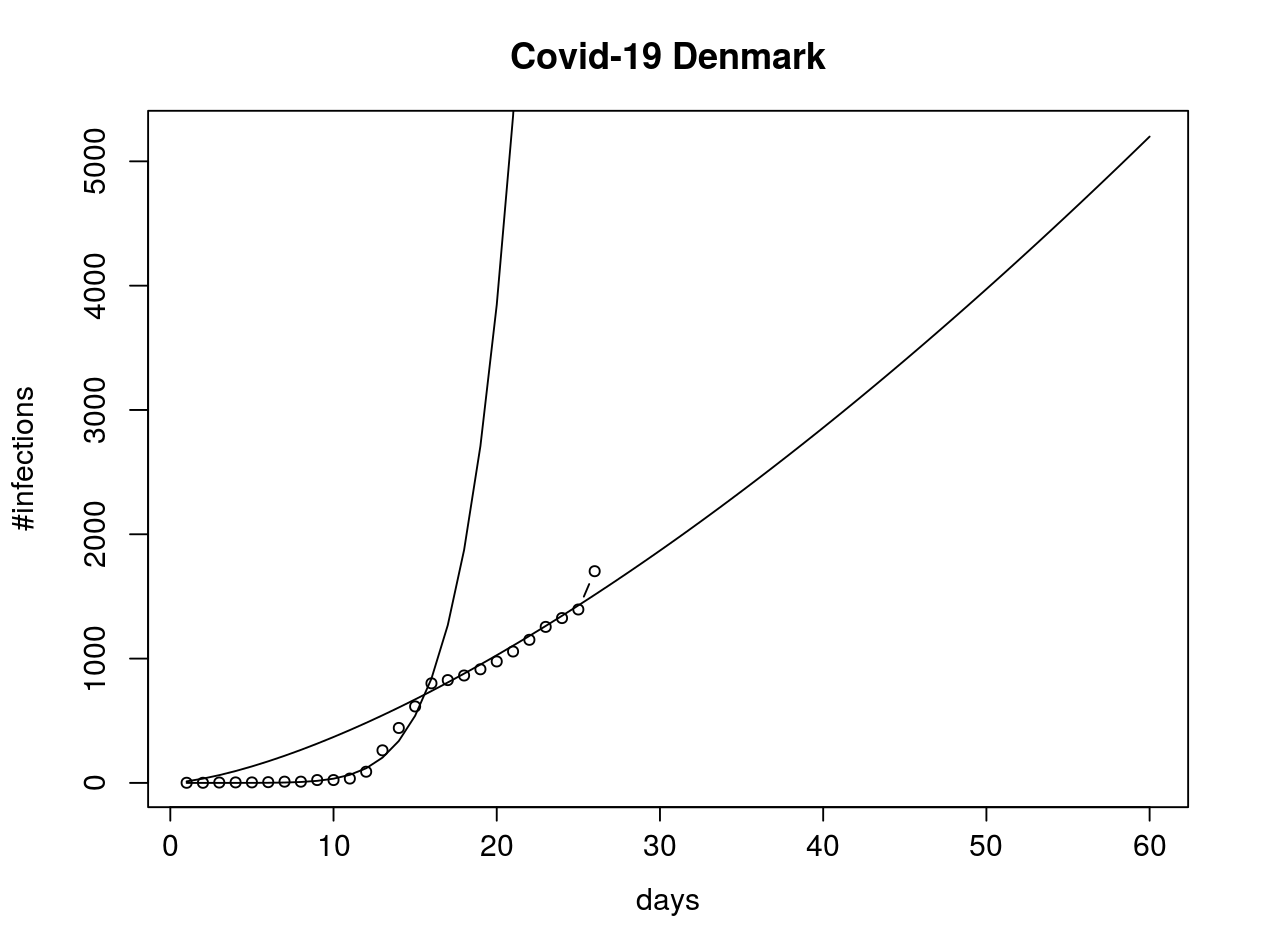
To demonstrate the slow down stage we present the data from Denmark in Fig. 5 as a log-log plot and Fig. 6 as short term predictions for the total number of infections. We find pre-intervention and post-intervention. It is, however, important to note that the data so far clearly does not show a saturation – merely a slow down into a different power law regime with a different scaling exponent.
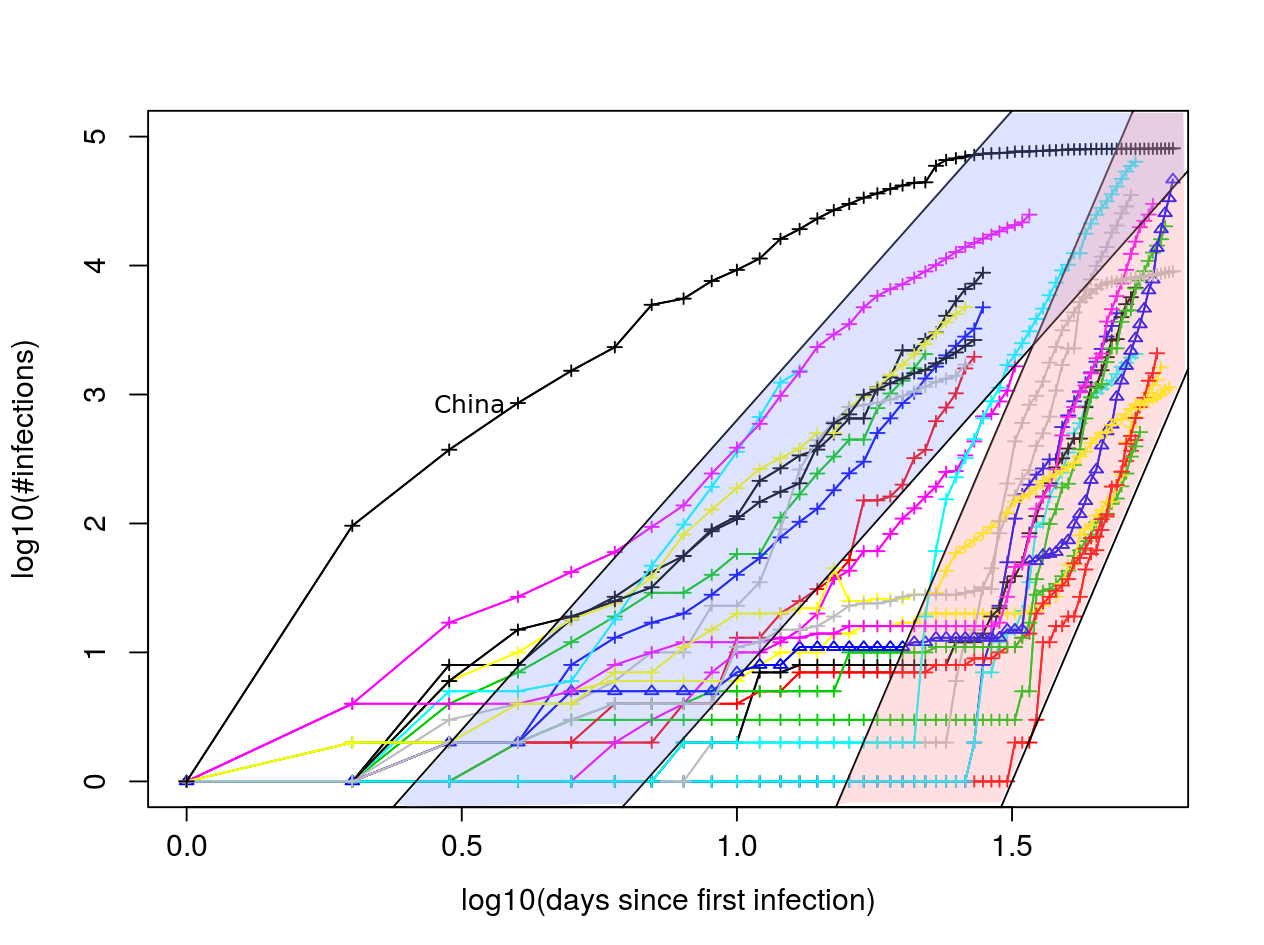
We have plotted all country data in a log-log plot starting from the respective day of the first infection in Fig. 7. If more than one person was recorded to be infected on the first day we have subtracted the difference to 1 from the data set to plot all the data from the same origin. Since we are only interested in the power law exponent in the range of large total numbers of infections this subtraction did not affect the outcome of the plot and the result. Since, however, the number of recorded infections on the first day in China was 548 the data points from China do not follow the other countries’ general development.
As can be seen in Fig. 7 the growth rate of the total number of infections can be roughly divided into two distinct growth patterns:
-
1.
steady power law growth from the beginning in the blue (online) regime where we have found a scaling exponent of .
-
2.
explosive power law growth in the red (online) regime: after a long incubation time with hardly any infections the total number of infections increases rapidly with a scaling exponent of .
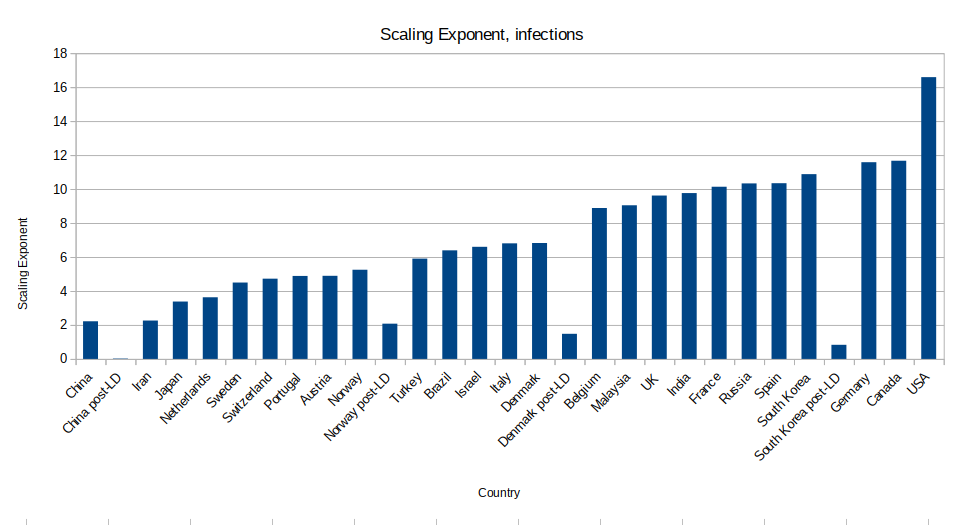
The exact calculations of the power law scaling exponents are given in Table II. The scaling exponents are displayed graphically in Fig. 8.
| Country | (pre) | (post) |
|---|---|---|
| China | 2.22 | 0.024 (saturation) |
| Iran | 2.26 | |
| Japan | 3.38 | |
| Netherlands | 3.63 | |
| Sweden | 4.50 | |
| Switzerland | 4.72 | |
| Portugal | 4.89 | |
| Austria | 4.90 | |
| Norway | 5.25 | 2.08 |
| Turkey | 5.91 | |
| Brazil | 6.39 | |
| Israel | 6.60 | |
| Italy | 6.80 | |
| Denmark | 6.82 | 1.48 |
| Belgium | 8.88 | |
| Malaysia | 9.05 | |
| United Kingdom | 9.62 | |
| India | 9.76 | |
| France | 10.14 | |
| Russia | 10.33 | |
| Spain | 10.34 | |
| South Korea | 10.88 | 0.83 |
| Germany | 11.58 | |
| Canada | 11.67 | |
| USA | 16.59 |
Conclusions
Our initial assumption was that cultural habits of proximity and cleanliness such as the habit of washing hands as well as the geographical location would influence the speed at which the total number of infection increases but at least on a per country comparison such a distinction was not discernible. Neither cultural habits nor social distance and personal space Erickson seem to have a noticeable influence. Also the latitude and the according temperature differences do not seem to play any role.
A puzzling fact is that neighboring countries do not seem to exhibit similar scaling exponents such as Belgium (8.88) to the Netherlands (3.63) or France (10.14) to Switzerland (4.72) or Germany (11.58) to Austria (4.9).
We have confirmed that the implementation of lock-downs had an impact on the spread – however, not the governmental sanctions per se but – obviously – the adherence to it by the people. Notably there was hardly any noticeable impact on the lock-down in Italy whereas the measures in Denmark and Norway were very effective. The complete lock-down of Wuhan in China seemed to have been so far the most effective measure, however, China is two months ahead of all the other countries so no direct comparison can be drawn at the moment. South Korea deserves a special mention since the wide range testing of a large part of the population and consequent isolation of confirmed cases seems to have prevented any further growth (dropping from 10.88 to 0.83).
A puzzling data point is Iran which has the second lowest scaling exponent (2.26) almost identical to China (2.20). As Iran to our knowledge did not introduce any severe and strict measures and lock-downs we are tempted to believe that the reported numbers do not correspond to the actual numbers of infected people in that country. Perhaps many people in Iran are not able to seek medical attention or prefer not to?
It is worth noting that the currently highest spread is found in the USA with a scaling exponent of 16.59. We do not know why the outbreak in the US was so explosive.
We have found that the stricter the lock-down measures have been instituted and the higher the adherence of the population to those measures the faster the exponent dropped and the more noticeable pre- and post-measure regimes were separated.
Countries where there were no strict measures (or not yet) and no adherence to those measures if implemented or if they were introduced very late in the process have scaling exponents of (USA 16.59). Countries with earlier lock-down measures and stricter adherence have exponents of .
In conclusion the data supports evidence that the spread is not exponential but can be described as a power law which indicates that all investigated countries and societies seem to be organized as small world networks and show scale-free behavior in the total number of infections. Different governmental measures and adherence of the population to those measures leads to strikingly different growth rates and scaling exponents. The power law approach fits the recorded data very well and allows accurate short term predictions of the total number of infections which allows health care systems to prepare and to effectively plan necessary staff, infrastructure and in particular intensive care units and to triage new patients more efficiently.
Acknowledgements.
The author reports no funding related to this research and has no conflicting financial interests.References
- [1] WHO. Coronavirus covid-19 global cases by the center for systems science and engineering (csse) at johns hopkins university (jhu). URL https://www.arcgis.com/apps/opsdashboard/index.html#/bda7594740fd40299423467b48e9ecf6. Accessed on 2020-03-25 10:30 CET.
- Lai et al. [2020] Chih-Cheng Lai, Tzu-Ping Shih, Wen-Chien Ko, Hung-Jen Tang, and Po-Ren Hsueh. Severe acute respiratory syndrome coronavirus 2 (sars-cov-2) and coronavirus disease-2019 (covid-19): The epidemic and the challenges. International Journal of Antimicrobial Agents, 55(3):105924, 2020. ISSN 0924-8579. doi: https://doi.org/10.1016/j.ijantimicag.2020.105924. URL http://www.sciencedirect.com/science/article/pii/S0924857920300674.
- Smith [2006] Richard D. Smith. Responding to global infectious disease outbreaks: Lessons from sars on the role of risk perception, communication and management. Social Science & Medicine, 63(12):3113 – 3123, 2006. ISSN 0277-9536. doi: https://doi.org/10.1016/j.socscimed.2006.08.004. URL http://www.sciencedirect.com/science/article/pii/S0277953606004060.
- Vaillant et al. [2009] L Vaillant, G La Ruche, A Tarantola, P Barboza, and for the epidemic intelligence team at InVS. Epidemiology of fatal cases associated with pandemic h1n1 influenza 2009. Eurosurveillance, 14(33):19309, 2009. doi: https://doi.org/10.2807/ese.14.33.19309-en. URL https://www.eurosurveillance.org/content/10.2807/ese.14.33.19309-en.
- Jung et al. [2020] Sung-mok Jung, Andrei R. Akhmetzhanov, Katsuma Hayashi, Natalie M. Linton, Yichi Yang, Baoyin Yuan, Tetsuro Kobayashi, Ryo Kinoshita, and Hiroshi Nishiura. Real-time estimation of the risk of death from novel coronavirus (covid-19) infection: Inference using exported cases. Journal of Clinical Medicine, 9(2), 2020. ISSN 2077-0383. doi: 10.3390/jcm9020523. URL https://www.mdpi.com/2077-0383/9/2/523.
- Driggin et al. [2020] Elissa Driggin, Mahesh V. Madhavan, Behnood Bikdeli, Taylor Chuich, Justin Laracy, Giuseppe Bondi-Zoccai, Tyler S. Brown, Caroline Der Nigoghossian, David A. Zidar, Jennifer Haythe, Daniel Brodie, Joshua A. Beckman, Ajay J. Kirtane, Gregg W. Stone, Harlan M. Krumholz, and Sahil A. Parikh. Cardiovascular considerations for patients, health care workers, and health systems during the coronavirus disease 2019 (covid-19) pandemic. Journal of the American College of Cardiology, 2020. ISSN 0735-1097. doi: https://doi.org/10.1016/j.jacc.2020.03.031. URL http://www.sciencedirect.com/science/article/pii/S0735109720346374.
- Vardavas and Nikitara [2020] Constantine I. Vardavas and Katerina Nikitara. Covid-19 and smoking: A systematic review of the evidence. Tobacco Induced Diseases, 18(March), 2020. doi: 10.18332/tid/119324. URL http://dx.doi.org/10.18332/tid/119324.
- Zhao et al. [2020] Shi Zhao, Qianyin Lin, Jinjun Ran, Salihu S. Musa, Guangpu Yang, Weiming Wang, Yijun Lou, Daozhou Gao, Lin Yang, Daihai He, and Maggie H. Wang. Preliminary estimation of the basic reproduction number of novel coronavirus (2019-ncov) in china, from 2019 to 2020: A data-driven analysis in the early phase of the outbreak. International Journal of Infectious Diseases, 92:214 – 217, 2020. ISSN 1201-9712. doi: https://doi.org/10.1016/j.ijid.2020.01.050. URL http://www.sciencedirect.com/science/article/pii/S1201971220300539.
- Schmitt [2020] Franz-Josef Schmitt. A simplified model for expected development of the sars-cov-2 (corona) spread in germany and us after social distancing. https://arxiv.org/abs/2003.10891, 2020.
- Roques et al. [2020] Lionel Roques, Etienne Klein, Julien Papaix, and Samuel Soubeyrand. Mechanistic-statistical sir modelling for early estimation of the actual number of cases and mortality rate from covid-19. https://arxiv.org/abs/2003.10720, 2020.
- Deb and Majumdar [2020] Soudeep Deb and Manidipa Majumdar. A time series method to analyze incidence pattern and estimate reproduction number of covid-19. https://arxiv.org/abs/2003.10655, 2020.
- Botha and Dednam [2020] Andre E. Botha and Wynand Dednam. A simple iterative map forecast of the covid-19 pandemic. https://arxiv.org/abs/2003.10532, 2020.
- Chang et al. [2020] Sheryl L. Chang, Nathan Harding, Cameron Zachreson, Oliver M. Cliff, and Mikhail Prokopenko. Modelling transmission and control of the covid-19 pandemic in australia. https://arxiv.org/abs/2003.10218, 2020.
- Hermanowicz [2020] Slav W Hermanowicz. Forecasting the wuhan coronavirus (2019-ncov) epidemics using a simple (simplistic) model - update (feb. 8, 2020). medRxiv, 2020. doi: 10.1101/2020.02.04.20020461. URL https://www.medrxiv.org/content/early/2020/02/10/2020.02.04.20020461.
- Roosa et al. [2020] K. Roosa, Y. Lee, R. Luo, A. Kirpich, R. Rothenberg, J.M. Hyman, P. Yan, and G. Chowell. Real-time forecasts of the covid-19 epidemic in china from february 5th to february 24th, 2020. Infectious Disease Modelling, 5:256 – 263, 2020. ISSN 2468-0427. doi: https://doi.org/10.1016/j.idm.2020.02.002. URL http://www.sciencedirect.com/science/article/pii/S2468042720300051.
- Brandenburg [2020] Axel Brandenburg. Quadratic growth during the 2019 novel coronavirus epidemic. https://arxiv.org/abs/2002.03638, 2020.
- Watts and Strogatz [1998] Duncan J. Watts and Steven H. Strogatz. Collective dynamics of ’small-world’ networks. Nature, 393(6684):440–442, 1998. ISSN 1476-4687. doi: 10.1038/30918. URL https://doi.org/10.1038/30918.
- Watts [2004] D.J. Watts. Small worlds: the dynamics of networks between order and randomness, Vol. 9. Princeton University Press, 2004.
- Ziff and Ziff [2020] Anna L. Ziff and Robert M. Ziff. Fractal kinetics of covid-19 pandemic, 2020. URL https://www.medrxiv.org/content/early/2020/03/03/2020.02.16.20023820.
- Li et al. [2020] Ming Li, Jie Chen, and Youjin Deng. Scaling features in the spreading of covid-19. https://arxiv.org/abs/2002.09199, 2020.
- Vazquez [2006] Alexei Vazquez. Polynomial growth in branching processes with diverging reproductive number. Physical Review Letters, 96(3), Jan 2006. ISSN 1079-7114. doi: 10.1103/physrevlett.96.038702. URL http://dx.doi.org/10.1103/PhysRevLett.96.038702.
- [22] JHU CSSE. Novel coronavirus (covid-19) cases. URL https://github.com/CSSEGISandData/COVID-19. Accessed on 2020-03-24 11:00 CET.
- [23] Amanda Erickson. What ’personal space’ looks like around the world. URL https://www.washingtonpost.com/news/worldviews/wp/2017/04/24/how-close-is-too-close-depends-on-where-you-live/. Accessed on 2020-03-25 13:00 CET.