Calculated line lists for HO and HO with extensive comparisons to theoretical and experimental sources including the HITRAN2016 database
Abstract
New line lists are presented for the two most abundant water isotopologues; H216O and H218O. The H216O line list extends to 25710 cm-1 with intensity stabilities provided via ratios of calculated intensities obtained from two different semi-empirical potential energy surfaces. The line list for H218O extends to 20000 cm-1. The minimum intensity considered for all is cm molecule-1 at 296 K, assuming 100% abundance for each isotopologue. Fluctuation of calculated intensities caused by changes in the underlying potential energy are found to be significant, particularly for weak transitions. Direct comparisons are made against eighteen different sources of line intensities, both experimental and theoretical, many of which are used within the HITRAN2016 database. With some exceptions, there is excellent agreement between our line lists and the experimental intensities in HITRAN2016. In the infrared region, many H216O bands which exhibit intensity differences of 5-10% between to the most recent ’POKAZATEL’ line list (Polyansky et al., [Mon. Not. Roy. Astron. Soc. 480, 2597 (2018)] and observation, are now generally predicted to within 1%. For H218O, there are systematic differences in the strongest intensities calculated in this work versus those obtained from semi-empirical calculations. In the visible, computed cross sections show smaller residuals between our work and both HITRAN2016 and HITEMP2010 than POKAZATEL. While our line list accurately reproduces HITEMP2010 cross sections in the observed region, residuals produced from this comparison do however highlight the need to update line positions in the visible spectrum of HITEMP2010. These line lists will be used to update many transition intensities and line positions in the HITRAN2016 database.
1 Introduction
Water vapor is one of the most well studied and analyzed molecules in existence. Countless experiments (for instance those in Refs. [1, 2, 3, 4, 5, 6, 7, 8, 9, 10, 11, 12, 13, 14, 15, 16]) and ab initio[17, 18, 19, 20, 21, 22, 23, 24] calculations have been performed to document its spectrum; such research is presently on-going and is likely continue for many more years.
Water is abundant in our own atmosphere, where it is a source of significant radiation absorption at all wavelengths, but is readily observed in the spectra obtained from many extra-terrestrial bodies, not limited to but including exoplanets[25, 26], comets[27, 28] and cool stars[29].
The absorption spectrum of this asymmetric top molecule is complex and can be observed in the Earth’s atmospheres from the microwave to the near ultraviolet. Water spectra can influence the retrieval of many molecules. When accurate retrievals are sought, precise intensities and line parameters for almost every transition become important. For those molecules with trace abundances, extra emphasis is placed on this to reduce the unwanted interference[30, 31].
The HITRAN[32] database is a widely acknowledged and thoroughly verified source of spectroscopic data, housing line-by-line parameters for 49 molecules that are detectable in our own and some planetary atmospheres. The database is used in a variety of applications, from the calibration of instruments, to the interpretation of telluric spectra and modeling of planetary atmospheres, and as such, the data which makes its way into the database is extensively verified, not just by the HITRAN group, but by the scientific community that extensively uses it. The data which forms the H216O and H218O line lists in HITRAN2016[32] originate from a combination of ab initio, semi-empirical and experimental methods.
Experiments can have the advantage over ab initio methods by possessing the ability to measure transition parameters to high levels of precision (especially for the line positions), although the scale at which this is accomplished is often limited to one particular spectral region. Theoretical methods can, however, calculate entire spectra. The agreement between observation and calculation can often fluctuate from band to band, a product of both experimental and theoretical limitations, and the different systematic errors which characterize the two techniques. A combination of both resources are necessary to produce an accurate spectrum. Calculated spectra are now capable of predicting energy levels to tenths of a wavenumber, a feature that is essential for interpreting telluric observations.
The spectroscopically-determined potential energy surface of Bubukina et al.[22] predicts energy levels that are below 26000 cm-1 to 0.022 cm-1, while the more recent semi-empirical potential of Mizus et al.[24] calculates levels beneath 15000 cm-1 to 0.011 cm-1, which approaches the resolution of many atmospheric spectrometers on board satellite missions.
The most recently available calculated line list for H216O, called POKAZATEL is due to Polyansky et al.[23]. POKAZATEL is the first line list for a tri-atomic that is complete; it includes essentially every possible transition up to rotational level 72, where above J, the lowest energy level that is populated occurs above dissociation. The POKAZATEL line list used the dipole moment surface (DMS) of Lodi et al.[33], which was published in 2011. Since then, many high quality experiments have been conducted, from the infrared to the visible and small imperfections in the DMS have been observed. Sironneau and Hodges [13] measured intensities near 1.25 m to high precision, citing a sub percent uncertainty. They showed that there are inconsistencies in the prediction of 2 band intensities.
Birk et al. [7] analyzed five infrared experiments covering 1250 - 1750 cm-1[34] , 1850 - 2280 cm-1[6], 2390 - 4000 cm-1[6], 4190 - 4340 cm-1[35] and 10000 - 11000 cm-1. For some absorption bands at 1 m, the most recent ab initio models were found to no longer predict intensities to within 1-2%.
Lampel and co-workers[31] showed that POKAZATEL and other line lists failed to accurately predict atmospheric absorption in the 500 nm - 450 nm interval. The high temperature database, HITEMP2010[36], modeled the absorption significantly better, despite being almost ten years old at the time the work was carried out. HITEMP2010 used the calculated BT2[20] line list as a starting point, with experimental energy levels and intensities from HITRAN2008 replacing theoretical values where possible.
The motivation behind this work is to create new, highly accurate, calculated line lists for the two most abundant water isotopologues, validated through a significant number of comparisons against high quality experimental data present in the HITRAN2016 database and beyond, as well as semi-empirical methods, covering transition frequencies from the microwave to the visible.
2 Line List Calculation
For the HITRAN2016[32] H216O line list, the maximum rotational level considered is , with a cut off transition frequency of 25710 cm-1 and our line list follows the same thresholds. For H218O this is 20000 cm-1. Assuming 100% abundance for each isotopologue, we choose to calculate transitions with a minimum intensity of 10-30 cm molecule-1 at the standard room temperature of K which is sufficient for the majority of studies carried out at the range of temperatures encountered in the terrestrial atmosphere. When included in atmospheric models it maybe practical to further truncate the line lists by including isotopic abundance under the same cut off criteria. In the far infrared of HITRAN2016, there are several transitions with intensities orders of magnitude weaker than this, however, they are negligible in comparison to many pure rotational transitions. In cases where one wants to make use of weaker transitions (for instance in high-temperature applications) the HITEMP database (which is beyond the scope of this paper) should be used instead of HITRAN.
To calculate our line lists, we consider the semi-empirical potential energy surfaces (PES) of Bubukina et al.[22] and Polyansky et al.[23] (POKAZATEL PES) with the most recent ab initio dipole moment surface available, CKAPTEN[37]. It is important to distinguish the POKAZATEL line list from the POKAZATEL potential: the POKAZATEL line list used the dipole surface of Lodi et al. [33] with the POKAZATEL potential for the calculation of its spectra.
The high-accuracy IR potential of Mizus et al. [24], termed PES15k, calculates energy levels to an average deviation of only 0.011 cm-1 when compared to experiment. However, it only covers energy levels to 15000 cm-1, which is too low for this work, hence we do not consider it here.
We use the DVR3D suite of programs of Tennyson et al.[38] for the generation of all spectra. These semi-empirical PESs began with an ab initio potential, which is then fit to model observed spectroscopic data. Our line lists are hence computed with the wavefunctions of a semi-empirical potential and an ab initio dipole.
For H216O measured energy levels below 26000 cm-1, the PES of Bubukina et al. predicts these states to an average deviation of 0.022 cm-1, whilst the POKAZATEL PES calculates the same levels to a RMS of 0.04 cm-1. The POKAZATEL potential has the added feature that it accurately predicts energy levels above 26000 cm-1. For measured levels between 0 cm-1 and dissociation at 41 145 cm-1 [39], POKAZATEL has a RMS of 0.13 cm-1. Bubukina and co-workers also modified their potential for the other isotopologue H218O, which we also use in the calculation of spectral intensities.
To obtain a measure or indication of the theoretical uncertainty on transition intensities, the method of Lodi and Tennyson[40] involves computing spectra with two different dipoles and two different potentials. The uncertainty of each line is assessed by taking the largest ratio between the transition intensities obtained from each of the four possible calculations. A ratio close to unity would indicate a stable transition, where a ratio deviating from one indicates that the transition is ’sensitive’ to either the DMS or PES.
For unstable weak transitions, it is understood that the underlying potential is the cause of such instability, while systematic errors in band intensities that may appear for stable lines are likely due to the DMS . To quantify an uncertainty, one requires knowledge of both factors. For H216O, we aim, in this work, to identify unstable transitions which are solely due to the potential. Hence, we will consider one DMS and two different potentials. Also, the POKAZATEL line-list used the second most recent DMS that is available, created by Lodi et al. [33] in 2011, and we will be comparing to the POKAZATEL line-list.
The dipole calculations for this DMS were carried out at a very high level of theory, where each point (16000 total) required over 140000 seconds of CPU time to complete[37]. For high-accuracy theoretical spectra, the Multi-Reference Configuration Interaction (MRCI) method combined with the aug-cc-pCV6Z basis set is the current gold-standard formalism, however, it is limited to only the lightest of molecules with few degrees of freedom, such as H3+ [41] and HCN [42]. Hence, we expect the DMS to provide excellent transition intensities for strong, stable lines in the IR, where calculated intensities will deviate by no more than 1-2% from high-accuracy experiments. For stable transitions in the visible/near-UV, the accuracy of both experiment and theory is expected to reduce as the majority of these will be weak, however, the agreement should still be within 10-20%. Through a significant number of comparisons, against both experimental and theoretical sources, the quality of this DMS, CKAPTEN, will be verified. Where we quote theoretical uncertainty below, we refer to the instability induced by the potential energy surface.
For H216O, using the POKAZATEL PES with the CKAPTEN DMS, we created a temporary line list that extended slightly beyond the HITRAN2016 cut-off st 25000 cm-1. and went to 26000 cm-1. Similarly, using the PES of Bubukina et al. with CKAPTEN we created another line list that also extends to 26000 cm-1. Two line lists are required to obtain stabilities.
The POKAZATEL PES was refined using the same number of measured energy levels (below 26000 cm-1) to that of Bubukina et al. within rotational levels J = 0, 2, 5. Since the PES of Bubukina et al. provides more accurate energy levels, we use the line list that included this PES with the CKAPTEN DMS for our main/reported line list, with the other line list only used for the purpose of obtaining a PES stability on the intensities.
The H218O line list use the PES of Bubukina et al. with the CKAPTEN DMS.
2.1 MARVELization
MARVEL (measured active rotational-vibrational energy levels) [43] is a procedure for inverting observed spectroscopic frequencies to obtain well characterized empirical energy levels and uncertainties. The method was developed for a task group studying the spectroscopy of water [44] who provided energy levels for all the isotopologues of water [45, 46, 47, 48]. As illustrated by this task group [46] use of these empirical levels facilitates not only the reproduction of the original observed line position but also the precise prediction of many other yet-to-be-observed line positions between states for which there are MARVEL energy levels. The MARVEL algorithm has been systematically improved [49, 50] with a particular focus on continuing to improve the energy levels of water [50, 51, 52]. An important point is that MARVEL requires all transitions, and hence resulting energy levels, to be fully labeled.
DVR3D provides rigorous quantum numbers, notably, an ortho/para label, rotational quantum number and parity. Where possible, it is helpful to also label each H216O and H218O energy level with quantum numbers , , , and . On their own, the rigorous quantum numbers from DVR3D do not provide enough information to match with the empirical energy levels from MARVEL. Hence, energy level differences must be used together with this information to match with MARVEL states. This approach makes the labeling of closely lying states not straightforward.
For H218O we supplemented the MARVEL data with new pseudo-experimental levels taken from Polyansky et al. [53].
Each energy level calculated with DVR3D is unique, but can naturally occur more than once as both an upper or lower state within a transition. It is therefore important that the same energy level from DVR3D is not assigned differently in various transitions. We approached this matching problem in stages, where the maximum energy difference interval for matching, i.e , is increased in values of cm-1, cm-1, cm-1, cm-1, cm-1, cm-1 and cm-1. Increasing beyond this final value would dramatically increase the possibility of mis-labeling.
Using the uniqueness, once a calculated level from DVR3D is matched to its corresponding level in MARVEL, only that particular calculated level may carry that MARVEL label from then on. Also, once a MARVEL level is matched to a level in our line list, it does not carry onto the next iteration, thus preventing duplication from ever occurring.
For our line lists, where matching was successful, our calculated energy levels were replaced with what is predicted from MARVEL. Those levels that were not assigned in the final iteration were given a default/unknown label of (, , , , ) = . We note that there are strong theoretical grounds for believing that it is not actually possible to label all the states of water with consistent set of harmonic oscillator, rigid rotor labels above the barrier to linearity [54] which lies at about 11110 cm-1 [55].
2.2 Calculation of H216O Stabilities
Using both H216O line lists, we assess the stability in each line intensity based on the ratio of matched intensities [40]. Applying this process was not straightforward, as achieving a consistent set of labels for all levels is difficult. For unstable, often weak transitions, the labeling of a particular state may fluctuate between potentials.
We opted to include an intensity ratio threshold in this matching process, whereby, if transitions in each of our line lists are matched on all quantum numbers and via a small energy level interval, if the ratio of their intensities falls outside the interval , then the upper level has its label reset to default/unknown: As previously mentioned, this generally occurs for very weak transitions. This method also reduces the possibility of our H216O line list having incorrectly labelled states.
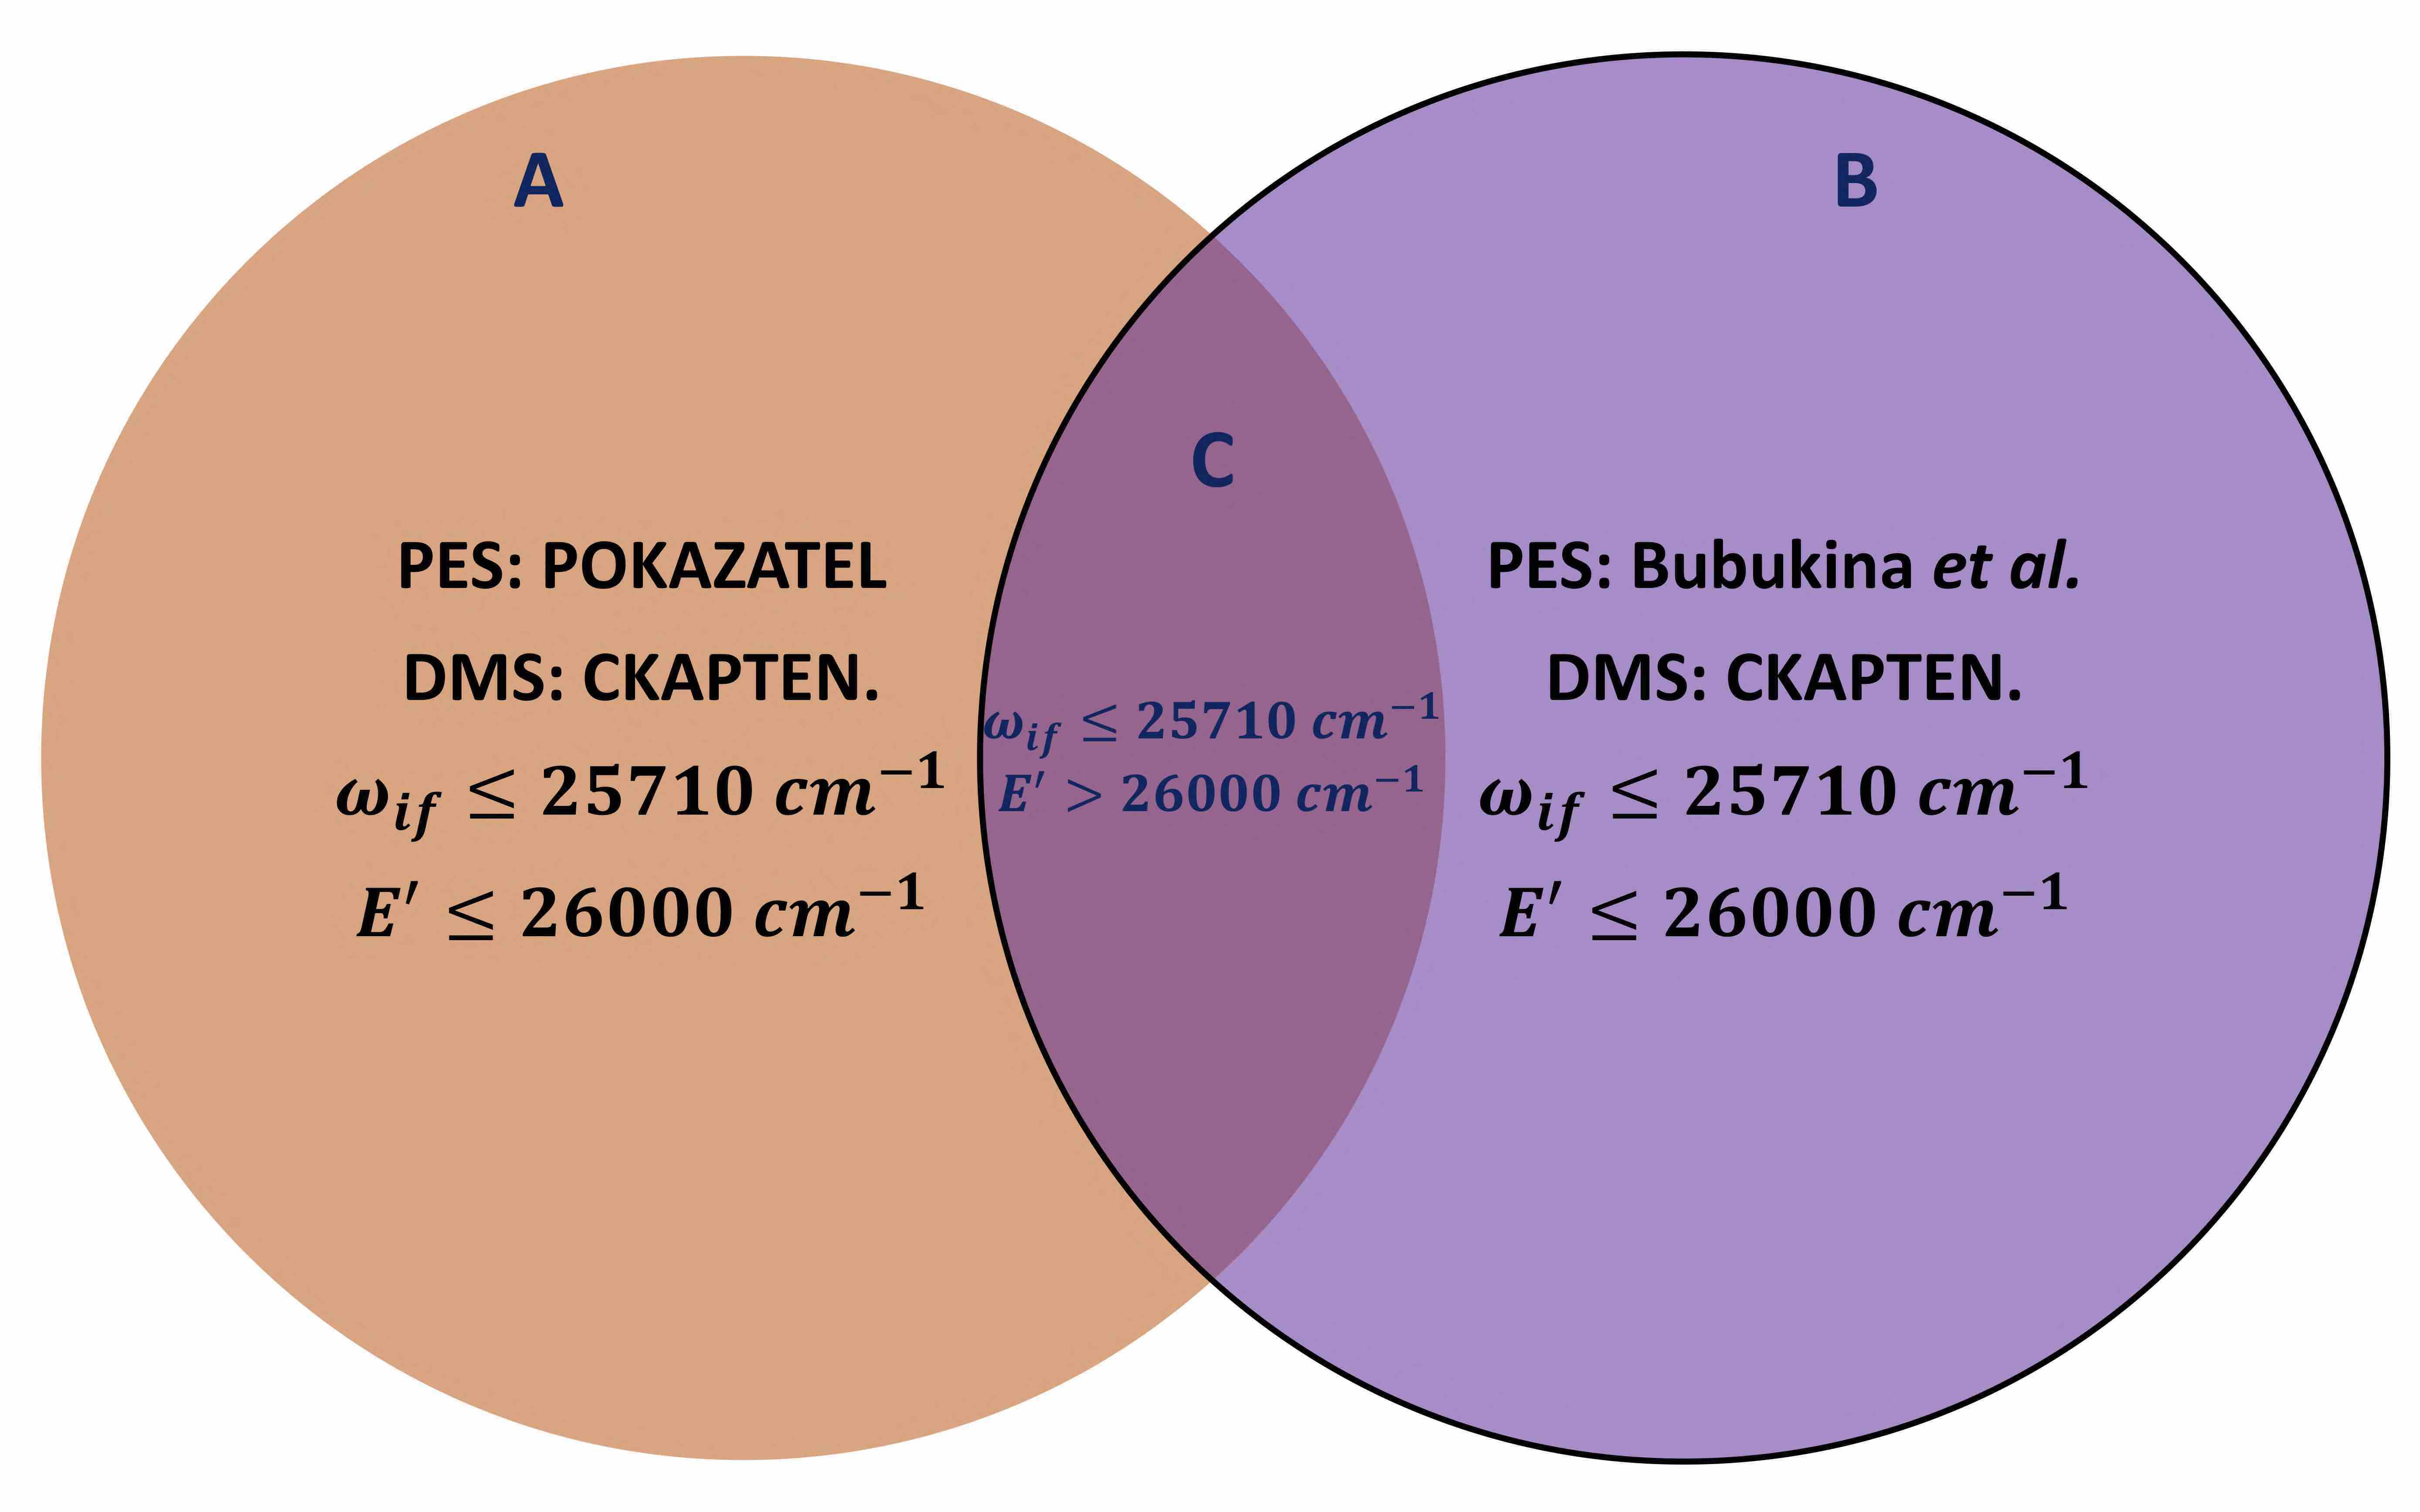
The Bubukina et al. potential is not reliable for accurately calculating energy levels that lie above 26000 cm-1, however, there are a small number of transitions with intensities above 10-30 cm molecule-1 and frequencies below 25710 cm-1, that have an upper state energy above 26000 cm-1. For these few particular transitions, we replace all the parameters with those produced from the POKAZATEL potential. In Figure 1, these few transitions are in , and our final line list is within the solid circle enclosing regions B and C.
3 Results
3.1 H216O
In Table 1 we summarize the PES stability percentage on transition intensities which is calculated as , and follow the HITRAN2016 relative uncertainty groups. The majority of transitions are stable with PES sensitivity less than 1%, while the number of unstable transitions appear to decrease as sensitivity increases, an attractive quality in this line list. Those transitions that could not be assigned a sensitivity are not included in the table.
| Percentage Range. | Number of Lines. |
|---|---|
| 20 % | 4008 |
| 10 - 20 % | 5677 |
| 5 - 10 % | 13055 |
| 2 - 5 % | 40364 |
| 1 - 2 % | 34567 |
| 0 - 1 % | 96117 |
Starting from data contained in the HITRAN2016 database, we compare with over 20000 measured transitions that originate from twelve different experimental sources [2, 3, 4, 5, 6, 7, 8, 9, 10, 11, 12, 13]. It is important to note, that for all our comparisons to HITRAN2016 data, which are shown below, the data obtained from each source may not be 100% complete, meaning, not all of the reported data from that particular source features in HITRAN2016.
For microwave spectra, transitions in HITRAN2016 come from ab initio[33] and semi-empirical calculations[56, 57]. This region is dominated by strong, pure rotational transitions and as such, both the DMS and PES are very well defined. Different ab initio models [33, 20] hence exhibit very similar behavior due to the similarity of the underlying ab initio calculations in such a well defined region, hence it is necessary to compare with the latest semi-empirical methods that do not use the same formalism as we do. Comparisons are made with the line list taken from the more recent work of Coudert et al.[58], which is used in GEISA2015 [59]
Several experimental sources[34, 35, 6] in HITRAN2016 covers the mid-infrared region from 1250 - 4390 cm-1 and we thought it necessary to supplement this by a comparison to the experimental data of Ptashnik et al.[14], which is not in the database. For the NIR, seven experiments[3, 8, 9, 10, 11, 12, 13] provide measurements in the interval 7000 - 8339 cm-1, while three experiments [4, 7, 2] cover 10000 - 14500 cm-1. Only one experimental source[5] provides data on the remainder of the visible spectrum.
For all figures shown below, where transition intensities in units of cm/molecule are plotted on the x-axis, these intensities represent our calculated values.
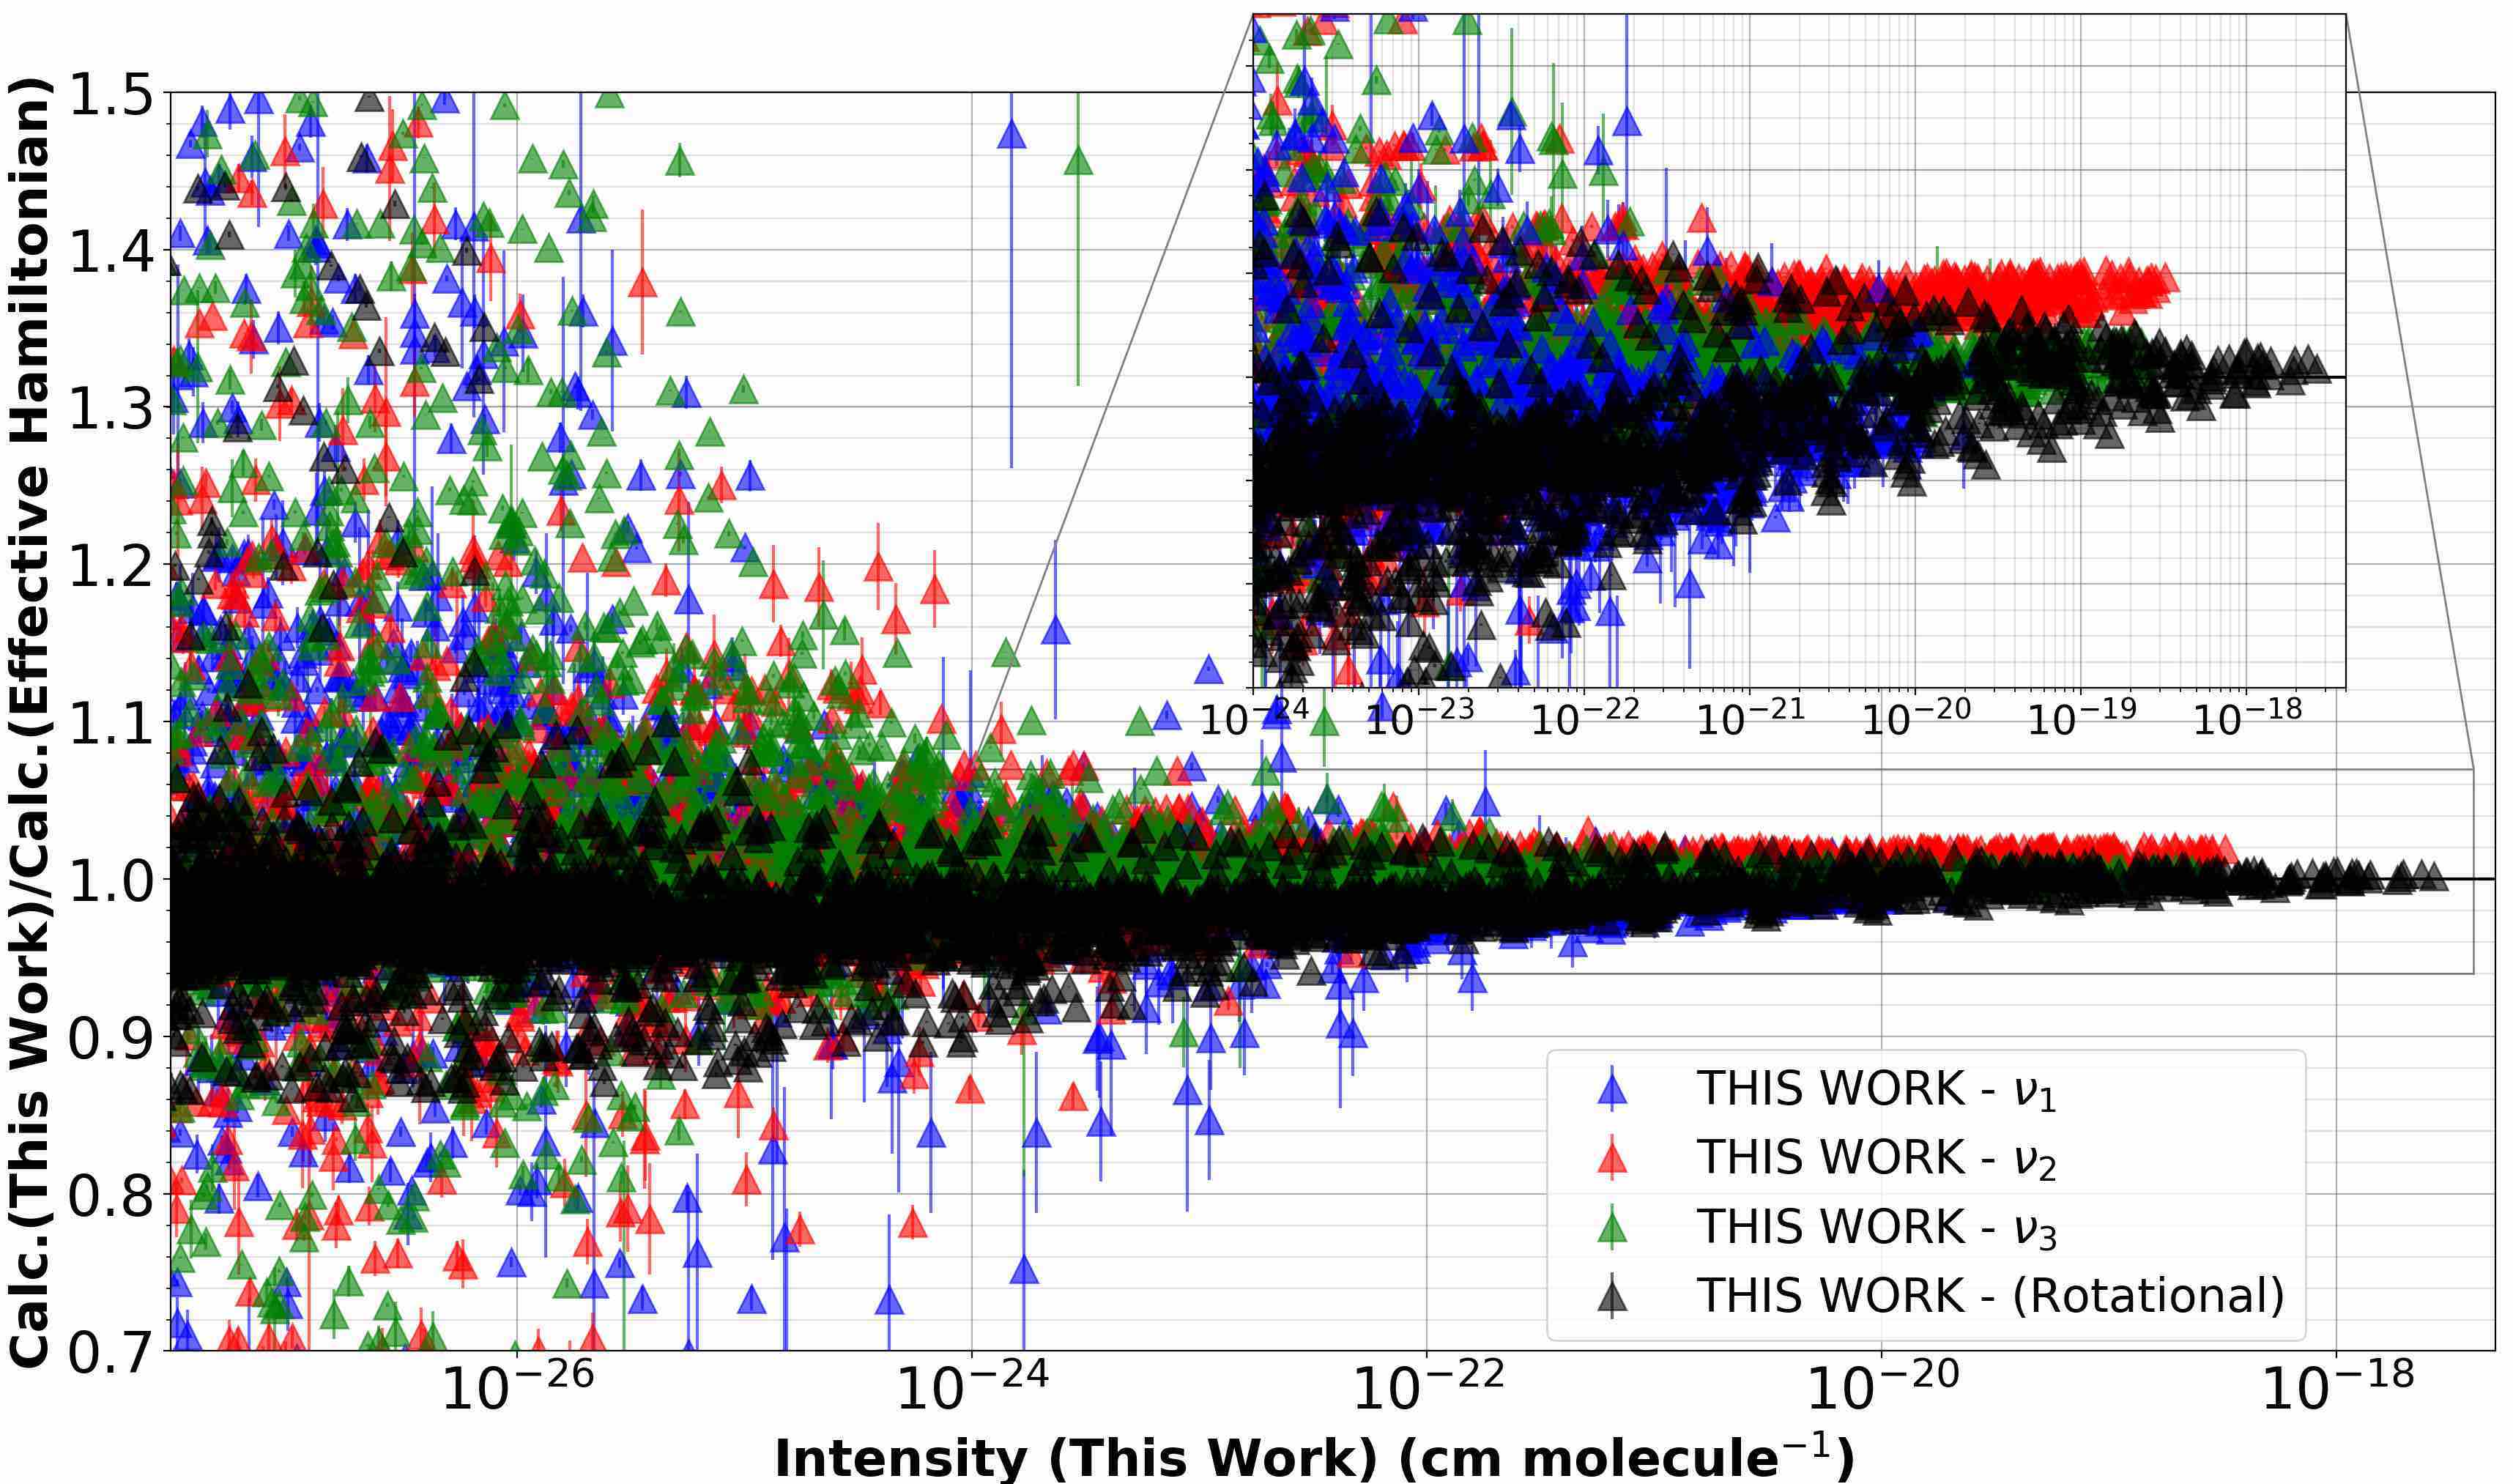
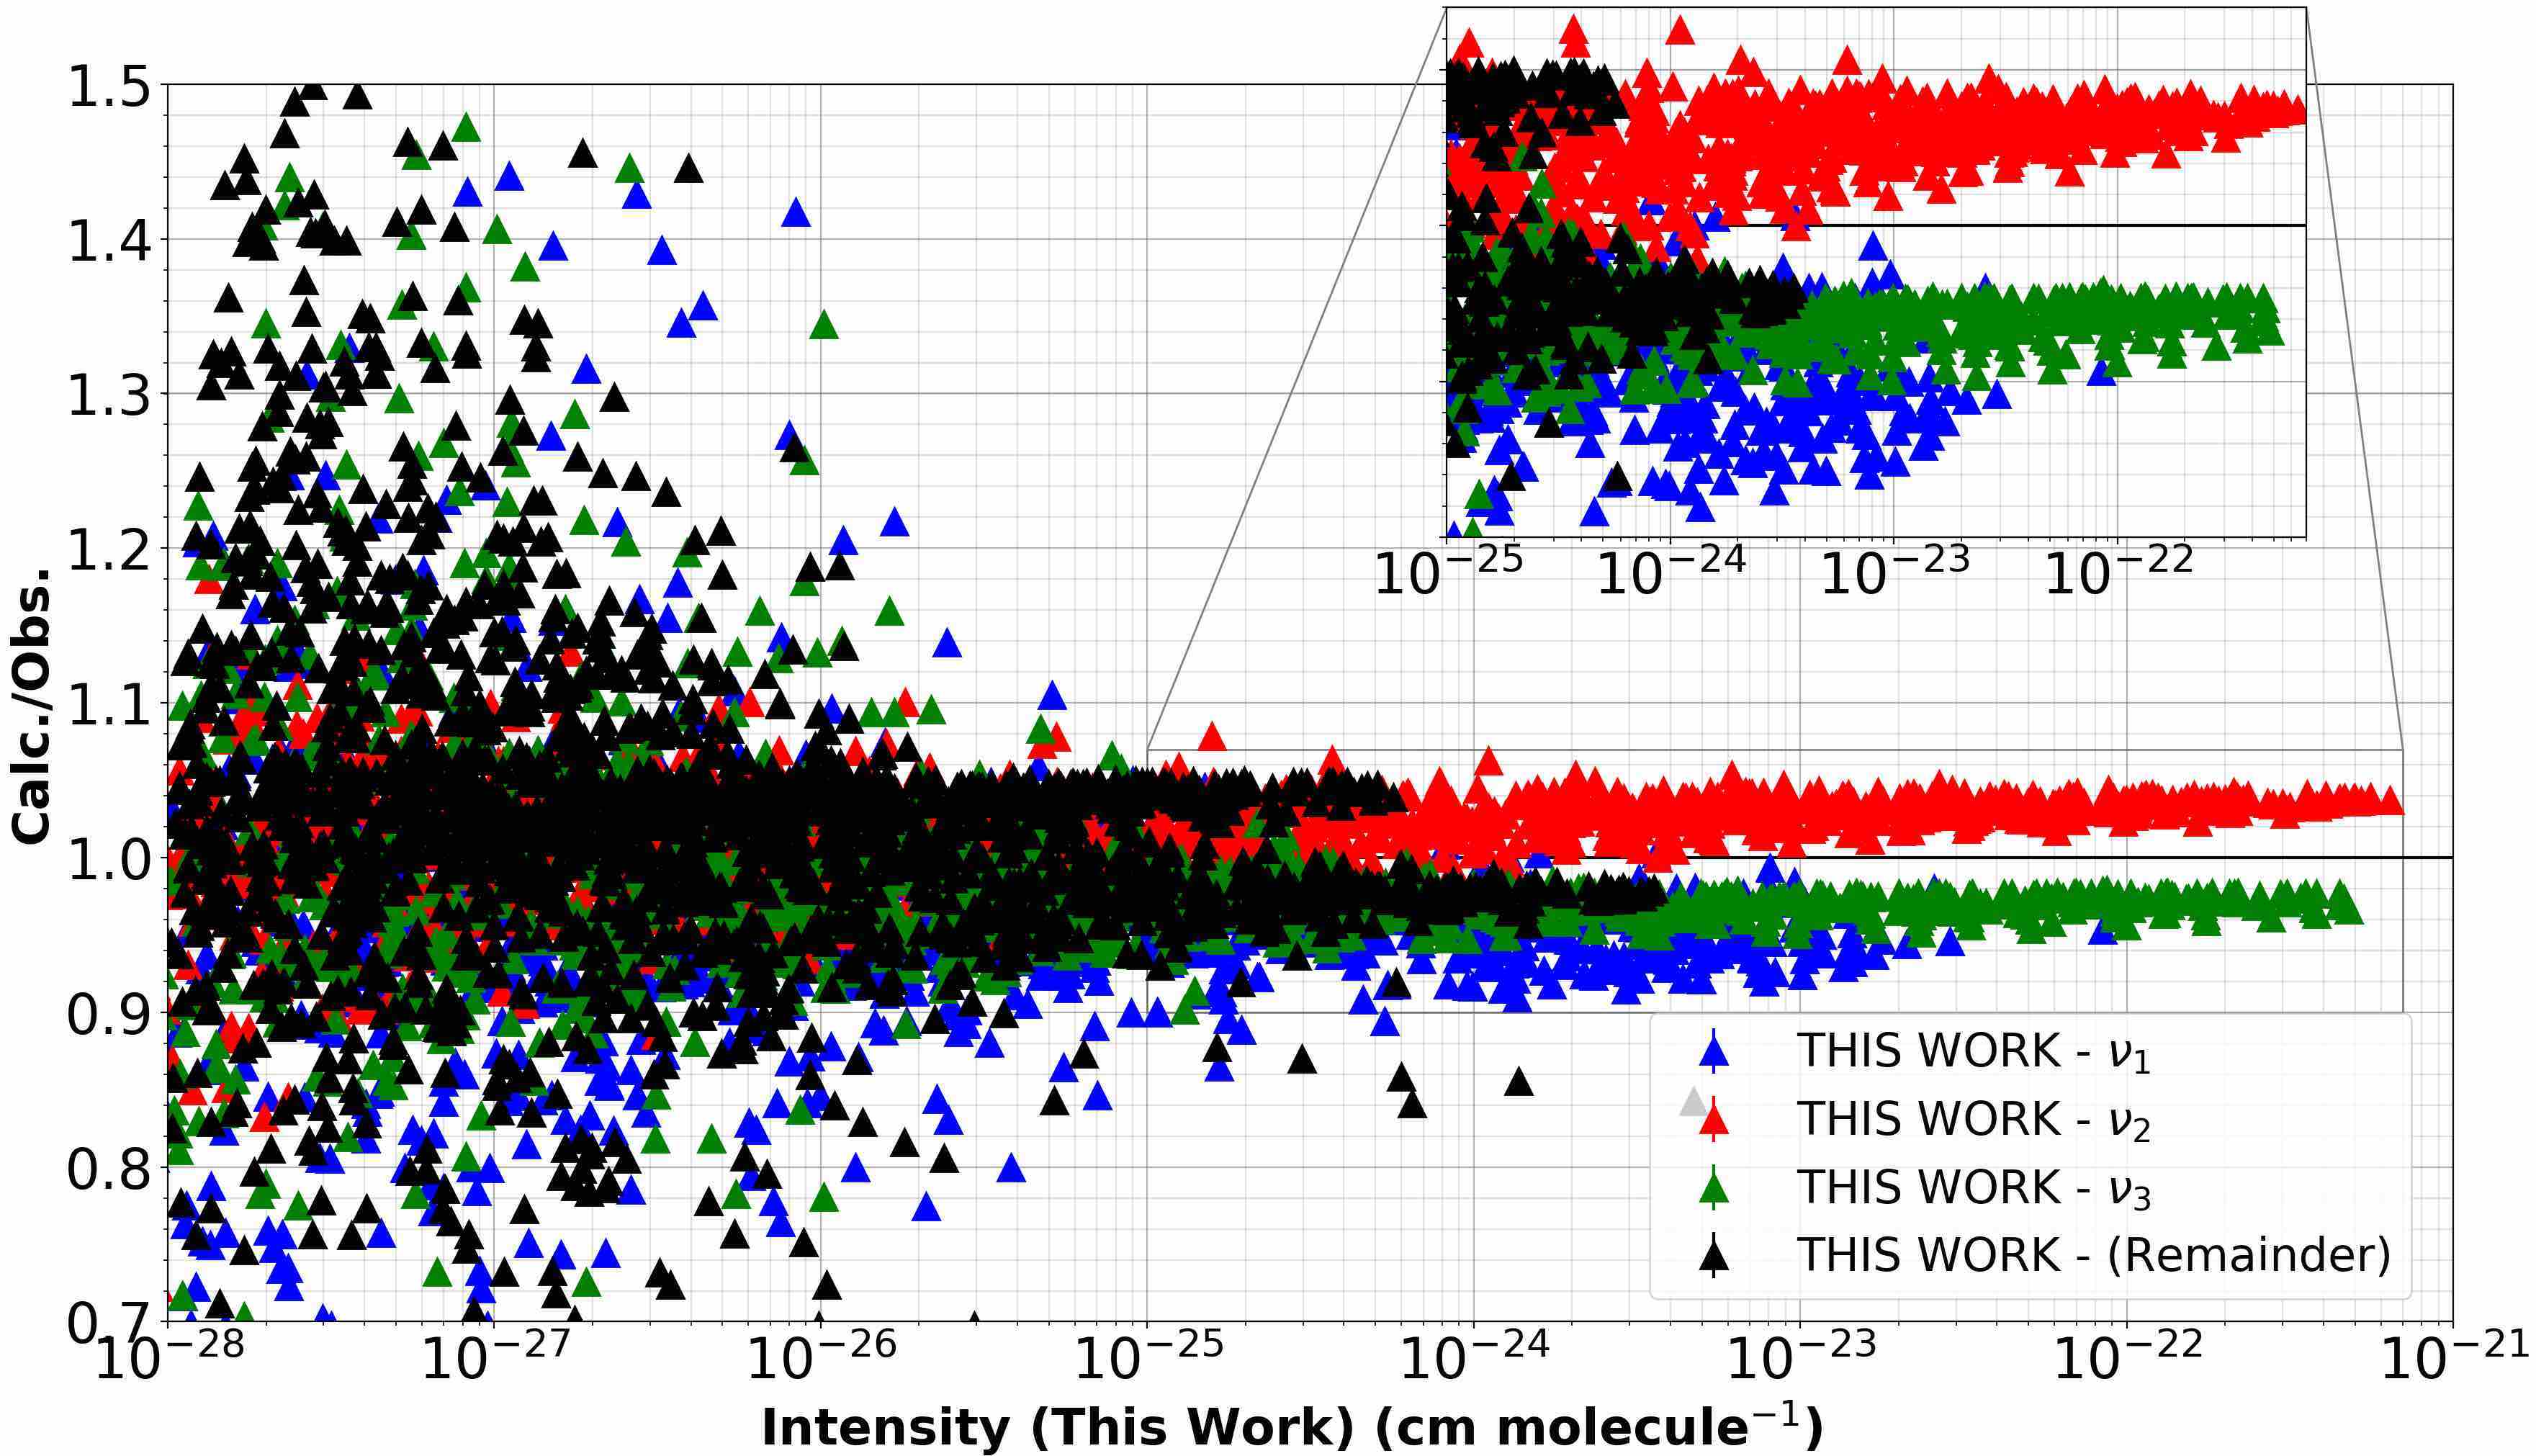
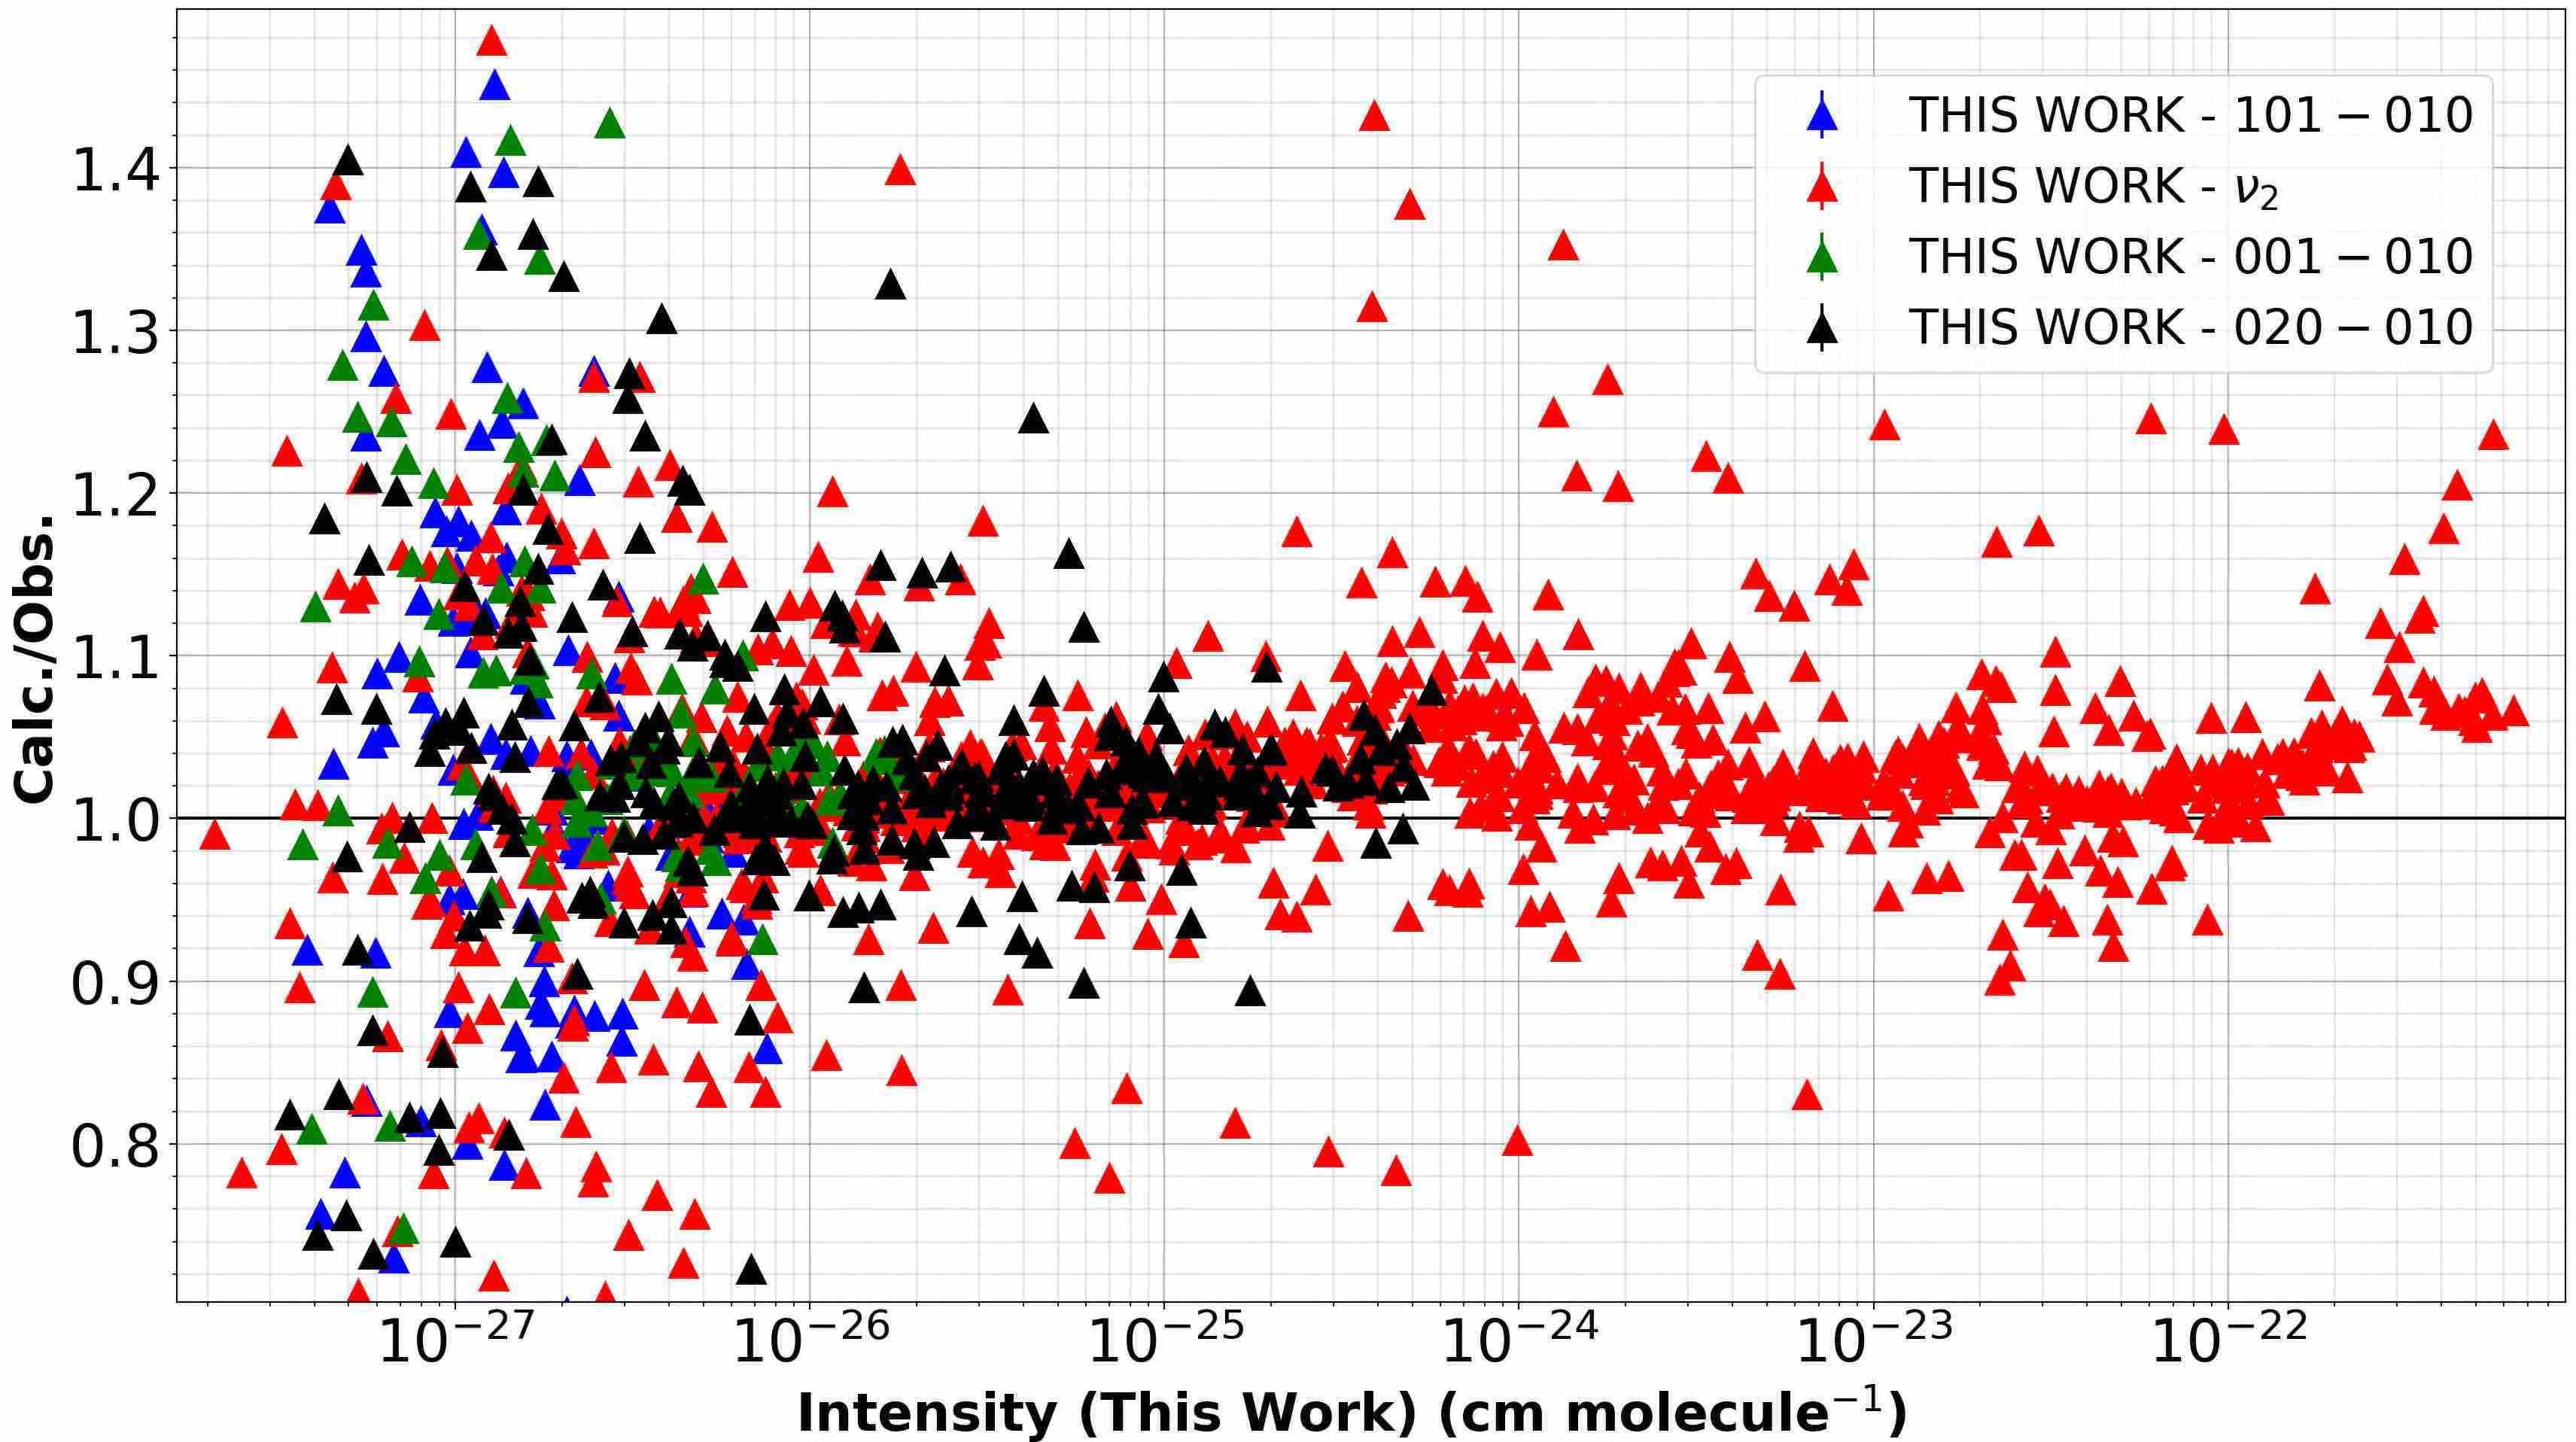
We compare to 11029 semi-empirical intensities taken from Coudert et al., which include , and pure rotational transitions. Many of these calculations form the basis of the microwave and far-infrared region in GEISA2015. For the strongest lines above 10-22 cm molecule-1, the agreement is in general excellent, with the exception of our intensities being approximately 1% stronger, a feature that is replicated through recent experiments, seen below in Figure 3. However, below this threshold, the deviation exhibits a clear rotational dependence. It would appear that this dependence is induced from the work of Coudert et al., as it is not observed in any other of the comparisons below which include the same bands. Such behavior has previously been shown to be the consequence of using effective Hamiltonians to represent intensities [60].
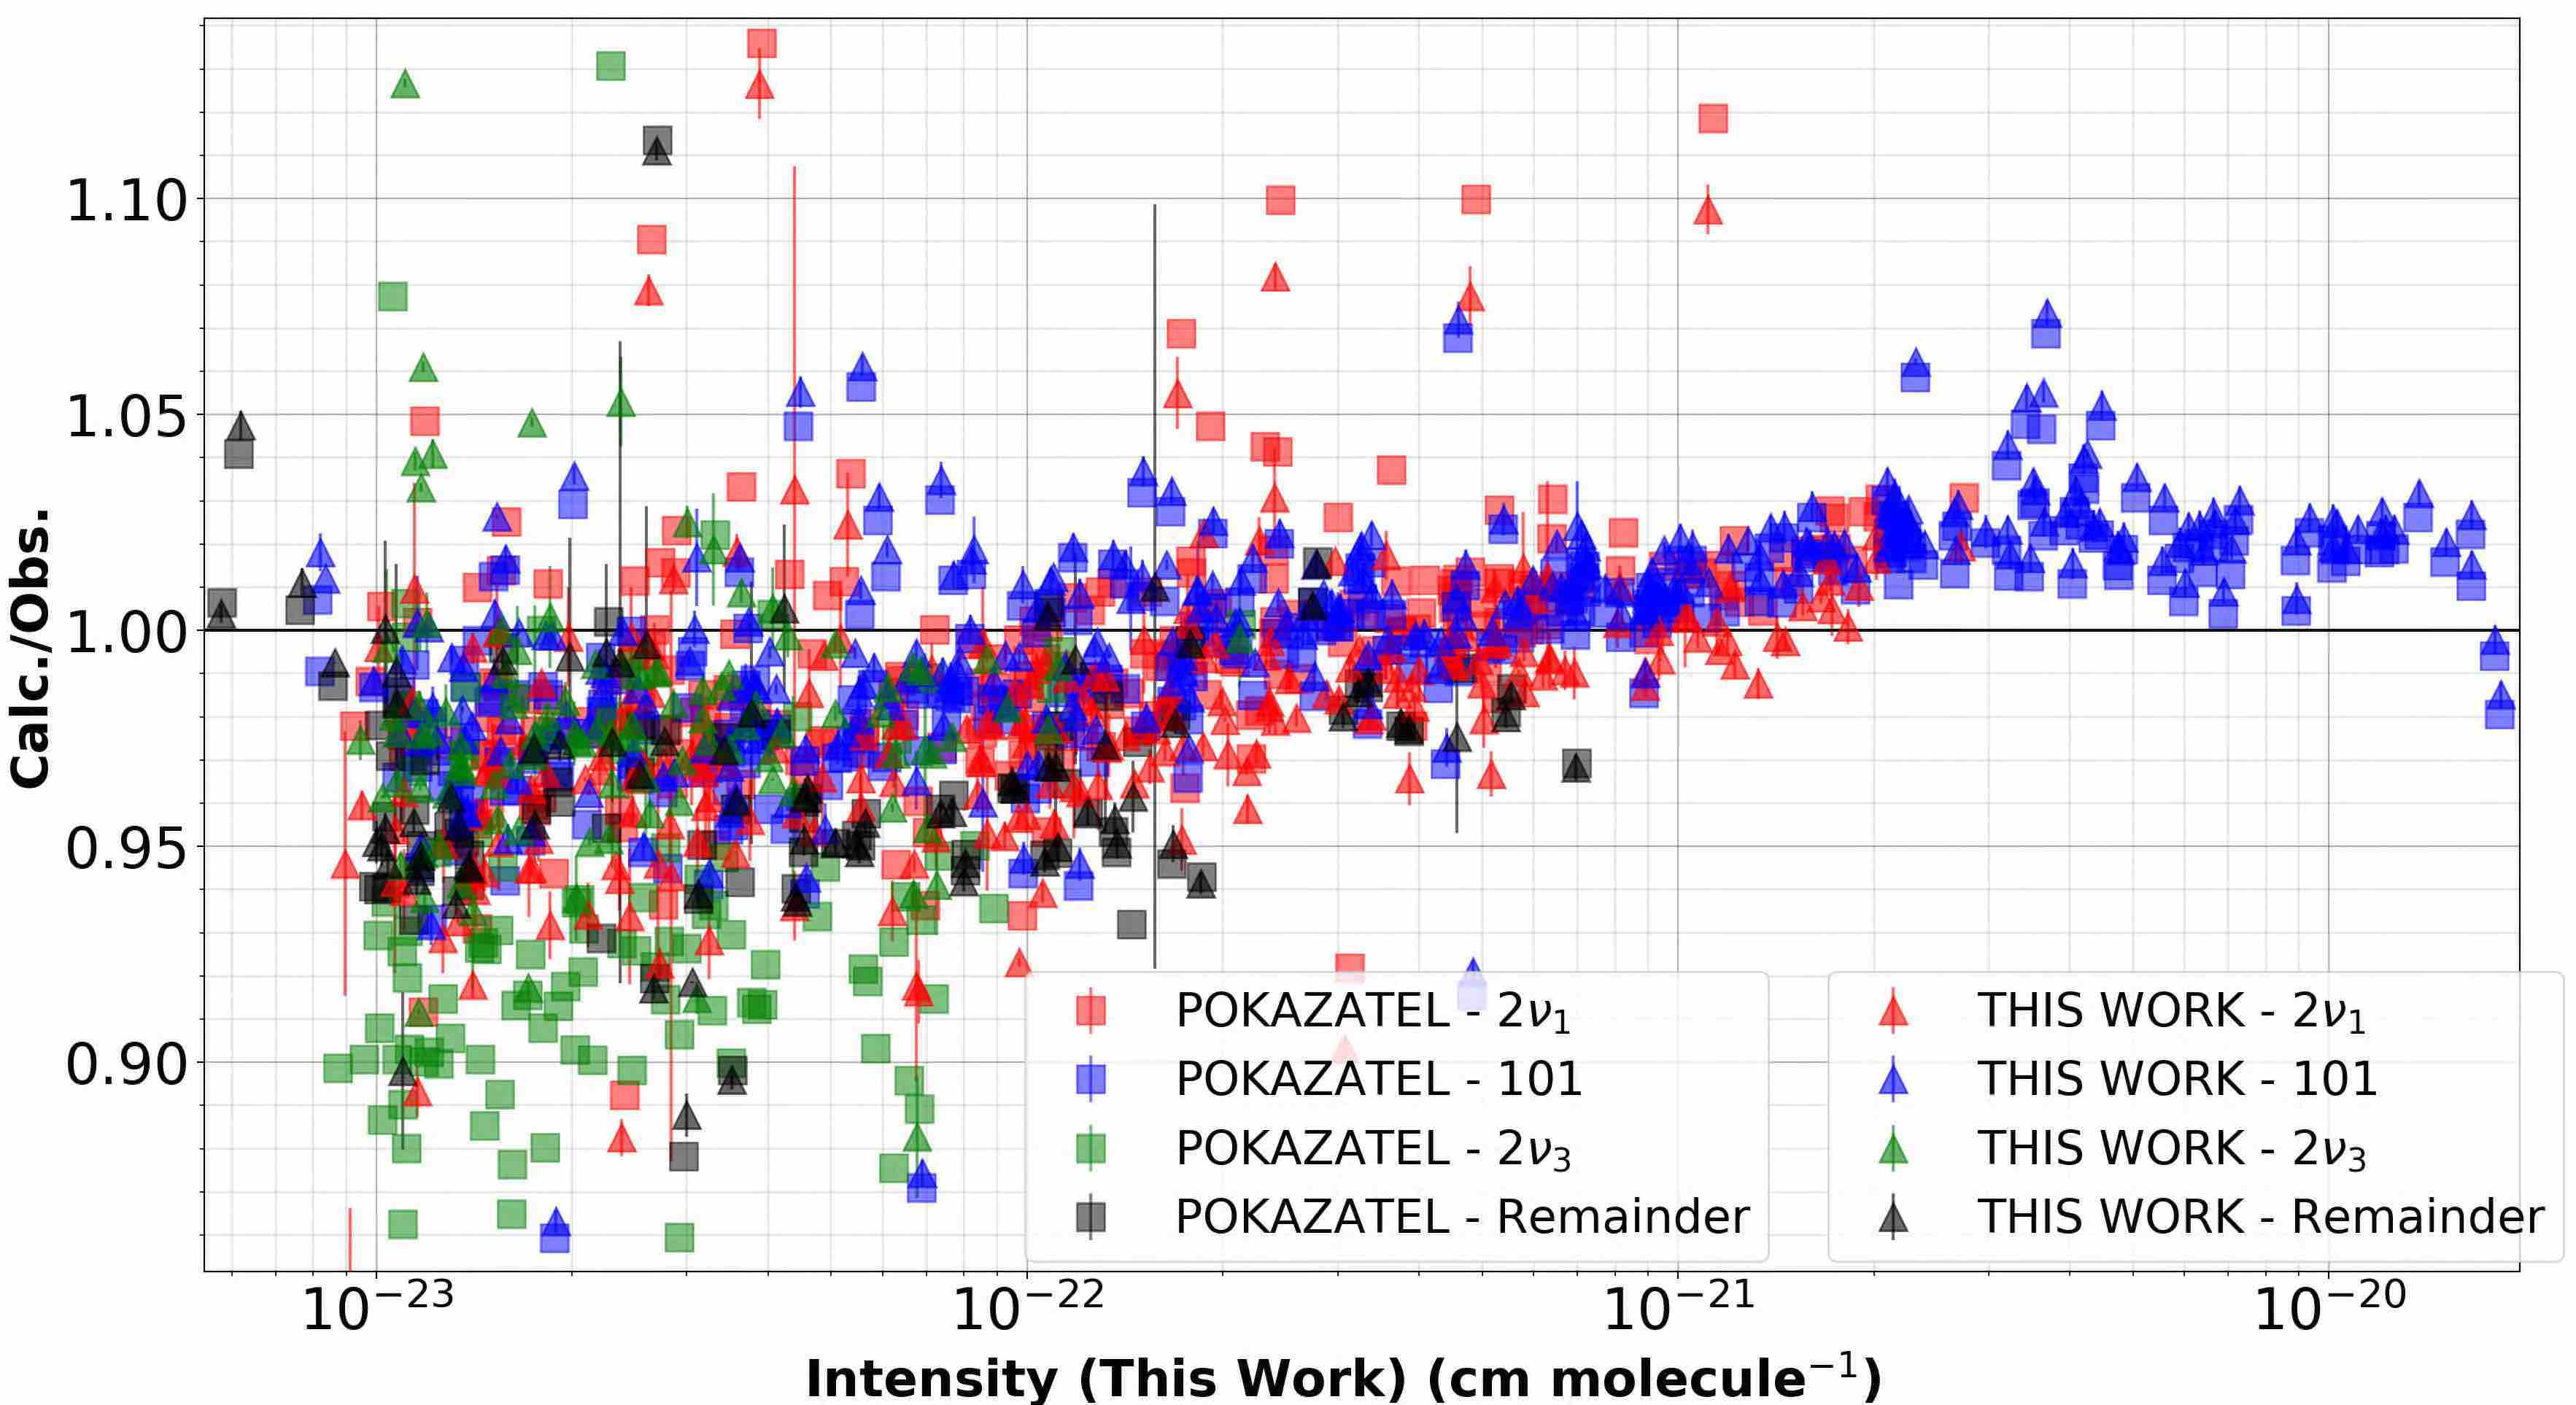
Figure 3(a) compares 4993 transitions provided in the study of Birk et al.[7], which contains measurements from several experiments in the regions of 1250 - 1750 cm-1[34], 1850 - 2280 cm-1[6], 2390 - 4000 cm-1[6] and 4190 - 4340 cm-1[35]. The agreement is within an average of 1-2% percent for both our line list and POKAZATEL, although only for those transitions that have intensities over 10-23 cm molecule-1; below this threshold, the ratios begin to diverge and line instability begins to increase while the accuracy of the experiment begins to decrease.
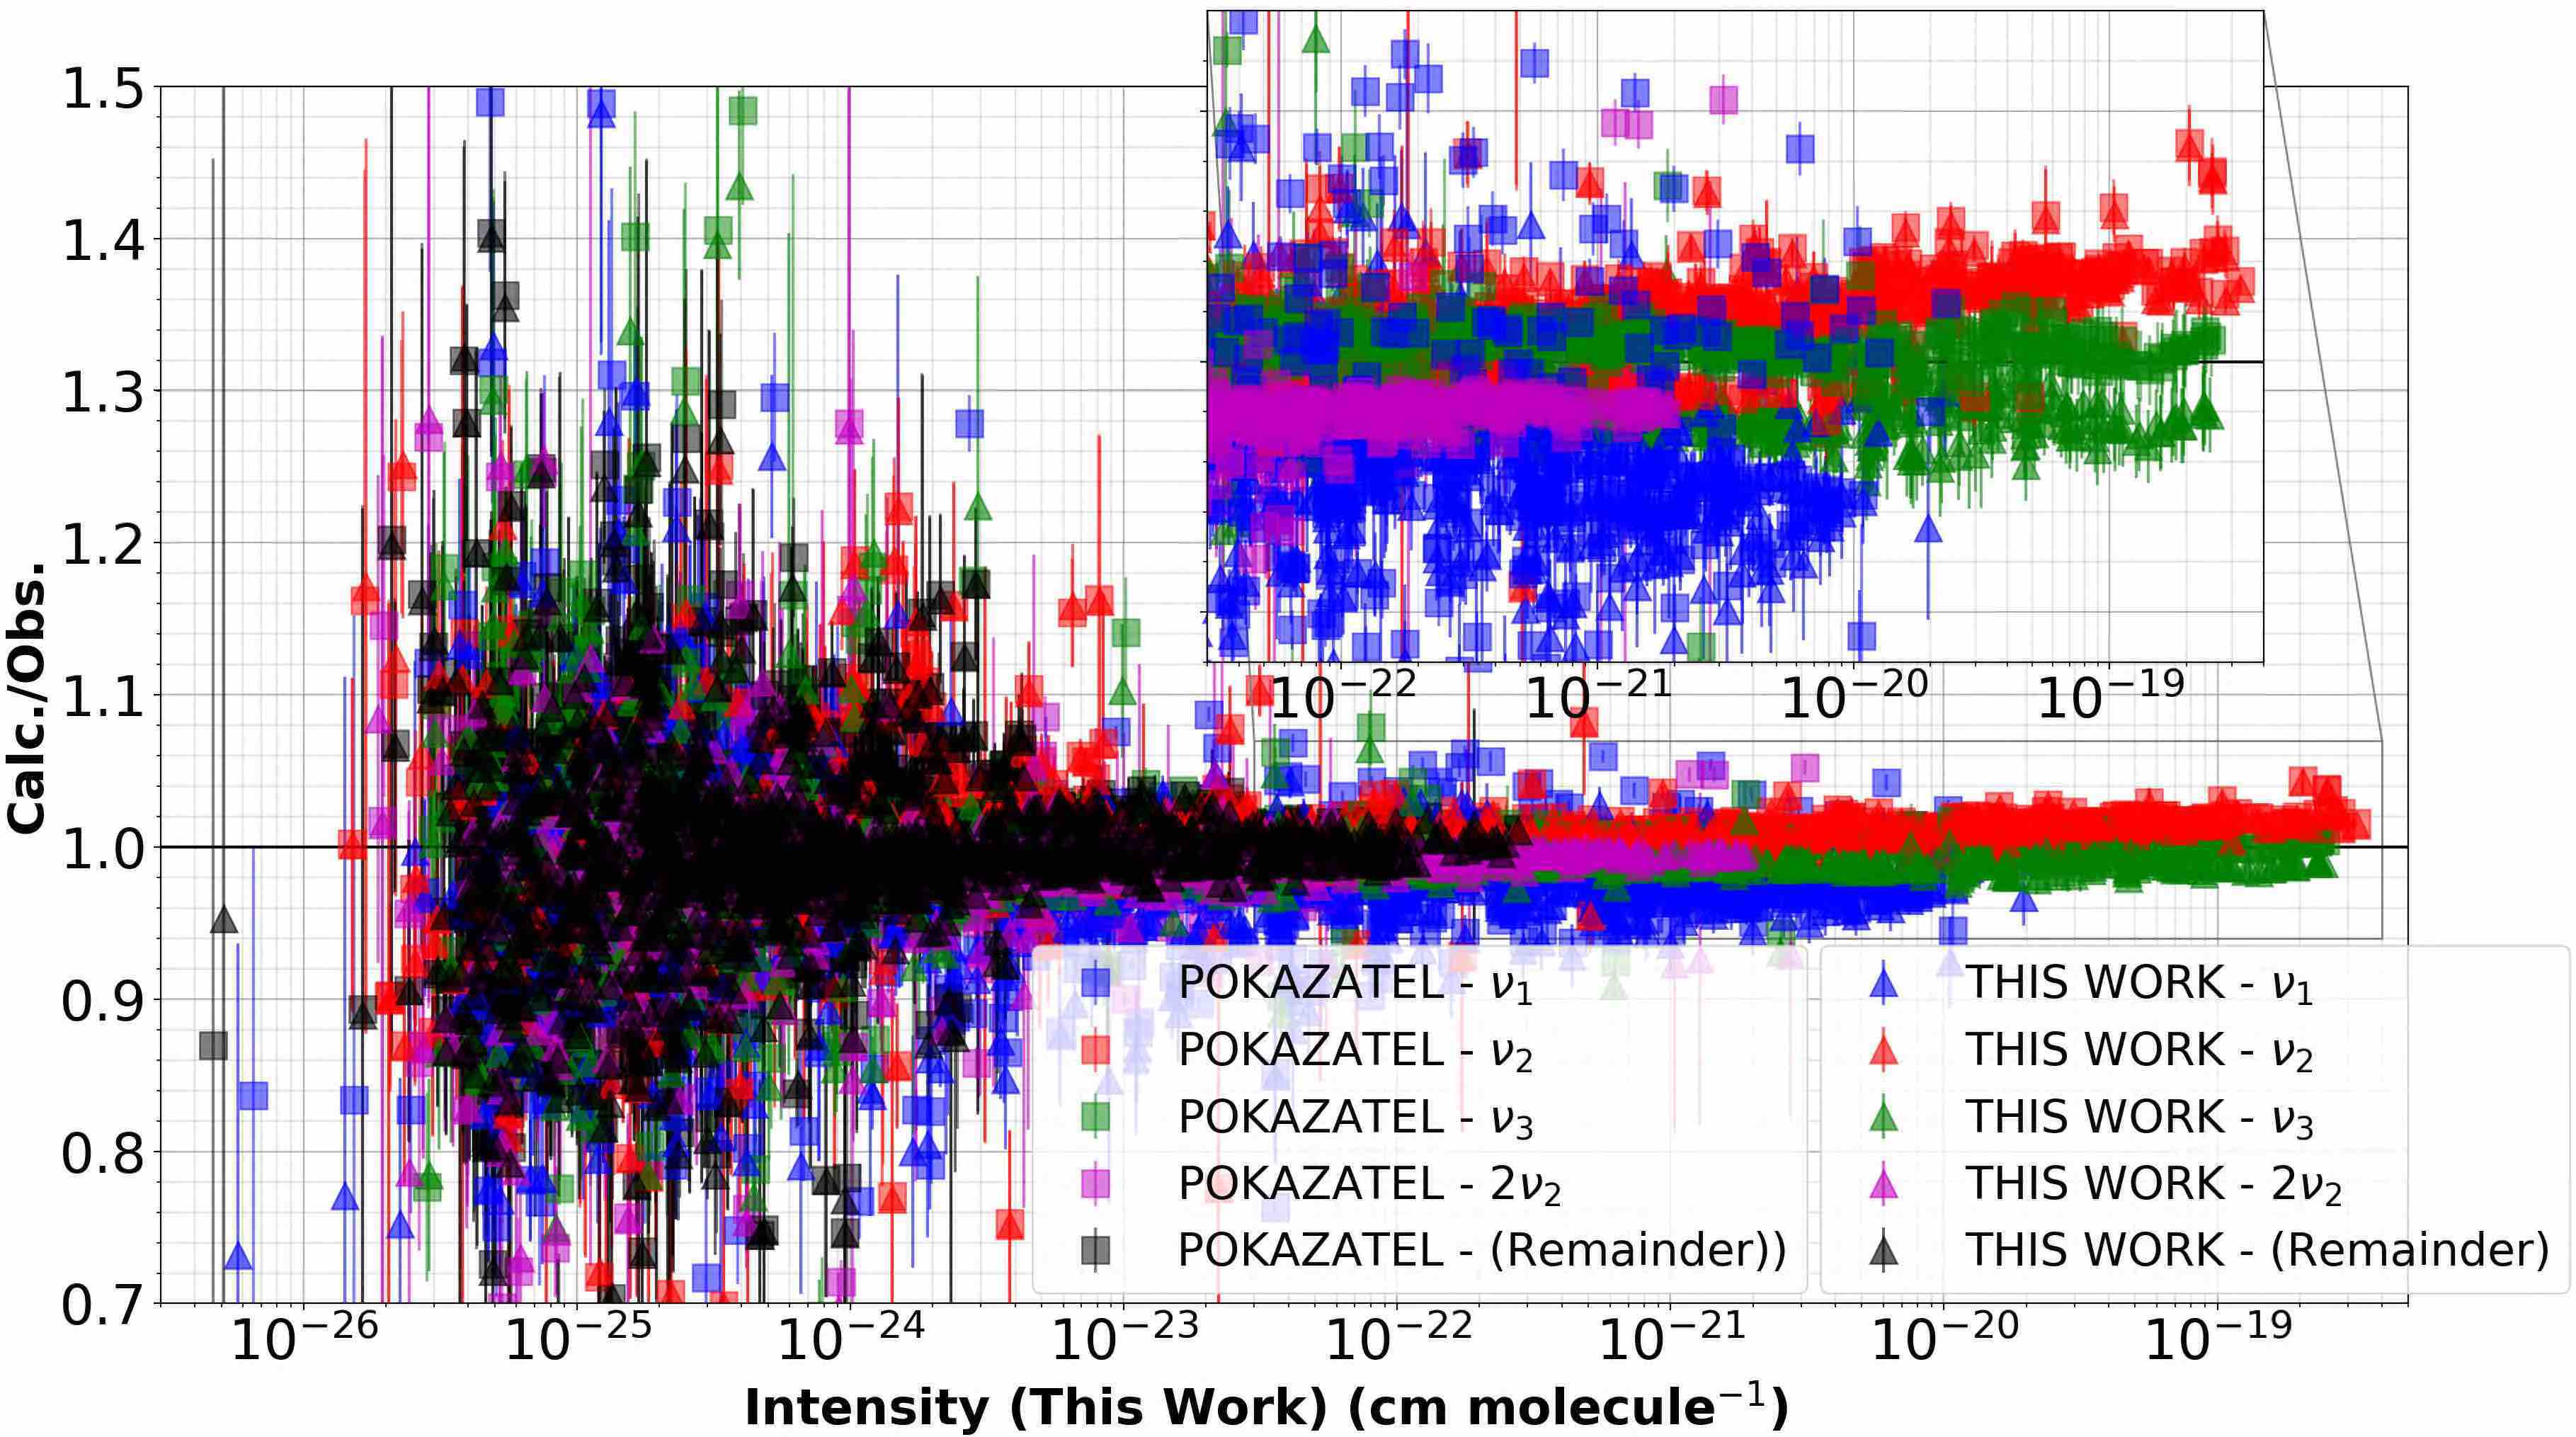
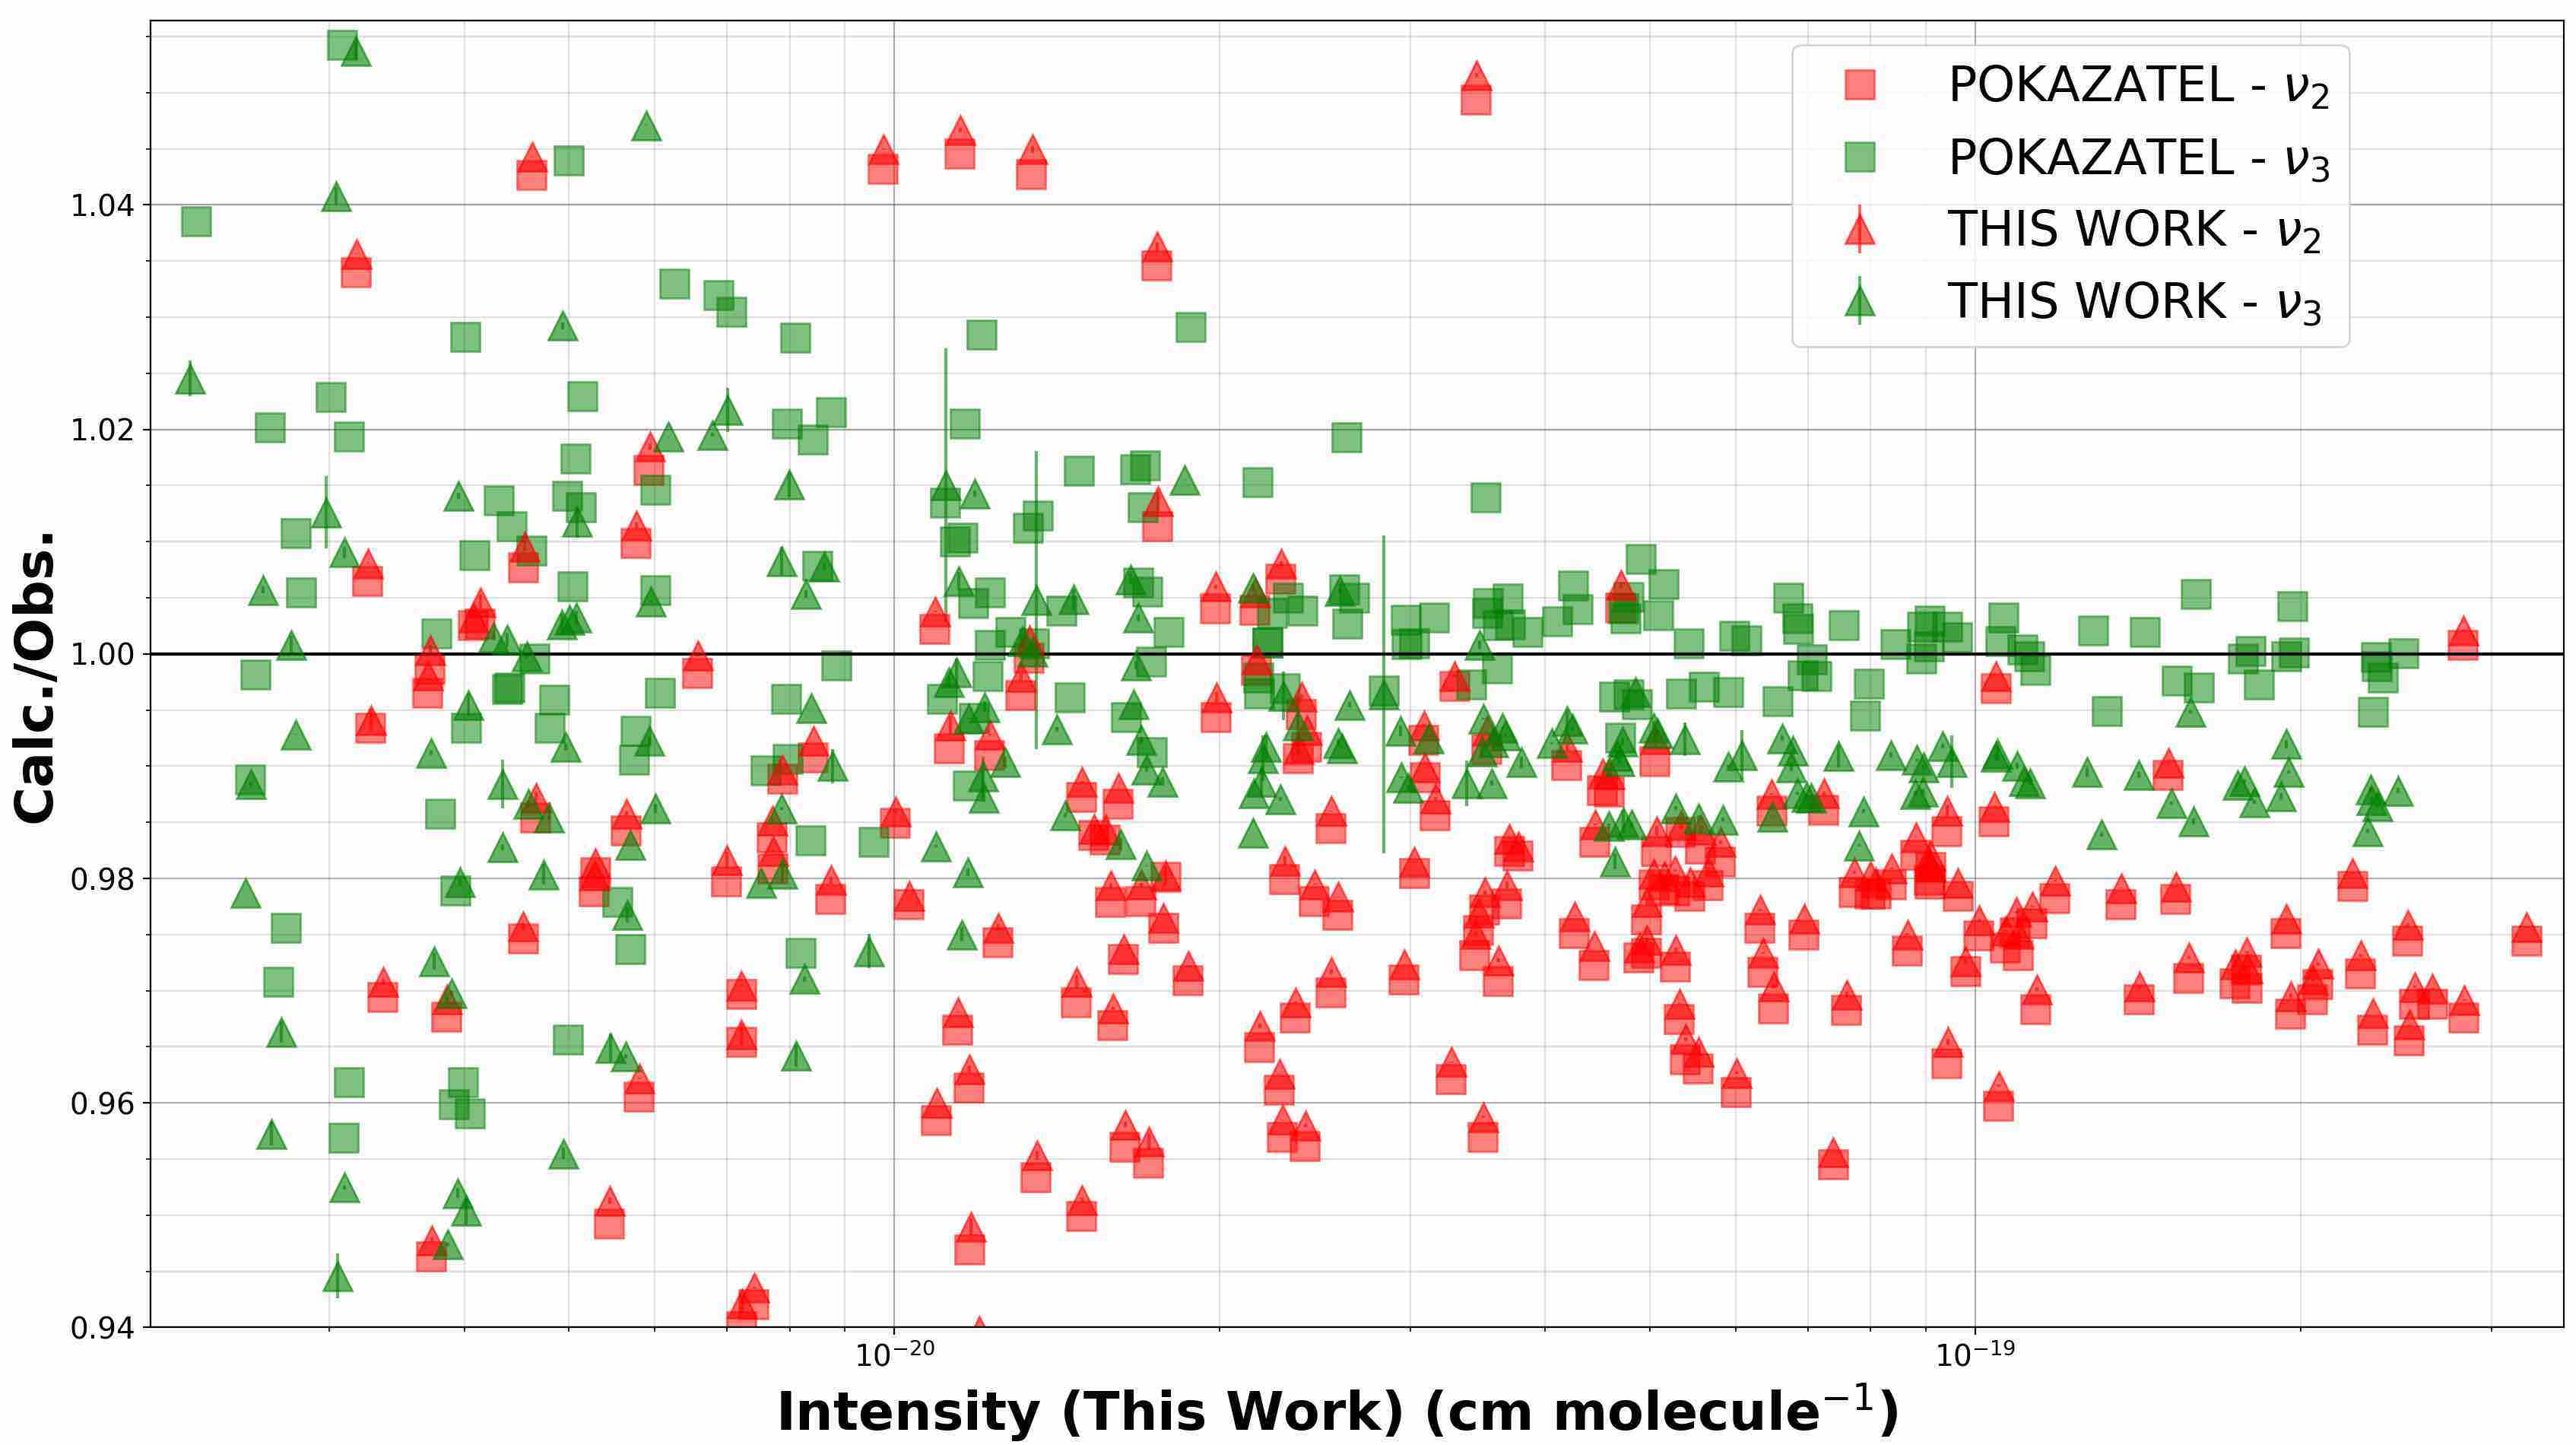
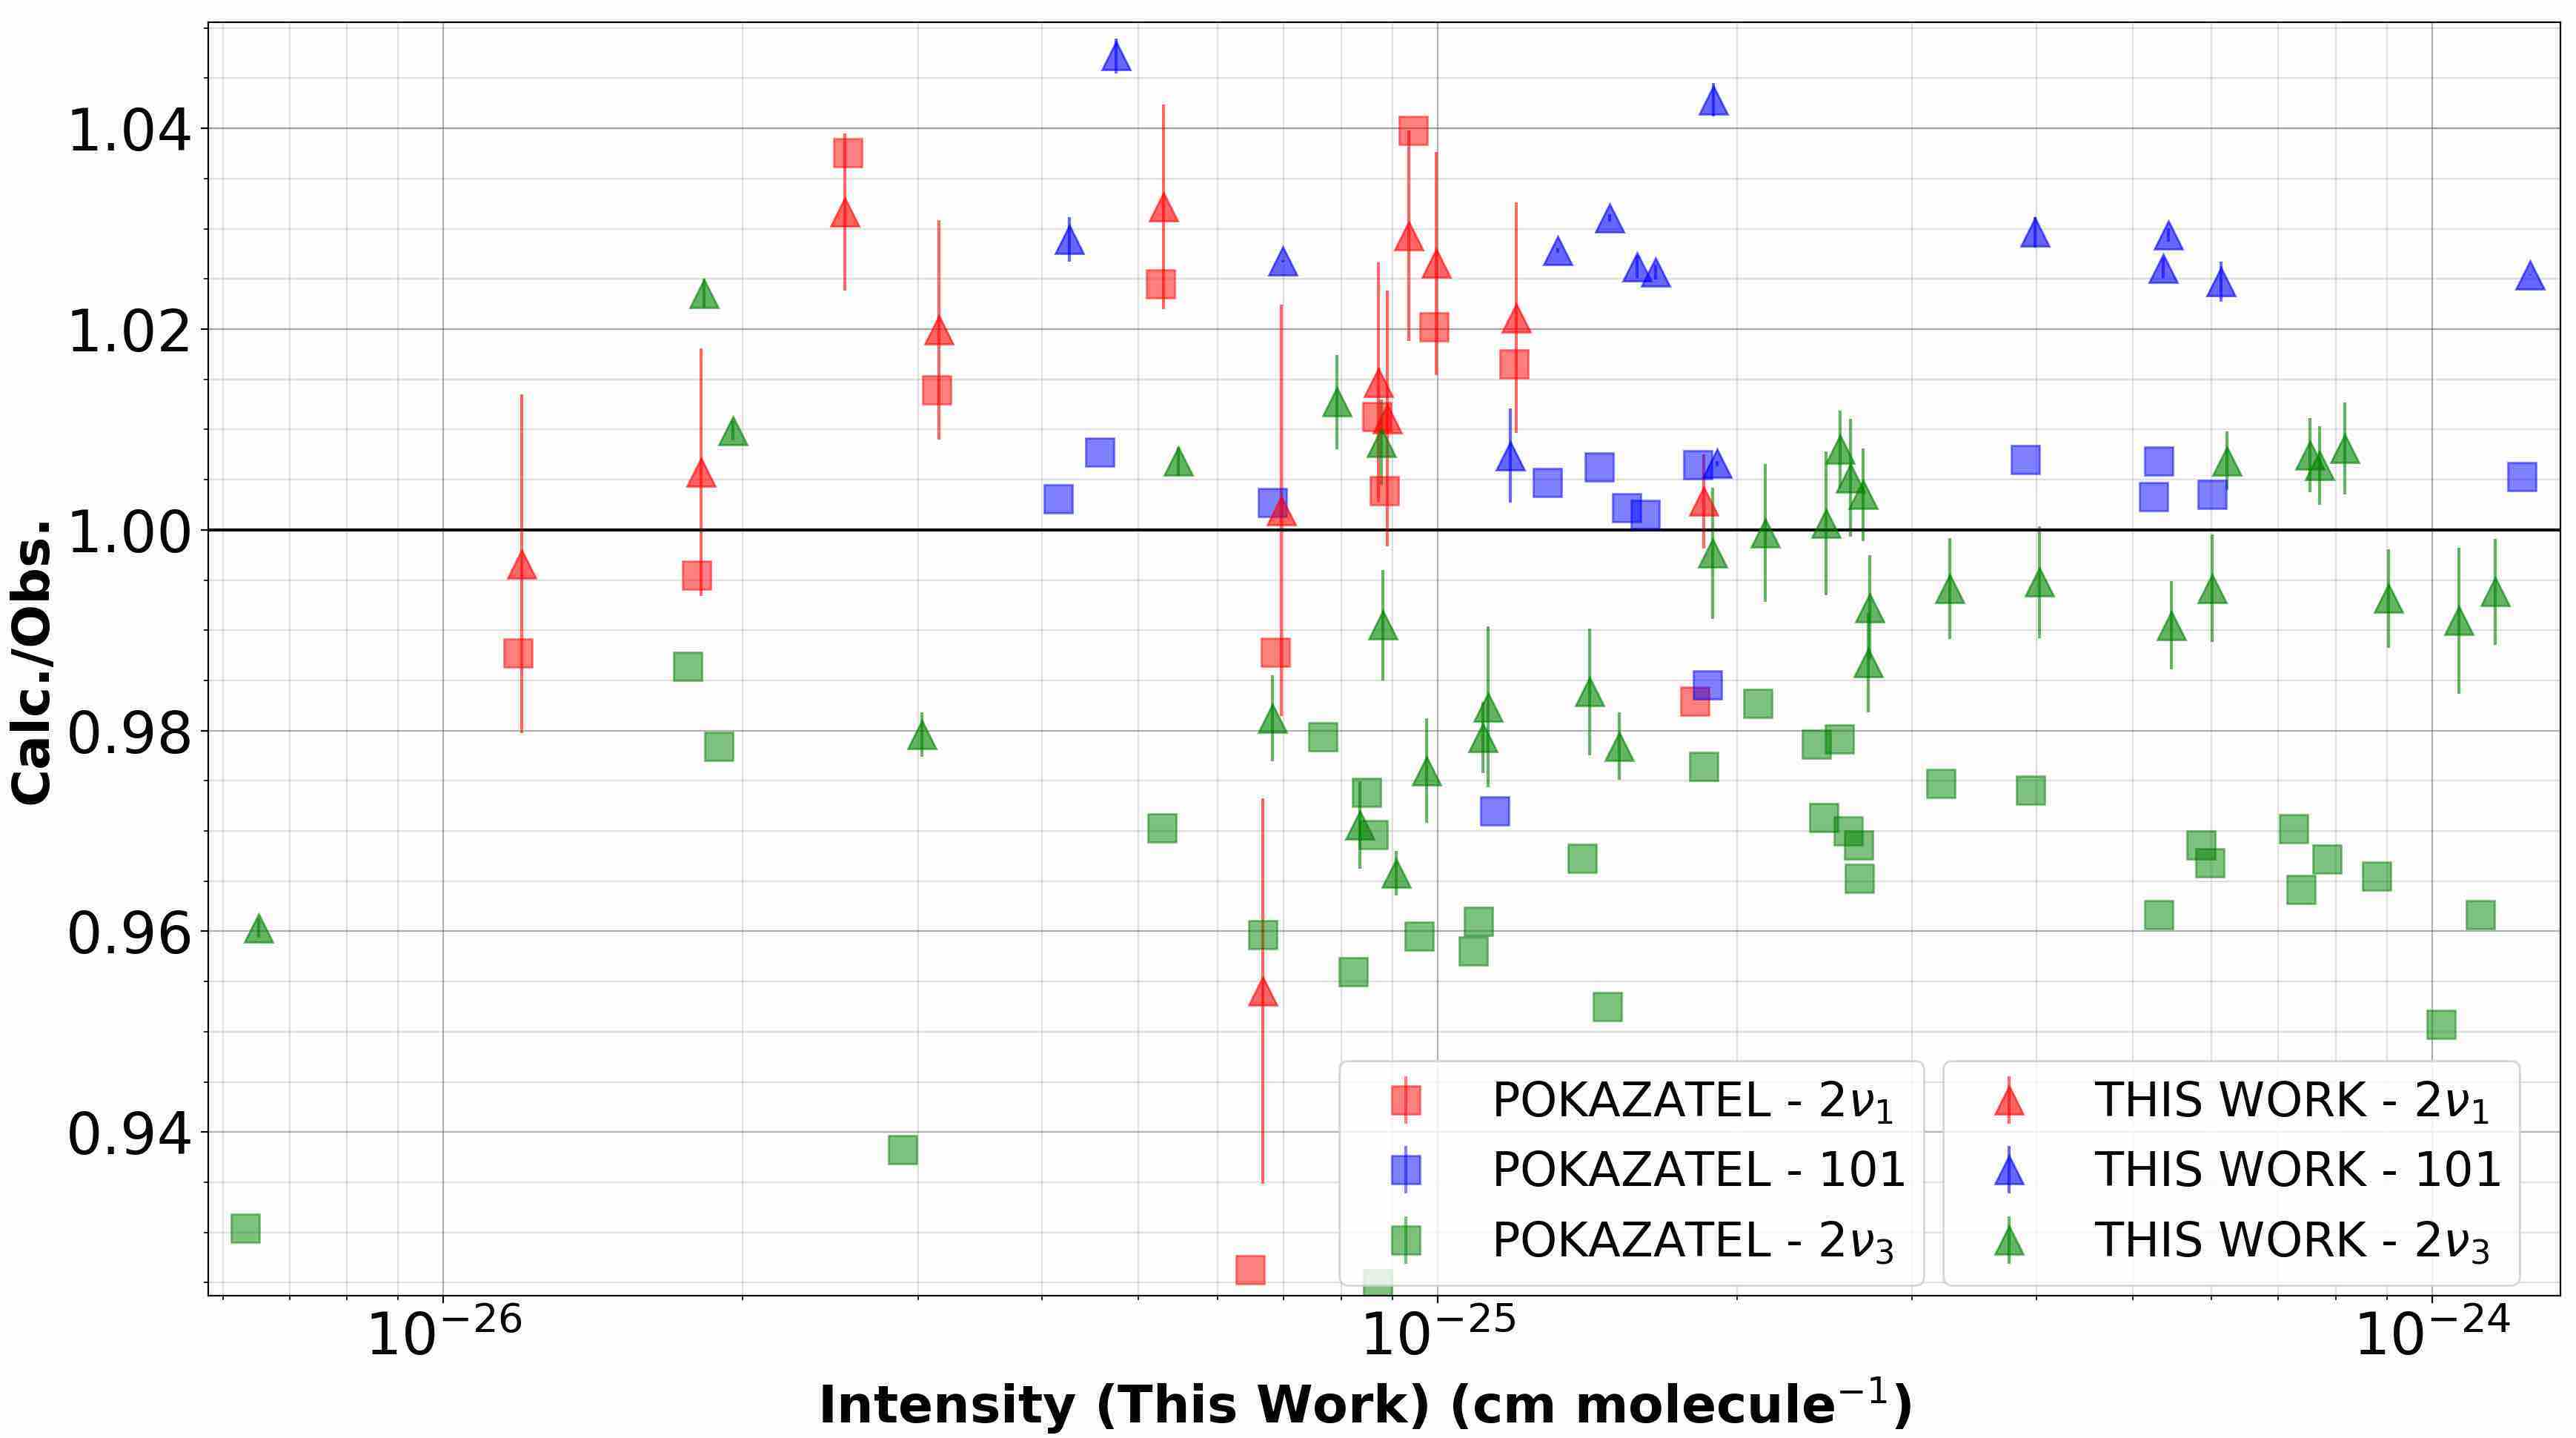
In the same figure, we show a zoomed in region of the strongest transitions. Ratios of and band intensities are in excellent agreement with experiment[6]. For the band, both line lists calculate intensities which are approximately 2-3% too weak, a figure that has already been observed in the study of Birk et al. [7]. The deviation in this band is likely an issue that originates from the underlying ab initio calculations of the dipole surfaces used in this work and POKAZATEL. We continue to investigate this problem. Intensity measurements of the fundamental which were recently made by Devi et al. [61] deviated from those of Loos et al. by 8-10%. Our results verify the experiment of Loos et al.
The experiment of Ptashnik et al. covers regions 1400 - 1840 cm-1 and 3440 - 3970 cm-1. We plot the resulting intensity ratios in Figure 3(b) and this includes 438 data points. The authors converted their results to the customary HITRAN ’.par’ file format and intensities were given an error code of either four or five, i.e 5 - 10% or 10 - 30% respectively. In Figure 3(b), the band shows excellent agreement to POKAZATEL, where ours is weaker by approximately 1%, which is well within experimental uncertainty and is in line with what is obtained from Ref. [6, 34, 35]. However, for the band, both theoretical line lists predict similar intensities again, but are now weaker by 3%. The experimental uncertainty on the data of Ptashnik et al. is likely the cause of such discrepancy.
Comparing to the HITRAN2016 database, we match to 793 transitions that originate from the work of Toth et al.[3], see Figure 4(a). In the Toth et al. H2O line list, available through the NASA JPL website;
http://mark4sun.jpl.nasa.gov/h2o.html. Reported intensities are a combination of experimental measurements and semi-empirical calculations obtained from fitting a model to observation. The region we compare to in HITRAN2016 contains Toth et al. measured intensities, not semi-empirical calculations. In general, the agreement to Toth et al. using our line list and POKAZATEL for the strongest lines is good, with deviations averaging approximately 1-2% and is within the 5% experimental uncertainty. There does appear to be an un-physical shape to the ratios shown in Figure 4(a), which is associated with the bands (101) and (200), and is unlikely to arise from theory.
Lisak, Havey and Hodges [8] measured intensities of bands (101), (200) and (002) in the narrow wavelength of 7170 - 7183 cm-1 to sub-percent accuracy. Both ab initio line lists are in excellent agreement with the fourteen lines from [8] present in HITRAN2016. We chose to omit this figure as there are only a few data points.
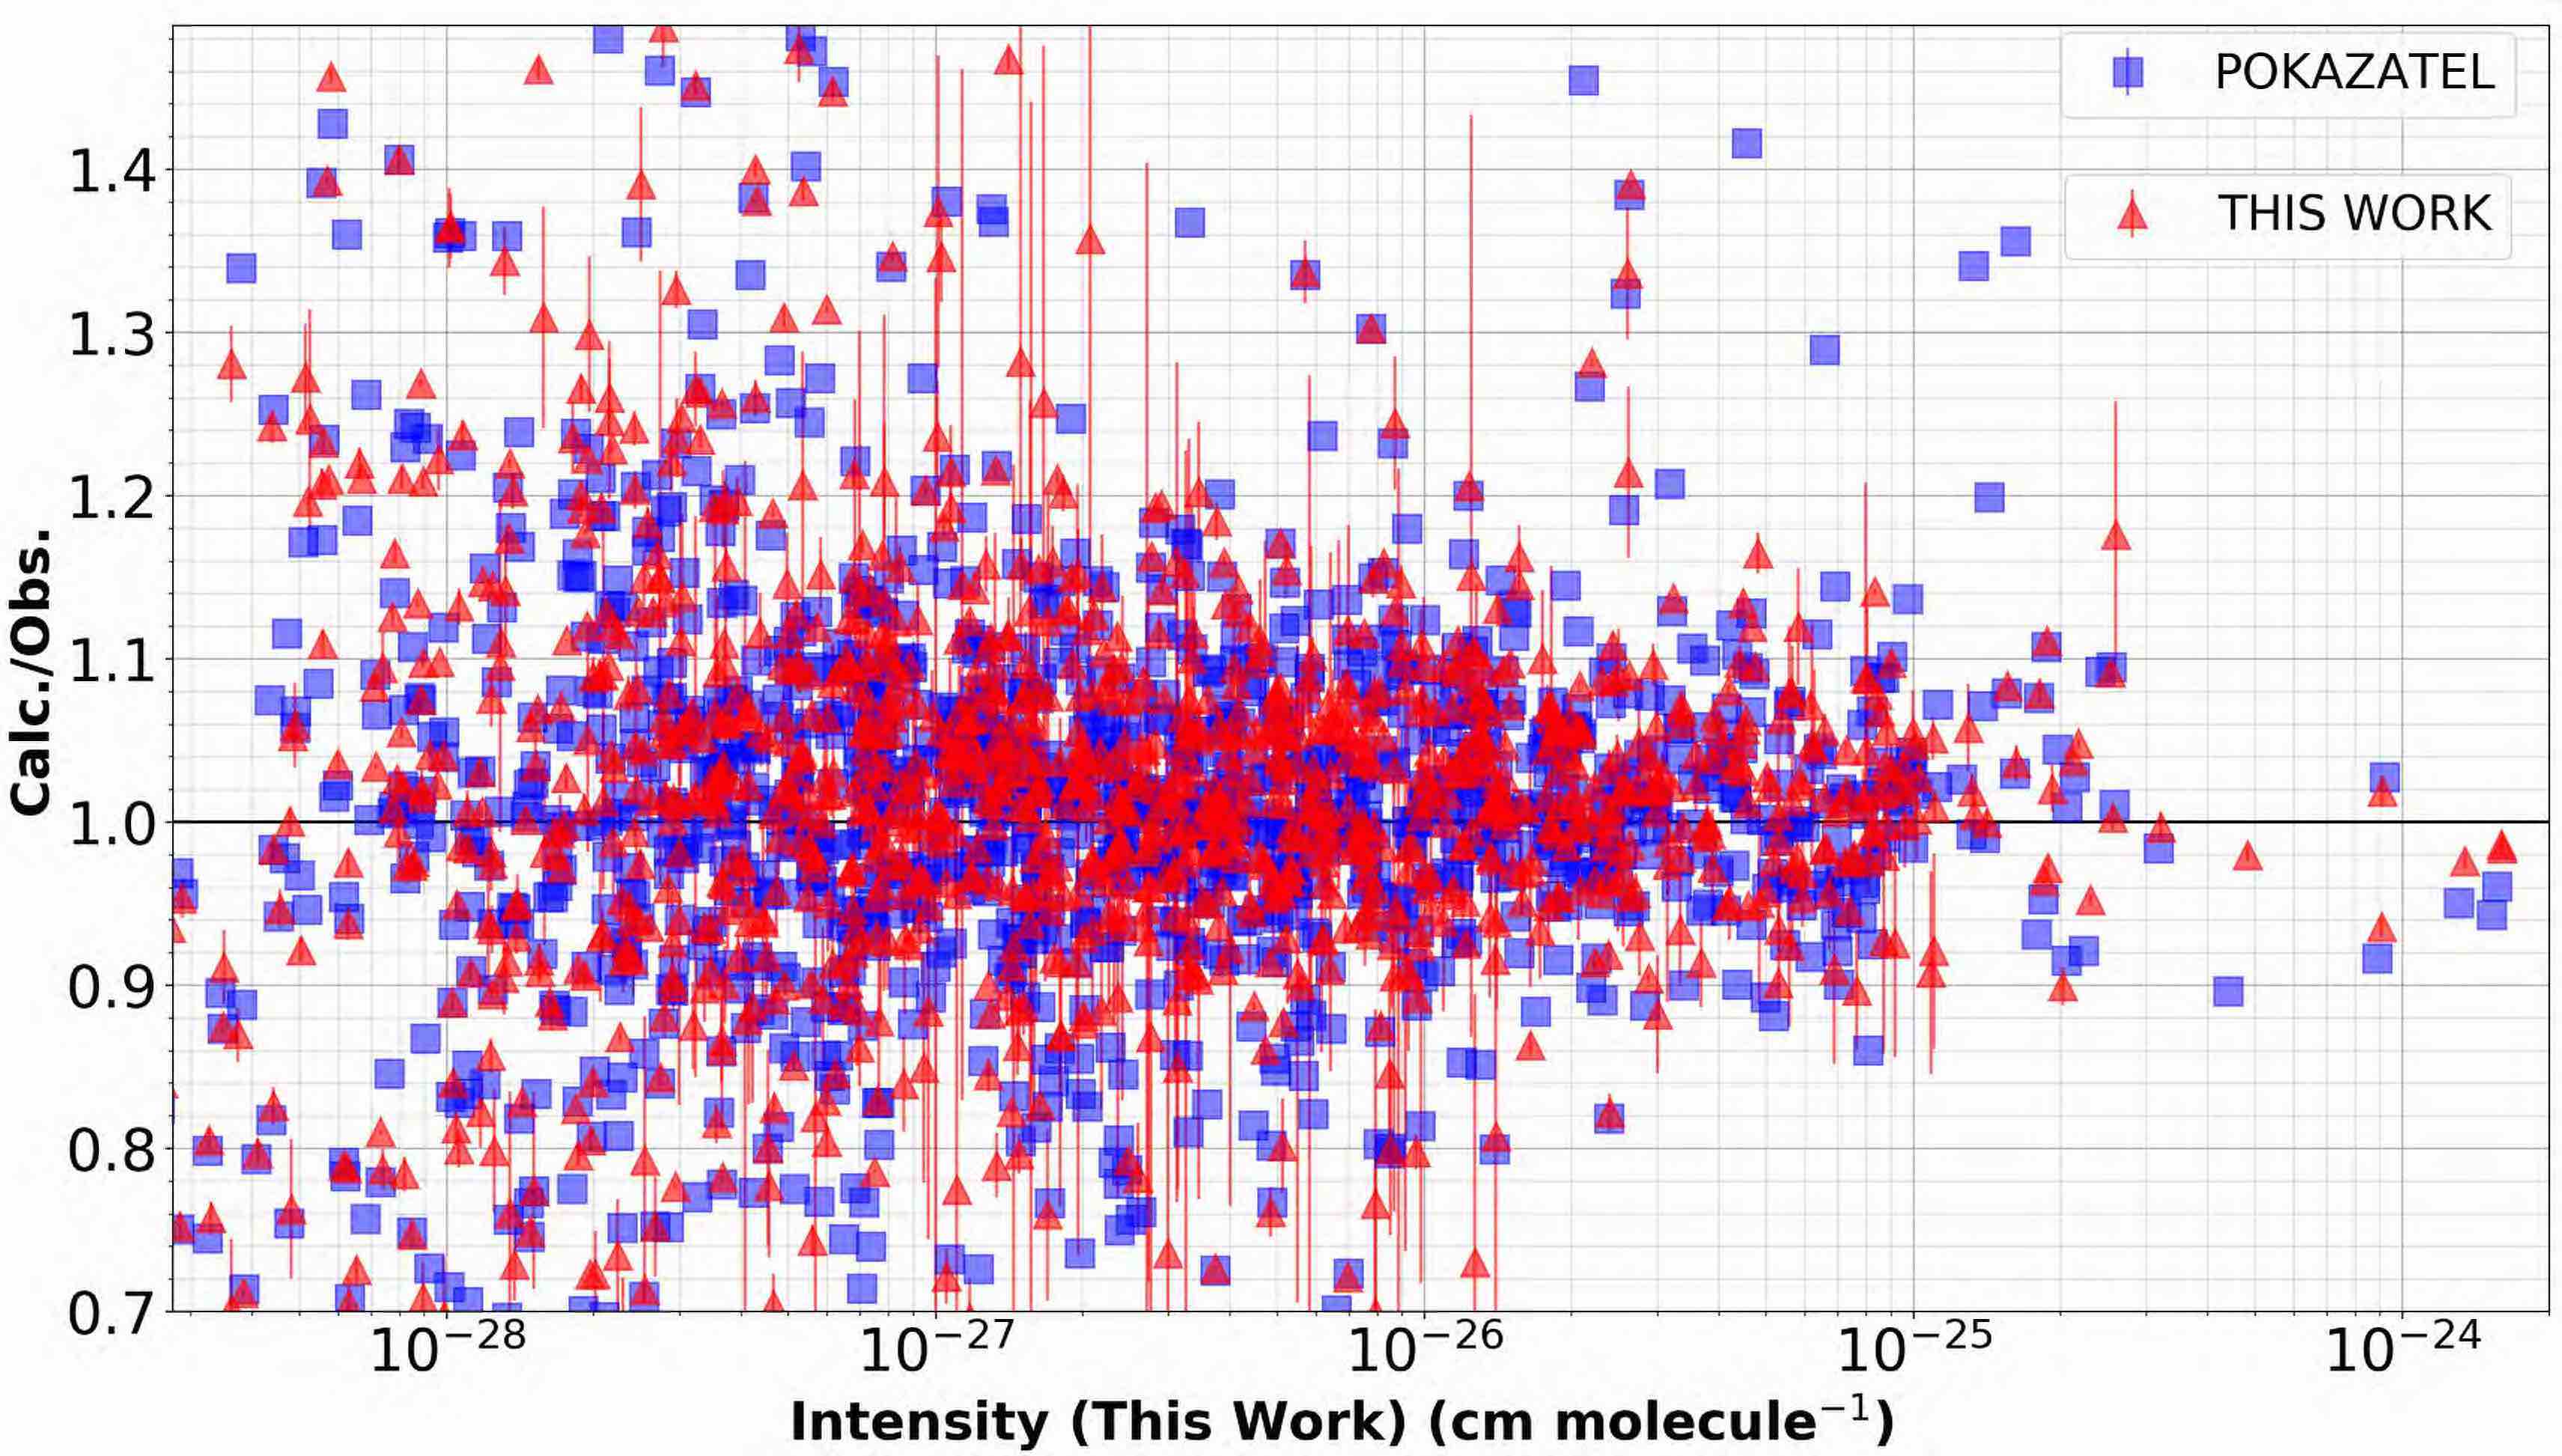
Mikhailenko et al. [9] measured a large number of weak intensities in the 7408 cm-1 - 7919 cm-1 window. When comparing to HITRAN2016, we matched to a total of 1227 transitions, with resulting intensity ratios presented in Figure 5(a). Of the two line lists, ours and POKAZATEL, neither shows better agreement to Mikhailenko et al. than the other; both theoretical models have scattered ratios throughout.
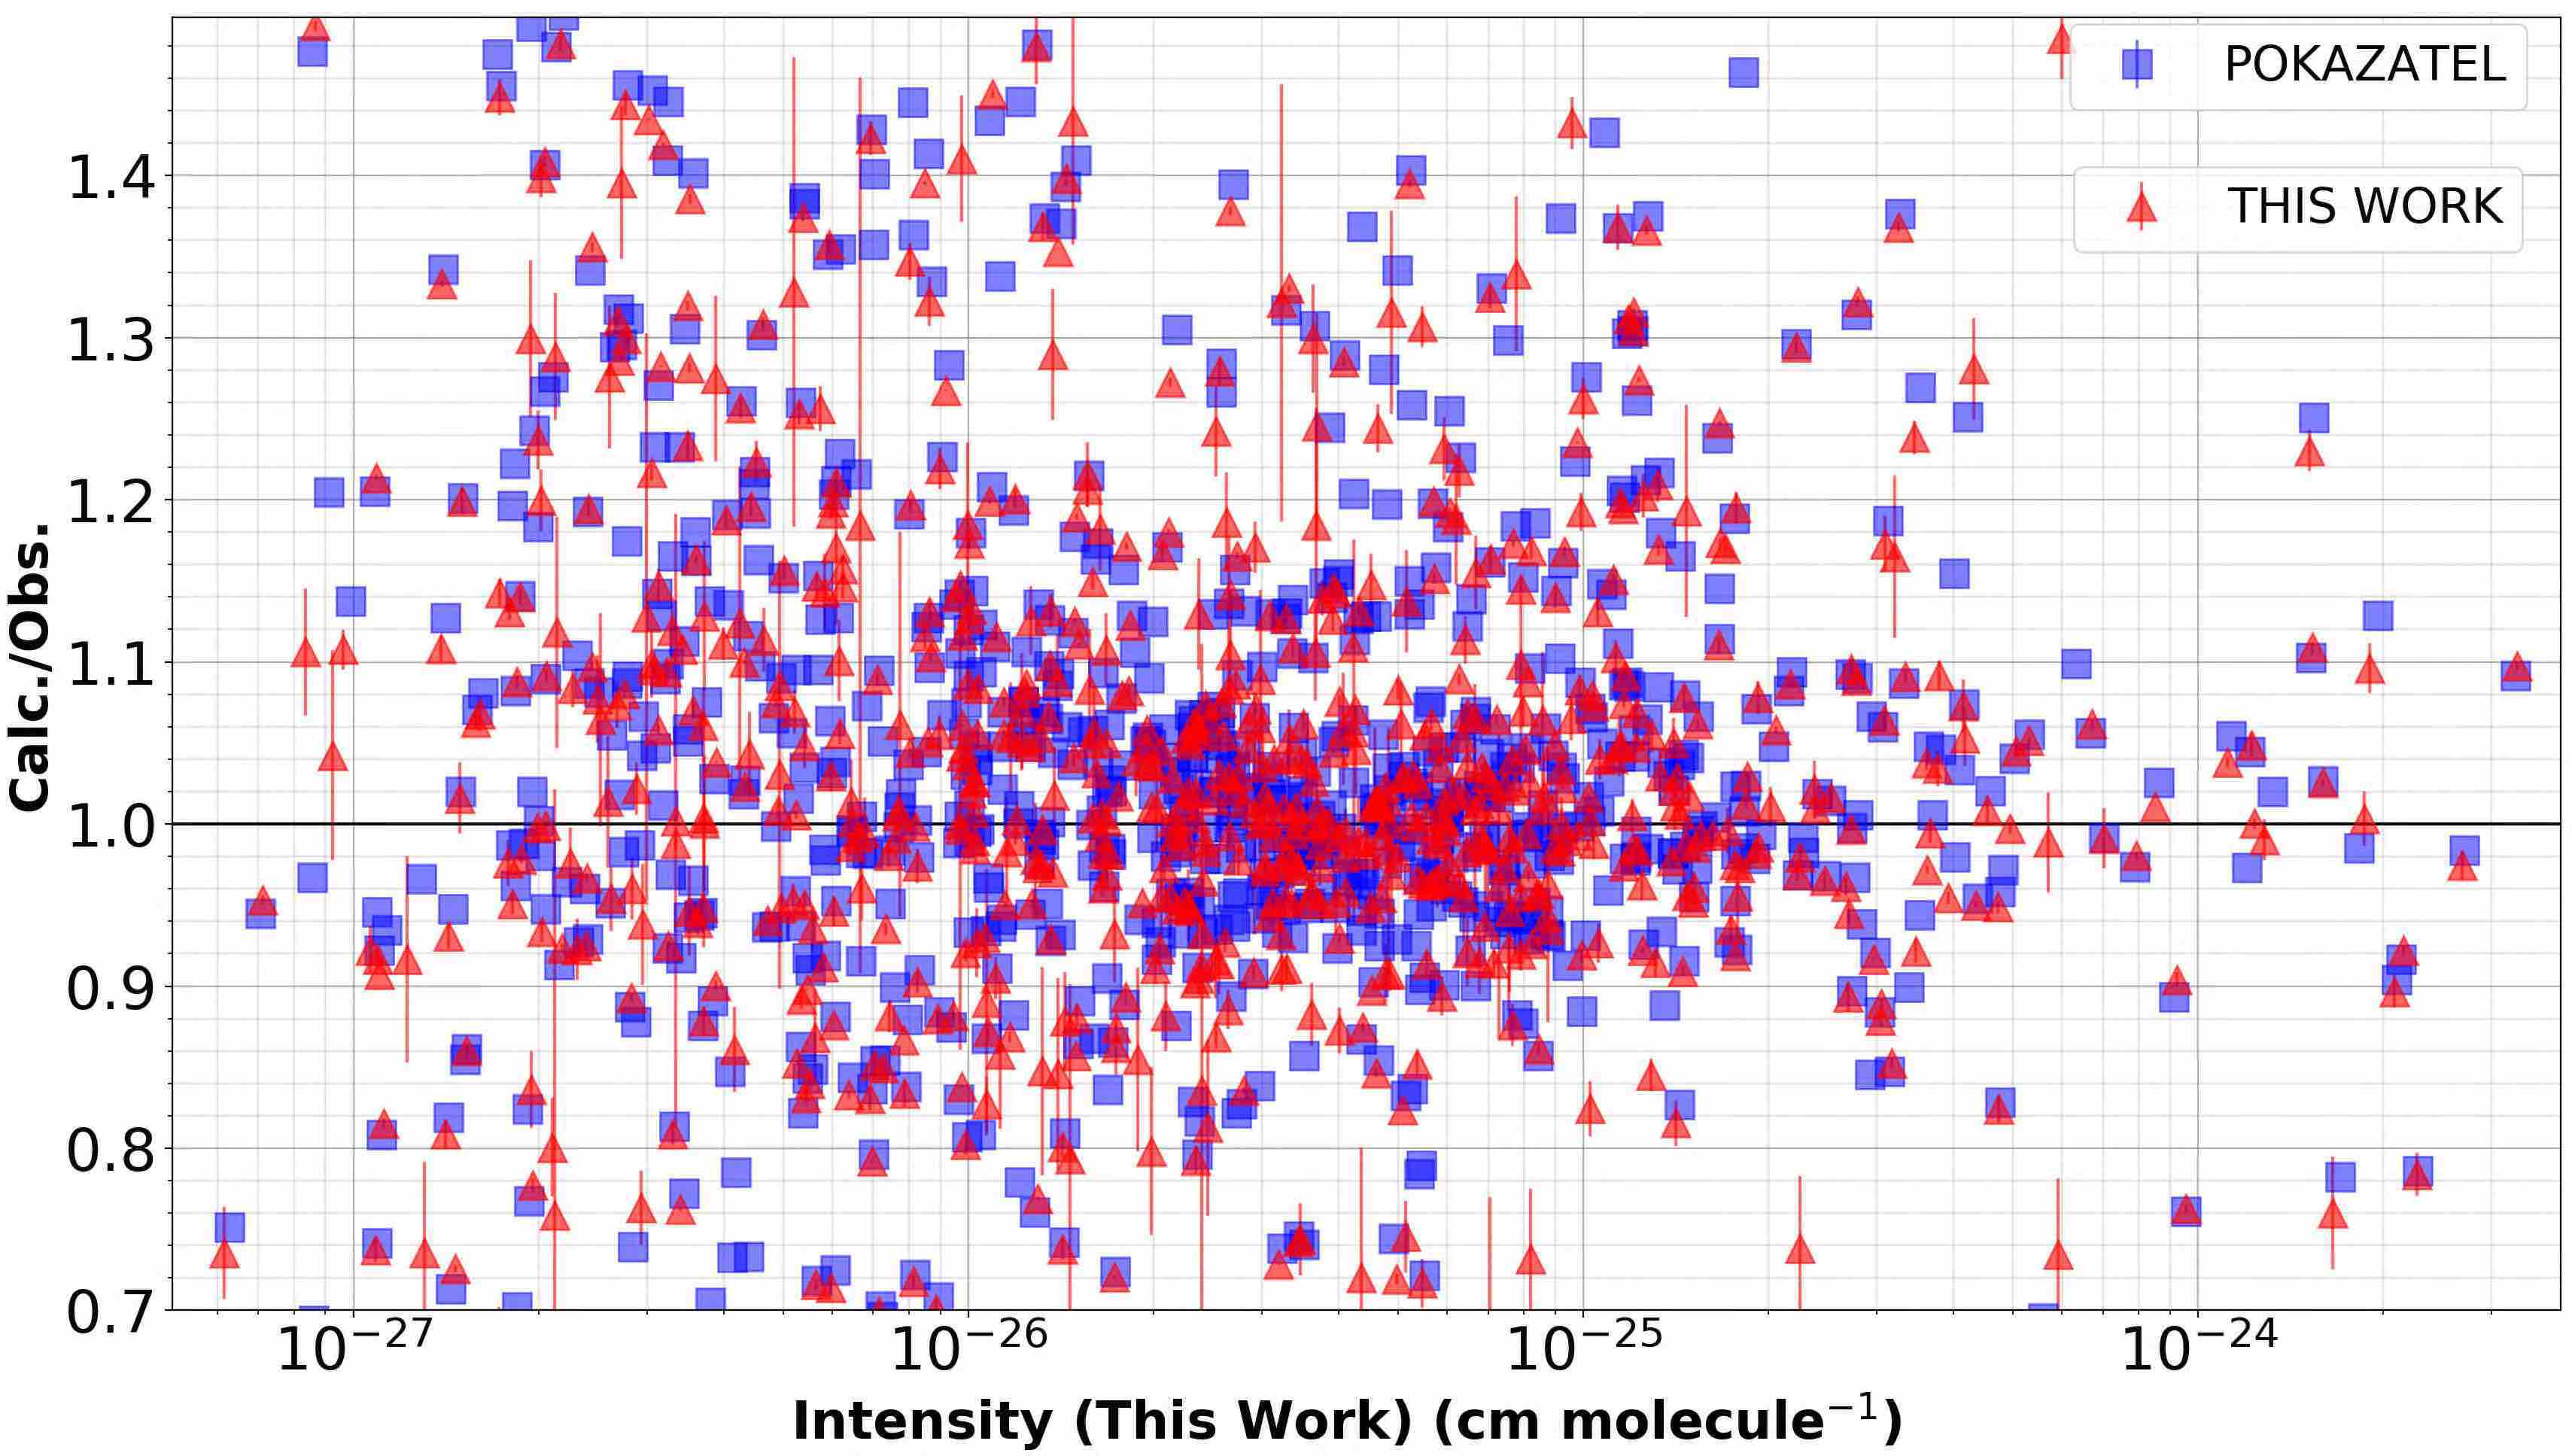
Leshchishina et al.[8] measured transition intensities within a narrow spectral region of 7000 - 7405 cm-1. Of the 775 lines shown in Figure 5(b), neither line list out-performs the other and ratios are again, scattered.
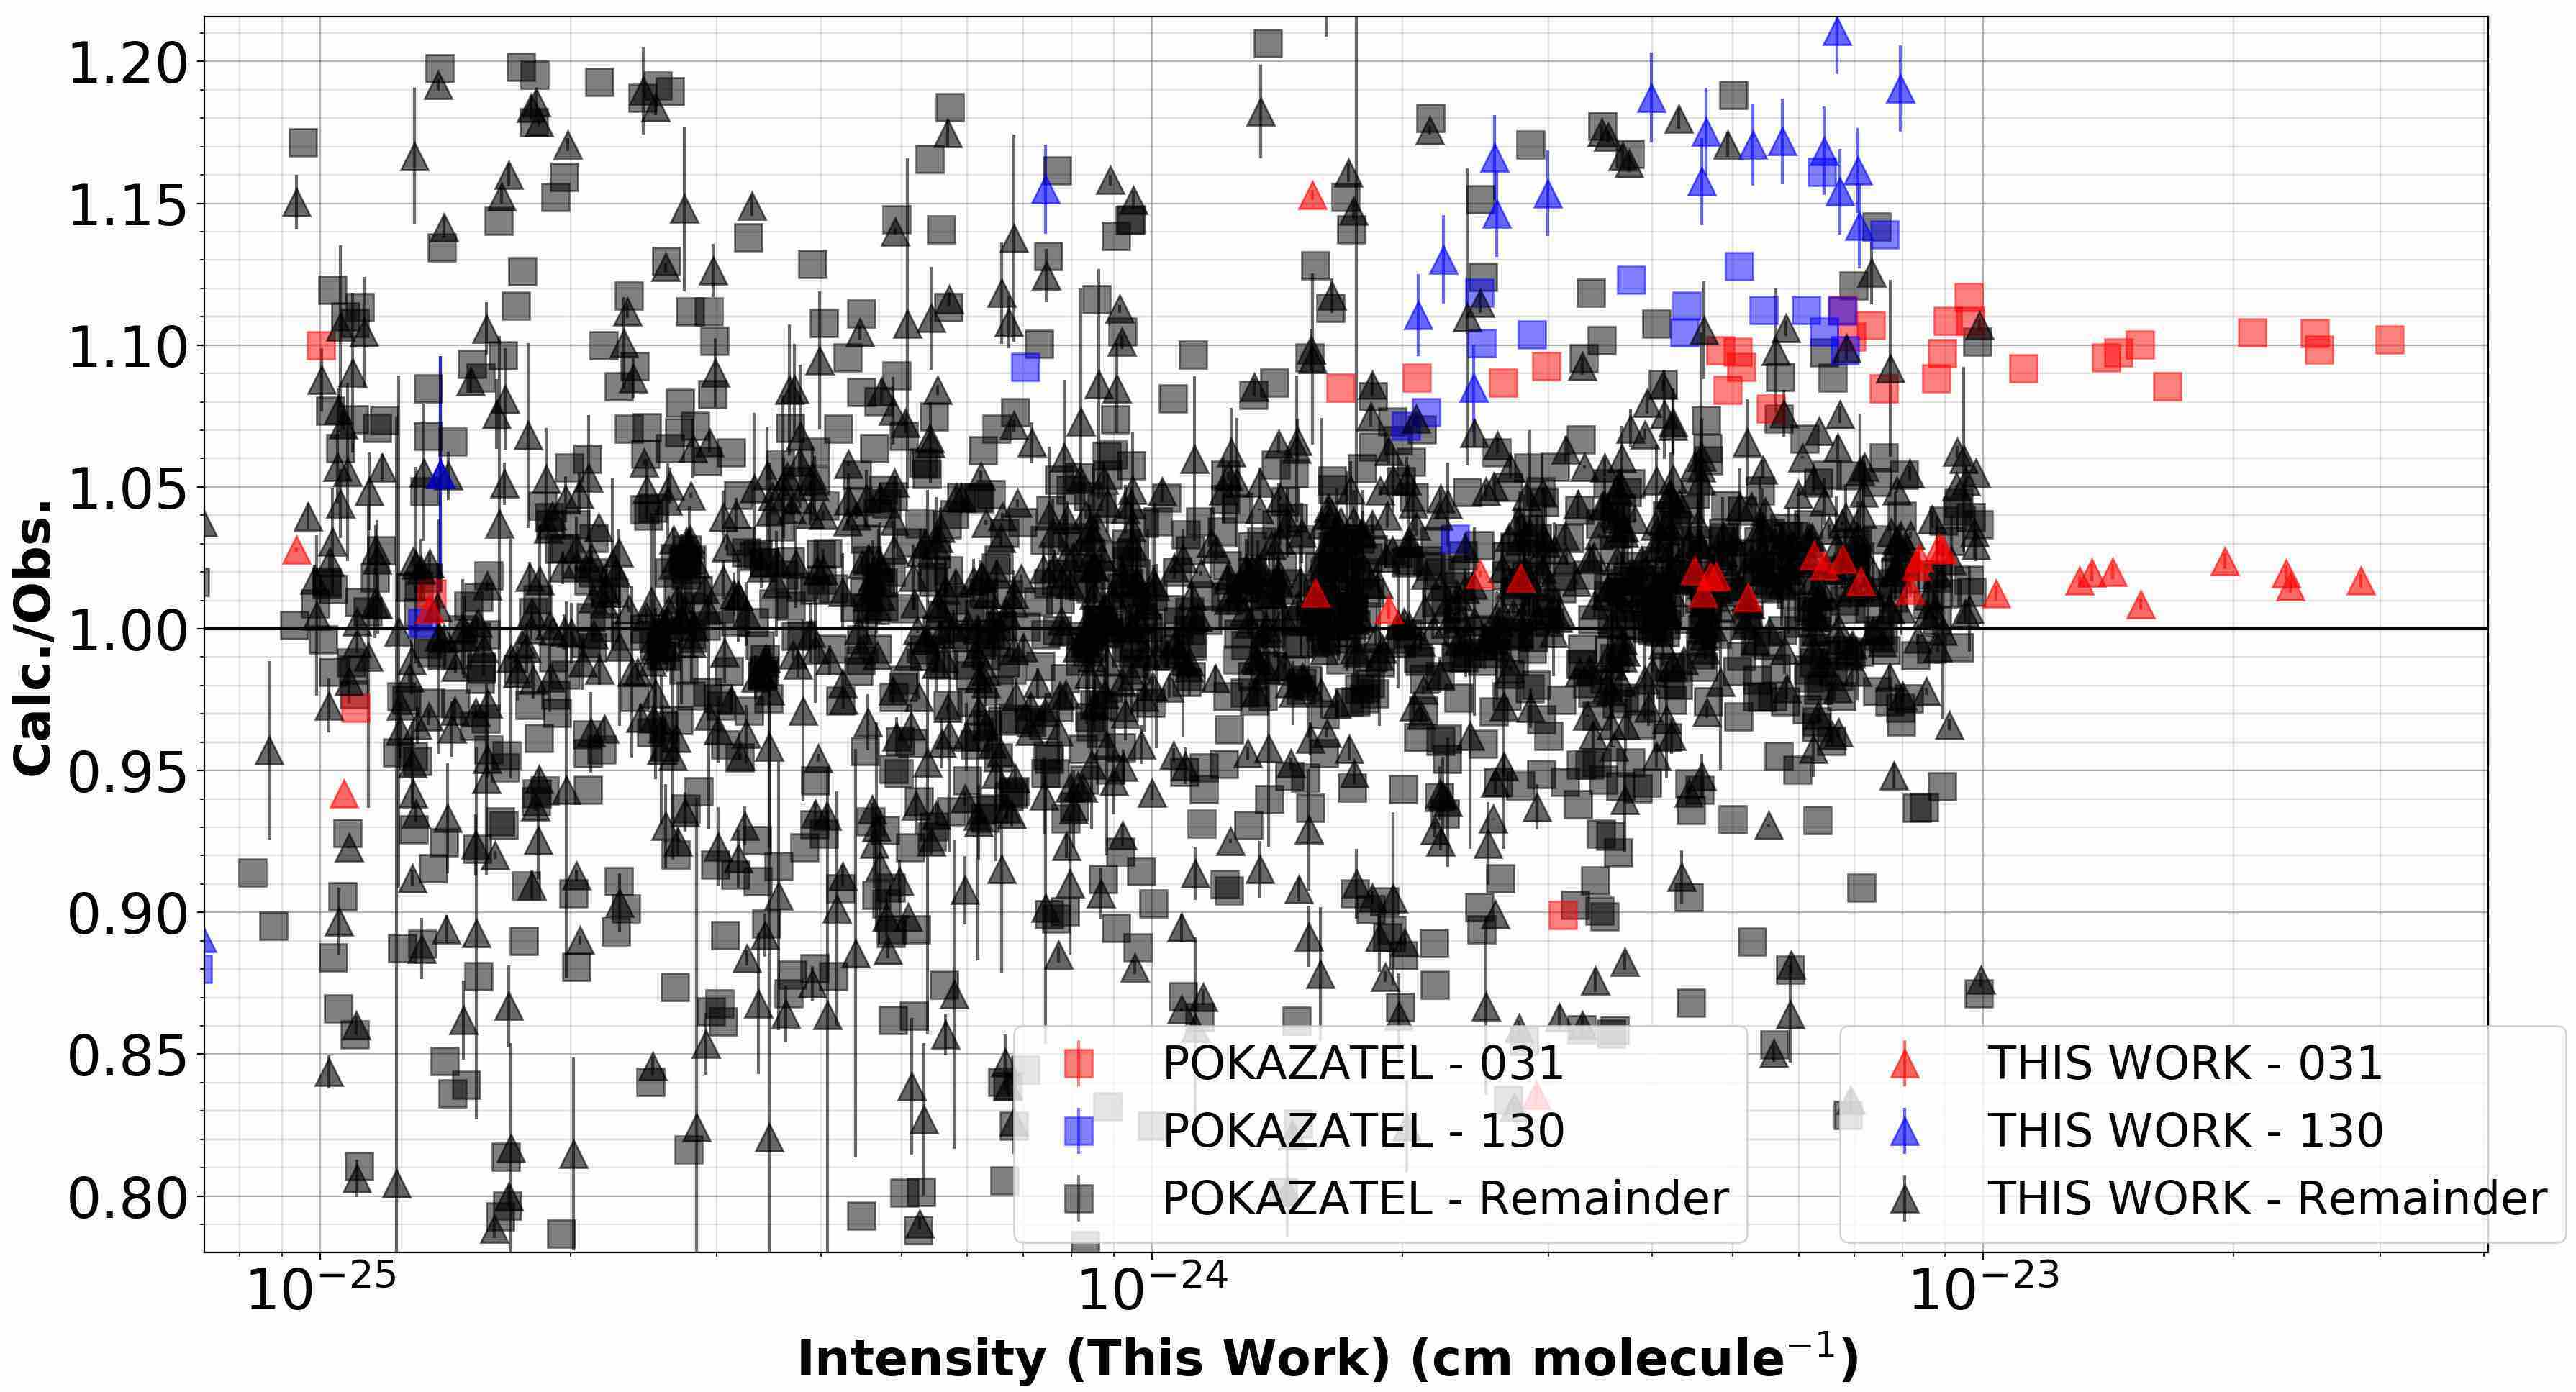
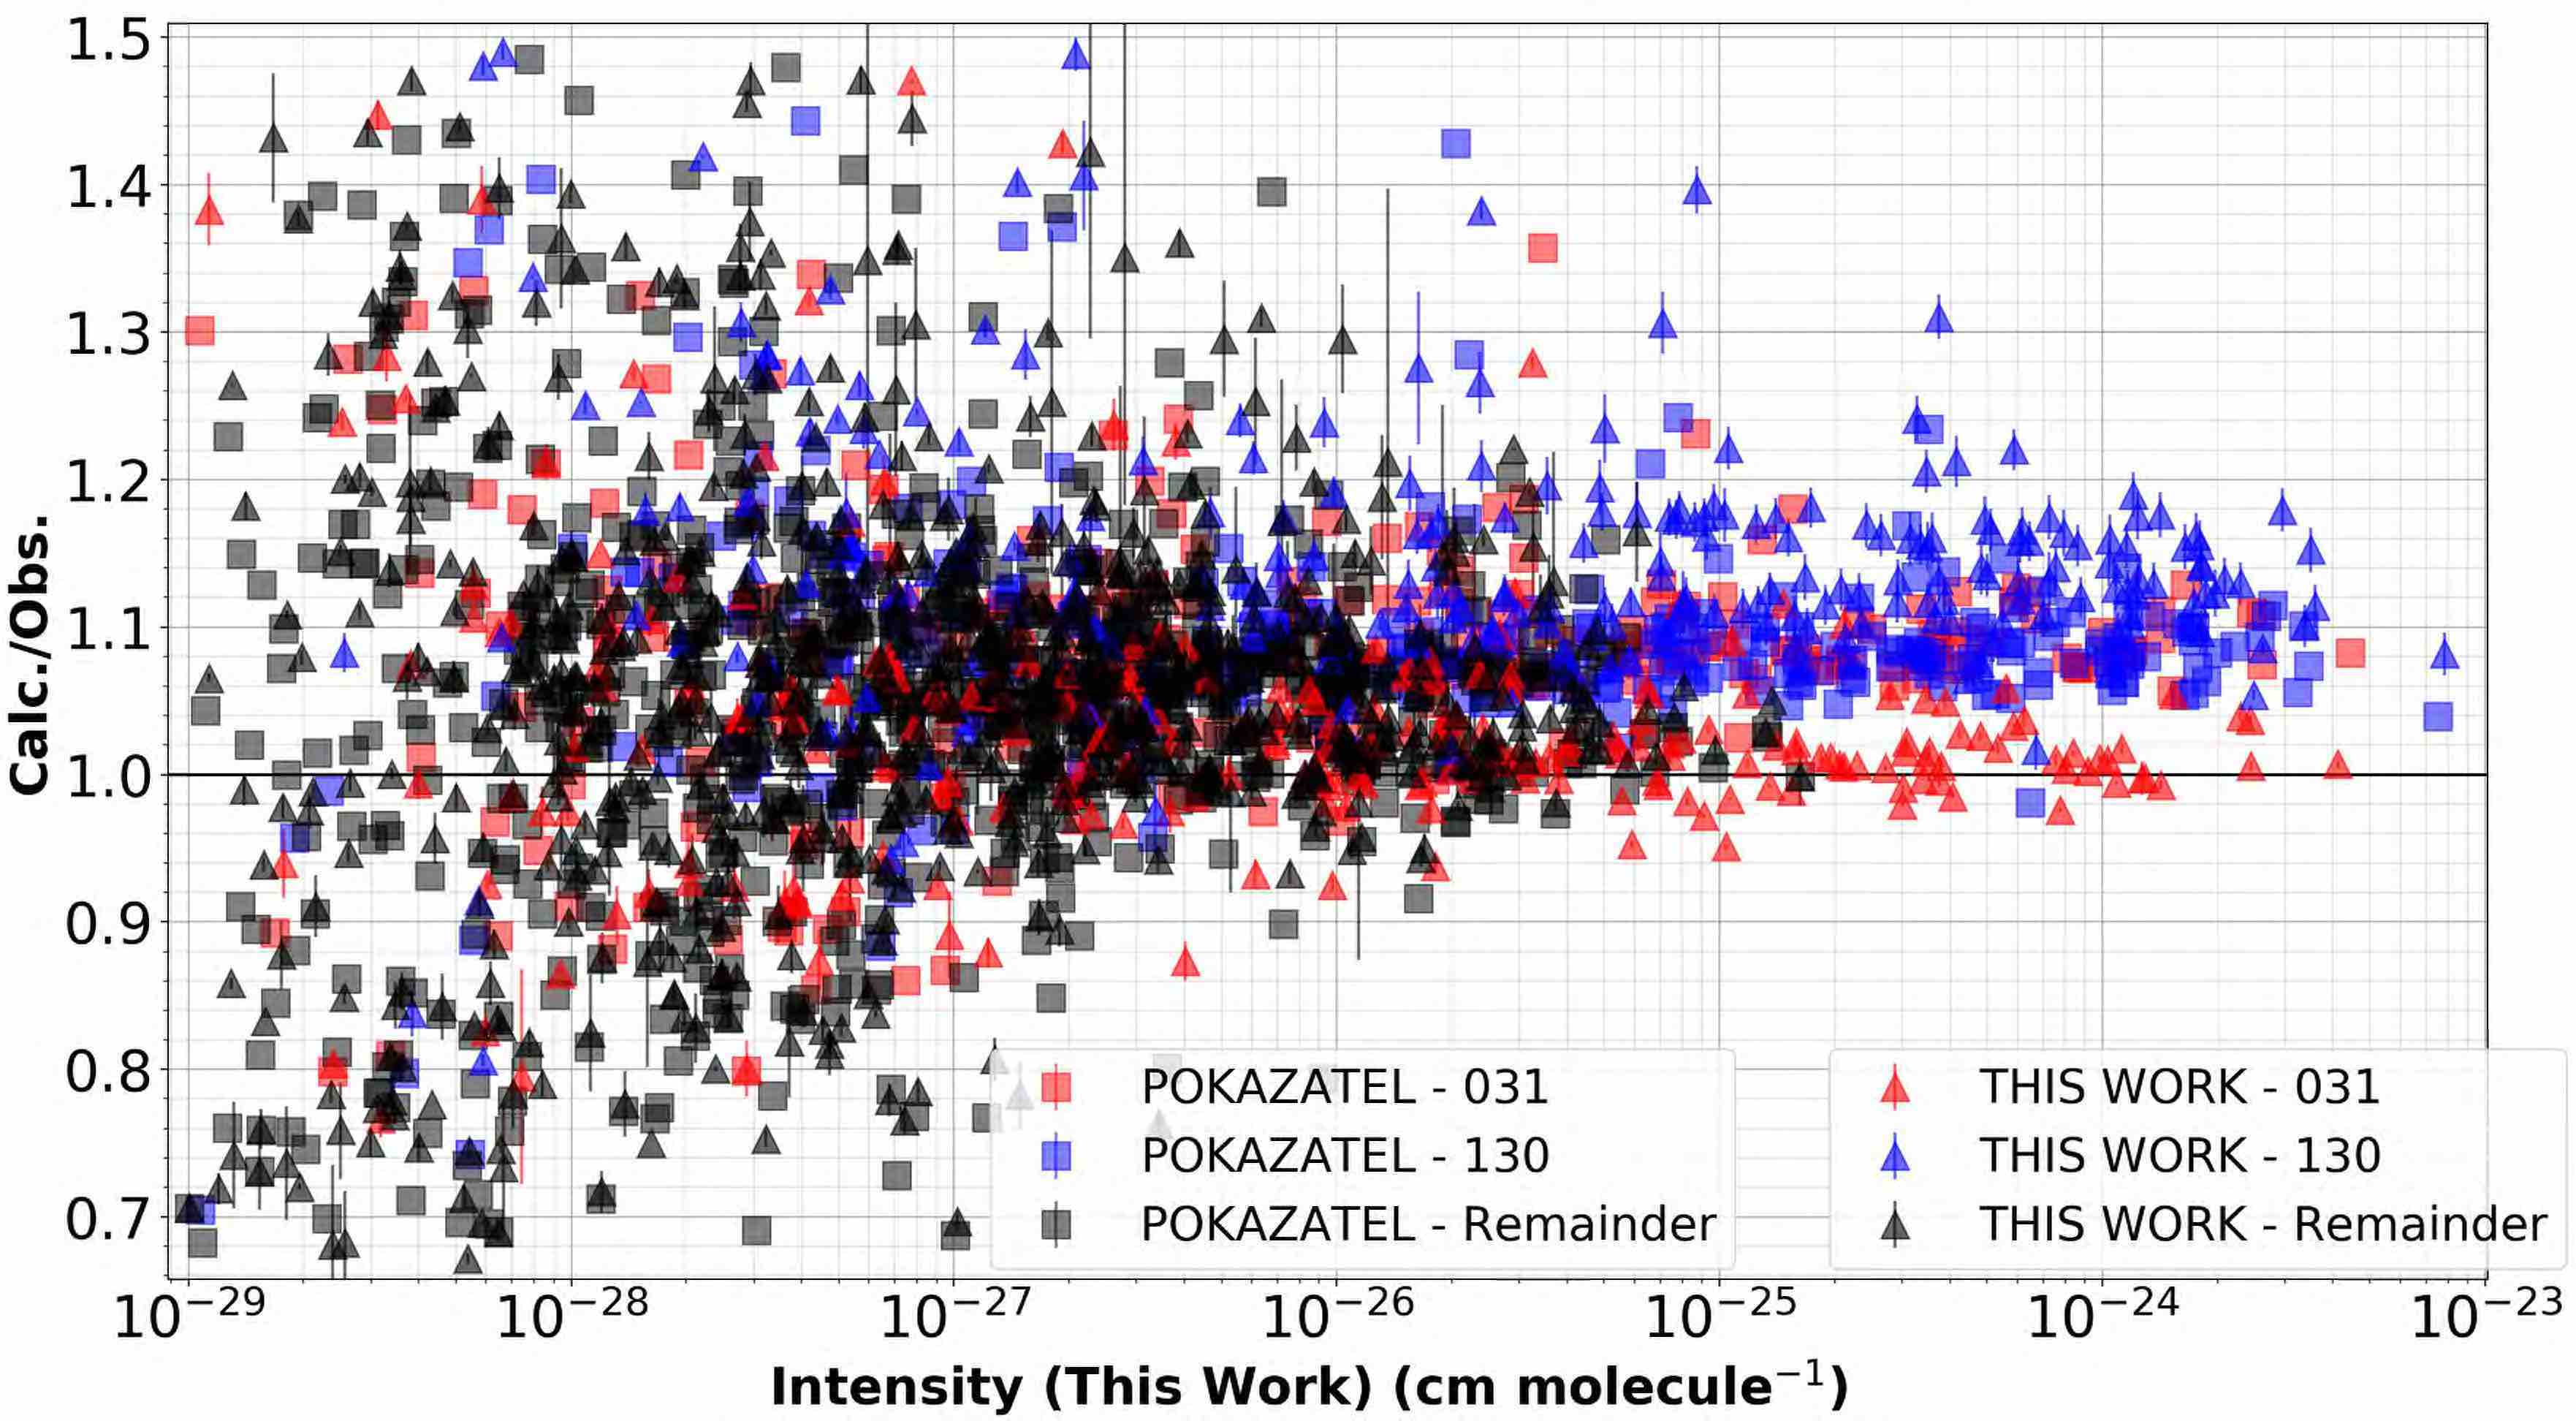
Our new line list exhibits excellent agreement with the measurements of Regalia et al. [11], see Figure 5(c). Comparing to HITRAN2016, we matched to 1102 of their measured intensities that cover 7000 - 8339 cm-1. Figure 5(c) shows a clear discrepancy in the prediction of (031) band intensities of the POKAZATEL line list with a 10% shift present for the strongest lines. For the (130) band intensities, our calculations are systematically offset by approximately 15-17%.
In Figure 5(d) shows calculated intensity ratios with 1209 measurement from Campargue et al.[12], taken from HITRAN2016, with frequencies in the range 7911 - 8332 cm-1. Our line list again shows a large, 10% improvement over POKAZATEL for the strong intensities of the (031) band. As previously seen in our comparison to the experiment of Regalia et al., our prediction of (130) band intensities are again over-estimated by approximately 14-17%. The intensity ratios from both experiments exhibit similar results for bands (031) and (130).
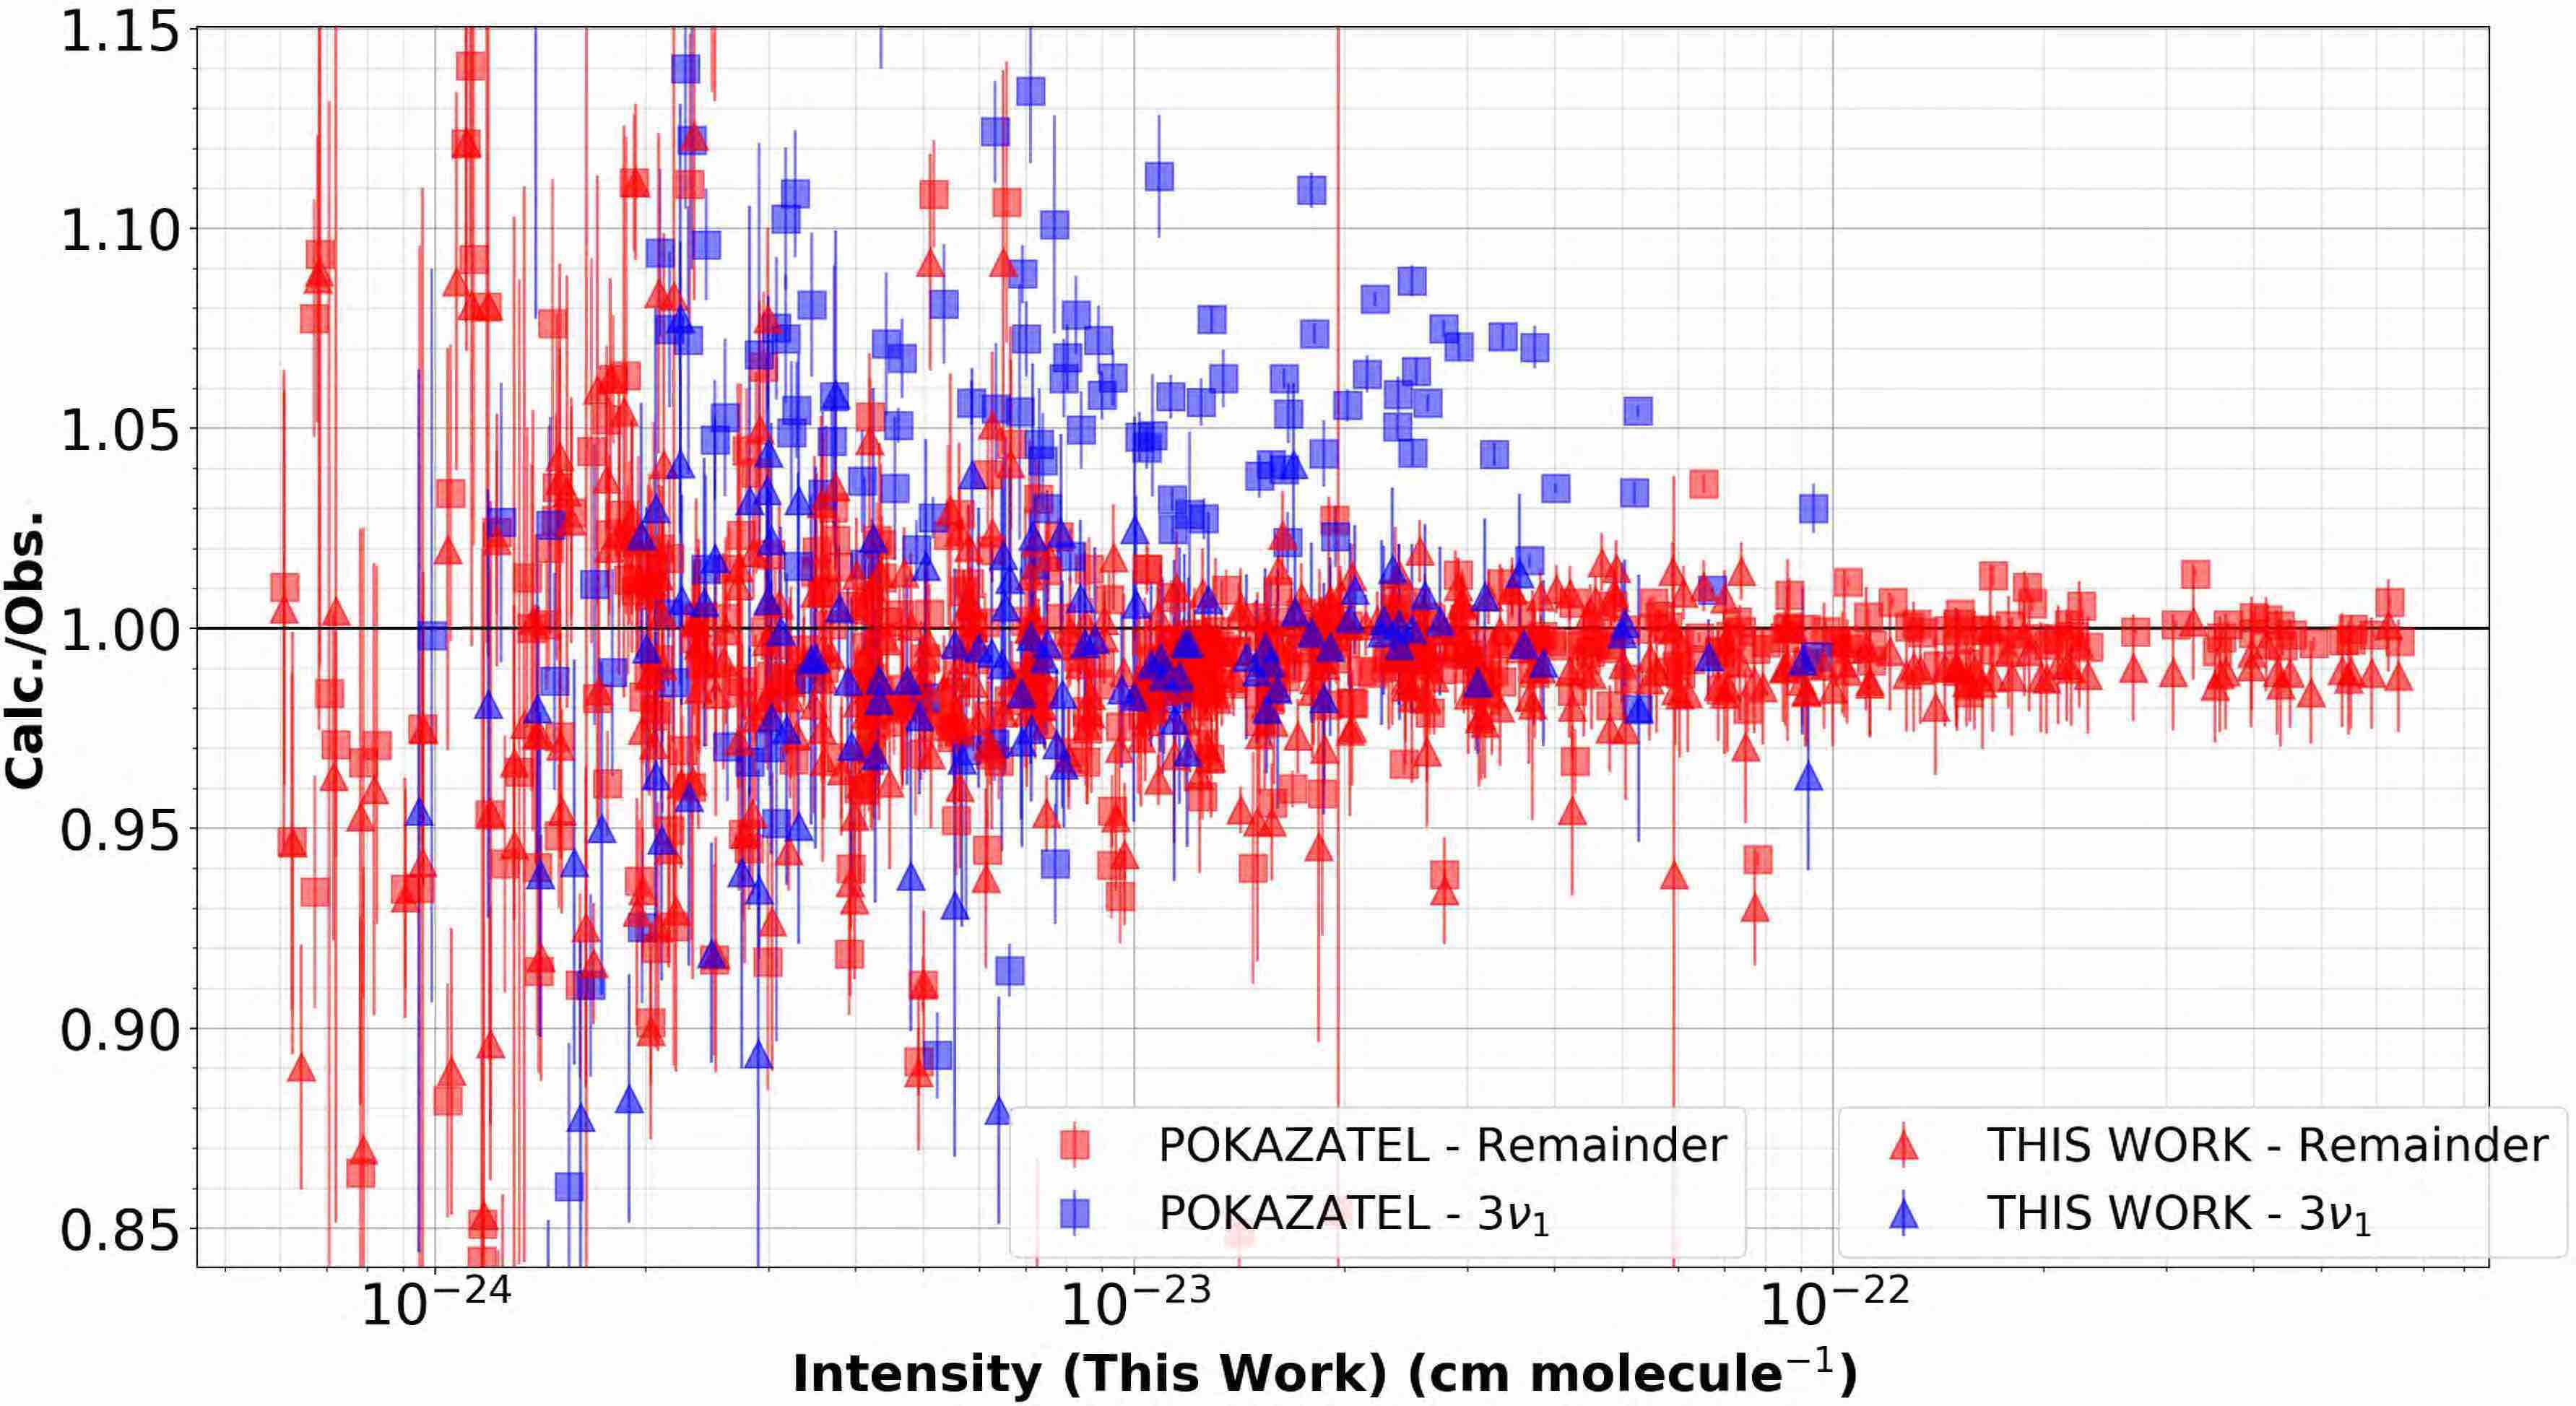
Sironneau and Hodges[13] measured intensities with high precision in the 7714 - 7919 cm-1 interval. We compare with 65 of their lines that are obtained from our comparison to the HITRAN2016 database; results shown in Figure 4(b). Intensity ratios in the 2 band indicate that POKAZATEL underestimates intensities by approximately 3%, while our new line list agrees with the measurements.
In Figure 6(a), we compare with the measured intensities of 535 transitions provided in the study of Birk et al.[7] present in HITRAN2016, with frequencies covering 10000 - 11000 cm-1. Our line list predicts intensities that are significantly closer to the reported experimental values than the line list of POKAZATEL, see Figure 6(a). Comparisons in the (300), (121) and (201) bands show deviations can reduce by up to 8% with our new line list[37].
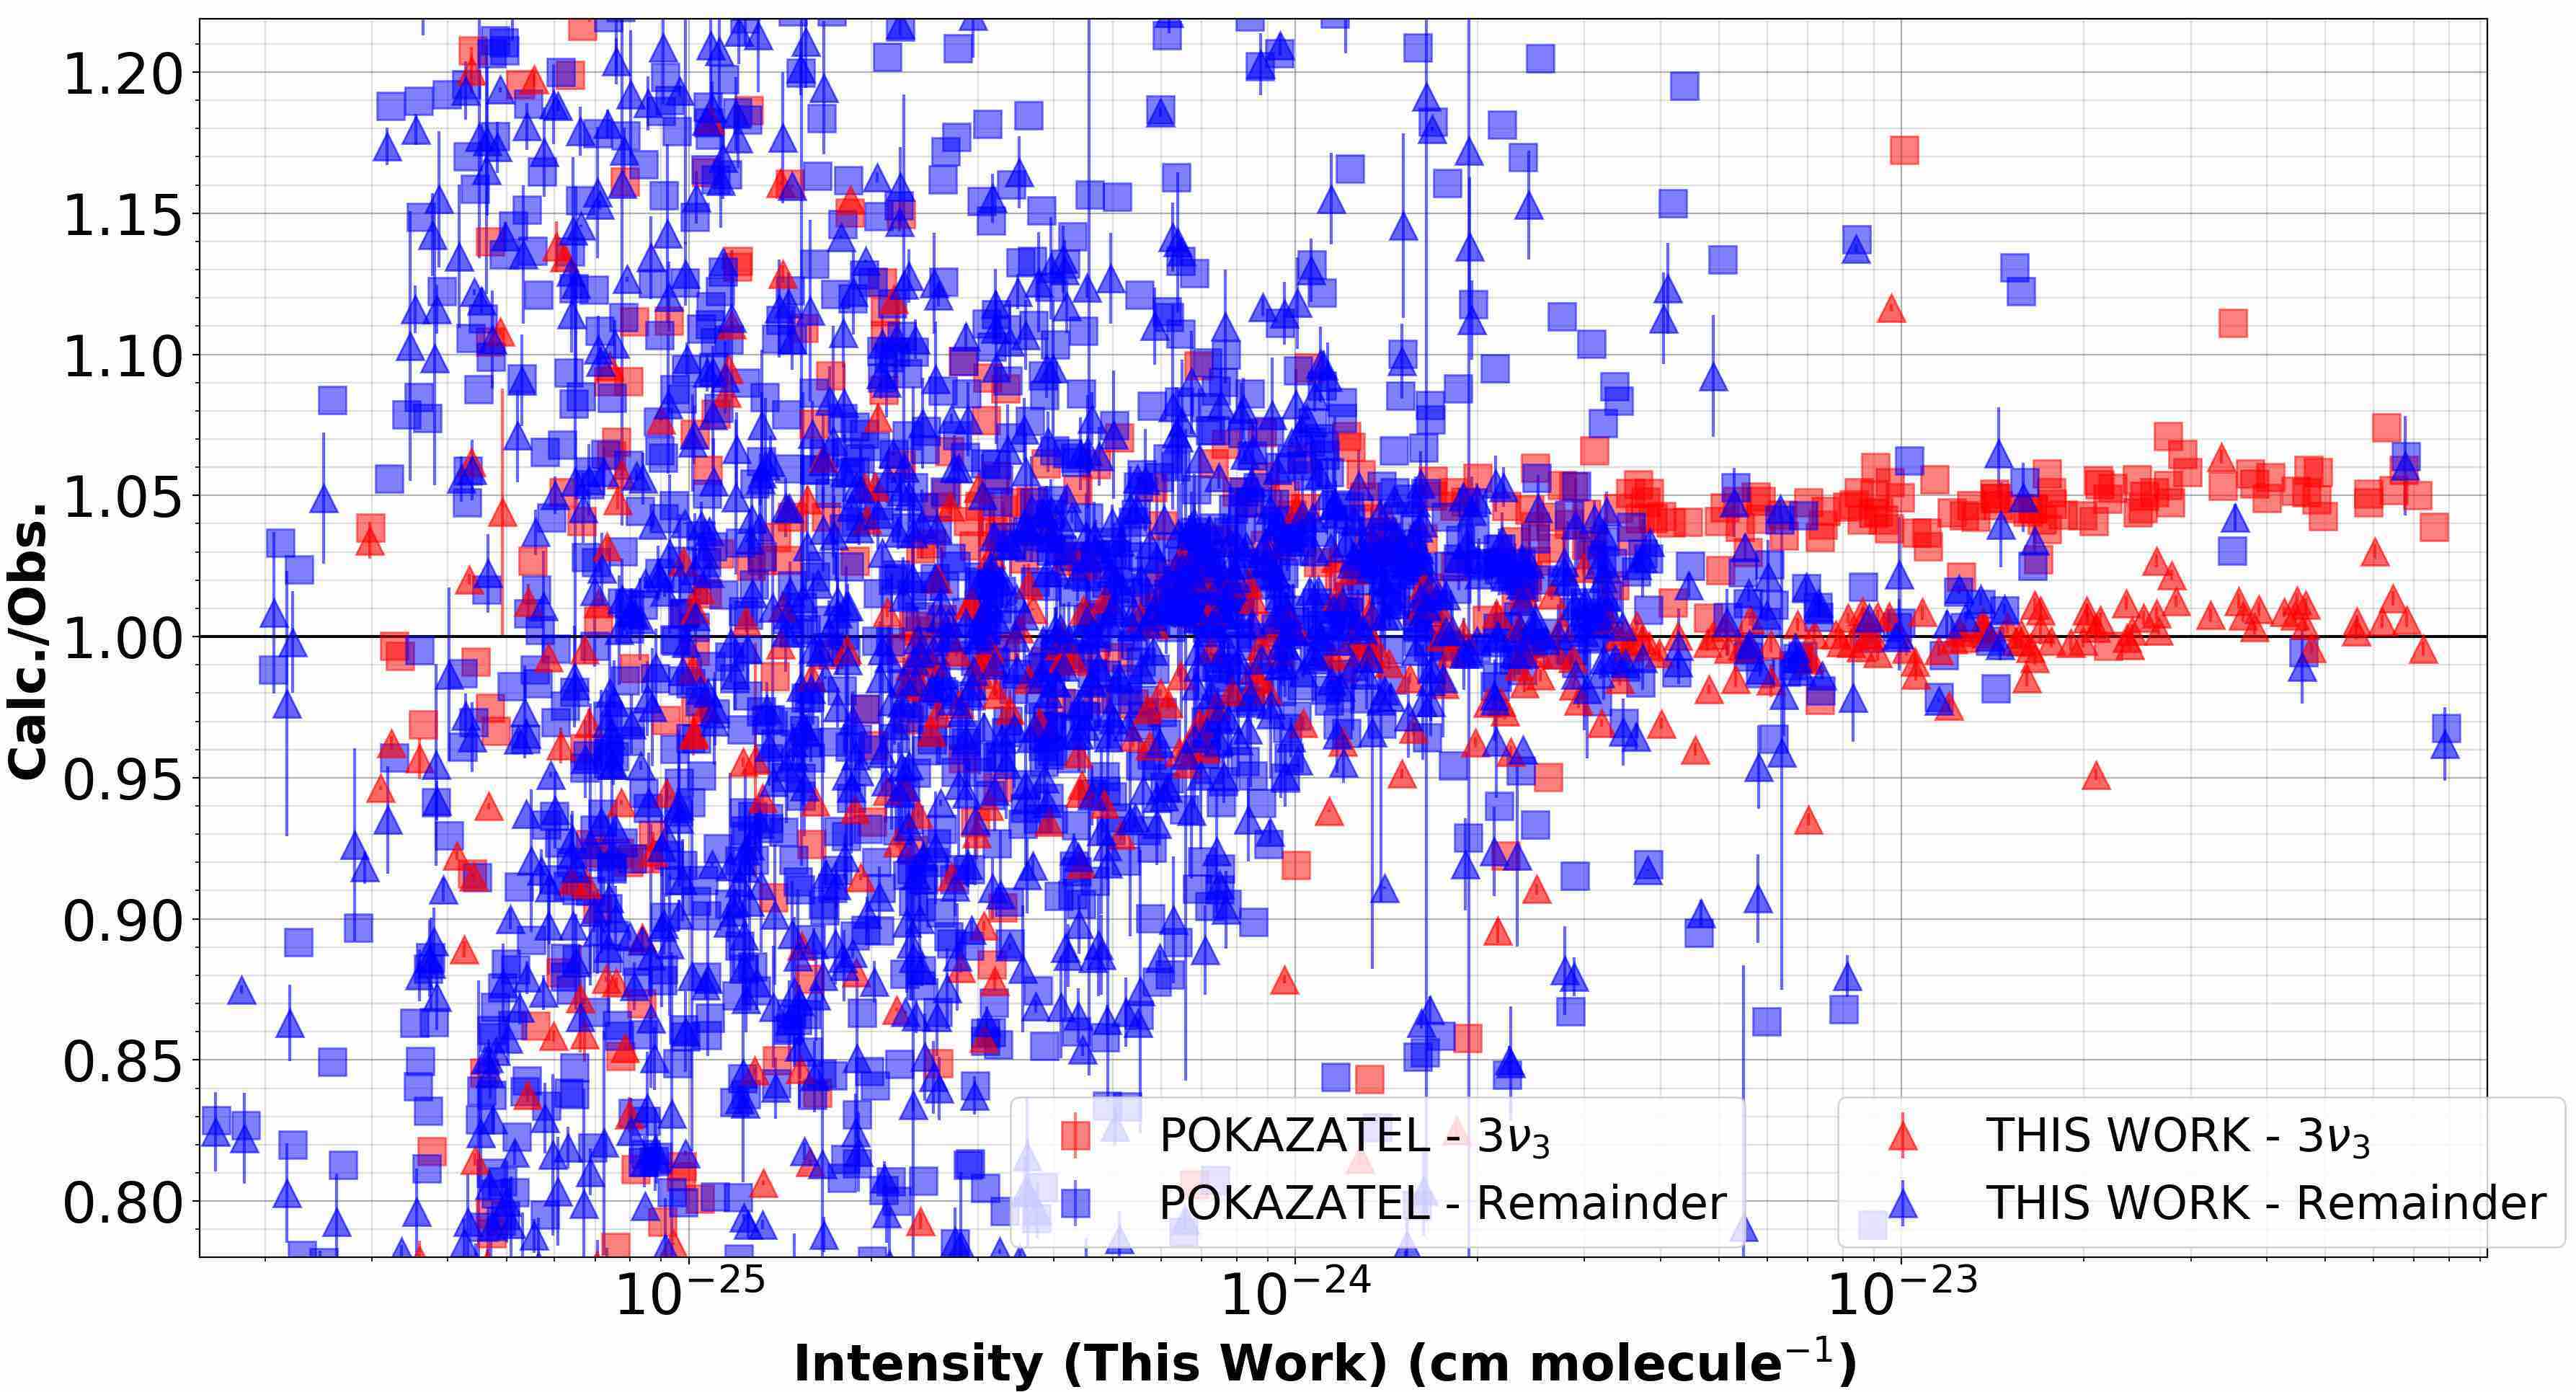
We matched with 1475 transitions within HITRAN2016 that originate from the work of Brown et al.[2] and plot intensity ratios in Figure 6(b). Brown et al. analyzed 25 individual spectra that were measured at the National Solar Observatory, Kitt Peak and produced intensities based on these observations. For well isolated lines, uncertainties are stated to be approximately 3%, or possibly lower in some cases. These intensities include many of the bands covered in [7] and possess transition frequencies in the region 10240 - 11378 cm-1. For the 3 band, POKAZATEL systematically over-estimates the absorption by approximately of 5%, as can seen in Figure 6(b).
In Table 2, we summarize key results for a number of vibrational bands previously discussed. For many of the bands considered, the range of intensities is extremely large, often spanning over six order of magnitude, hence we use a weighted average, see formula (1). With the exception of the (130) band, there is overall, an improvement over POKAZATEL, particularly for transitions at the shorter wavelengths. It is however, worth highlighting the large change in the average instability factor in the and bands, which increases from only %, to %. For water vapor, accurately modeling the bending behavior in potentials has always been difficult [22, 24]. This stability factor is likely to continue increasing for the higher excitations in and hence, the ab initio wave-functions may reduce the accuracy of the transition intensities.
| (1) |
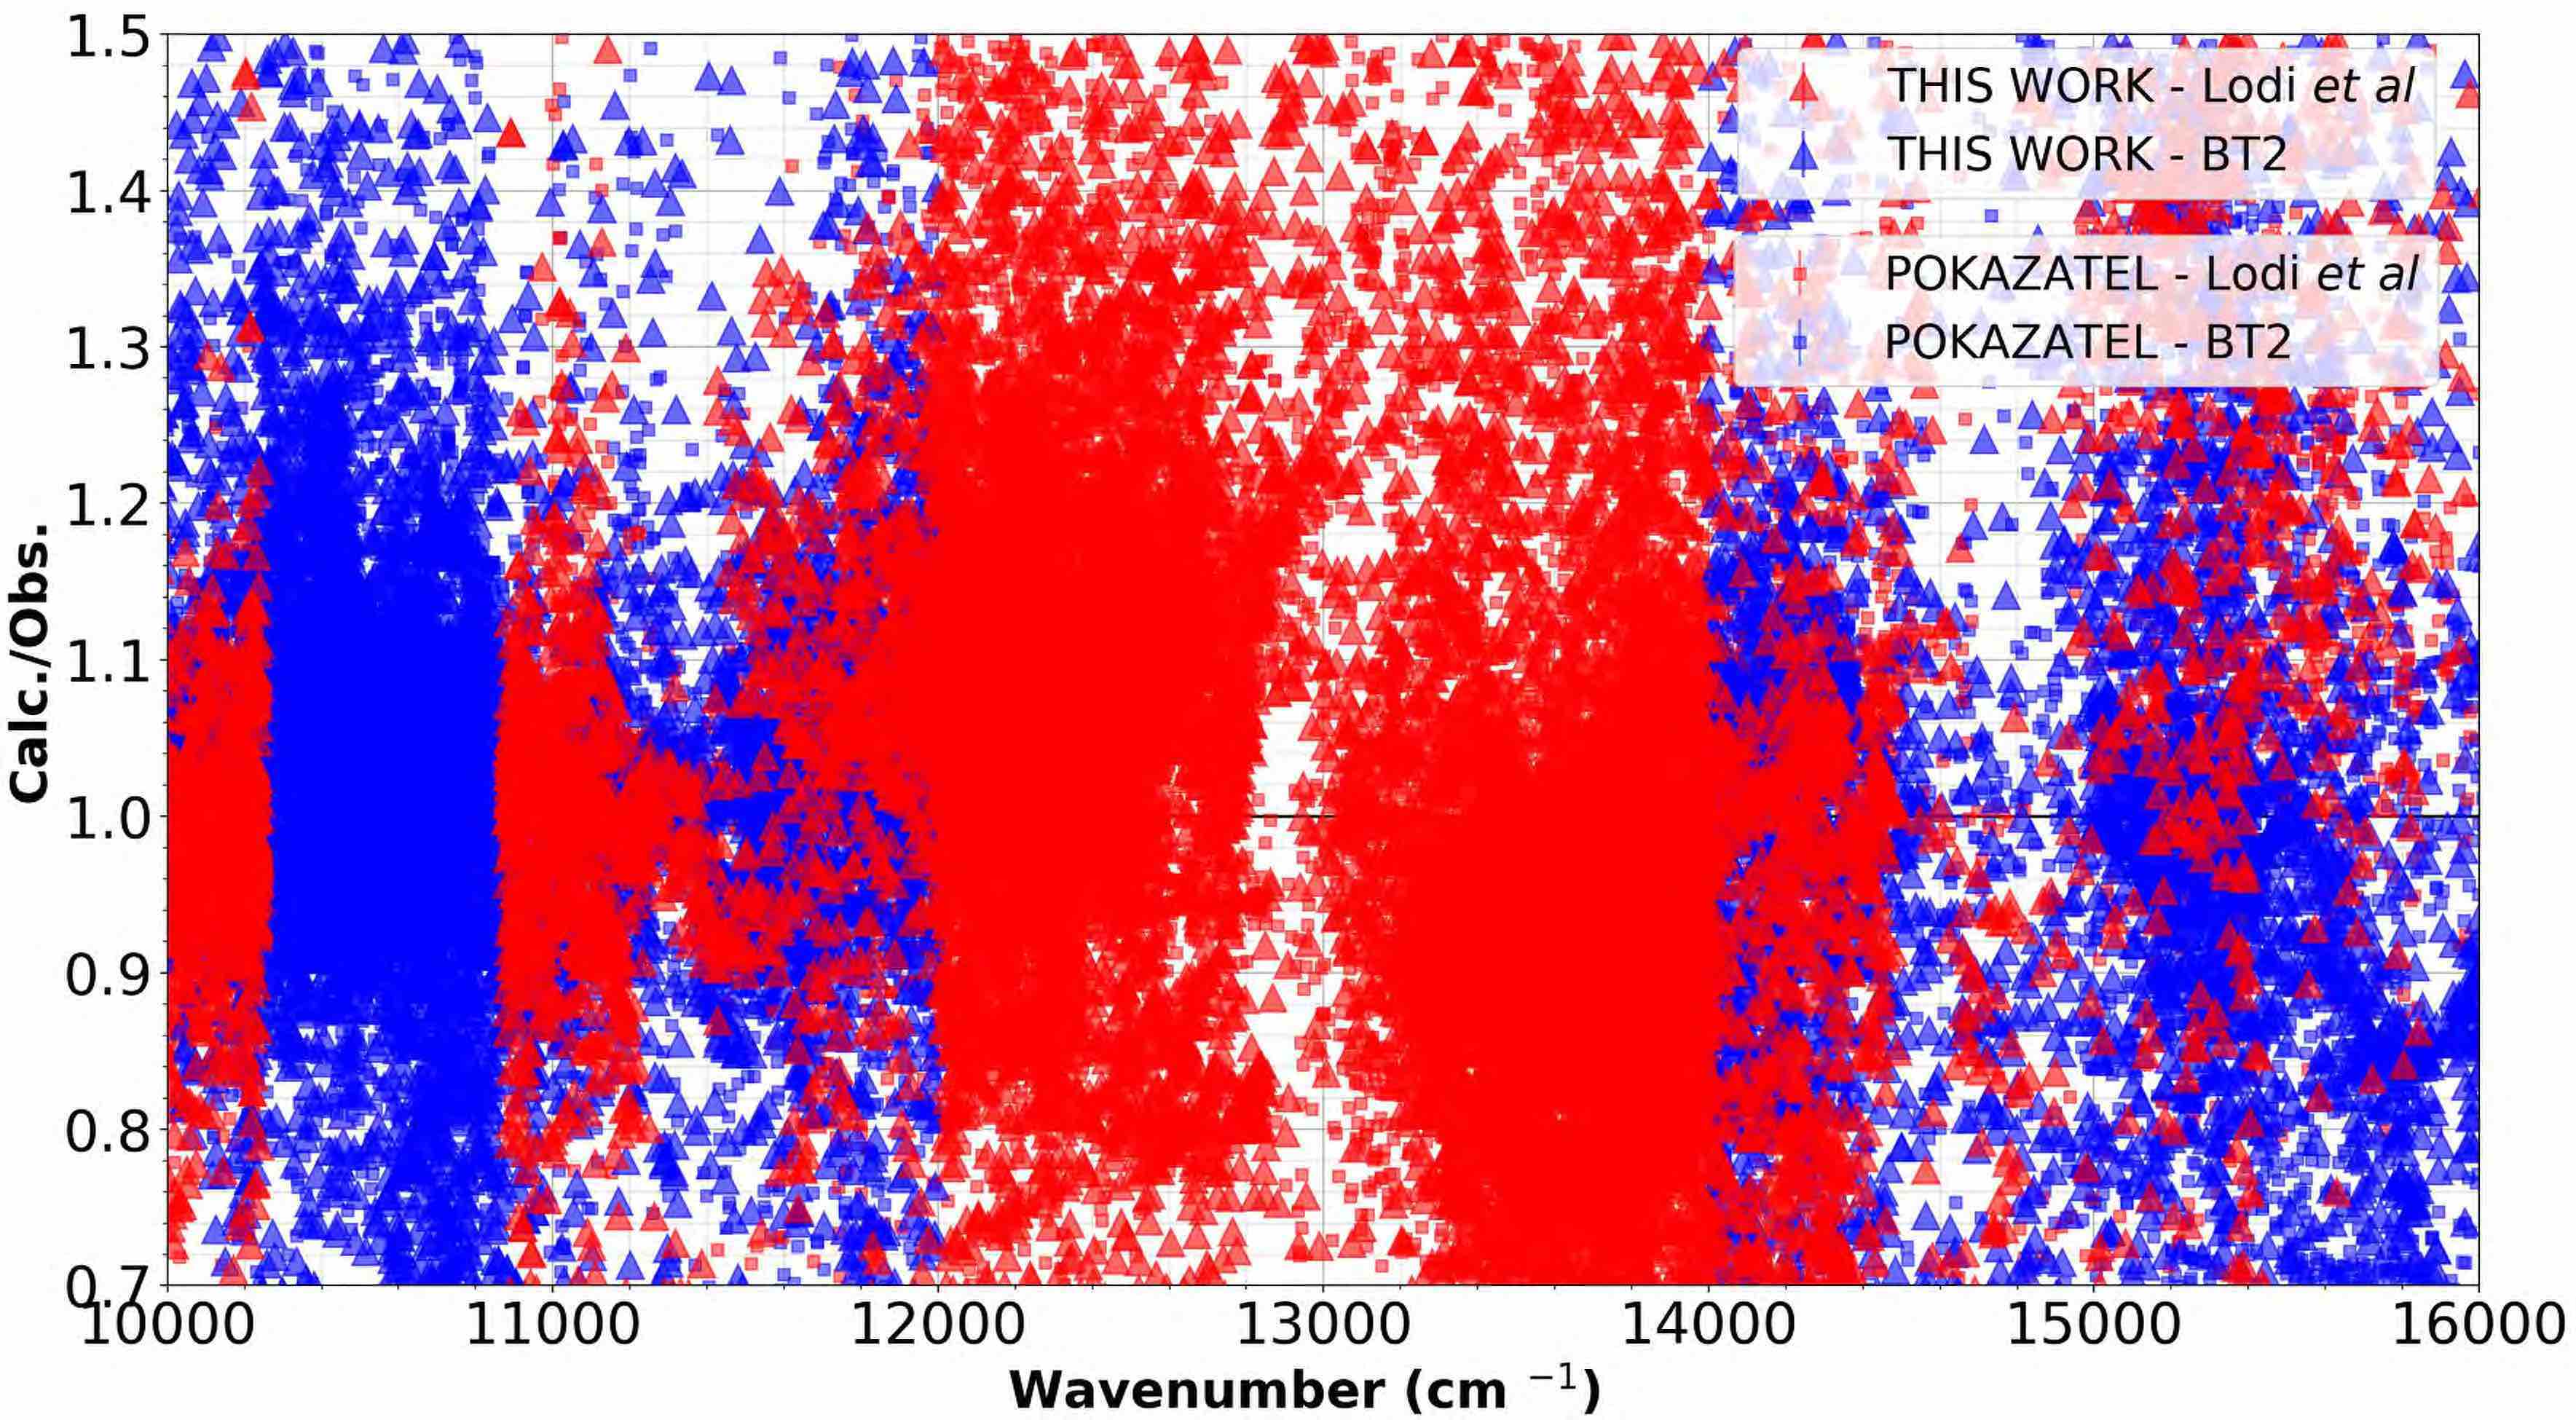
There is a distinct energy gap present at 13000 cm-1 for the H216O experimental data within HITRAN2016 in the region covered by O2 A band absorption. Incorrect intensities and/or other line parameters occurring in this region has the possibility to interfere with remote sensing experiments of O2.
There are two different sets of experimental data in HITRAN2016 that come from the work of Tolchenov et al.[4, 5]. The first [4] includes those transitions with frequencies in the range 10251 - 14495 cm-1, and the other [5] continuing from 14500 - 25232 cm-1. For the infrared-only measurements[4], we were able to compare with a total of 3911 transitions that are taken from HITRAN2016, with resulting intensity ratios displayed in Figures 7(a). As previously seen with comparisons to the experiment of Brown et al., we again observe an approximate shift of 4-5% for the strongest lines of POKAZATEL. Campargue et al. [62] also recorded intracavity laser spectroscopy (ICLAS) in the narrow region of 12746 - 13558 cm-1 (not in HITRAN2016) and we also compare to 604 of their measured intensities in Figures 7(a). For the few strong lines measured, we are in better agreement to experiment than POKAZATEL.
| Band | # Lines | S | S | Instability (%) | Exp. Error (%) | TW (%) | POKAZATEL (%) |
|---|---|---|---|---|---|---|---|
| 100 | 890 | 5.8(-27) | 2.3(-20) | 0.34 | 0.28 | 1.51 | 1.51 |
| 001 | 1019 | 2.9(-26) | 2.5(-19) | 0.04 | 0.24 | 0.46 | 0.19 |
| 010 | 912 | 1.5(-26) | 3.2(-19) | 0.02 | 0.17 | 0.55 | 0.55 |
| 020 | 793 | 1.9(-26) | 2.8(-21) | 0.80 | 0.47 | 0.87 | 1.11 |
| 130a | 173 | 1(-26) | 7.9(-24) | 1.5 | – | 14.77 | 9.75 |
| 031a | 142 | 1(-26) | 2.8(-23) | 0.3 | – | 2.93 | 9.66 |
| 300 | 120 | 9.5(-26) | 9.2(-23) | 1.65 | 1.43 | 2.79 | 6.05 |
| 003 | 151 | 1.0(-24) | 7.2(-23) | 0.22 | – | 1.54 | 4.65 |
| 201 | 236 | 6.1(-25) | 6.4(-22) | 1.29 | 0.99 | 2.05 | 1.68 |
| 121 | 116 | 6.8(-25) | 1.0(-22) | 0.53 | 1.37 | 2.89 | 2.96 |
We also consider the theoretical intensities present in HITRAN2016 that feature in this O2 A band region; BT2[20] and Lodi et al.[33] (UCL2012), see Figure 7(b). Comparison of our intensities to those of Lodi et al. show clear asymmetry between the absorption features on red and blue sides of the A-band region. This is corroborated by the independent study by Geoffrey Toon (Jet Propulsion Laboratories) [63] who carried out spectral fits to a ground-based solar spectrum measured with the one of the Total Carbon Column Observing Network (TCCON) [64] Fourier Transform spectrometers (FTS) from Darwin, Australia, at 87 degrees solar zenith angle on Apr 17, 2007. It was discovered that when using UCL2012 line list to retrieve water vapor in our atmosphere, the amount retrieved below and above 13000 cm-1 are different. Figure 7(b) echos this observation and our line list should prove to be beneficial for future works involving the O2 A band.
We followed this up by acquiring the source data to both works of Tolchenov et al. [4, 5], which includes measurements from 9250 - 25232 cm-1. It is perhaps worth noting that the original experiment was carried out by Schermaul and co-workers at the Rutherford Appleton Laboratory [1, 65, 66]. We have already cross compared in the one-micron region with experiments from Birk et al. and Brown et al., which include bands (300), (003), (121), (201) and (102), and the agreement between these sources and our line list is excellent; ratios are between 1.0 0.1. One method of verifying/assessing the experimental data of Tolchenov et al. is to compare our calculated intensities to these same bands but instead using the source data from Tolchenov et al. Intensity ratios of 3260 transitions are presented in Figure 7(c) with the respective experimental uncertainties.
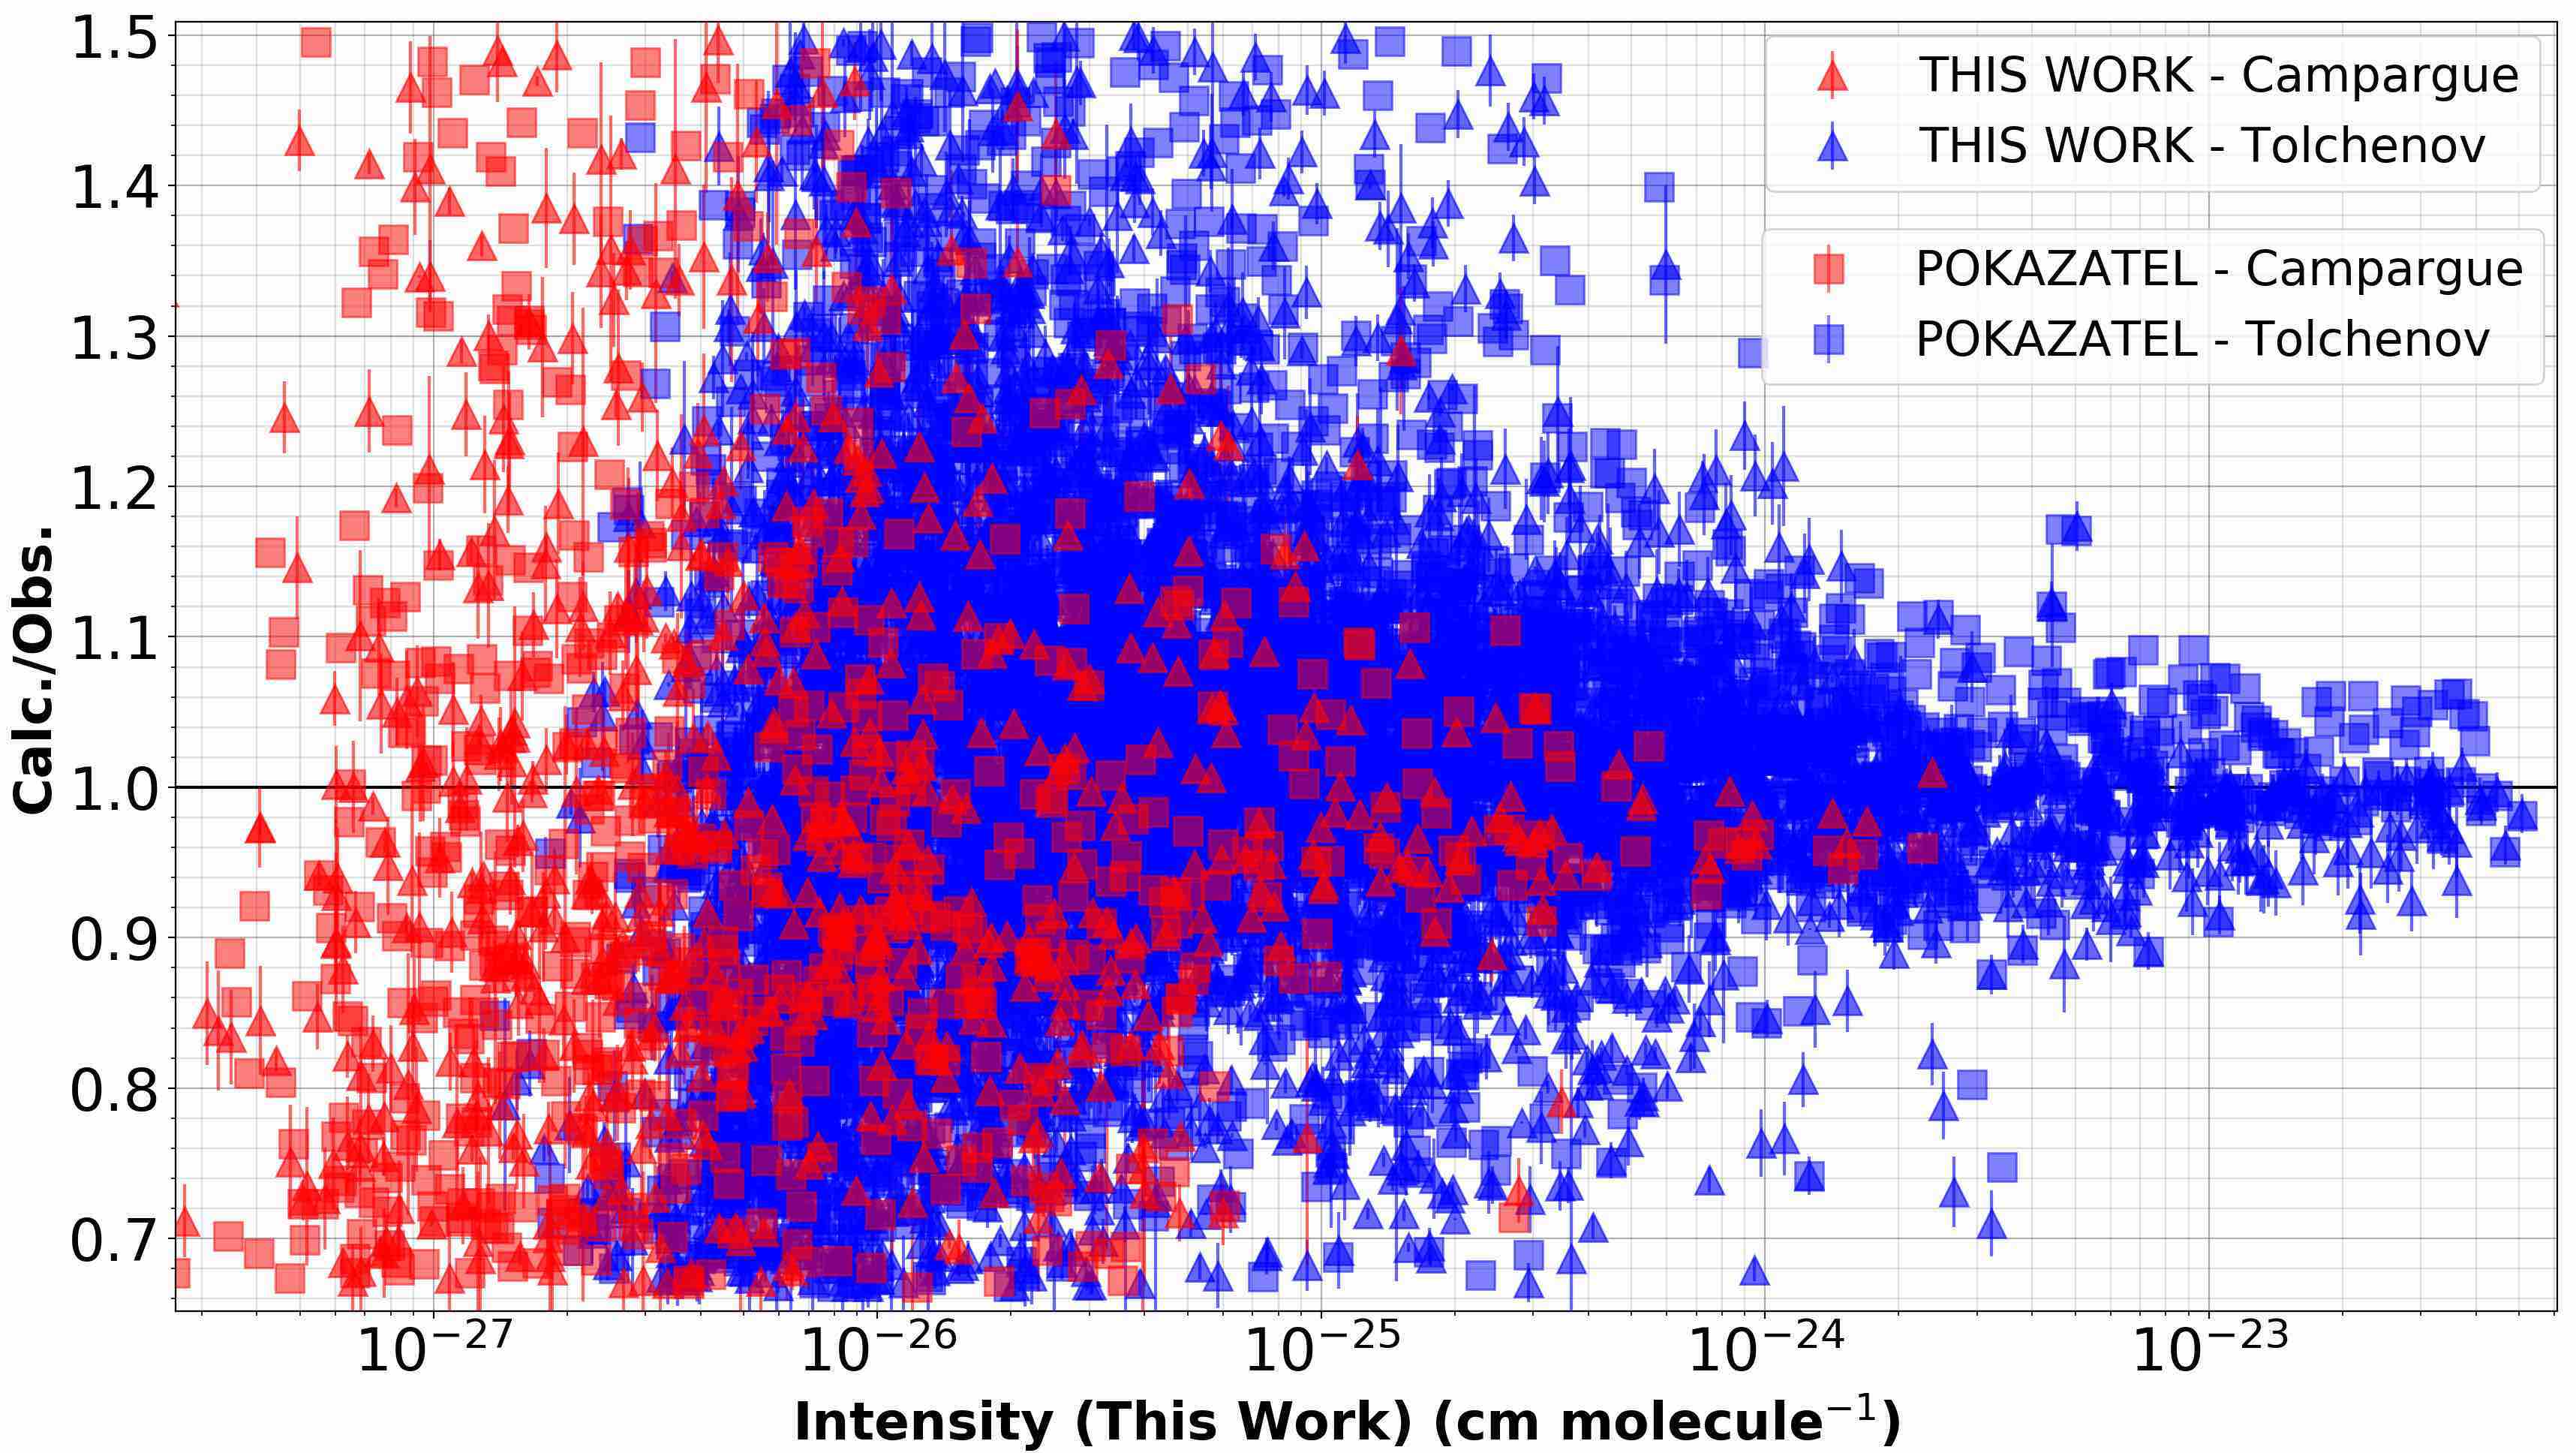
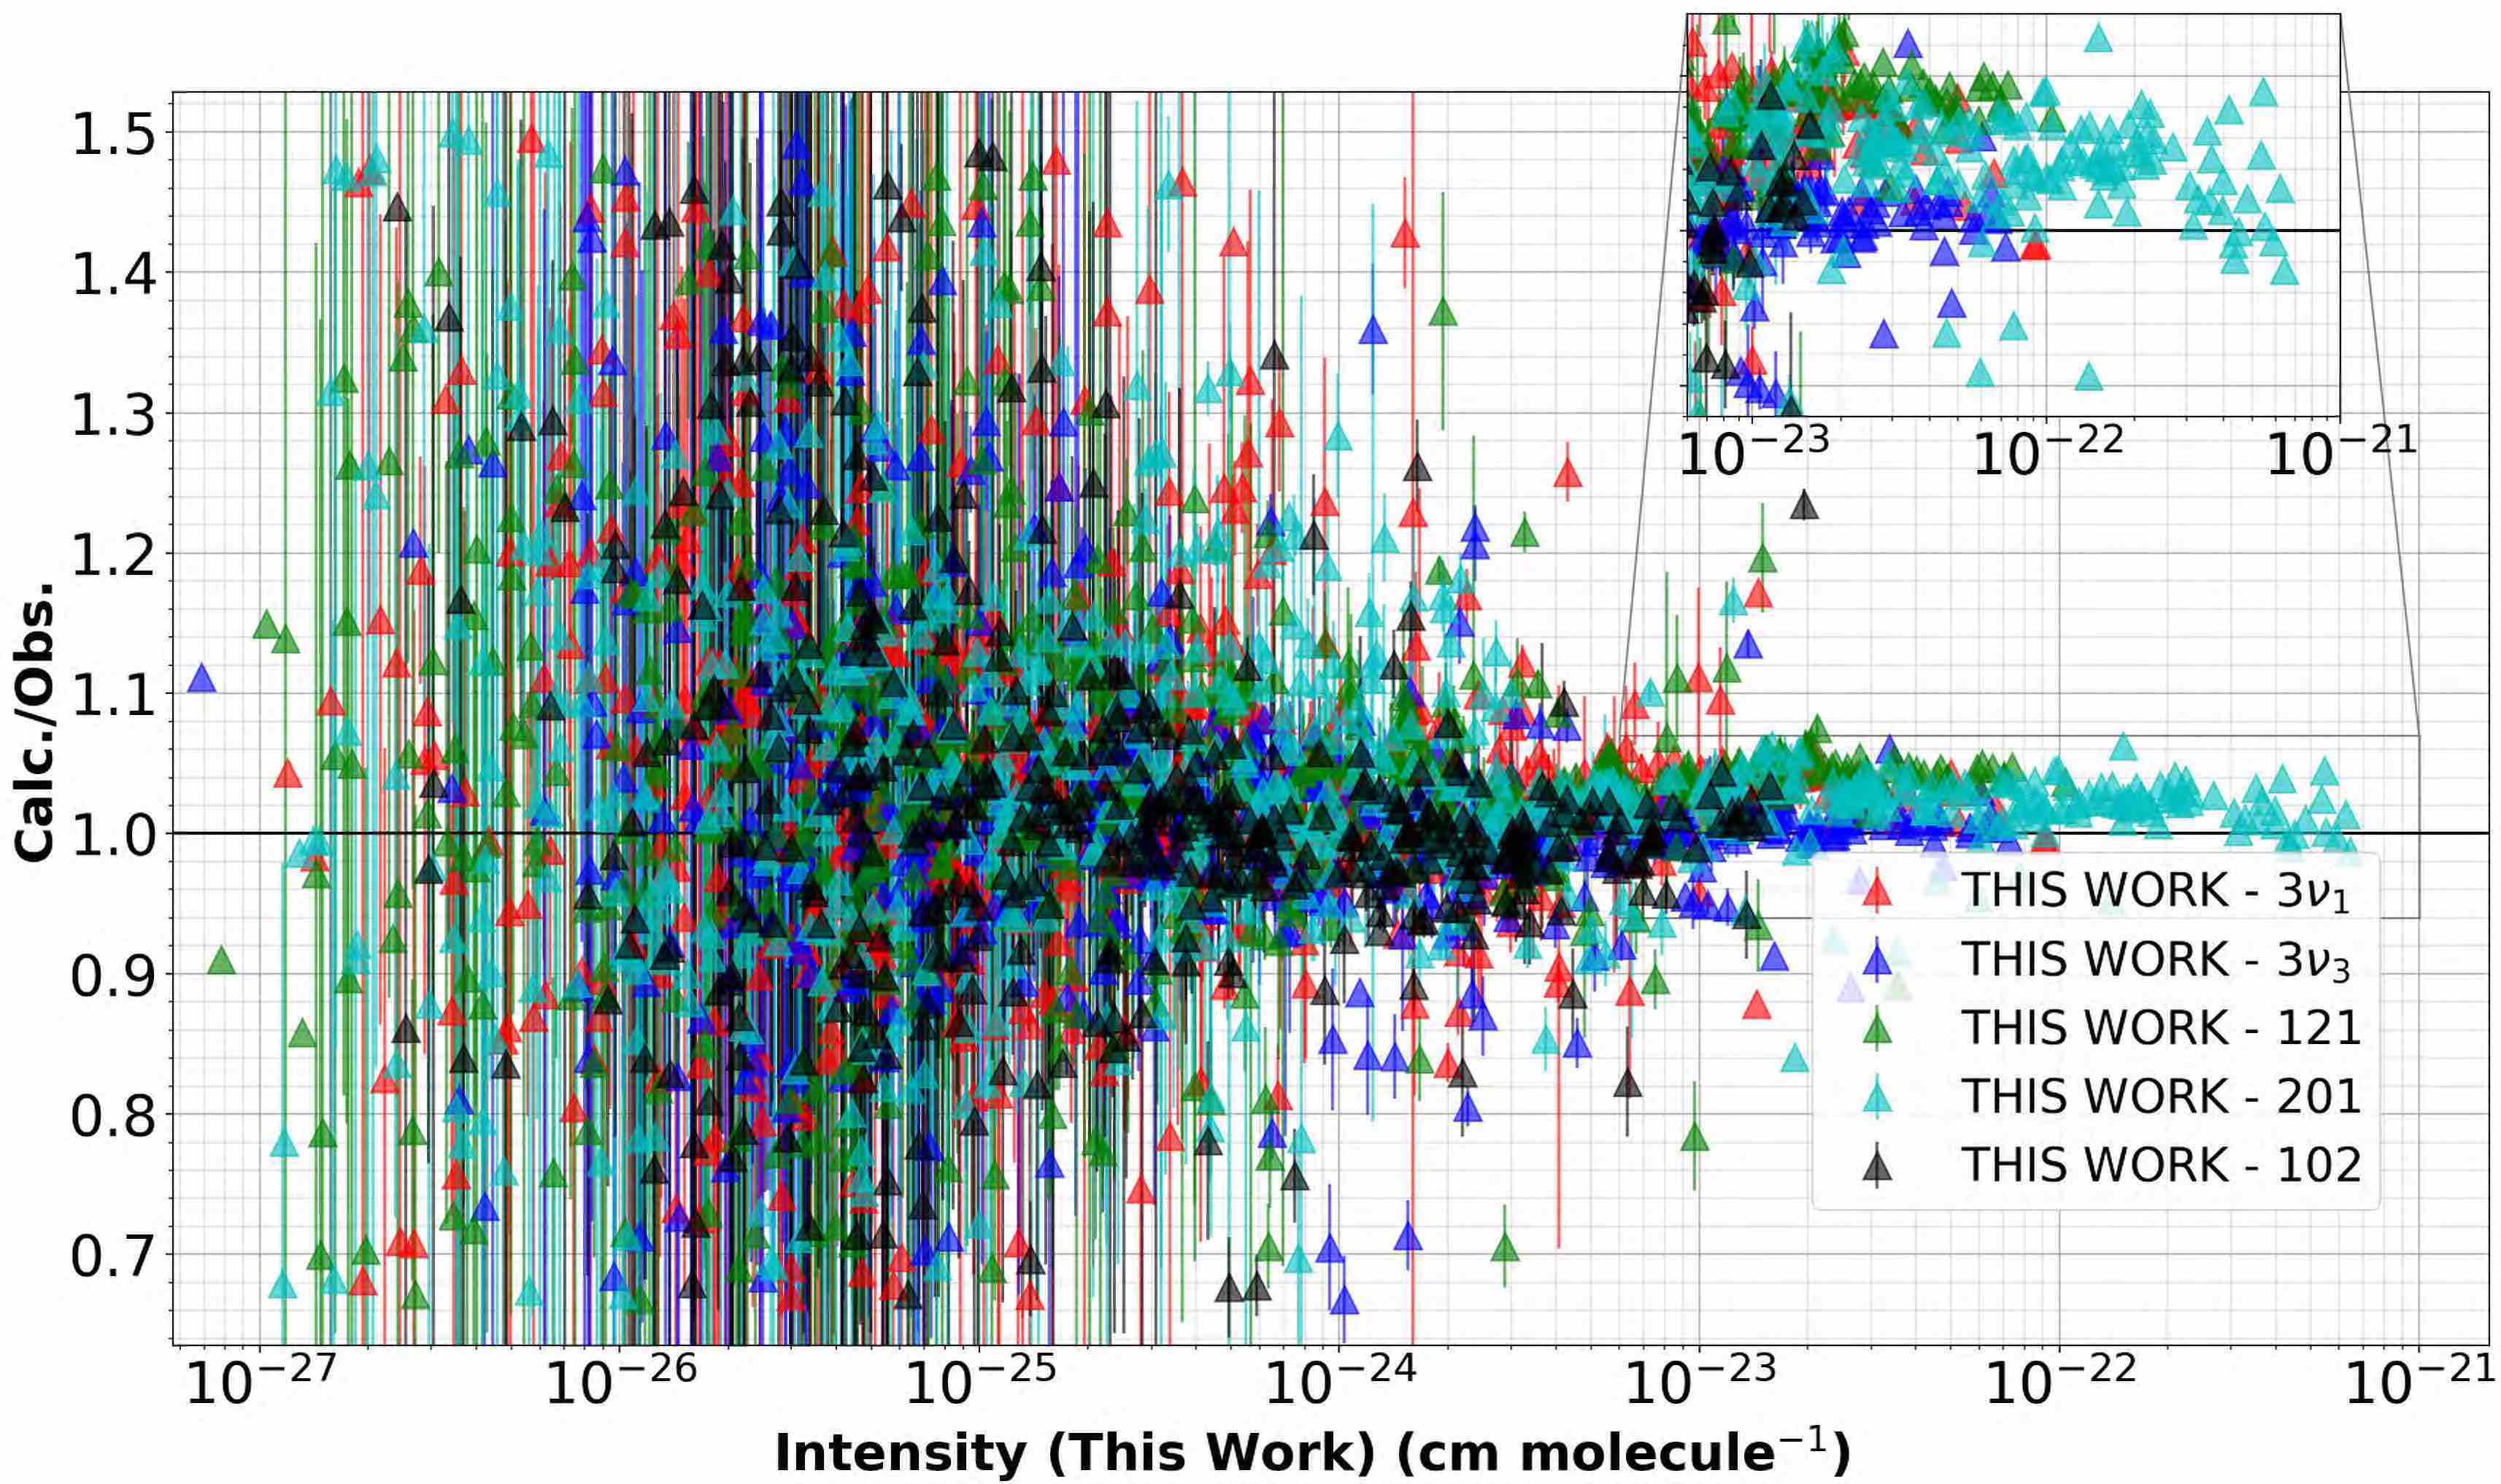
For transitions with intensities greater than 10-24 cm molecule-1, there are a large number of scattered ratios, which is concerning given these lines are relatively strong. Other comparisons in this study do not show scatter for such strong transitions, which suggests that the uncertainty on the measurements should be larger than reported. The results certainly question the use of Tolchenov et al. data for those transitions with intensities below 10-25 cm molecule-1, which dominate the visible/UV spectrum, although high resolution experimental studies of this region are available [67, 68, 69, 70].
Tolchenov et al.[5] is the only non-ab initio source of intensity within the HITRAN2016 database for transition frequencies in the visible. Intensities in this region are in the range of 10-25 cm molecule-1 - 10-27 cm molecule-1 and considering the results we obtained in our previous comparison to those Tolchenov et al. infrared measurements, no conclusion could be made from a line-by-line intensity comparison as ratios were scattered throughout the visible. However, for the 3569 transitions that we matched with in HITRAN2016, we observed that POKAZATEL lacks approximate labels for most upper energy states (which are simply denoted by the rigorous quantum numbers , parity, ortho/para) for transitions occurring above 20000 cm-1.
We instead decided to calculate air broadened cross sections using the HAPI[71] program with the Voigt profile. However, all transitions in HITRAN2016 and HITEMP2010 contain both air and self broadening parameters, whilst POKAZATEL and our line list do not. In order to facilitate an equal comparison, equal broadening parameters should be used across all sources, hence we apply approximate broadening co-efficients to each transition that are calculated as a function of and [36].
Lampel et al.[31] showed through atmospheric observations, that the visible region between 20200 - 21500 cm-1 was modeled better by HITEMP2010 than POKAZATEL.
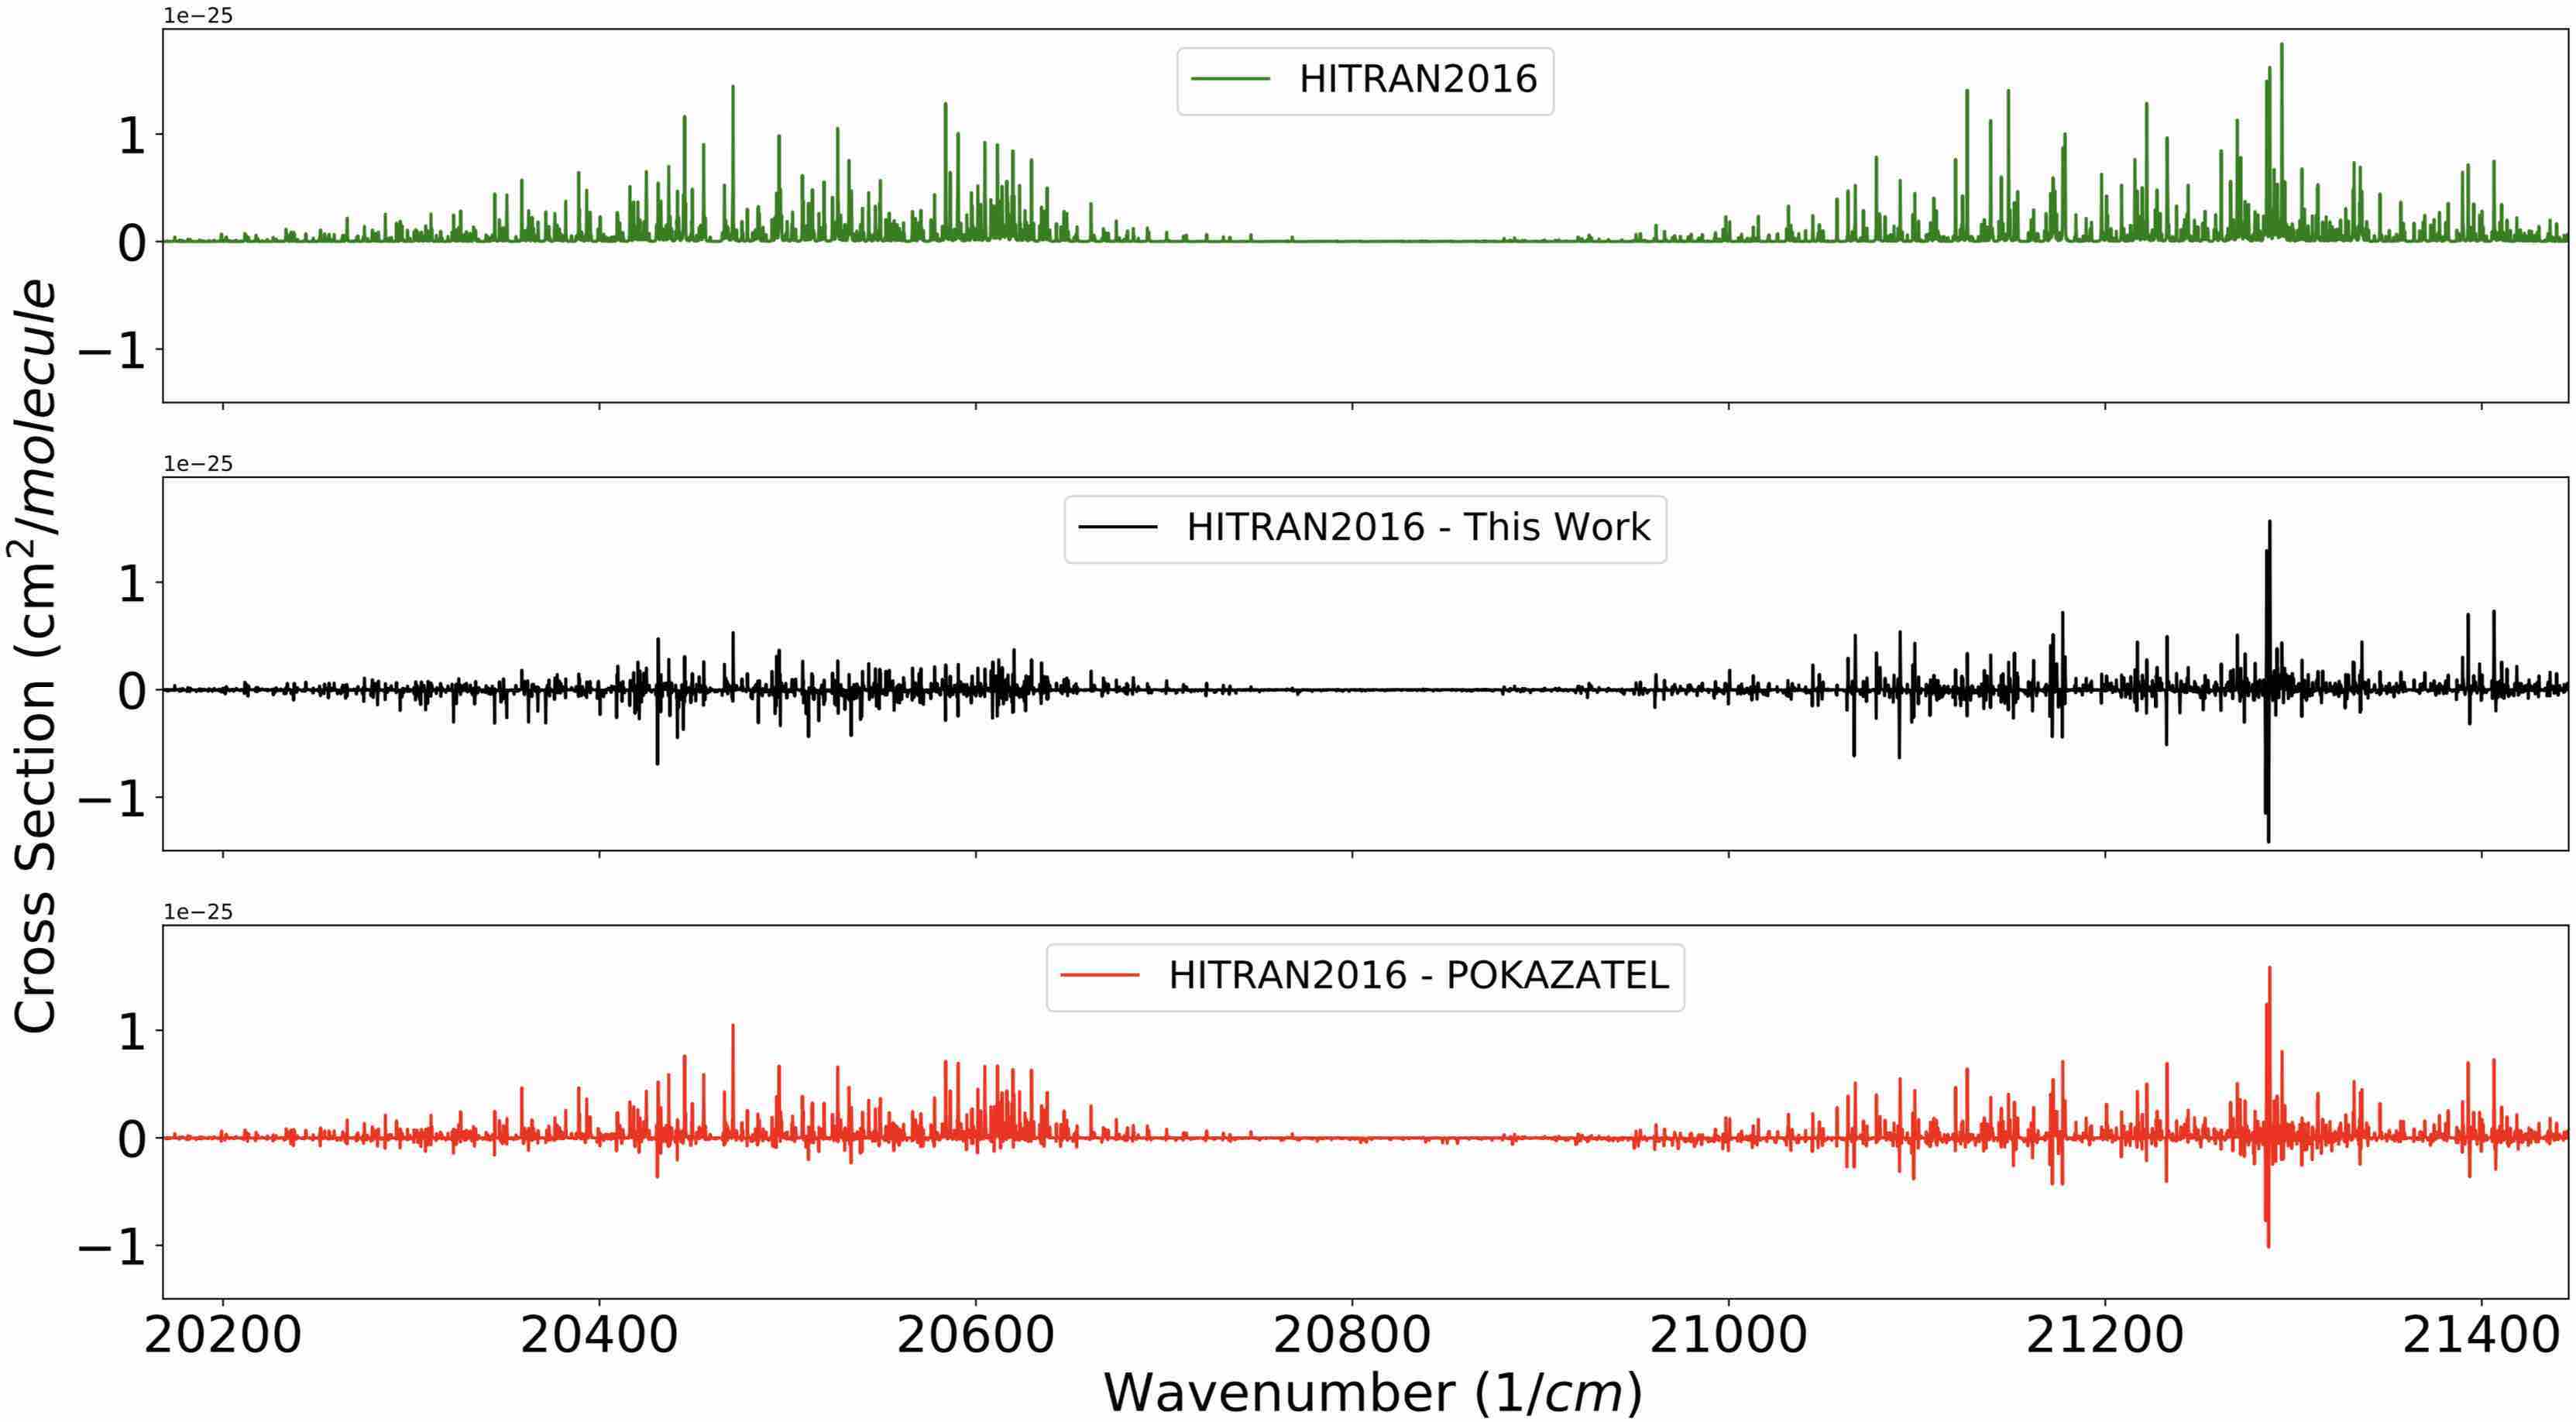
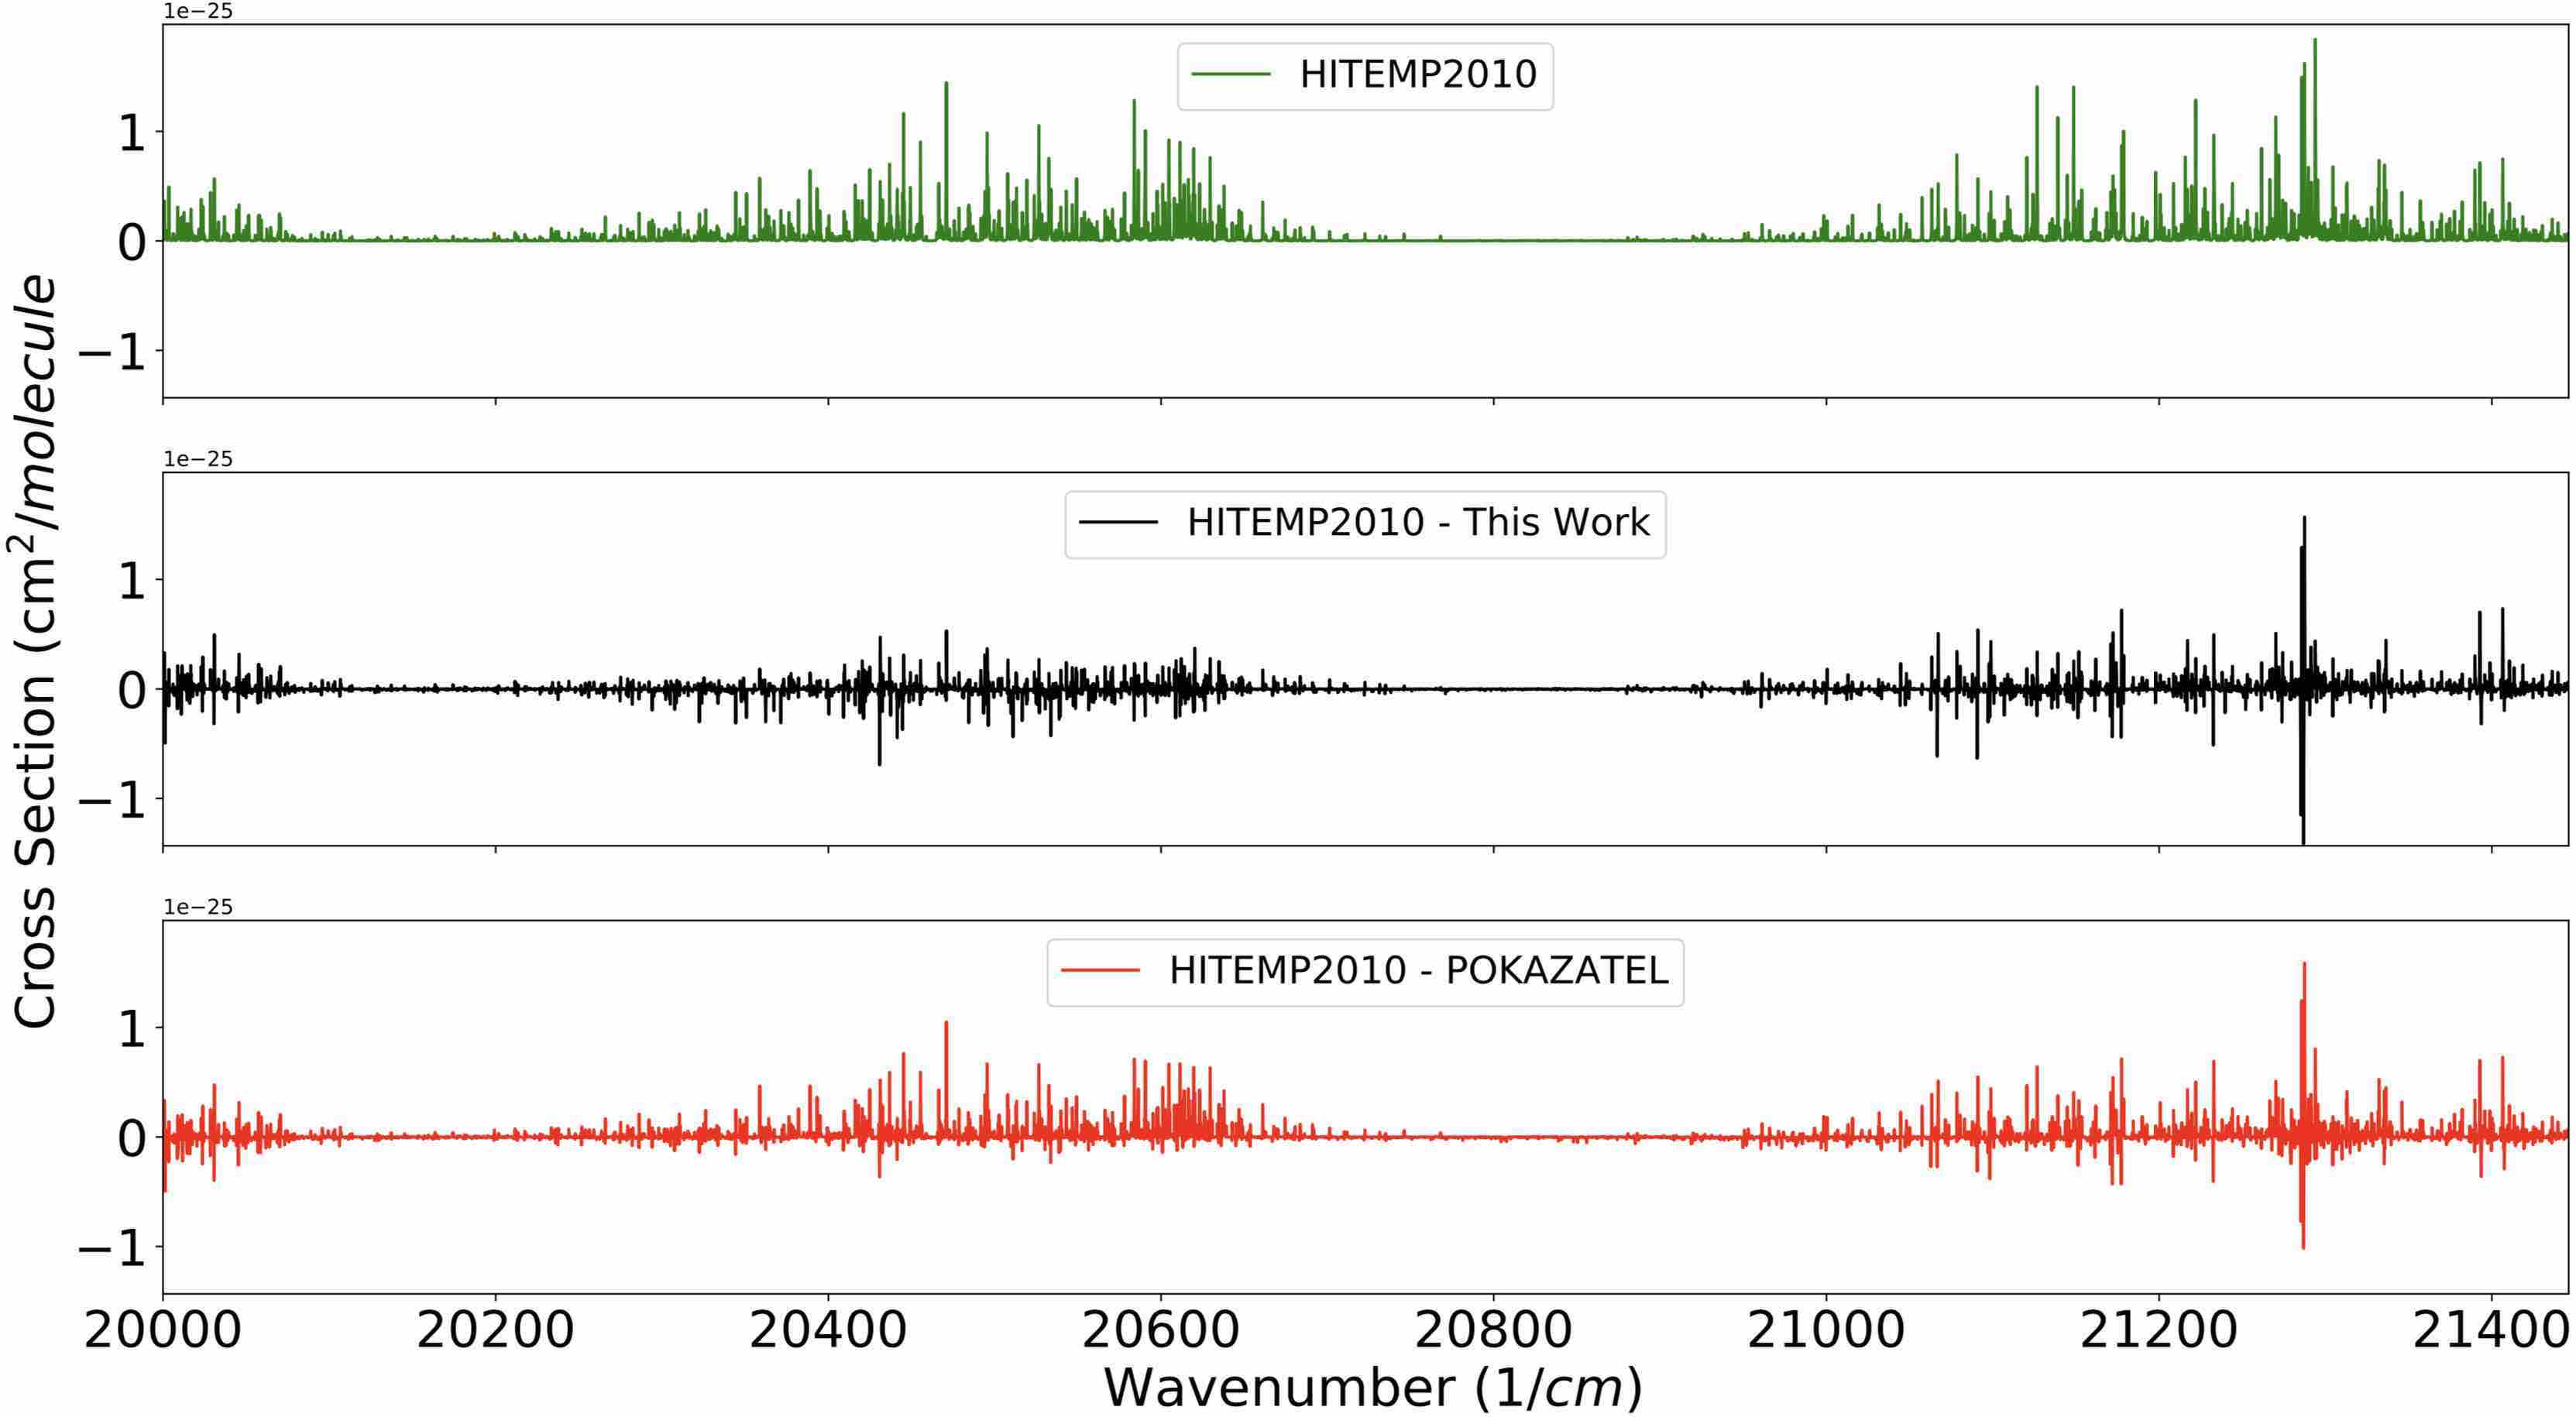
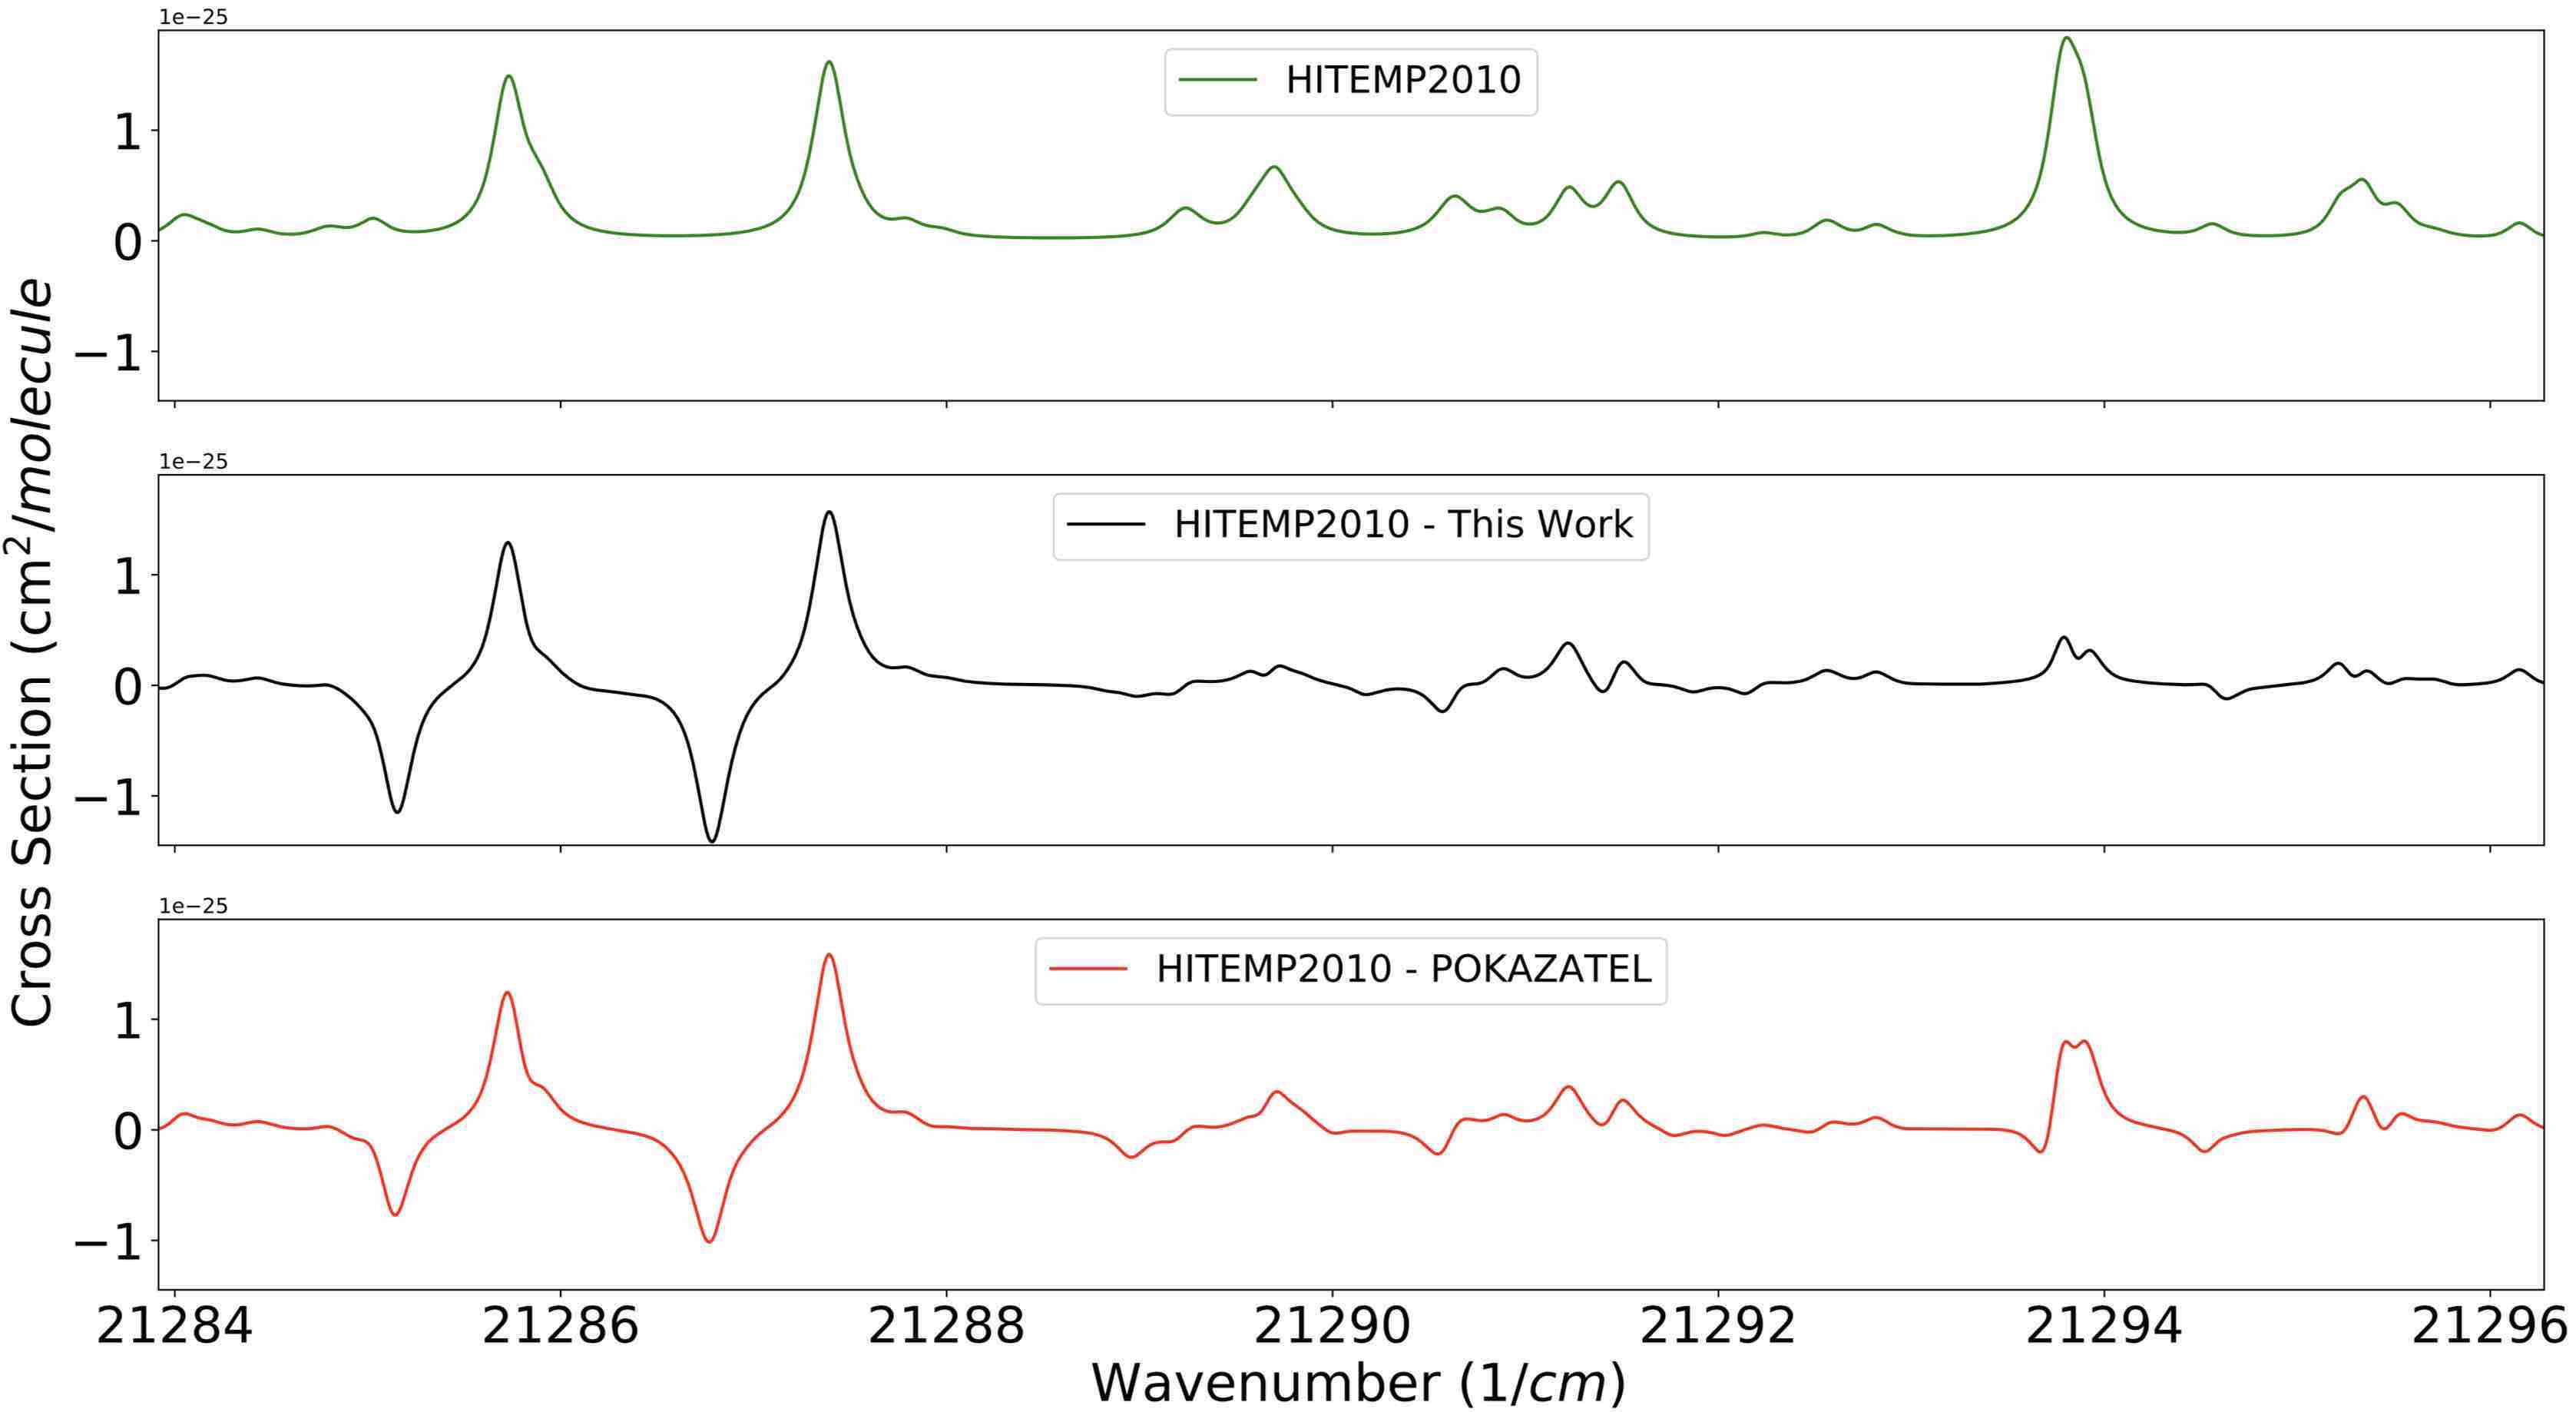
Figures 8(a) and 8(b) present residuals obtained from subtracting the theoretical cross sections produced from both POKAZATEL and our line list from those obtained using HITRAN2016 and HITEMP2010. For the first region of absorption between 20200 - 20800 cm-1, our line list clearly possesses significantly lower residuals than POKAZATEL when comparing to both HITRAN2016 (Figure 8(a)) and HITEMP2010 (Figure 8(b)). The residuals are also smaller when comparing with HITEMP2010 rather than HITRAN2016.
For the absorption region located in the interval 21000 - 21500 cm-1, our new line list also provides better agreement to both HITRAN2016 and HITEMP2010 over POKAZATEL, with the exception of line position differences occurring in our comparison to HITEMP2010, located at approximately 21285 cm-1, seen in Figure 8(b). This feature is common to both theoretical line list residuals, see Figure 8(c). Considering this feature is not present in the comparisons to HITRAN2016 data, it is clear that some line positions in the visible spectrum of HITEMP2010 need updating. This is not surprising as HITRAN2016 has seen two updates since HITEMP2010 was introduced: HITRAN2012 and HITRAN2016.
3.2 H218O
Calculations from Lodi and Tennyson [74] make up the majority of the HITRAN2016 database for H218O. The DMS used in their work is very similar to the DMS used in the creation of the POKAZATEL line list: they are both fit to the same electronic structure data points. Comparing our work to their H218O data in HITRAN would yield near very similar results to those previously seen for POKAZATEL in H216O, particularly in the IR. In the visible, one expects the differences to become more apparent.
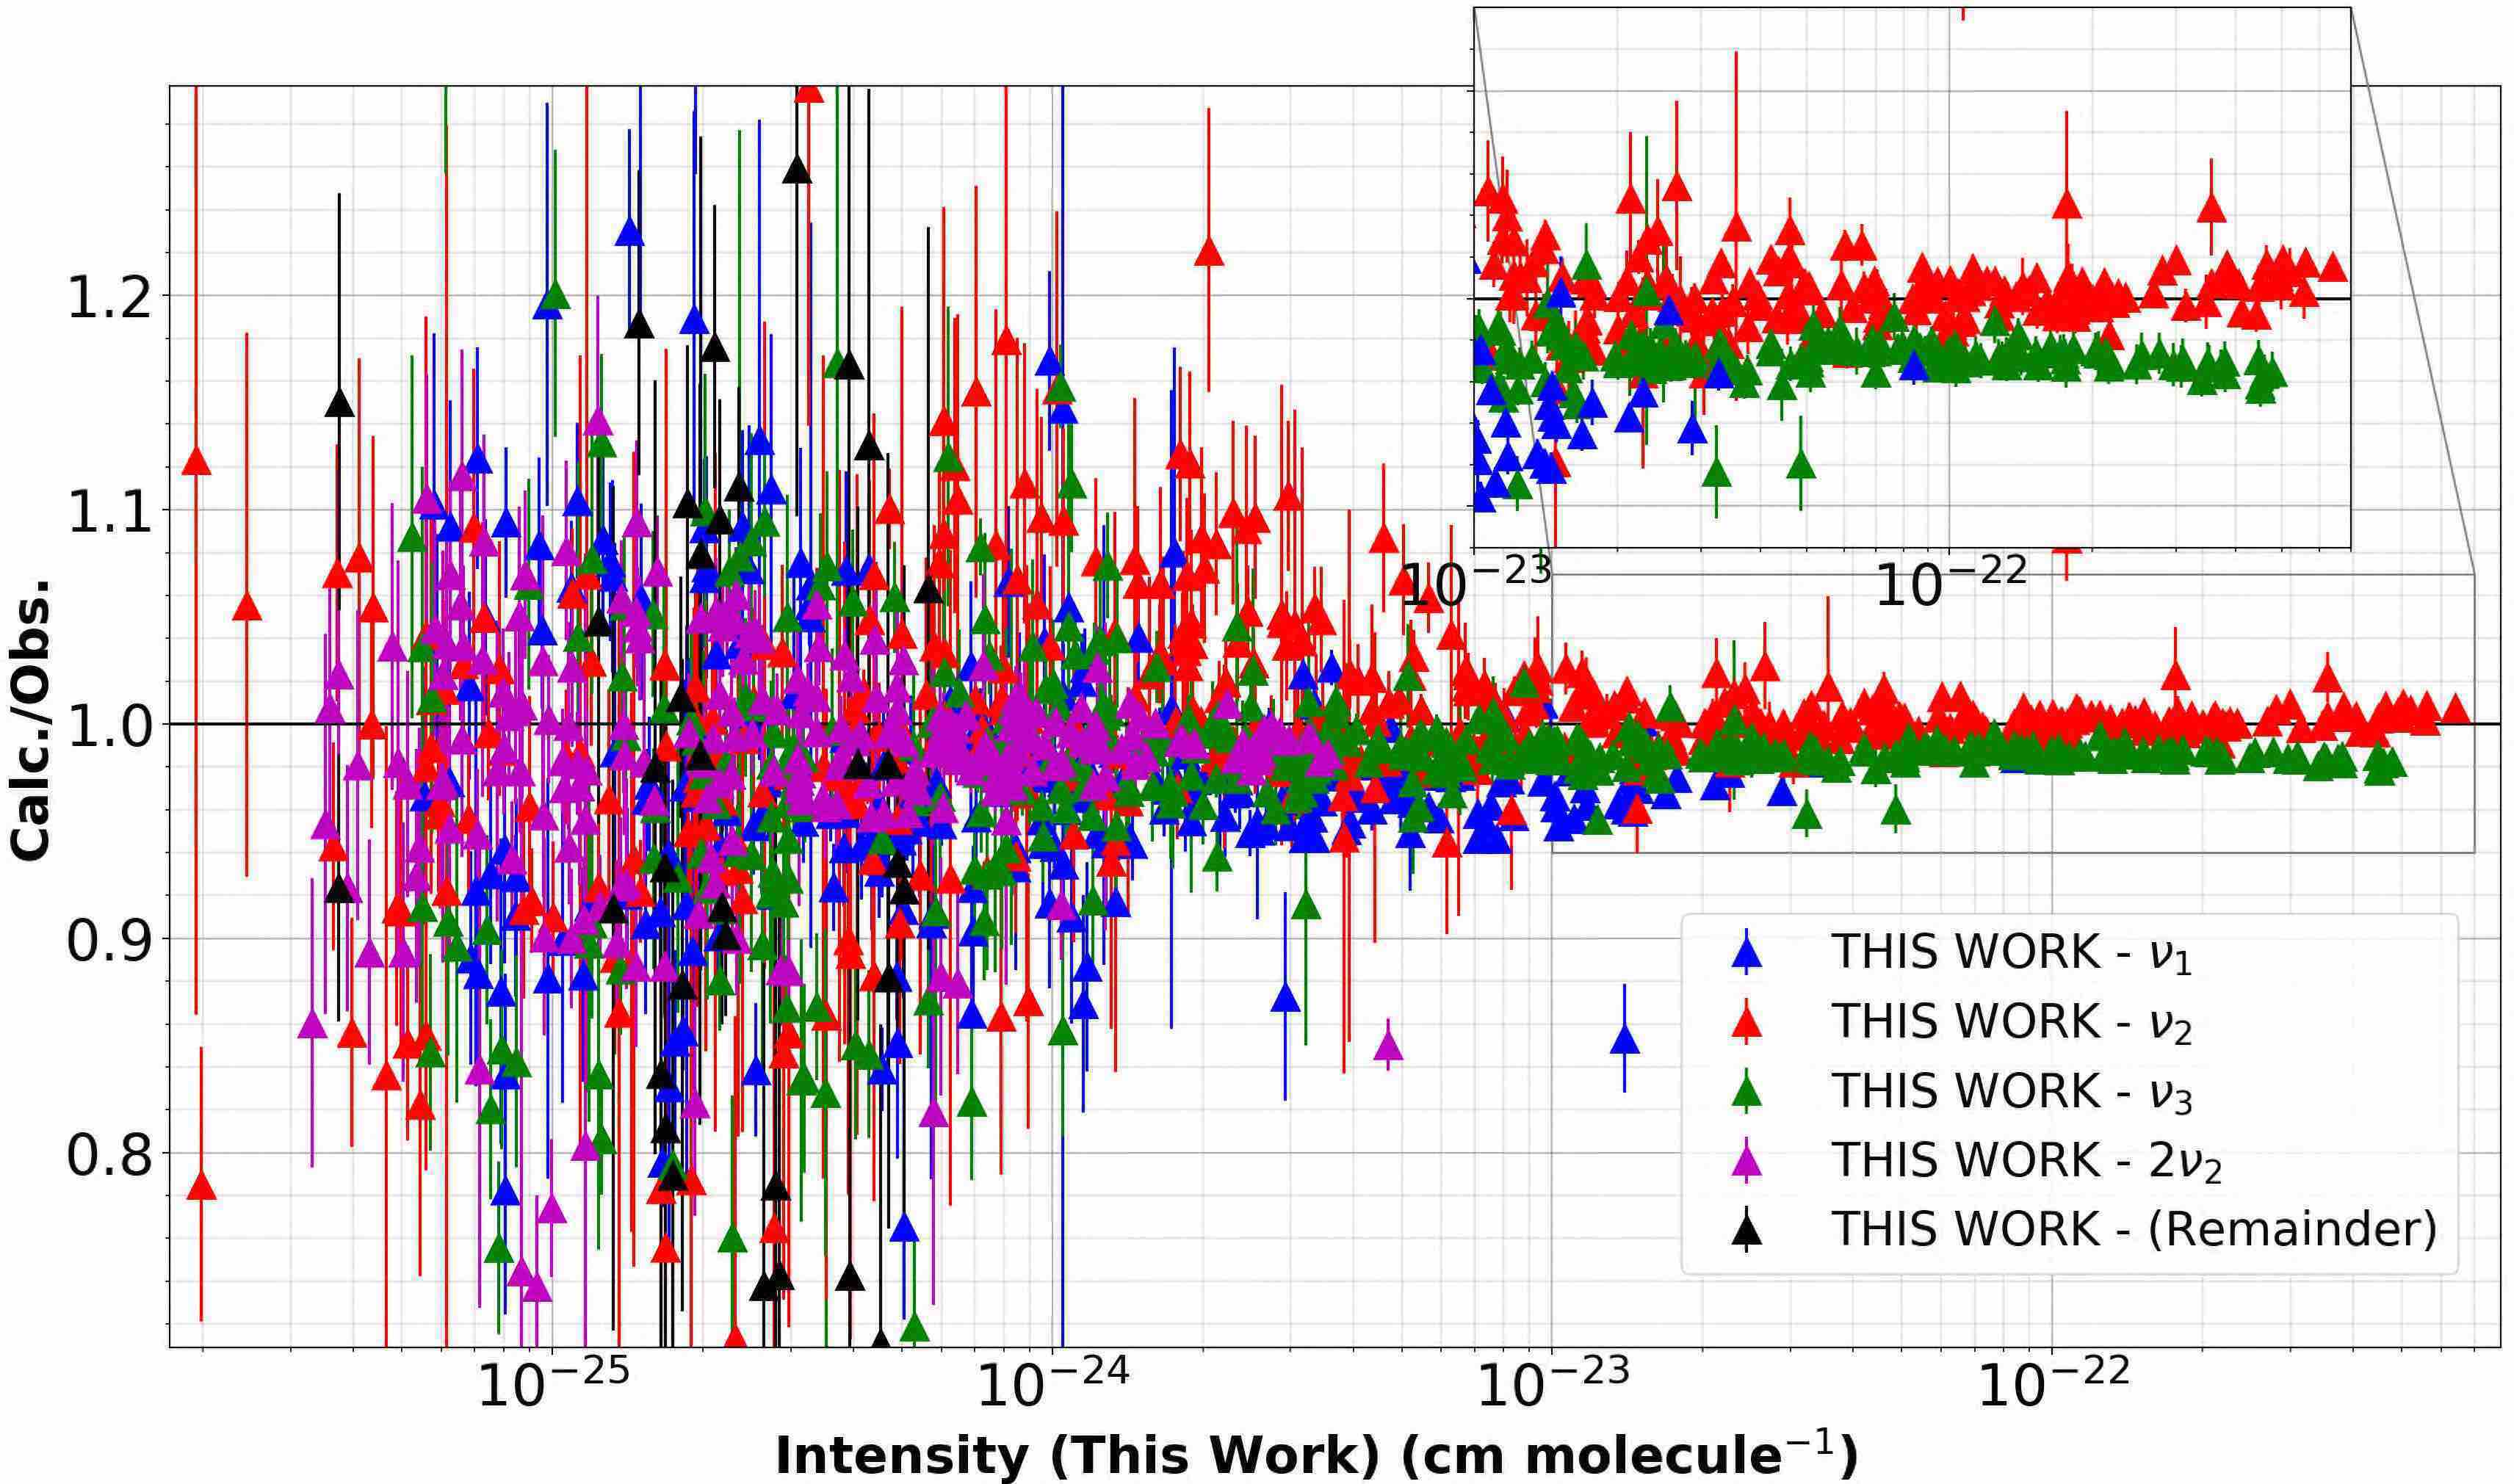
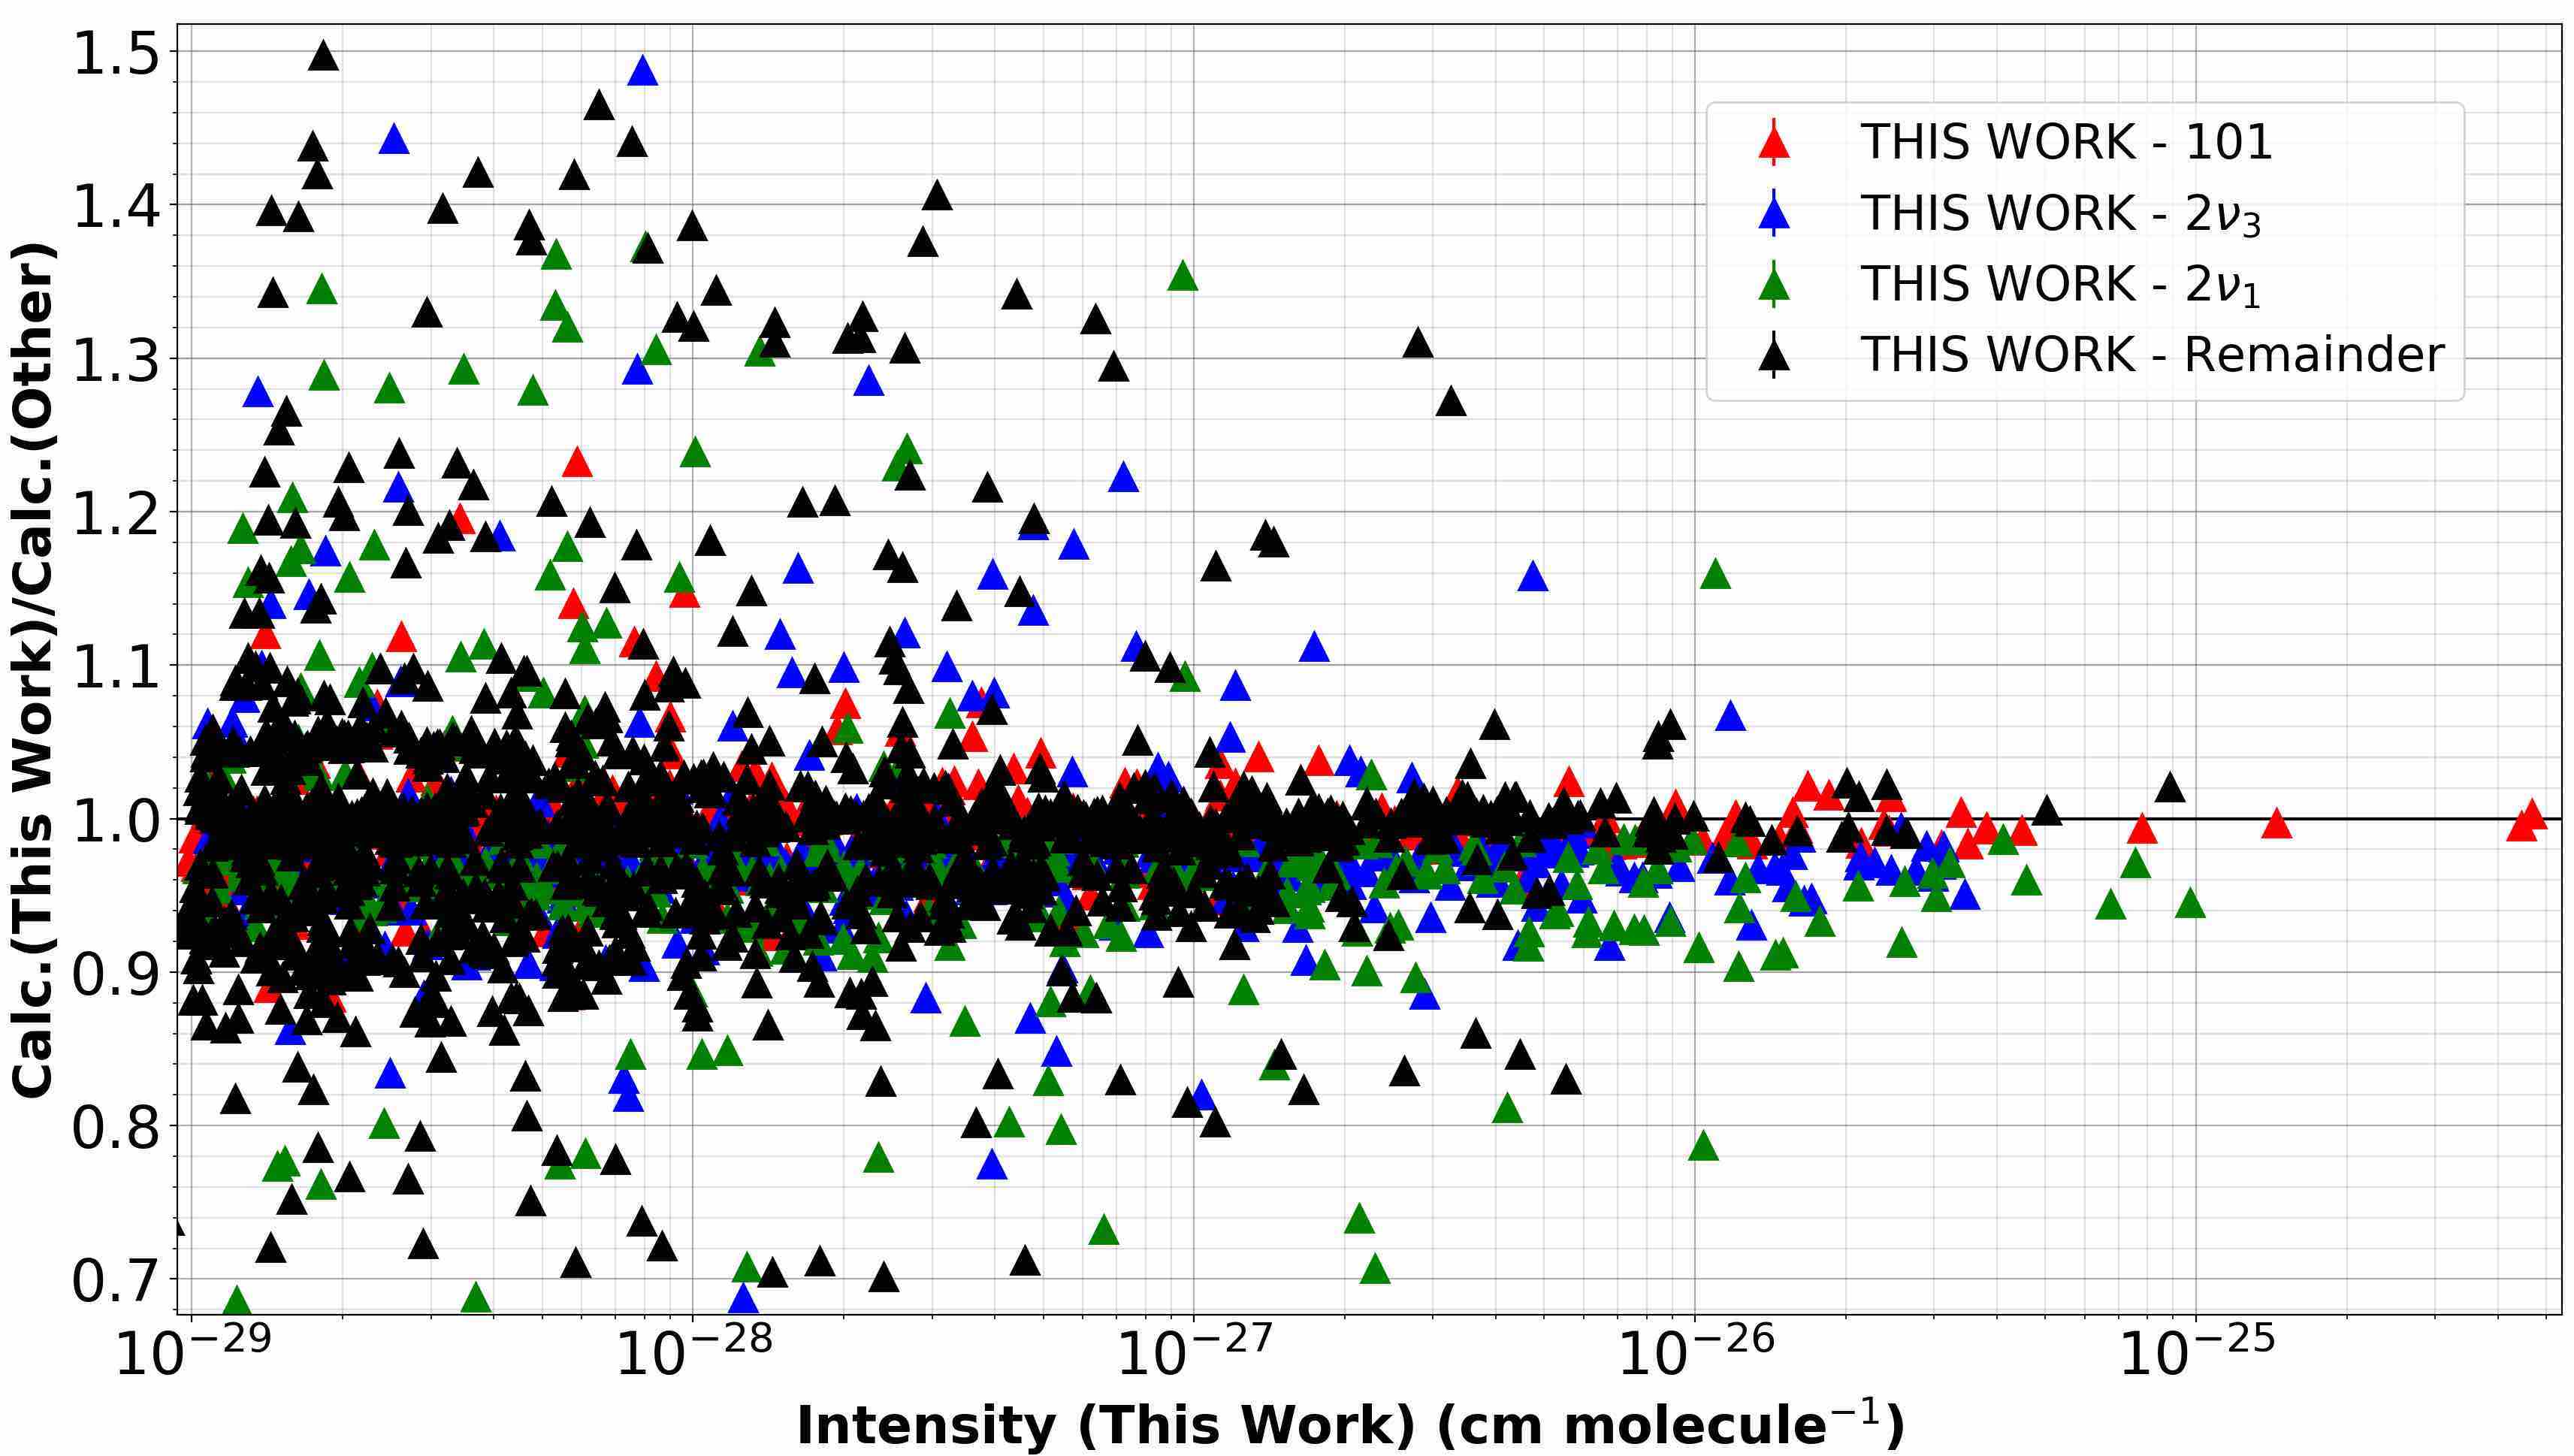
Loos et al. and Birk et al. [34]also measured intensities for H218O in the infrared region 1260 - 3995 cm-1 and from HITRAN2016, we compare with 1387 of these. The resulting ratios are presented in Figure 9(a) and are very similar to those shown in Figures 3(a) and 3(b) where we compared to their H216O measurements. This result was expected as our theoretical models for H216O and H218O use potentials from the same source, and the same DMS. This result simultaneously highlights the high quality of their experiment, as well as the stability of our calculations across isotopologues.
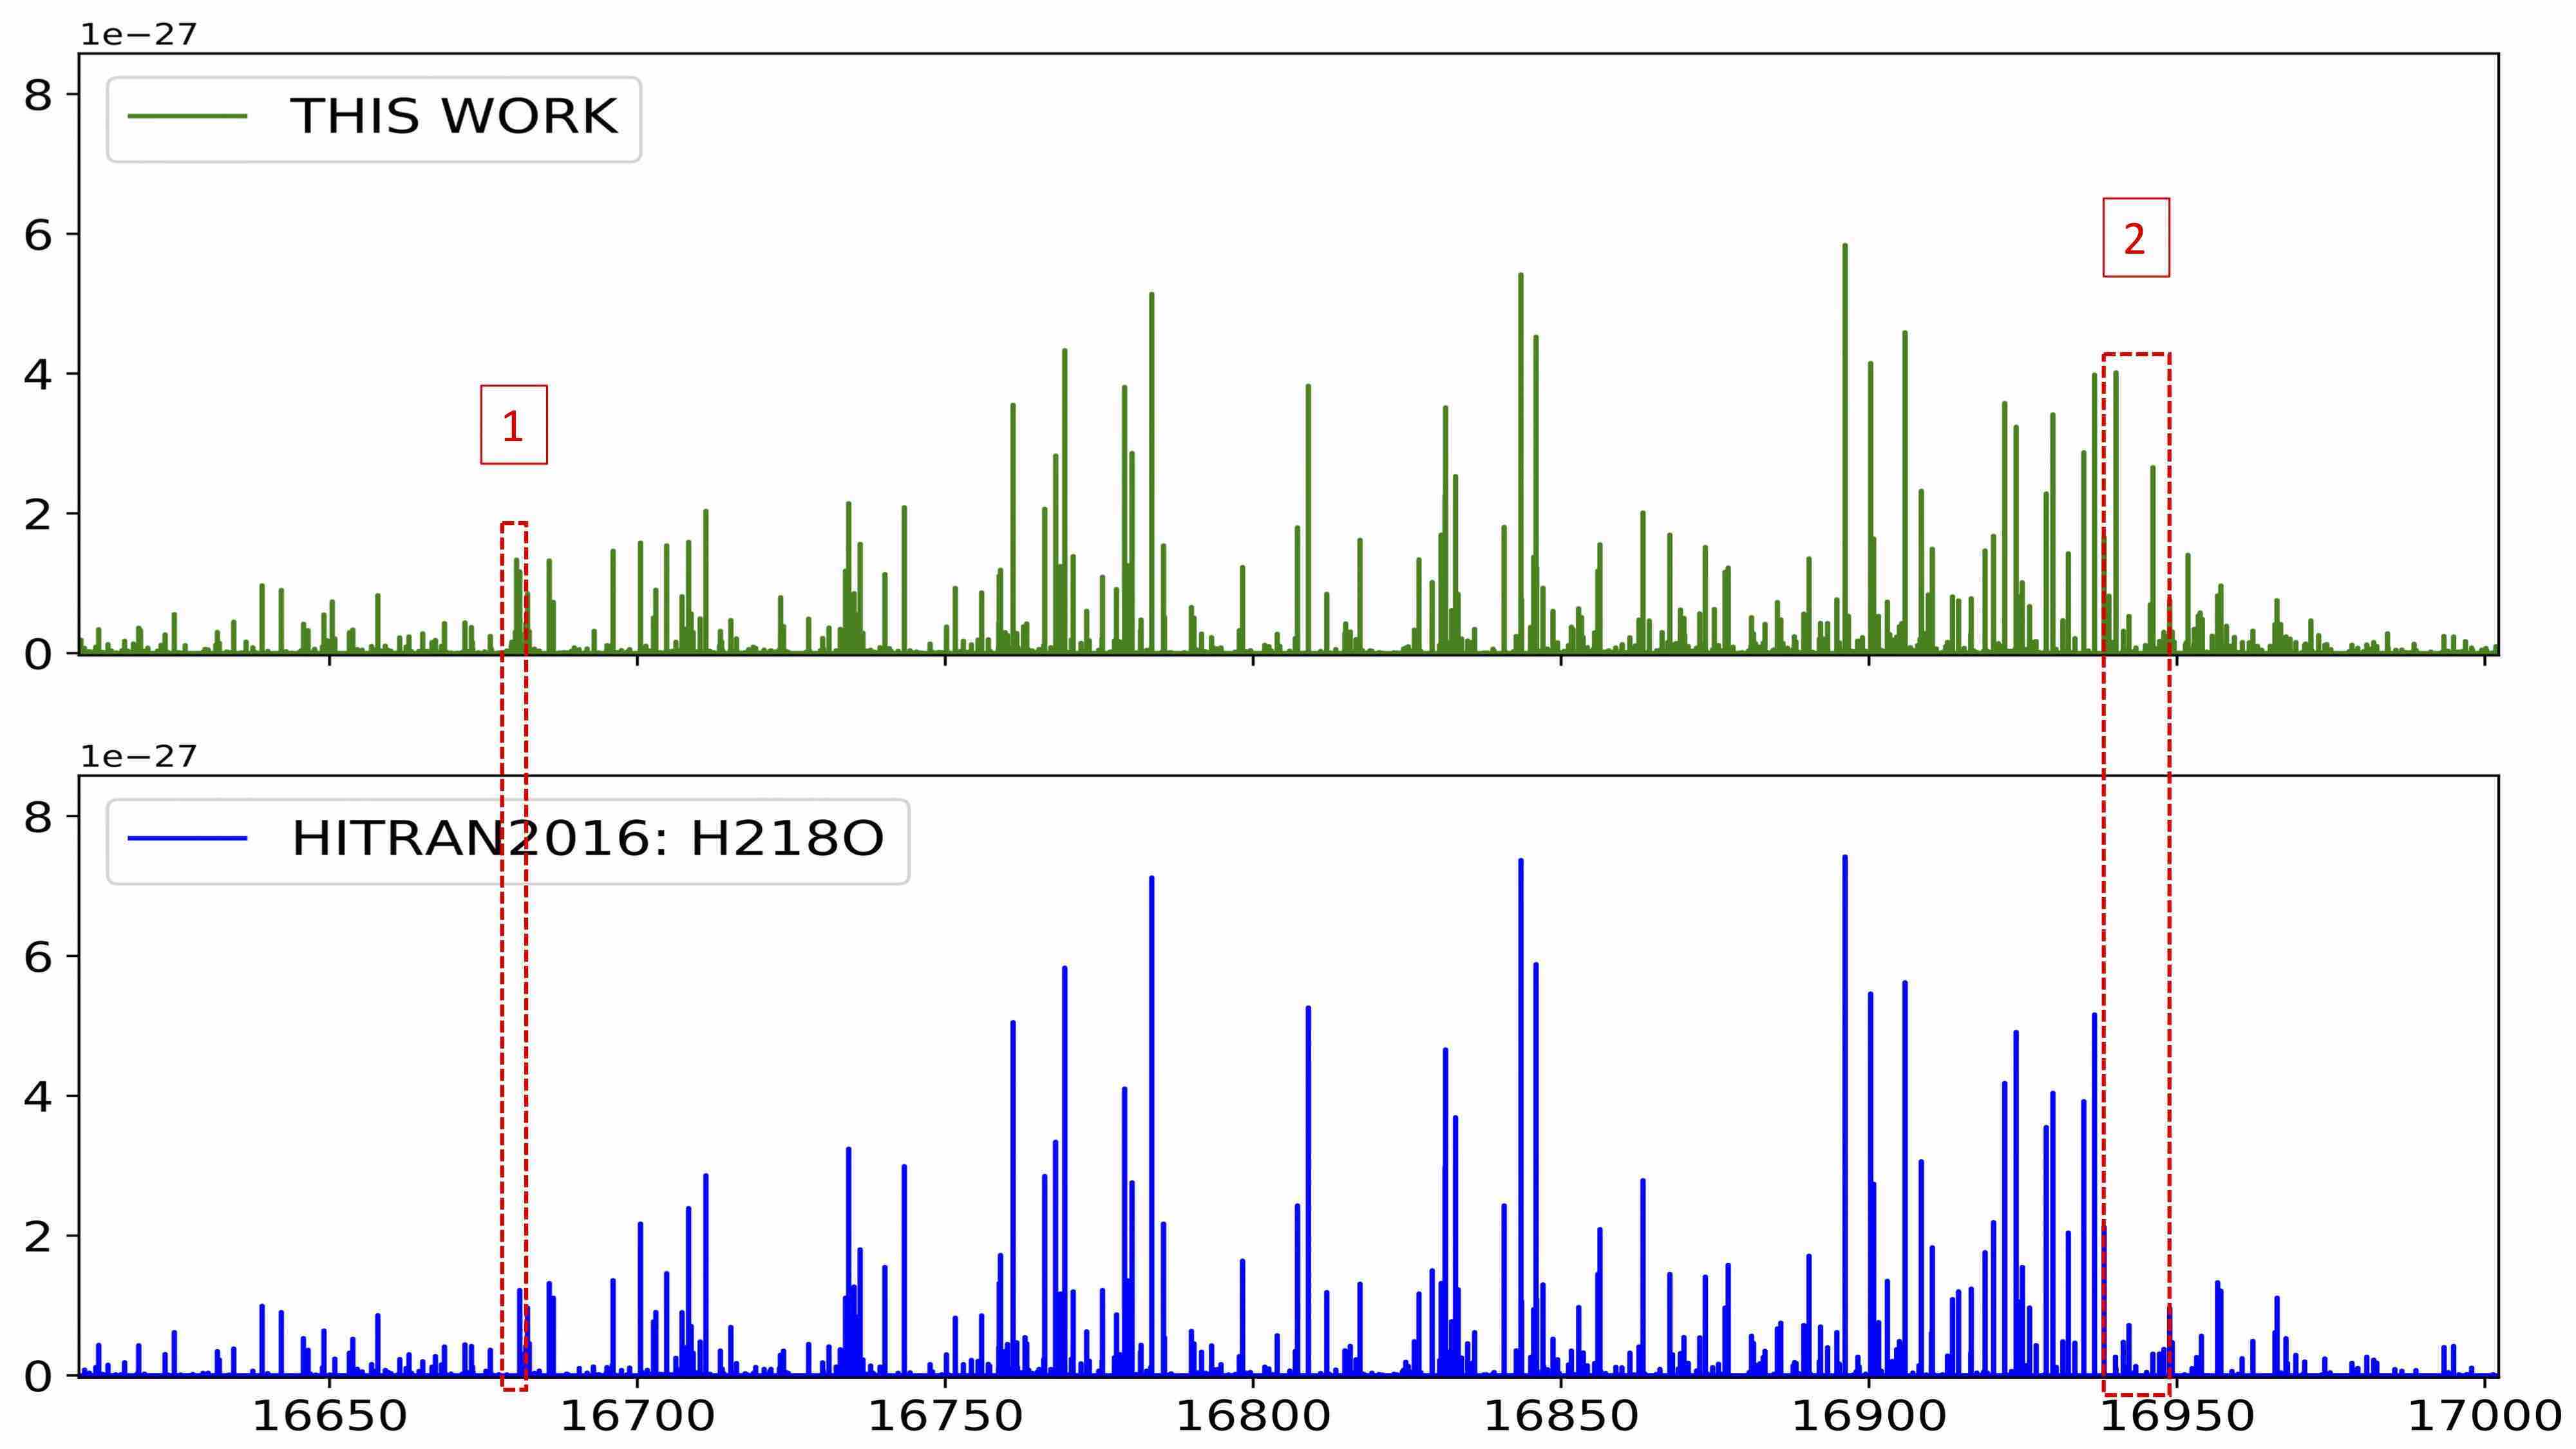
As expected the Lodi and Tennyson [74] line list exhibits larger intensity errors in the visible as was seen by Mikhailenko et al. [16] in their measurements of H218O spectra in the 16460 - 17200 cm-1 interval. The data of Lodi and Tennyson was found to be incomplete in this region, with several strong lines and countless weak transitions missing. On top of this, several strong transitions appeared to be consistently too strong. We have compared to HITRAN2016 in the region of interest and the same conclusions are made, see Figure 10. The red boxes in Figure 10 are an example of missing strong lines in the database, most identified by Mikhailenko et al.
The ab initio intensities from Partridge and Schwenke [73] form a large fraction of HITRAN2016 between 7000 - 8339 cm-1. We compare with 2280 of these with intensity ratios presented in Figure 9(b). In general, the agreement is excellent, although there does appear to be a small systematic shift.
For H216O, the agreement between our line list and the observed data of Toth et al. present in HITRAN2016 was very good, see Figure 3(a). This does not appear to be the case for H218O, Figure 9(c). We compare with 713 transitions in the region of 7000 - 7678 cm-1, all taken from HITRAN2016. As previously explained for H216O, these intensities are measured, not calculated. The intensity ratios appear significantly more scattered than those of H216O, a feature that is most likely introduced from the experimental data.
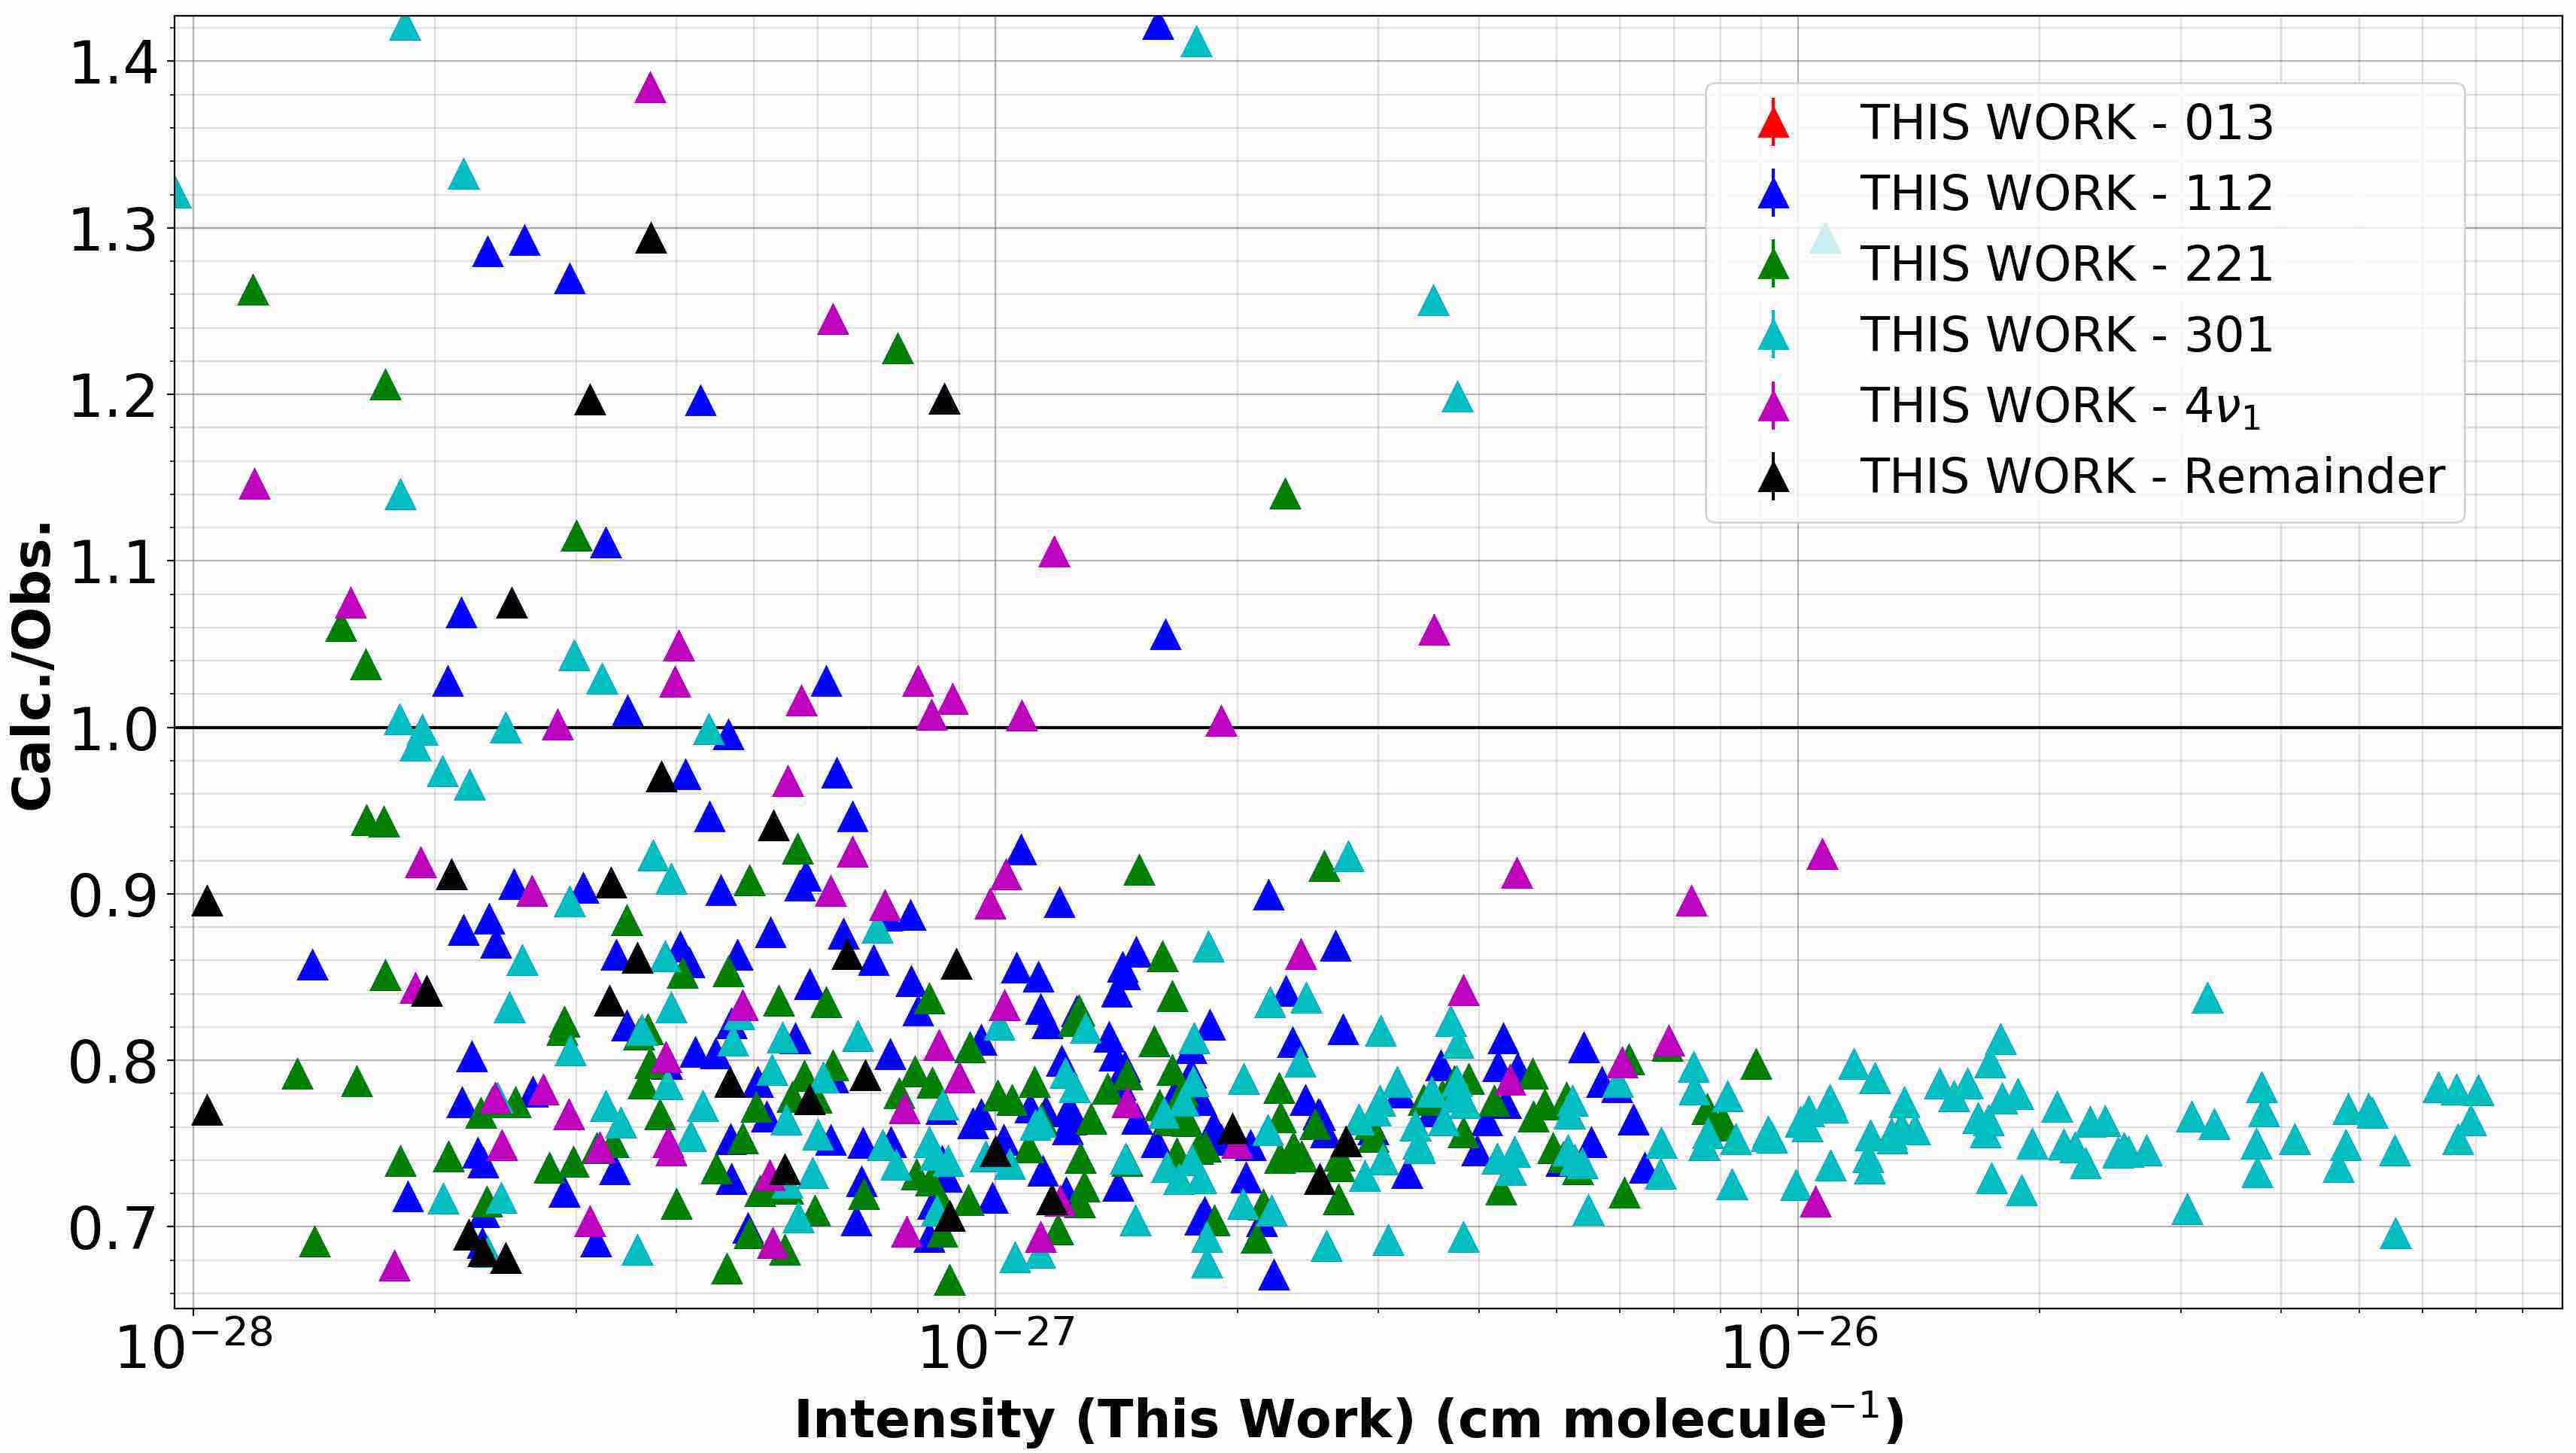
Tanaka et al.[72] analyzed H218O spectra that was previously measured at the National Solar Observatory, Kitt Peak. From HITRAN2016, we matched with 549 transitions in the region of 12404 - 14276 cm-1 with the resultant ratios shown in Figure 9(c). The discrepancy is significant and appears to be systematic, with our intensities ’appearing’ to be almost 22% too small. However, we have already compared with H216O intensities in this region, see Figure 7(a), and no 22% shift is observed for the strongest transitions. The results suggest that there may have been an error in the evaluation of the abundances within the sample in Ref. [72].
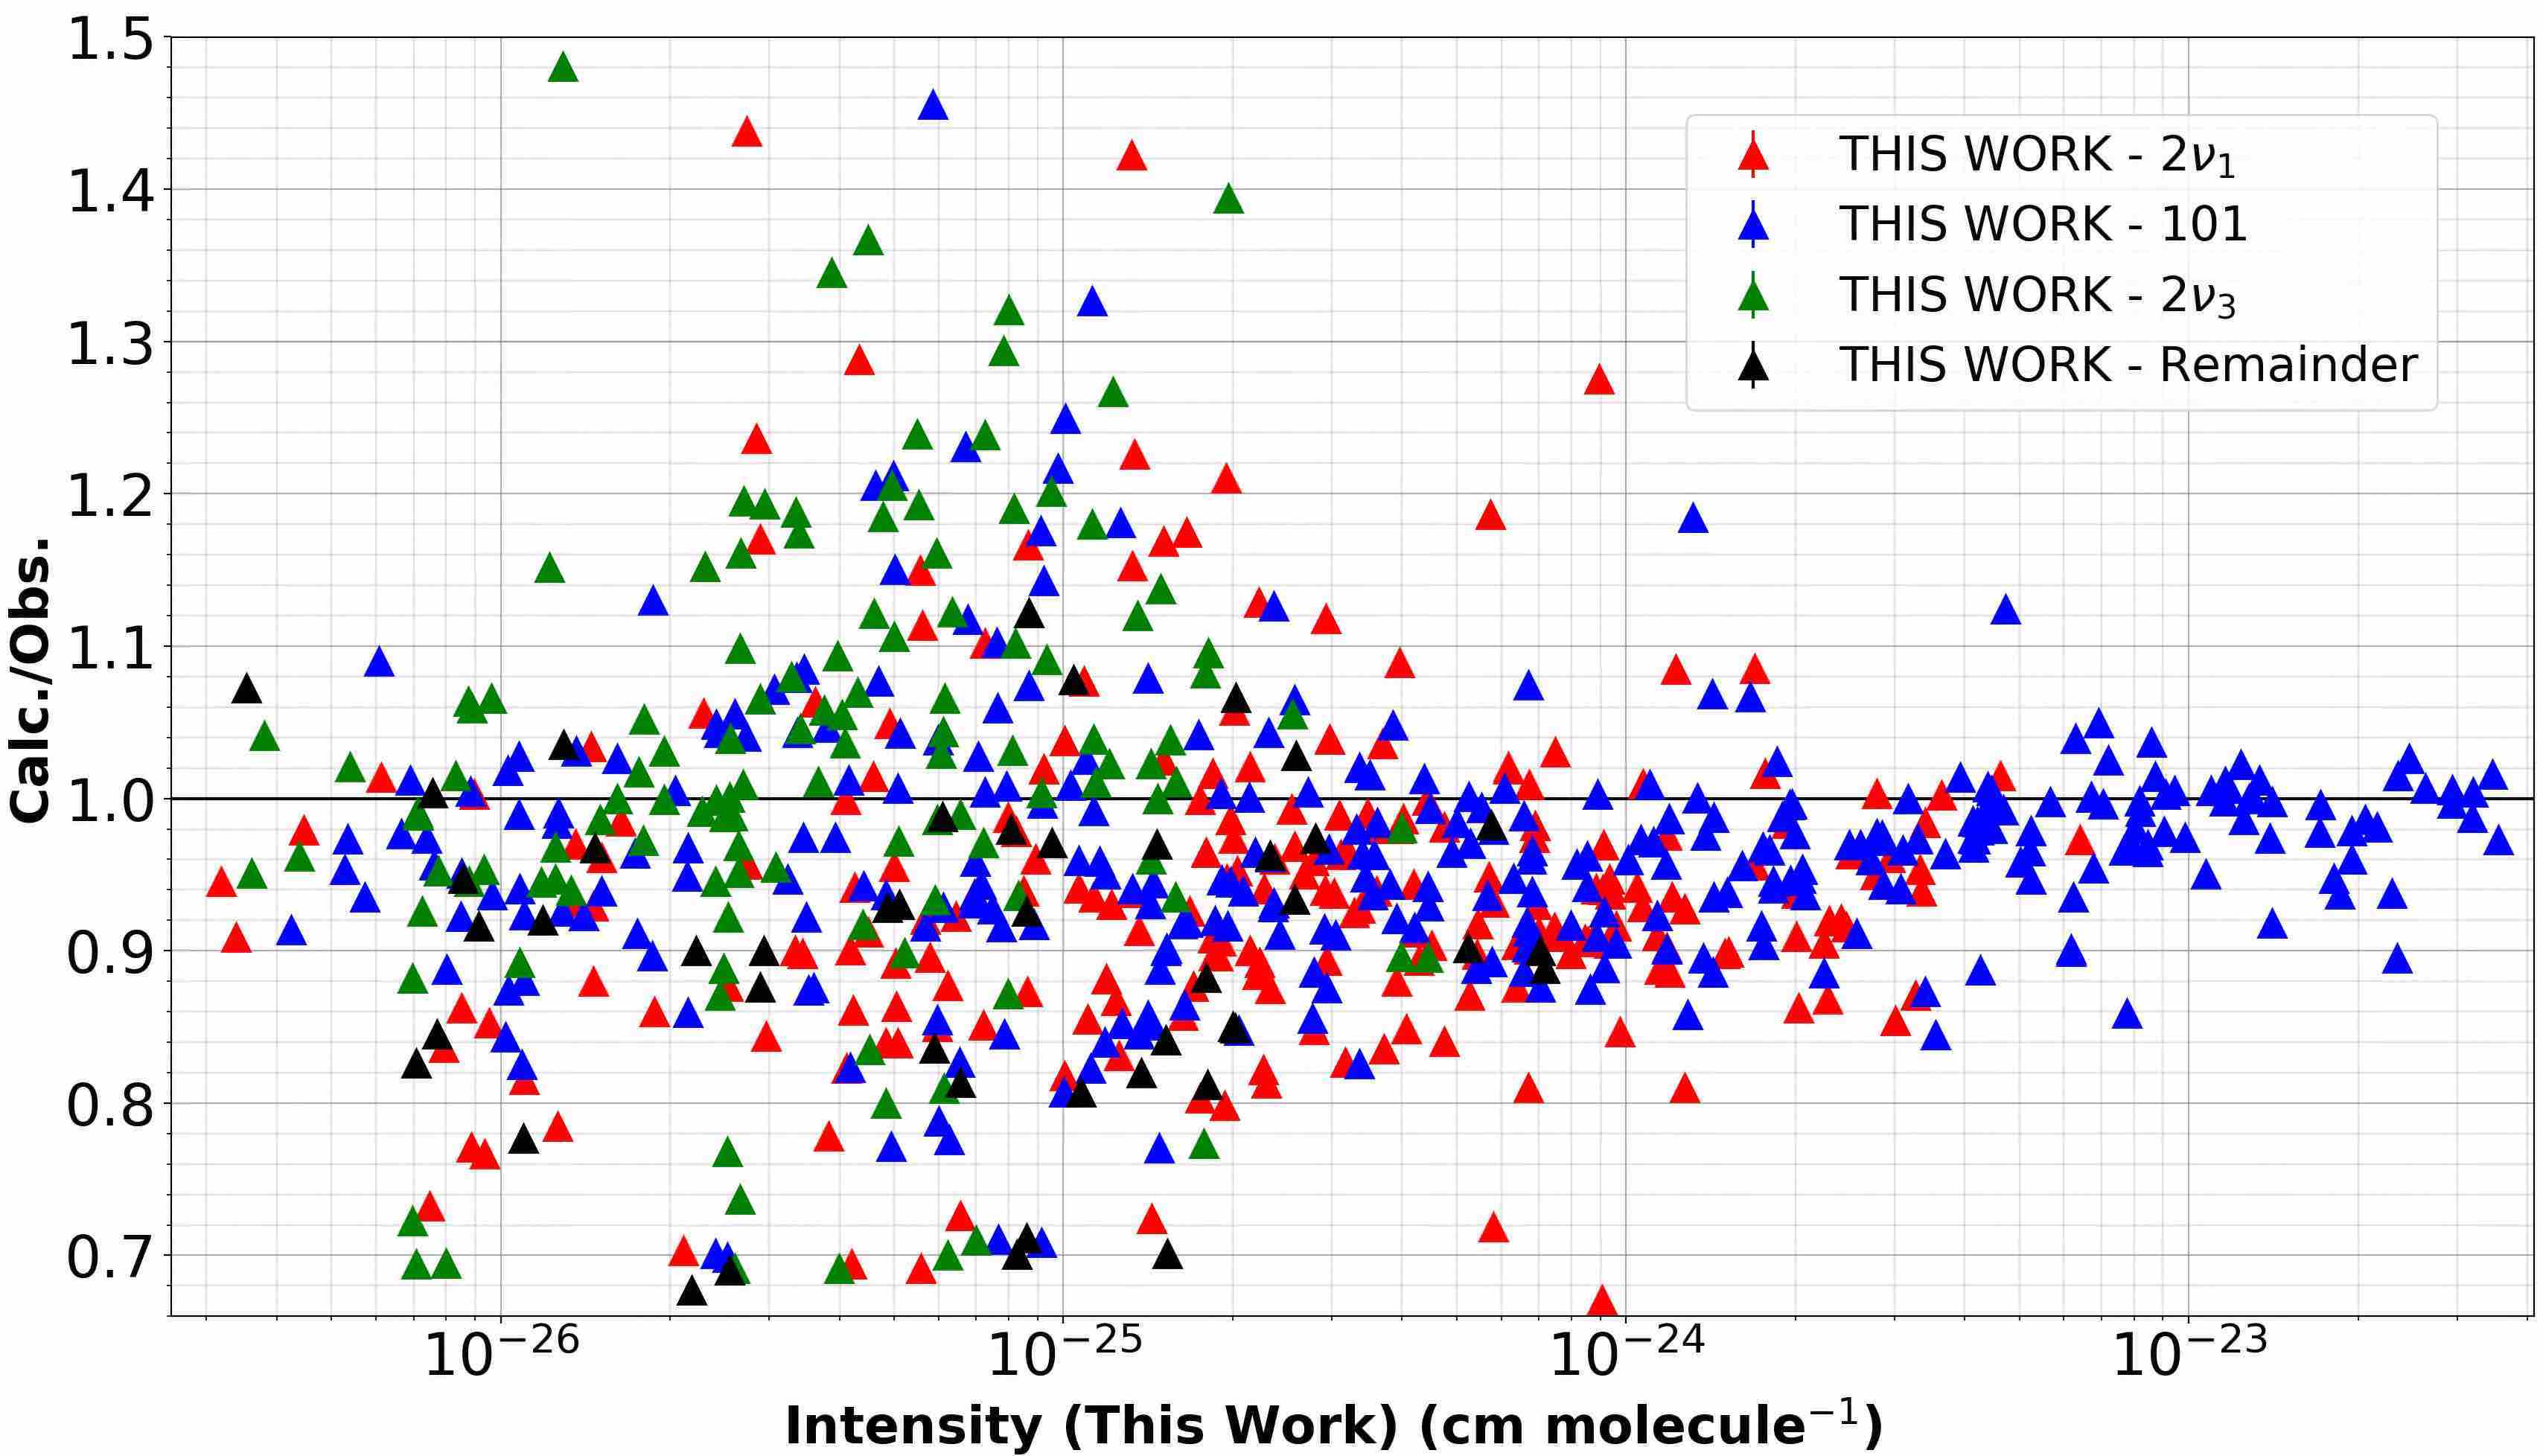
We have previously compared to the calculated semi-empirical H216O intensities of Coudert et al., Figure 1, and both sets of theoretical data are in very good agreement with each other and to the and measured band intensities of Loos et al.. However, for H218O, comparisons indicate that our intensities and those of Coudert et al.[75] are very different, see Figure 11(a). The intensity ratios of the pure rotational transitions appears skewed, and there are systematic shifts in the intensities of both the and bands. This is not seen in our comparison to the same bands observed by Loos et al., hence these deviations must originate from the calculations of Coudert et al.. We note that in our procedure a single model can be used for all isotopologues whereas the method of Coudert et al. requires a separate fit for each one.
We point out that the work of Coudert et al. forms the basis of the GEISA2015 database for H218O. The GEISA2015 article outlines that the data from Coudert et al. reproduces the measured intensities of Oudot et al.[76] better than other ab initio methods available at the time. We thus compare with the measured intensities of Oudot et al. in Figure 11(b). There is little agreement between our work and that of Oudot et al. and ratios in the band are scattered. This behavior was not seen when we compared to the experiments of Birk and Loos et al. [34, 6] (see Figure 9). The data from [34, 6] present in HITRAN was recently successfully validated against atmospheric spectra by Olsen et al. [77] and this gives confidence in the accuracy of our calculation.
4 Summary
Our new line lists have been computed by combining the most accurate and computationally intensive global dipole moment surface for water vapor with highly accurate semi-empirical potential energy surfaces for each isotopologue, which predict H216O energy levels to within 0.022 cm-1 for those lower than 26000 cm-1. Where possible, we have replaced our calculated energy levels for each line list with the semi-empirical levels predicted from MARVEL. Where this was done, labels were also placed on each state: , , , and . For our H216O line list, we calculate a ’potential stability’ for many transition intensities based on the interchange of two potential energy surfaces. This can be significant for unstable transitions.
Comparisons have been made against eighteen different sources across both H216O and H218O that encompass measured transition intensities from the far-infrared to the visible, which total 24890 observations. In the microwave, we also compare to calculated semi-empirical intensities.
The majority of the measured data was obtained from HITRAN2016, as it is frequently used in both the characterization of terrestrial atmospheres and in comparisons with new experiments and is known to provide accurate results, hence it is the most logical source to compare with.
In the microwave, the agreement between our theoretical intensities to those from the semi-empirical calculations of Coudert et al. are excellent for the strongest lines for H216O. For H218O, systematic shifts are observed in and bands, of which these differences are attributed to the semi-empirical calculations. Errors are also observed in semi-empirical pure rotational H218O intensities, which feature in GEISA2015.
In the far-infrared, intensities from our new H216O line list and the line list of Polyansky et al. (POKAZATEL) show excellent agreement to two different experimental sources, one of which is not in HITRAN2016.
For the mid-infrared spectrum of H216O, seven individual sources provide intensities that cover 7000 - 8339 cm-1. The POKAZATEL line list over-estimates the absorption of the (031) band by approximately 10%, seen in two of the seven studies. POKAZATEL also underestimates the absorption of the 2 band by 3%. Our new line list accurately models these two bands and intensities are within experimental uncertainties.
For H218O, there is an increased amount of scatter in the intensity ratios obtained from comparing with the Toth et al. data within HITRAN2016 compared to what is obtained when considering Toth et al. H216O intensities. It is likely that this difference is not of theoretical origin. Our new H218O line list also shows excellent agreement with the ab initio intensities from Partridge and Schwenke, although it appears there is a small systematic shift in all intensities.
We compared with three different experiments in HITRAN2016 that provide H216O intensities measurements in the near-infrared spectrum. Our new line shows significant improvement in this region, up to 5-8% in many bands, notably (300), (003), (121), (102) and (201). For H218O, the near-infrared region in HITRAN2016 includes intensities coming from Tanaka et al. Intensity ratios show a substantial 25% offset when compared against our line list. This shift is not observed when we compared to a different experiment for H216O that covers the same frequency range.
Water vapor absorption in the molecular Oxygen A band region which covers approximately 12000 - 13000 cm-1 currently remains widely disputed. Comparisons of our new intensity calculations to two independent experiments yields unconvincing results; scatter is a dominant feature in all but the strongest transitions.
Within the visible section of HITRAN2016, we could not compare our calculated H216O intensities to the experimental measurements of Tolchenov et al. on a line-by-line basis as we question the accuracy of their measurements below approximately 10-24 cm molecule-1. Hence, we instead calculated cross-sections.
A recent atmospheric study in the visible [31] concluded that HITEMP2010 provided better agreement to observation than the POKAZATEL line list. When comparing cross sections from our new H216O line list to both HITRAN2016 and HITEMP2010 cross sections, our line list shows smaller residuals than what is obtained when using POKAZATEL.
Line position differences were however observed in our comparisons to the HITEMP2010 database that are not replicated through comparisons against HITRAN2016. This is due to continued improvements in semi-empirical potentials which provide better line positions in HITRAN2016.
As we expected, very similar intensity ratios are obtained when comparing our H216O and H218O line lists to the same experimental source of Loos et al. The line lists were calculated using potentials from the same source, as well as the same dipole moment surface, hence all line lists should yield similar results across the same bands.
Across the entire spectrum, our new H216O and H218O line lists are in excellent agreement with many experiments and offer significant improvements in the prediction of numerous band intensities when compared to many H216,18O line lists. It should prove to be a useful resource for the future updates of transition intensities within the HITRAN database, from the microwave to the visible. For intensities in the (130) band, and other bands, where there is a systematic offset against two different experiments, these ab initio calculations would need to be scaled. Theoretical work is currently on-going to further improve the visible spectrum H216O. Each line list is available in the supplementary material.
Acknowledgments
HITRAN and HITEMP databases are supported through the NASA Aura (NNX17AI78G) and PDART (NNX16AG51G) grants. Nikolai F. Zobov and Aleksandra A. Kyuberis acknowledge support by State project IAP RAS No0035-2019-0016.
References
- [1] R. Schermaul, R. C. M. Learner, D. A. Newnham, R. G. Williams, J. Ballard, N. F. Zobov, D. Belmiloud, J. Tennyson, The water vapour spectrum in the region 8600–15000 cm-1: experimental and theoretical studies for a new spectral line database i: Laboratory measurements, J. Mol. Spectrosc. 208 (2001) 32–42. doi:10.1006/jmsp.2001.8374.
- [2] L. Brown, R. Toth, M. Dulick, Empirical line parameters of near 0.94 : positions, intensities and air-broadening coefficients, J. Mol. Spectrosc. 212 (2002) 57–82. doi:10.1006/jmsp.2002.8515.
-
[3]
R. Toth, Linelist of water vapor
parameters from 500 to 8000 .
URL http://mark4sun.jpl.nasa.gov/h2o.html - [4] R. Tolchenov, J. Tennyson, Water line parameters from refitted spectra constrained by empirical upper state levels: study of the 9500 - 14 500 region, J. Quant. Spectrosc. Radiat. Transf. 109 (2008) 559–568.
- [5] R. Tolchenov, O. Naumenko, N. Zobov, S. Shirin, O. Polyansky, J. Tennyson, M. Carleer, P.-F. Coheur, S. Fally, A. Jenouvrier, A. Vandaele, Water vapour line assignments in the 9250-26 000 frequency range, J. Mol. Spectrosc. 233 (2005) 68–76.
- [6] J. Loos, M. Birk, G. Wagner, Measurement of positions, intensities and self-broadening line shape parameters of H2O lines in the spectral ranges 1850 - 2280 cm-1 and 2390 - 4000 cm-1, J. Quant. Spectrosc. Radiat. Transf. 203 (2017) 119–132. doi:10.1016/j.jqsrt.2017.02.013.
- [7] M. Birk, G. Wagner, J. Loos, L. Lodi, O. L. Polyansky, A. A. Kyuberis, N. F. Zobov, J. Tennyson, Accurate line intensities for water transitions in the infrared: comparison of theory and experiment, J. Quant. Spectrosc. Radiat. Transf. 203 (2017) 88–102. doi:10.1016/j.jqsrt.2017.03.040.
- [8] D. Lisak, D. Havey, J. Hodges, Spectroscopic line parameters of water vapor for rotation-vibration transitions near 7180 cm-1, Phys. Rev. A. 79 (2009) 52507. doi:10.1103/PhysRevA.79.052507.
- [9] S. Mikhailenko, S. Kassi, L. Wang, A. Campargue, The absorption spectrum of water in the 1.25 m transparency window (7408-7920 cm-1), J. Mol. Spectrosc. 269 (2011) 92–103. doi:10.1016/j.jms.2011.05.005.
- [10] O. Leshchishina, S. Mikhailenko, D. Mondelain, S. Kassi, A. Campargue, Crds of water vapor at 0.1 torr between 6886 and 7406 cm-1, J. Quant. Spectrosc. Radiat. Transf. 113 (2012) 2155–2166. doi:10.1016/j.jqsrt.2012.06.026.
- [11] L. Regalia, C. Oudot, S. Mikhailenko, L. Wang, X. Thomas, A. Jenouvrier, P. V. der Heyden, Water vapor line parameters from 6450 to 9400 cm-1, J. Quant. Spectrosc. Radiat. Transf. 136 (2014) 119–136. doi:10.1016/j.jqsrt.2013.11.019.
- [12] A. Campargue, S. Mikhailenko, B. Lohan, E. Karlovets, D. Mondelain, S. Kassi, The absorption spectrum of water vapor in the 1.25 m atmospheric window (7911-8337 cm-1), J. Quant. Spectrosc. Radiat. Transf. 157 (2015) 135–152. doi:10.1016/j.jqsrt.2015.02.011.
- [13] V. Sironneau, J. Hodges, Line shapes, positions and intensities of water transitions near 1.28 m, J. Quant. Spectrosc. Radiat. Transf. 152 (2015) 1–15. doi:10.1016/j.jqsrt.2014.10.020.
- [14] I. V. Ptashnik, R. McPheat, O. L. Polyansky, K. P. Shine, K. M. Smith, Intensities and self-broadening coefficients of the strongest water vapour lines in the 2.7 and 6.25m absorption bands, J. Quant. Spectrosc. Radiat. Transf. 177 (2016) 92 – 107. doi:10.1016/j.jqsrt.2016.02.001.
- [15] M. Grechko, P. Maksyutenko, T. R. Rizzo, O. V. Boyarkin, Communication: Feshbach resonances in the water molecule revealed by state-selective spectroscopy, J. Chem. Phys. 133 (2010) 081103. doi:10.1063/1.3472312.
-
[16]
S. Mikhailenko, V. Serdyukov, L. Sinitsa,
Study
of H216O and H218O absorption in the 16,460-17,200
cm-1 range using LED-based Fourier transform spectroscopy, J. Quant.
Spectrosc. Radiat. Transf. 217 (2018) 170 – 177.
doi:https://doi.org/10.1016/j.jqsrt.2018.05.032.
URL http://www.sciencedirect.com/science/article/pii/S0022407318302863 - [17] P. Barletta, S. V. Shirin, N. F. Zobov, O. L. Polyansky, J. Tennyson, E. F. Valeev, A. G. Császár, CVRQD adiabatic ab initio ground-state potential surfaces for the water molecule, J. Chem. Phys. 125 (2006) 204307. doi:10.1063/1.2378766.
- [18] H. Partridge, D. W. Schwenke, The determination of an accurate isotope dependent potential energy surface for water from extensive ab initio calculations and experimental data, J. Chem. Phys. 106 (1997) 4618–4639. doi:10.1063/1.473987.
- [19] D. W. Schwenke, H. Partridge, Convergence testing of the analytic representation of an ab initio dipole moment function for water: Improved fitting yields improved intensities, J. Chem. Phys. 113 (2000) 6592–6597.
- [20] R. J. Barber, J. Tennyson, G. J. Harris, R. N. Tolchenov, A high accuracy computed water line list, Mon. Not. R. Astron. Soc. 368 (2006) 1087–1094. doi:10.1111/j.1365-2966.2006.10184.x.
- [21] L. Lodi, R. N. Tolchenov, J. Tennyson, A. E. Lynas-Gray, S. V. Shirin, N. F. Zobov, O. L. Polyansky, A. G. Császár, J. van Stralen, L. Visscher, A new ab initio ground-state dipole moment surface for the water molecule, J. Chem. Phys. 128 (2008) 044304. doi:10.1063/1.2817606.
- [22] I. I. Bubukina, O. L. Polyansky, N. F. Zobov, S. N. Yurchenko, Optimized semiempirical potential energy surface for H216O up to 26000 cm-1, Optics Spectrosc. 110 (2011) 160–166. doi:10.1134/S0030400X11020032.
- [23] O. L. Polyansky, A. A. Kyuberis, N. F. Zobov, J. Tennyson, S. N. Yurchenko, L. Lodi, ExoMol molecular line lists XXX: a complete high-accuracy line list for water, Mon. Not. R. Astron. Soc. 480 (2018) 2597–2608. doi:10.1093/mnras/sty1877.
- [24] I. I. Mizus, A. A. Kyuberis, N. F. Zobov, V. Y. Makhnev, O. L. Polyansky, J. Tennyson, High accuracy water potential energy surface for the calculation of infrared spectra, Phil. Trans. Royal Soc. London A 376 (2018) 20170149. doi:10.1098/rsta.2017.0149.
- [25] G. Tinetti, A. Vidal-Madjar, M.-C. Liang, J.-P. Beaulieu, Y. Yung, S. Carey, R. J. Barber, J. Tennyson, I. Ribas, N. Allard, G. E. Ballester, D. K. Sing, F. Selsis, Water vapour in the atmosphere of a transiting extrasolar planet, Nature 448 (2007) 169–171. doi:10.1038/nature06002.
- [26] Q. M. Konopacky, T. S. Barman, B. A. Macintosh, C. Marois, Detection of Carbon Monoxide and Water Absorption Lines in an Exoplanet Atmosphere, Science 339 (2013) 1398–1401. doi:10.1126/science.1232003.
- [27] Bockelée-Morvan, D., Debout, V., Erard, S., Leyrat, C., Capaccioni, F., Filacchione, G., Fougere, N., Drossart, P., Arnold, G., Combi, M., Schmitt, B., Crovisier, J., de Sanctis, M.-C., Encrenaz, T., Kührt, E., Palomba, E., Taylor, F. W., Tosi, F., Piccioni, G., Fink, U., Tozzi, G., Barucci, A., Biver, N., Capria, M.-T., Combes, M., Ip, W., Blecka, M., Henry, F., Jacquinod, S., Reess, J.-M., Semery, A., Tiphene, D., First observations of H2O and CO2 vapor in comet 67P/Churyumov-Gerasimenko made by VIRTIS onboard Rosetta, Astron. Astrophys. 583 (2015) A6. doi:10.1051/0004-6361/201526303.
- [28] N. Dello Russo, M. A. DiSanti, K. Magee-Sauer, E. L. Gibb, M. J. Mumma, R. J. Barber, J. Tennyson, Accurate rotational temperature retrievals from hot-band line near 2.9 m, Icarus 168 (2004) 186–200.
- [29] H. R. A. Jones, A. J. Longmore, F. Allard, P. H. Hauschildt, S. Miller, J. Tennyson, Water vapour in cool dwarf stars, Mon. Not. R. Astron. Soc. 277 (1995) 767–776. doi:10.1093/mnras/277.3.767.
- [30] A. K. Thorpe, C. Frankenberg, D. R. Thompson, R. M. Duren, A. D. Aubrey, B. D. Bue, R. O. Green, K. Gerilowski, T. Krings, J. Borchardt, E. A. Kort, C. Sweeney, S. Conley, D. A. Roberts, P. E. Dennison, Airborne DOAS retrievals of methane, carbon dioxide, and water vapor concentrations at high spatial resolution: application to AVIRIS-NG, Atmos. Measur. Techn. 10 (2017) 3833–3850. doi:10.5194/amt-10-3833-2017.
- [31] J. Lampel, D. Pöhler, O. L. Polyansky, A. A. Kyuberis, N. F. Zobov, J. Tennyson, L. Lodi, U. Frieß, Y. Wang, S. Beirle, U. Platt, T. Wagner, Detection of water vapour absorption around 363 nm in measured atmospheric absorption spectra and its effect on DOAS evaluations, Atmos. Chem. Phys. 17 (2017) 1271–1295. doi:10.5194/acp-2016-388.
- [32] I. Gordon, L. Rothman, C. Hill, R. Kochanov, Y. Tan, P. Bernath, M. Birk, V. Boudon, A. Campargue, K. Chance, B. Drouin, J.-M. Flaud, R. Gamache, J. Hodges, D. Jacquemart, V. Perevalov, A. Perrin, K. Shine, M.-A. Smith, J. Tennyson, G. Toon, H. Tran, V. Tyuterev, A. Barbe, A. Császár, V. Devi, T. Furtenbacher, J. Harrison, J.-M. Hartmann, A. Jolly, T. Johnson, T. Karman, I. Kleiner, A. Kyuberis, J. Loos, O. Lyulin, S. Massie, S. Mikhailenko, N. Moazzen-Ahmadi, H. Müller, O. Naumenko, A. Nikitin, O. Polyansky, M. Rey, M. Rotger, S. Sharpe, K. Sung, E. Starikova, S. Tashkun, J. V. Auwera, G. Wagner, J. Wilzewski, P. Wcisło, S. Yu, E. Zak, The HITRAN2016 molecular spectroscopic database, J. Quant. Spectrosc. Radiat. Transf. 203 (2017) 3–69. doi:10.1016/j.jqsrt.2017.06.038.
- [33] L. Lodi, J. Tennyson, O. L. Polyansky, A global, high accuracy ab initio dipole moment surface for the electronic ground state of the water molecule, J. Chem. Phys. 135 (2011) 034113. doi:10.1063/1.3604934.
- [34] M. Birk, G. Wagner, Voigt profile introduces optical depth dependent systematic errors - detected in high resolution laboratory spectra of water, J. Quant. Spectrosc. Radiat. Transf. 170 (2016) 159 – 168. doi:https://doi.org/10.1016/j.jqsrt.2015.11.008.
-
[35]
M. Birk, J. Loos, G. Wagner, D. Mondelain, S. Kassi, A. Campargue, F. Hase,
J. Orphal, A. Perrin, L. Coudert, H. Tran, G. Dufor, M. Eremenko, J. Cuesta,
L. Daumont, M. Rotger, A. Bigazzi, C. Zehner,
Atmo-10 -
spectroscopic database for tropomi/sentinel-5 precursor - 2.3 m region
finalized, Proceedings of the ESA living planet symposium. Prague, Czech
Republic.
URL http://lps16.esa.int/page_session190.php#612p - [36] L. Rothman, I. Gordon, R. Barber, H. Dothe, R. Gamache, A. Goldman, V. Perevalov, S. Tashkun, J. Tennyson, HITEMP, the high-temperature molecular spectroscopic database, J. Quant. Spectrosc. Radiat. Transf. 111 (2010) 2139 – 2150. doi:10.1016/j.jqsrt.2010.05.001.
- [37] E. K. Conway, A. A. Kyuberis, O. L. Polyansky, J. Tennyson, N. Zobov, A highly accurate ab initio dipole moment surface for the ground electronic state of water vapour for spectra extending into the ultraviolet, J. Chem. Phys. 149 (2018) 084307. doi:10.1063/1.5043545.
- [38] J. Tennyson, P. Barletta, R. E. A. Kelly, L. Lodi, J. J. Munro, B. C. Silva, DVR3D: a program suite for the calculation of rotation-vibration spectra of triatomic molecules, Comput. Phys. Commun.doi:10.1016/j.cpc.2003.10.003.
- [39] O. V. Boyarkin, M. A. Koshelev, O. Aseev, P. Maksyutenko, T. R. Rizzo, N. F. Zobov, L. Lodi, J. Tennyson, O. L. Polyansky, Accurate bond dissociation energy of water determined by triple-resonance vibrational spectroscopy and ab initio calculations, Chem. Phys. Lett. 568-569 (2013) 14–20.
- [40] L. Lodi, J. Tennyson, Line lists for H218O and H217O based on empirically-adjusted line positions and ab initio intensities, J. Quant. Spectrosc. Radiat. Transf. 113 (2012) 850–858. doi:10.1016/j.jqsrt.2012.02.023.
-
[41]
L. Velilla, B. Lepetit, A. Aguado, J. A. Beswick, M. Paniagua,
The h3+ rovibrational spectrum
revisited with a global electronic potential energy surface, The Journal of
Chemical Physics 129 (8) (2008) 084307.
doi:10.1063/1.2973629.
URL https://doi.org/10.1063/1.2973629 - [42] V. Y. Makhnev, A. A. Kyuberis, N. F. Zobov, L. Lodi, J. Tennyson, O. L. Polyansky, High accuracy ab initio calculations of rotation-vibration energy levels of the HCN/HNC system, J. Phys. Chem. A 122 (2018) 1326–1343. doi:10.1021/acs.jpca.7b10483.
- [43] T. Furtenbacher, A. G. Császár, J. Tennyson, MARVEL: measured active rotational-vibrational energy levels, J. Mol. Spectrosc. 245 (2007) 115–125. doi:10.1016/j.jms.2007.07.005.
- [44] J. Tennyson, P. F. Bernath, L. R. Brown, A. Campargue, A. G. Császár, L. Daumont, R. R. Gamache, J. T. Hodges, O. V. Naumenko, O. L. Polyansky, L. S. Rothman, A. C. Vandaele, N. F. Zobov, A Database of Water Transitions from Experiment and Theory (IUPAC Technical Report), Pure Appl. Chem. 86 (2014) 71–83. doi:10.1515/pac-2014-5012.
- [45] J. Tennyson, P. F. Bernath, L. R. Brown, A. Campargue, M. R. Carleer, A. G. Császár, R. R. Gamache, J. T. Hodges, A. Jenouvrier, O. V. Naumenko, O. L. Polyansky, L. S. Rothman, R. A. Toth, A. C. Vandaele, N. F. Zobov, L. Daumont, A. Z. Fazliev, T. Furtenbacher, I. E. Gordon, S. N. Mikhailenko, S. V. Shirin, IUPAC critical Evaluation of the Rotational-Vibrational Spectra of Water Vapor. Part I. Energy Levels and Transition Wavenumbers for H217O and H218O, J. Quant. Spectrosc. Radiat. Transf. 110 (2009) 573–596. doi:10.1016/j.jqsrt.2009.02.014.
- [46] J. Tennyson, P. F. Bernath, L. R. Brown, A. Campargue, M. R. Carleer, A. G. Császár, L. Daumont, R. R. Gamache, J. T. Hodges, O. V. Naumenko, O. L. Polyansky, L. S. Rothman, R. A. Toth, A. C. Vandaele, N. F. Zobov, A. Z. Fazliev, T. Furtenbacher, I. E. Gordon, S. N. Mikhailenko, B. A. Voronin, IUPAC critical Evaluation of the Rotational-Vibrational Spectra of Water Vapor. Part II. Energy Levels and Transition Wavenumbers for HD16O, HD17O, and HD18O, J. Quant. Spectrosc. Radiat. Transf. 111 (2010) 2160–2184. doi:10.1016/j.jqsrt.2010.06.012.
- [47] J. Tennyson, P. F. Bernath, L. R. Brown, A. Campargue, M. R. Carleer, A. G. Császár, L. Daumont, R. R. Gamache, J. T. Hodges, O. V. Naumenko, O. L. Polyansky, L. S. Rothmam, A. C. Vandaele, N. F. Zobov, A. R. Al Derzi, C. Fábri, A. Z. Fazliev, T. Furtenbacher, I. E. Gordon, L. Lodi, I. I. Mizus, IUPAC critical evaluation of the rotational-vibrational spectra of water vapor. Part III. Energy levels and transition wavenumbers for H216O, J. Quant. Spectrosc. Radiat. Transf. 117 (2013) 29–80. doi:10.1016/j.jqsrt.2012.10.002.
- [48] J. Tennyson, P. F. Bernath, L. R. Brown, A. Campargue, A. G. Császár, L. Daumont, R. R. Gamache, J. T. Hodges, O. V. Naumenko, O. L. Polyansky, L. S. Rothmam, A. C. Vandaele, N. F. Zobov, N. Dénes, A. Z. Fazliev, T. Furtenbacher, I. E. Gordon, S.-M. Hu, T. Szidarovszky, I. A. Vasilenko, IUPAC critical evaluation of the rotational-vibrational spectra of water vapor. Part IV. Energy levels and transition wavenumbers for D216O, D217O and D218O, J. Quant. Spectrosc. Radiat. Transf. 142 (2014) 93–108. doi:10.1016/j.jqsrt.2014.03.019.
- [49] T. Furtenbacher, A. G. Császár, MARVEL: measured active rotational-vibrational energy levels. II. Algorithmic improvements, J. Quant. Spectrosc. Radiat. Transf. 113 (2012) 929–935. doi:10.1016/j.jqsrt.2012.01.005.
- [50] R. Tóbiás, T. Furtenbacher, J. Tennyson, A. G. Császár, Accurate empirical rovibrational energies and transitions of H216O, Phys. Chem. Chem. Phys. 21 (2019) 3473–3495. doi:10.1039/c8cp05169k.
- [51] T. Furtenbacher, A. G. Császár, On employing H216O, H217O,.H218O, and D216O lines as frequency standards in the 15 – 170 cm-1 window, J. Quant. Spectrosc. Radiat. Transf. 109 (2008) 1234–1251. doi:10.1016/j.jqsrt.2007.10.003.
- [52] T. Furtenbacher, J. Tennyson, O. V. Naumenko, O. L. Polyansky, N. F. Zobov, A. G. Császár, The 2018 Update of the IUPAC Database of Water Energy Levels, J. Quant. Spectrosc. Radiat. Transf.(In preparation).
- [53] O. L. Polyansky, A. A. Kyuberis, L. Lodi, J. Tennyson, R. I. Ovsyannikov, N. Zobov, ExoMol molecular line lists XIX: high accuracy computed line lists for H217O and H218O, Mon. Not. R. Astron. Soc. 466 (2017) 1363–1371. doi:10.1093/mnras/stw3125.
- [54] M. S. Child, T. Weston, J. Tennyson, Quantum monodromy in the spectrum of H2O and other systems: new insight into the level structures of quasi-linear molecules, Mol. Phys. 96 (1999) 371–379. doi:10.1080/00268979909482971.
- [55] N. F. Zobov, S. V. Shirin, O. L. Polyansky, J. Tennyson, P.-F. Coheur, P. F. Bernath, M. Carleer, R. Colin, Monodromy in the water molecules, Chem. Phys. Lett. 414 (2005) 193–197. doi:10.1016/j.cplett.2005.08.028.
- [56] L. Coudert, Line frequency and line intensity analysis of water vapor, Molecular Physics 96 (1999) 941–954. doi:10.1080/00268979909483034.
- [57] L. Coudert, None, private communication (2004).
- [58] L. H. Coudert, M.-A. Martin-Drumel, O. Pirali, Analysis of the high-resolution water spectrum up to the Second Triad and to J=30, J. Mol. Spectrosc. 303 (2014) 36 – 41. doi:10.1016/j.jms.2014.07.003.
- [59] N. Jacquinet-Husson, R. Armante, N. A. Scott, A. Chédin, L. Crépeau, C. Boutammine, A. Bouhdaoui, C. Crevoisier, V. Capelle, C. Boonne, N. Poulet-Crovisier, A. Barbe, D. C. Benner, V. Boudon, L. R. Brown, J. Buldyreva, A. Campargue, L. H. Coudert, V. M. Devi, M. J. Down, B. J. Drouin, A. Fayt, C. Fittschen, J.-M. Flaud, R. R. Gamache, J. J. Harrison, C. Hill, Ø. Hodnebrog, S. M. Hu, D. Jacquemart, A. Jolly, E. Jiménez, N. N. Lavrentieva, A. W. Liu, L. Lodi, O. M. Lyulin, S. T. Massie, S. Mikhailenko, H. S. P. Müller, O. V. Naumenko, A. Nikitin, C. J. Nielsen, J. Orphal, V. I. Perevalov, A. Perrin, E. Polovtseva, A. Predoi-Cross, M. Rotger, A. A. Ruth, S. S. Yu, K. Sung, S. A. Tashkun, J. Tennyson, V. G. Tyuterev, J. Vander Auwera, B. A. Voronin, A. Makie, The 2015 edition of the GEISA spectroscopic database, J. Mol. Spectrosc. 327 (2016) 31–72. doi:10.1016/j.jms.2016.06.007.
- [60] E. J. Zak, J. Tennyson, O. L. Polyansky, L. Lodi, S. A. Tashkun, V. I. Perevalov, A room temperature CO2 line list with ab initio computed intensities, J. Quant. Spectrosc. Radiat. Transf. 177 (2016) 31–42. doi:10.1016/j.jqsrt.2015.12.022.
-
[61]
V. M. Devi, R. R. Gamache, B. Vispoel, C. L. Renaud, D. C. Benner, M. A. H.
Smith, T. A. Blake, R. L. Sams,
Line
shape parameters of air-broadened water vapor transitions in the
and spectral region, J. Mol. Spectrosc. 348 (2018) 13 – 36,
molecular Spectroscopy, Atmospheric Composition and Climate Change.
doi:https://doi.org/10.1016/j.jms.2017.11.011.
URL http://www.sciencedirect.com/science/article/pii/S0022285217303879 -
[62]
A. Campargue, S. Mikhailenko, A. Liu,
ICLAS
of water in the 770 nm transparency window (12746-–13558 cm-1).
Comparison with current experimental and calculated databases, J. Quant.
Spectrosc. Radiat. Transf. 109 (17) (2008) 2832 – 2845.
doi:https://doi.org/10.1016/j.jqsrt.2008.07.003.
URL http://www.sciencedirect.com/science/article/pii/S0022407308001453 - [63] G. C. Toon, None, private communication (2012).
-
[64]
D. Wunch, G. C. Toon, J.-F. L. Blavier, R. A. Washenfelder, J. Notholt, B. J.
Connor, D. W. T. Griffith, V. Sherlock, P. O. Wennberg,
The
Total Carbon Column Observing Network, Philosophical Transactions of the
Royal Society A: Mathematical, Physical and Engineering Sciences 369 (1943)
(2011) 2087–2112.
doi:10.1098/rsta.2010.0240.
URL http://rsta.royalsocietypublishing.org/cgi/doi/10.1098/rsta.2010.0240 - [65] R. Schermaul, R. C. M. Learner, D. A. Newnham, J. Ballard, N. F. Zobov, D. Belmiloud, J. Tennyson, The water vapour spectrum in the region 8600–15000 cm-1: experimental and theoretical studies for a new spectral line database ii: Construction and validation, J. Mol. Spectrosc. 208 (2001) 43–50. doi:https://doi.org/10.1006/jmsp.2001.8373.
- [66] R. Schermaul, R. C. M. Learner, A. A. D. Canas, J. W. Brault, O. L. Polyansky, D. Belmiloud, N. F. Zobov, J. Tennyson, Weak line water vapor spectrum in the regions 13 200 – 15 000 cm-1, J. Mol. Spectrosc. 211 (2002) 169–178.
- [67] M. Carleer, A. Jenouvrier, A.-C. Vandaele, P. F. Bernath, M. F. Mérienne, R. Colin, N. F. Zobov, O. L. Polyansky, J. Tennyson, V. A. Savin, The near infrared, visible and near ultraviolet overtone spectrum of water, J. Chem. Phys. 111 (1999) 2444–2450.
- [68] N. F. Zobov, D. Belmiloud, O. L. Polyansky, J. Tennyson, S. V. Shirin, M. Carleer, A. Jenouvrier, A.-C. Vandaele, P. F. Bernath, M. F. Marienne, R. Colin, The near ultraviolet rotation-vibration spectrum of water, J. Chem. Phys. 113 (2000) 1546–1552.
- [69] R. N. Tolchenov, O. Naumenko, N. F. Zobov, S. V. Shirin, O. L. Polyansky, J. Tennyson, M. Carleer, P.-F. Coheur, S. Fally, A. Jenouvrier, A. C. Vandaele, Water vapor line assignments in the 9250 – 26000 cm-1 frequency range, J. Mol. Spectrosc. 233 (2005) 68–76. doi:10.1016/j.jms.2005.05.015.
- [70] P. Dupre, T. Germain, N. F. Zobov, R. N. Tolchenov, J. Tennyson, Continuous Wave – Cavity ring down near ultraviolet rotation-vibration spectrum of water, J. Chem. Phys. 123 (2005) 154307. doi:10.1063/1.2055247.
- [71] R. V. Kochanov, I. E. Gordon, L. S. Rothman, P. Wcisło, C. Hill, J. S. Wilzewski, HITRAN Application Programming Interface (HAPI): A comprehensive approach to working with spectroscopic data, J. Quant. Spectrosc. Radiat. Transf. 177 (2016) 15 – 30. doi:10.1016/j.jqsrt.2016.03.005.
- [72] M. Tanaka, J. W. Brault, J. Tennyson, Absorption spectrum of HO in the range 12400 – 14520 cm-1, J. Mol. Spectrosc. 216 (2002) 77–80. doi:10.1006/jmsp.2002.8670.
- [73] H. Partridge, D. Schwenke, The determination of an accurate isotope dependent potential energy surface for water from extensive ab initio calculations and experimental data, J. Chem. Phys. 106 (1997) 4618–4639. doi:10.1063/1.473987.
- [74] G. Colonna, V. Laporta, M. Capitelli, R. Celiberto, J. Tennyson, Non-equilibrium vibrational and electron energy distributions functions in atmospheric nitrogen ns pulsed discharges and post-discharges: the role of electron molecule vibrational excitation scaling-laws, Plasma Sources Sci. Technol. 24 (2015) 035004. doi:10.1088/0963-0252/24/3/035004.
- [75] L. Coudert, P. Chelin, Line position and line intensity analyses of the high-resolution spectrum of HO up to the First Triad and J=17, J. Mol. Spectrosc. 326 (2016) 130 – 135. doi:https://doi.org/10.1016/j.jms.2016.01.012.
- [76] C. Oudot, L. Régalia, S. Mikhailenko, X. Thomas, P. Von Der Heyden, D. Décatoire, Fourier transform measurements of HO and HD18O in the spectral range 1000-2300 cm-1, J. Quant. Spectrosc. Radiat. Transf. 113 (2012) 859 – 869. doi:10.1016/j.jqsrt.2012.03.012.
- [77] K. Olsen, C. Boone, G. Toon, F. Montmessin, A. Fedorova, O. Korablev, A. Trokhimovskiy, Validation of the hitran 2016 and geisa 2015 line lists using ace-fts solar occultation observations, J. Quant. Spectrosc. Radiat. Transf. 236 (2019) 106590. doi:https://doi.org/10.1016/j.jqsrt.2019.106590.