High-energy neutrinos from cosmic ray interactions in the Local Bubble
Abstract
A surprisingly large flux of extraterrestrial high-energy neutrinos was discovered by the IceCube experiment. While the flux of muon neutrinos with energies TeV is consistent with the extragalactic gamma-ray background (EBL) determined by Fermi-LAT, the softer component of the cascade neutrino flux at TeV is larger than expected. Moreover, a gamma-ray excess at high Galactic latitudes at energies GeV was found in the data of Fermi-LAT. The gamma-ray excess at TeV energies and the neutrino excess at TeV may have a common Galactic origin. In this work, we study the possibility that both excesses are caused by interactions of cosmic rays (CRs) with energies up to PeV in the wall of the Local Bubble. Source of these CRs may be a recent nearby source like Vela. We show that such a scenario can explain the observed CR flux around the knee, while CR interactions in the bubble wall can generate a substantial fraction of the observed astrophysical high-energy neutrino flux below TeV.
I Introduction
High-energy astrophysical neutrinos are a unique probe to understand the non-thermal universe Gaisser et al. (1995). They are produced together with photons in interactions of cosmic rays (CR) on matter and background photons close to their sources and during propagation. Since neutrinos travel undisturbed, being neither absorbed as high-energy photons nor deflected in magnetic fields as charged particles, they are an ideal tracer of CR sources.
The IceCube collaboration employs two main experimental channels to detect such neutrinos. Using the tracks of muons one can measure the neutrino arrival direction rather precisely, while its energy can be only estimated within a factor of a few Aartsen et al. (2016). To avoid the atmospheric neutrino background, the energy spectrum of astrophysical neutrinos in this channel is measured above 200 TeV. A fit with a power law to the flux of muon neutrinos from 9.5 years of observations resulted in Aartsen et al. (2020)
| (1) |
The slope is consistent with a power law with index –2.2 which is predicted in many models of extragalactic neutrino sources Stecker et al. (1991); Mannheim (1995); Waxman and Bahcall (1997); Loeb and Waxman (2006). Moreover, the magnitude of the flux agrees with the one expected from the extragalactic gamma-ray background (EBL), which should contain a comparable energy Berezinsky et al. (2011); Murase et al. (2013).
In a second channel using cascade events inside the IceCube detector one can measure electron neutrinos interacting via the charged current and additionally all neutrino flavours interacting via the neutral current. The energy spectrum of astrophysical neutrinos derived in this channel per neutrino flavor is Aartsen et al. (2020)
| (2) |
Such a steep spectrum challenges an extragalactic origin of this component, since the accompanying photons would overshoot the bounds on the diffuse background of extragalactic gamma-rays Berezinsky et al. (2011); Murase et al. (2013).
In Ref. Neronov and Semikoz (2016a), it was noticed that the all-sky gamma-ray flux measured by Fermi-LAT is consistent with the soft neutrino spectrum in Eq. (2). While the observed gamma-ray flux is dominated by the contribution of the Galactic plane, a corresponding neutrino contribution is tightly constraint by data from both IceCube and ANTARES Albert et al. (2017). Therefore a Galactic neutrino contribution should be rather isotropic, with a significant fraction of the flux coming from outside of the Galactic plane.
In Ref. Neronov and Semikoz (2016b), evidence for a Galactic contribution in the HESE neutrino data was found based on both the signal in the Galactic plane and at high Galactic latitudes. Two-component models with a Galactic and an extragalactic contribution were suggested in Refs. Neronov and Semikoz (2016c) and Palladino et al. (2017) to explain the data in both the muon and cascade channels. A non-zero Galactic contribution was obtained also more recently in a multi-component fit performed in Ref. Palladino and Winter (2018). Finally, a gamma-ray excess at high Galactic latitudes in the Fermi LAT data with energies GeV was reported in Ref. Neronov et al. (2018); Neronov and Semikoz (2019). An extension of the Fermi gamma-ray excess to energies of TeV would indicate its Galactic origin, since at these energies photons are strongly attenuated by pair-production on cosmic microwave background and IR photons.
One possible explanation for a close to isotropic Galactic neutrino flux is that the neutrinos originate from a large Galactic halo, formed either by CRs Taylor et al. (2014); Blasi and Amato (2019) (but see Ref. Kalashev and Troitsky (2016)) or heavy dark matter particles Berezinsky et al. (1997); Feldstein et al. (2013); Esmaili and Serpico (2013). Another proposed Galactic neutrino source are the Fermi bubbles, if these gamma-rays have an hadronic origin as suggested, e.g., in Refs. Crocker and Aharonian (2011); Lunardini and Razzaque (2012). Finally, there is the possibility that the main contribution to the Galactic neutrino flux is rather local, produced by CRs interactions in the walls of the Local Bubble Andersen et al. (2018).
A smoking gun of all Galactic models explaining the IceCube data below 100 TeV is the associated, nearly isotropic flux of photon with energies 10–100 TeV. Such a photon flux can be measured by dedicated experiments, which are able to suppress the CR background by a factor . The required suppression factor corresponds to the ratio between the neutrino and CR flux in this energy range, and should be similar or better than the one achieved in the KASCADE measurements. Examples for such experiments are the existing CARPET-3 facility Dzhappuev et al. (2019) and the next generation experiment LHAASO Di Sciascio (2016), which is currently in the construction stage.
Once a diffuse gamma-ray flux above 10 TeV will be detected, its angular distribution can help to distinguish between the various proposed models. Signature of heavy dark matter is an excess towards the direction of the Galactic center. The gamma-ray flux from CRs in an extended Galactic halo should be nearly isotropic, apart from an energy dependent suppression towards the Galactic center due to pair production. Finally, the gamma-ray flux predicted in models of local CR sources should follow the distribution of gas in the Local Bubble and its wall. In addition, large scale anisotropies in the TeV–PeV energy ange have been observed in the, e.g., IceTop and IceCube data Desiati (2014). These anisotropies add further constraints on the origin of cosmics rays producing neutrinos and gamma rays.
In this work, we study the latter possibility assuming that a young CR source, as e.g. Vela, is located outside the Local Bubble and contributes significantly to the locally observed CR flux in the energy region of the CR knee Bouyahiaoui et al. (2019). We show that CR interactions in the wall of the Local Bubble can lead to a bump in the neutrino flux around 10 TeV, consistent with the soft spectrum from Eq. (2), while the accompanying photon flux is below the limits set by Kascade-Grande.
This work is structured as follows: We describe first in Sec. II our model for the local magnetic field and the geometry of the Local Bubble. Then we discuss in Sec. III the calculation of the CR flux in the wall and the interior of the bubble, as well as their dependence on the parameters describing the bubble wall. Having fixed these parameters, we present in Sec. IV.2 the resulting CR, neutrino and photon fluxes and compare them to the observations. Finally, we conclude in Sec. V.
II Local Bubble and the geometry of the local magnetic field
In Ref. Bouyahiaoui et al. (2019), we proposed a model in which the CR flux around the knee is dominated by the contribution of the Vela supernova remnant. In that work, which we will denote in following as case U, we used a toy model for the magnetic field structure in and around the Local Bubble (LB) inspired by Ref. Andersen et al. (2018). In particular, we assumed cylindrical symmetry and approximated the field outside the bubble with radius pc as uniform. Additionally, we employ now as case JF a more realistic description of the magnetic field outside the bubble using the Jansson-Farrar (JF) model for the Galactic magnetic field Jansson and Farrar (2012), with the strength of the turbulent field reduced to obey B/C measurements as discussed in Refs. Giacinti et al. (2014, 2015). We assume that the strength of the regular magnetic field inside the bubble depends only on the radius from the center of the bubble and the height above the plane, setting G inside the bubble and G in the wall for . Then we apply an exponential damping of the magnetic field inside the bubble as function of the distance to the Galactic plane with height scale pc, since the Local Buble extends to high latitudes, Welsh and Shelton (2009). For the geometry of the bubble field, we assume inside the bubble and the wall a clockwise oriented magnetic field for and an anticlockwise one for .
The transitions between different magnetic field regimes are interpolated by logistic functions . The width of the two transitions is parametrised by with , while denotes the extension of the wall. We will discuss the dependence of our results on the chosen value of these parameters in Sec. III.3. As our default parameters, we use pc, pc, and pc, while we set as strength of the regular magnetic field in the wall G, G inside and G outside the bubble, respectively. Then the transition functions are given by
| (3) | ||||
| (4) |
where we identify the center of the LB with the origin of our coordinate system. We set the , and components of the magnetic field for to
| (5) | ||||
| (6) | ||||
| (7) | ||||
Similarly, the field is given for by
| (8) | ||||
| (9) | ||||
| (10) | ||||
with and are the corresponding components of the field in the JF model.
The turbulent magnetic field modes are distributed between AU and pc according to an isotropic Kolmogorov power spectrum. We construct the turbulent magnetic field using nested grids as described in Ref. Giacinti et al. (2012). In the actual simulations, only field modes above pc were included. Inside the wall, we omit all Fourier modes with , such that the largest modes still have few oscillations within the thickness of the wall. To maintain the same strength of the turbulent field, we enhance the power in the modes with smaller wave-lengths. The strength of the turbulent field is set for to , and for to . Hence CR propagate outside the bubble anisotropically, but inside nearly isotropically. This choice is motivated by the notion that the supernova explosion which created the LB expelled the regular field into the wall. At the same time, the injected turbulence lead to an increase of the turbulent component of the magnetic field in the bubble.
The Sun is assumed to be at the central part of the LB, while Vela is situated at the coordinates kpc, and . This implies that the Sun and Vela are connected by a regular magnetic field line in the original JF model. In the case of anisotropic diffusion, the CR density is strongly enhanced at small perpendicular distances to the field line through the source Giacinti et al. (2018). Therefore the CR flux from Vela typically overshots the observed flux in the knee region in such models. As we will show in the next section, the strong field in the bubble wall acts as a CR shield, reducing the locally observed CR flux inside the bubble.
III Model of a local neutrino source
In this section, we discuss the chosen CR injection spectrum and the calculation of the resulting CR fluxes, as well as the dependence of the CR flux on the parameters of the bubble.
III.1 Motivation for the choice of the source
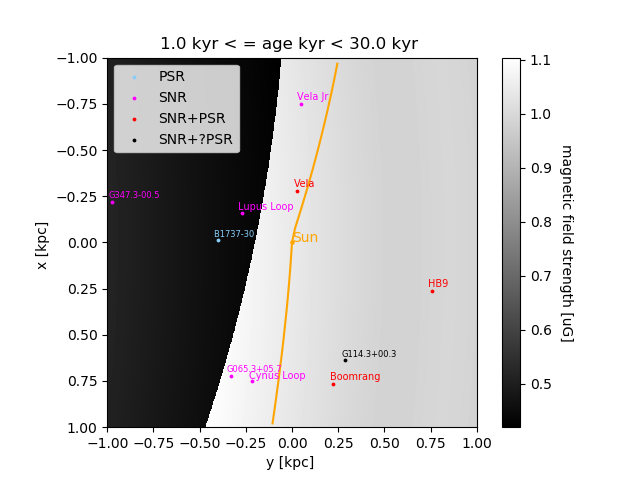
Cosmic rays propagate preferentially along the regular magnetic field lines. Therefore, the number of CR sources contributing to the locally observed CR flux is reduced relative to the case of isotropic diffusion Giacinti et al. (2018). In particular, the contribution of a source to the local flux depends strongly on its perpendicular distance to the magnetic field line through the Sun. In Fig. 1, we show the position of potential CR sources which are younger than 30 kyr. As potential sources we distinguish pulsars (light blue points), SNRs (magenta points), SNRs associated with pulsar (red points), and SNRs possibly associated with pulsars (black points). Additionally, we show the magnetic field line passing through the Sun in the JF model as a yellow line. We note that the kink of the field line near the position of the Sun is a projection effect, caused by the component of the field. Only four sources are close to the magnetic field line through the Sun; these sources are in the position to give a dominating contribution to the local CR flux.
| Source | Name | /kyr | ||||
| G065.3+05.7 | – | 20 | 0.8 | 0.27 | 0.96 | 0.036 |
| G074.0-08.5 | Cygnus Loop | 15 | 0.78 | 0.3 | 0.83 | 0.032 |
| G106.3+02.7 | Boomerang | 10 | 0.8 | 0.32 | 0.68 | 0.026 |
| G114.3+00.3 | – | 7.7 | 0.7 | 0.36 | 0.6 | 0.023 |
| G160.9+02.6 | HB9 | 5.5 | 0.8 | 0.77 | 0.5 | 0.019 |
| G263.9-03.3 | Vela | 11 | 0.29 | 0.06 | 0.71 | 0.027 |
| G266.2-01.2 | Vela Jr | 3.8 | 0.75 | 0.18 | 0.42 | 0.016 |
| G330.0+15.0 | Lupus Loop | 23 | 0.33 | 0.32 | 1.03 | 0.039 |
| G347.3-00.5 | – | 1.6 | 1 | 0.8 | 0.27 | 0.01 |
| B1737-30 | – | 20.6 | 0.4 | 0.4 | 0.98 | 0.037 |
Table 1 summarises the available information111Data on the pulsars are from https://www.atnf.csiro.au/people/pulsar/psrcat/ and on SNRs from http://snrcat.physics.umanitoba.ca/SNRtable.php. on the CR sources shown in Fig. 1. The last column shows the distance beyond which the CR flux from a CR source with age is exponentially suppressed. Since the local magnetic field line is approximately aligned with the axis, we can set and , with and as the parallel and perpendicular diffusion coefficients, respectively. These diffusion coefficient were computed numerically for the position of Vela and the CR energy PeV. The typical distance CRs with such an energy diffuse during the time should be compared to the perpendicular distance of the source to the magnetic field line passing through the Sun. Depending on the ratio of these two quantities, we can distinguish two cases:
-
•
: The contribution of this source to the local CR flux is exponentially suppressed.
-
•
: The source contributes to the local CR flux.
From Table 1 it is clear that the contribution from Vela is the dominating one.
Repeating the same analysis for older sources is less conclusive. First, one usually does not observe the shell but only the pulsar for sources which are few Myr old. Since pulsar velocities are typically high, it is difficult to reconstruct the actual position of the supernova explosion. Therefore we assume here motivated by the observations of Fe-60 Knie et al. (1999); Benitez et al. (2002); Fitoussi et al. (2008); Wallner et al. (2016), that only one or two additional CR sources with an age 2–3 Myr contribute to the local CR flux in the energy range from TeV up to the knee.
III.2 Injection spectrum and calculation of the flux
We use as CR injection spectrum for Vela a broken power law in rigidity with a break at V and an exponential cut-off at V for case U, and V and V for case JF, respectively,
| (11) |
The steepening of the injection spectrum by is motivated, e.g., by the analysis of Ref. Drury et al. (2003): Including strong field amplification as suggested by Bell and Lucek Bell and Lucek (2001); Bell (2004) into a toy acceleration model, these authors found a break in the energy spectrum of accelerated protons. For typical values of the SNR parameters, this break is located close to the knee region. The strength of this steepening depends among others on the injection history, and in a test particle ansatz was found.
The numerical values of the break and the cut-off as well as the relative normalisation of the different groups of nuclear elements were chosen such to reproduce best the measured CR composition. The overall normalisation of the CR flux observed on Earth is strongly influenced by the Local Bubble, as we will discuss in the next subsection.
In order to compute the flux, we injected 30.000 protons per energy at the position of Vela and propagated them for 12.000 yr. We calculated the CR density in the three regions of interest averaging the CR densities between 8 to 12 kyr: around the source, in the bubble wall, and inside the bubble. The CR flux was then computed from the CR densities in the considered volumes. For energies below 100 TeV we deduced the flux inside the bubble from the flux calculated at earlier times and higher energies using the scaling relation
| (12) |
This relation was confirmed in the numerical simulations presented in the supplementary material of Ref. Kachelrieß et al. (2015).
III.3 Parameter dependence of the fluxes
The main parameters of our model for the magnetic field in the LB are the magnetic field strength in the wall, the wall extension and the widths of the transition regions between the magnetic field in the wall and the outside. Varying these parameters, we study how the flux in the wall and inside the LB changes.
To do so, we run a set of simulations modifying each time only one parameter. To make these simulations less computing time expansive, we consider a miniature model with a smaller bubble, pc, and a reduced distance to the source, pc. Outside the bubble, we use instead of the JF model a uniform magnetic field directed along the axis with strength G. Moreover, we compute the CR flux at an earlier time, kyr. Therefore, the fluxes obtained should not be compared to experimental data, but serve to illustrate how the flux in the wall and inside the bubble depends on the various parameters. If not otherwise specified, we choose the widths as pc, pc and pc, while we set the magnetic field strength in the wall to G.
III.3.1 Wall thickness
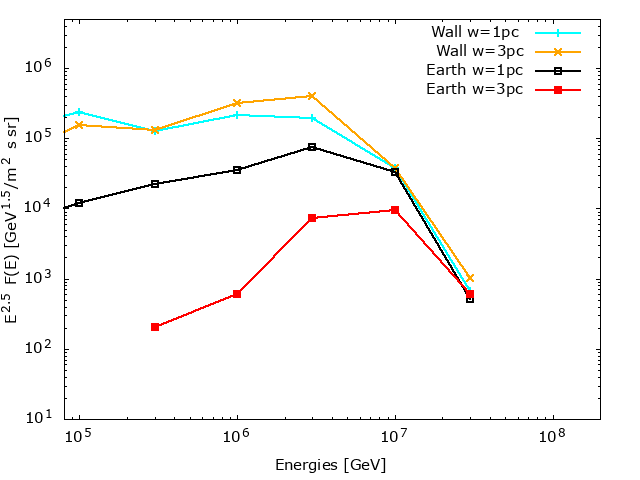
Figure 2 shows the flux inside the bubble and in the wall for two different values of the wall thickness, pc and pc, respectively. While the flux of protons in the wall is practically independent from the wall thickness , the fraction of protons traversing the wall and thus entering the bubble depends strongly on it. In contrast, the flux in the wall practically does not change varying , since only a small fraction of protons quits the wall and enters the bubble.
III.3.2 Wall magnetic field amplitude
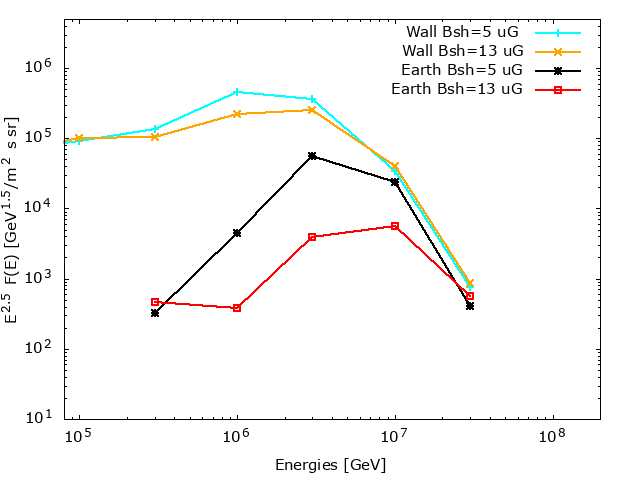
A similar behavior is found for the dependence of the fluxes on the amplitude of the magnetic field in the wall: A stronger magnetic field in the wall leads to a smaller fraction of protons entering the bubble, as they diffuse slower inside the wall. This behavior is shown in Fig. 3, where we plot the fluxes for two field strengths, G and G, in the shell. The flux inside the bubble is determined by the fraction of particles exiting the wall. It is a function of the wall thickness, the amplitude of the magnetic field in the wall, and the energy of the particle. For a given strength of the magnetic field one should compare the Larmor radius of the particle and the wall thickness: For , particles cross the wall easily without scattering, while for (and short enough propagation times) they are trapped in the wall.
III.3.3 Transition widths
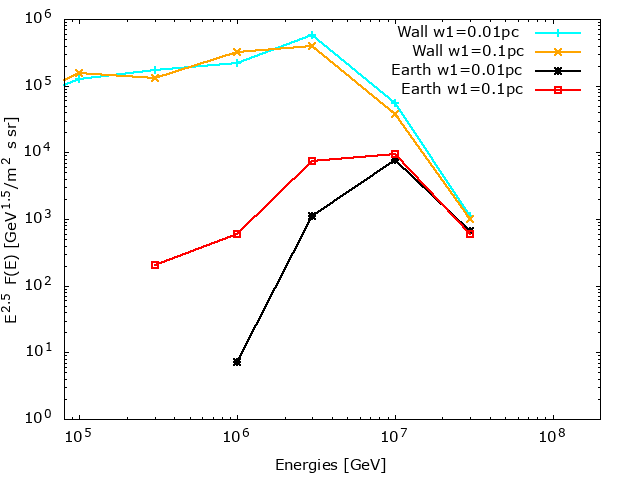
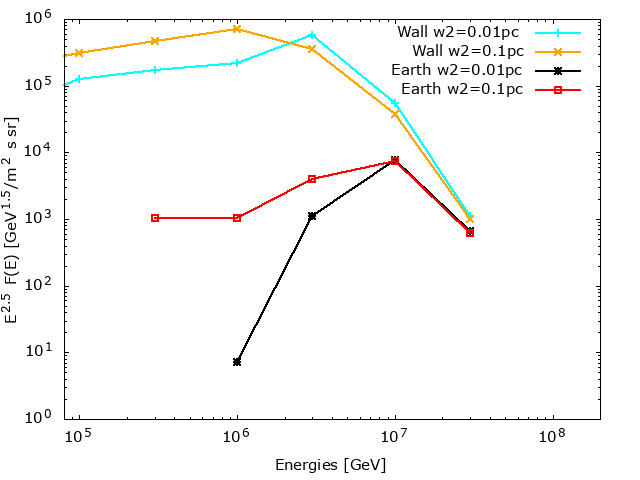
We have seen that the CR flux in the wall depends neither on the field strength nor the extension of the wall. In contrast, the width of the transition region between the outside and the wall influences the CR flux in the wall: When the transition is wider, the variation of the magnetic field strength is smaller and less protons are reflected. In the Fig. 5, one can see that the flux in the wall increases by a factor three for a transition width ten times larger. This implies also a higher flux inside the bubble. The same phenomena happen varying the second width between the bubble wall and the inside, as shown in Fig. 4: Increasing increases the flux inside the bubble, because less particles are reflected.
IV CR and secondary fluxes from Vela
After having discussed the parameter dependence of the CR flux, we present next the CR and secondary fluxes from Vela for the specific geometry and the magnetic field of the LB described in Sec. II.
IV.1 CR fluxes
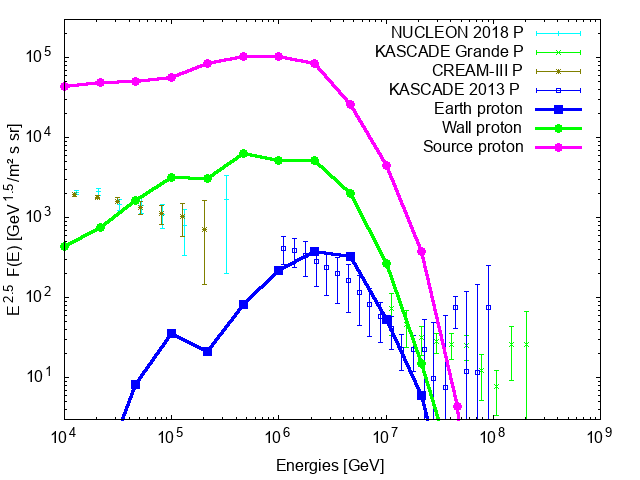
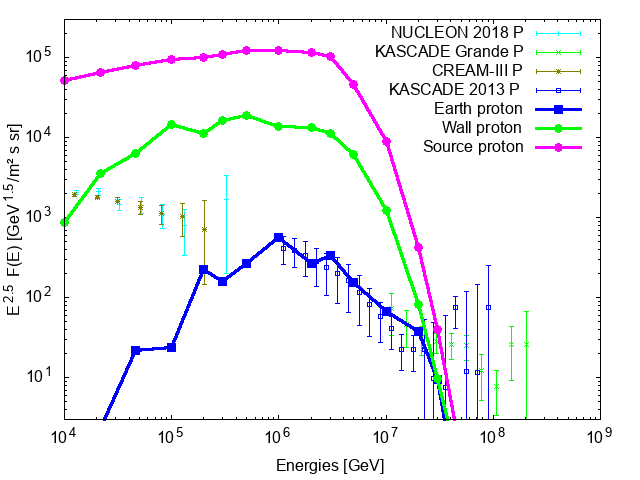
In Fig. 6, we show the normalised proton flux in the bubble wall, inside the bubble and around the source, for the cases U (top panel) and JF (bottom panel). Our results are compared at low energies to the data of direct cosmic ray measurements, NUCLEON Gorbunov et al. (2018a) and and CREAM–3 Yoon et al. (2017), while we show at higher energies indirect measurements from KASCADE and KASCADE-Grande Apel et al. (2013). At high energies, eV, the bubble wall is transparent, since the Larmor radius ( pc) of such protons is large compared to the thickness of the bubble wall. For energies below 1 PeV, particles start to be trapped in the wall and the flux inside the bubble is increasingly suppressed. While the general behaviour in both cases is similar, the proton flux at Earth is higher in the case JF. This difference can be explained by the larger transition width we use in case JF, pc, compared to pc in case U.
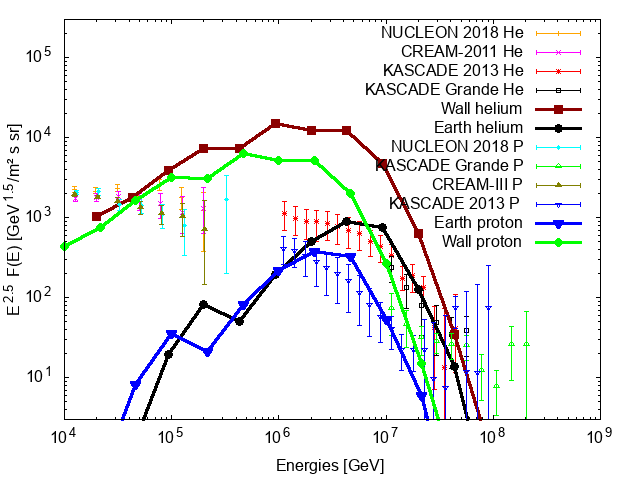
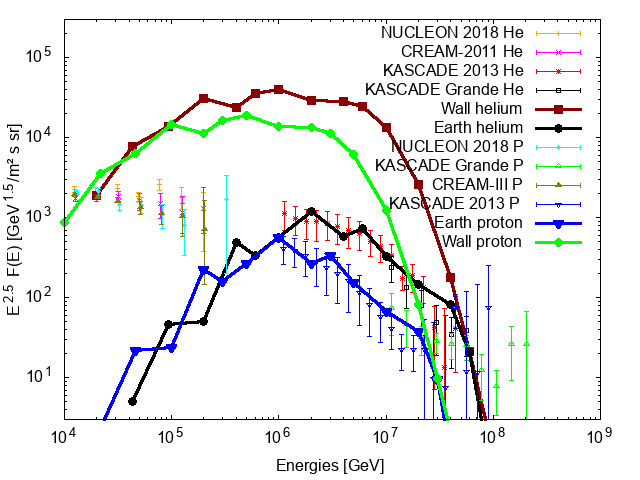
In Fig. 7, we compare the proton and helium fluxes from Vela in the bubble wall and at Earth compared to the data from Refs. Gorbunov et al. (2018a); Yoon et al. (2017); Apel et al. (2013). We see again that the larger transition width, pc used in case JF allows low-rigidity particles to enter more easily the bubble. As a result, a larger fraction of low-energy data can be explained by the contribution from Vela. Note also that the flux is dominated by helium in the region most interesting for the secondary production of neutrinos and photons.
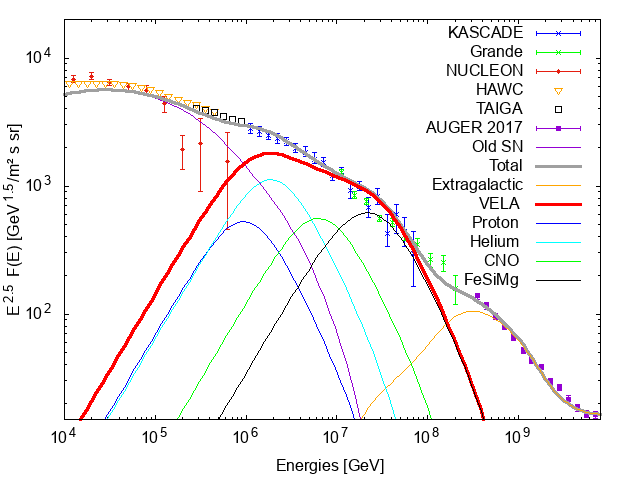
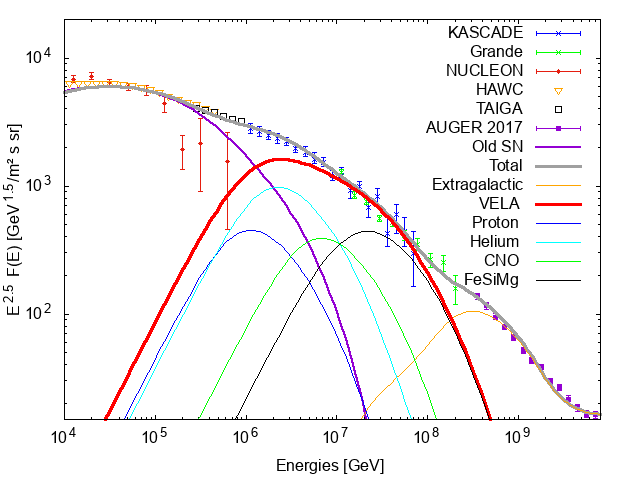
From Fig. 8, we see that the all-particles flux fits well the experimental data up to eV. In the energy range above eV, the extragalactic contribution becomes important which we model following Ref. Kachelrießet al. (2017). We compute the total energy output of Vela and the relative contribution of the different nuclear groups from the normalisation of the simulated data to the experimental ones. In the case JF, the relative energy fraction in protons found is 0.54, the one of helium 0.42, of CNO 0.03 and of FeSiMg 0.007, respectively. We obtain then as total energy output in CRs erg. In the case U, the relative energy fraction in protons found is 0.55, the one of helium 0.42, of CNO 0.025 and of FeSiMg 0.004, respectively, and the total energy output in CRs erg. The total kinetic energy of the Vela supernova calculated in Ref. Sushch et al. (2011) is erg. We note also that the CR acceleration efficiency of Vela should be high, as it is expected in the scenario of strong magnetic field amplification of Refs. Bell and Lucek (2001); Bell (2004).
IV.2 Neutrino and photon fluxes
The CR flux in the knee region is dominated by helium. Since the concept of a “nuclear enhancement factor” is not well defined Kachelrieß et al. (2014, 2019), we employ the Monte Carlo generator QGSJET-II (Ostapchenko, 2008, 2011) to calculate the photon and neutrino secondary fluxes. We assume a mass fraction of 24% of Helium in the target gas and calculate the average intensity of the secondaries as
| (13) | ||||
| (14) |
where is the production cross section of secondaries of type in interactions of nuclei with mass number and , denotes the distance from the Sun to the interaction point , the differential number density of CR protons and the density of protons and Helium in the bubble wall. We approximate the CR density by the average CR density in the wall calculated previously.
In Fig. 9 we compare the flux of neutrinos (red circles) and gamma-rays (magenta crosses) produced by CR interactions in the wall of the Local Bubble to Fermi-LAT and IceCube measurements. The IceCube neutrino data consist of the muon neutrino channel with measurements above the atmospheric background at TeV (green band) and cascade events which show an excess with respect to the continuation of the muon neutrino flux at TeV (red data with errorbars). Additionally, we show the neutrino flux from extragalactic sources as a thin black line for a power law, and the sum of the Galactic and extragalactic contributions with a thick black line. One can see that the sum of the two neutrino fluxes well fits the IceCube data.


The extragalactic diffuse gamma-ray flux measured by Fermi-Lat is shown with orange errorbars together with estimates for the contributions to the gamma-ray flux from extragalactic neutrino sources. The minimal flux close to the lowest values in the blue band corresponds to an neutrino flux, while the highest values is normalized to the measured diffuse gamma-ray background. Since up to of this background comes from unresolved blazars, the contribution of all other sources is restricted to the lowest part of the blue band, corresponding to an neutrino flux. The average diffuse gamma-ray flux at high galactic latitudes is presented with green points. This flux is dominated by the diffuse emission in the local part of our Galaxy. In addition to the expected cutoff in the diffuse emission above 100 GeV one can see a new hard component at GeV, found in Ref. Neronov et al. (2018). This component is fitted with the gamma-ray flux from the walls of the Local Bubble. The neutrino counterpart extends also to , and has a large contribution from high Galactic latitudes.
The integral photon flux from CR interactions in the wall of the LB are compared to KASCADE limits in Fig. 10. In order to detect this photon flux, new more sensitive experiments are required. The flux level of gamma-rays predicted in our model at PeV energies may be measured by CR experiments with a high hadron rejection power, like CARPET-3 Dzhappuev et al. (2019) or LHAASO Di Sciascio (2016).
V Conclusions
In this work, we presented a model which explains the high diffuse neutrino flux measured by IceCube at TeV by CR interactions in the walls of the Local Bubble. One of the main ingredients of our model is the presence of a young, nearby CR source like the Vela SNR. In typical models of the large-scale regular Galactic magnetic field like the one of Jansson and Farrar, where the Sun and Vela are connected by a regular magnetic field line, the resulting CR flux on Earth would overshot the observed level.
The strong magnetic field in the wall of the LB serves as a magnetic shield for CRs from such sources. In particular, the CR flux in the wall is much higher compared to the one measured on Earth. At the same time, the gas density is times higher in the wall compared to the interstellar one. Both factors lead to a significant neutrino and gamma-ray flux produced in the bubble walls. Combining this Galactic component with a standard extragalactic neutrino flux describes well the IceCube neutrino spectrum. The accompanying photon flux may be responsible for the TeV gamma-ray excess found recently in Ref. Neronov et al. (2018). This gamma-ray flux can be detected by gamma-ray sensitive CR experiments like LHAASO or Carpet-3. For instance, the Carpet-3 experiment will be sensitive in the sub-PeV energy range. At lower energies, a next generation gamma-ray experiment which is more sensitive than Fermi-LAT would be required to detect these gamma-rays.
Acknowledgements.
MK would like to thank the theory group at APC for hospitality.References
- Gaisser et al. (1995) T. K. Gaisser, F. Halzen, and T. Stanev, Phys. Rept. 258, 173 (1995), [Erratum: Phys. Rept.271,355(1996)], eprint hep-ph/9410384.
- Aartsen et al. (2016) M. G. Aartsen et al. (IceCube), Astrophys. J. 833, 3 (2016), eprint 1607.08006.
- Aartsen et al. (2020) M. G. Aartsen et al. (IceCube) (2020), eprint 2001.09520.
- Stecker et al. (1991) F. W. Stecker, C. Done, M. H. Salamon, and P. Sommers, Phys. Rev. Lett. 66, 2697 (1991), [Erratum: Phys. Rev. Lett.69,2738(1992)].
- Mannheim (1995) K. Mannheim, Astropart. Phys. 3, 295 (1995).
- Waxman and Bahcall (1997) E. Waxman and J. N. Bahcall, Phys. Rev. Lett. 78, 2292 (1997), eprint astro-ph/9701231.
- Loeb and Waxman (2006) A. Loeb and E. Waxman, JCAP 0605, 003 (2006), eprint astro-ph/0601695.
- Berezinsky et al. (2011) V. Berezinsky, A. Gazizov, M. Kachelrieß, and S. Ostapchenko, Phys. Lett. B695, 13 (2011), eprint 1003.1496.
- Murase et al. (2013) K. Murase, M. Ahlers, and B. C. Lacki, Phys. Rev. D88, 121301 (2013), eprint 1306.3417.
- Neronov and Semikoz (2016a) A. Neronov and D. V. Semikoz, Astropart. Phys. 72, 32 (2016a), eprint 1412.1690.
- Albert et al. (2017) A. Albert et al. (ANTARES), Phys. Rev. D96, 062001 (2017), eprint 1705.00497.
- Neronov and Semikoz (2016b) A. Neronov and D. V. Semikoz, Astropart. Phys. 75, 60 (2016b), eprint 1509.03522.
- Neronov and Semikoz (2016c) A. Neronov and D. V. Semikoz, Phys. Rev. D93, 123002 (2016c), eprint 1603.06733.
- Palladino et al. (2017) A. Palladino, C. Mascaretti, and F. Vissani, Eur. Phys. J. C77, 684 (2017), eprint 1708.02094.
- Palladino and Winter (2018) A. Palladino and W. Winter (2018), eprint 1801.07277.
- Neronov et al. (2018) A. Neronov, M. Kachelrieß, and D. V. Semikoz, Phys. Rev. D98, 023004 (2018), eprint 1802.09983.
- Neronov and Semikoz (2019) A. Neronov and D. Semikoz (2019), eprint 1907.06061.
- Taylor et al. (2014) A. M. Taylor, S. Gabici, and F. Aharonian, Phys. Rev. D89, 103003 (2014), eprint 1403.3206.
- Blasi and Amato (2019) P. Blasi and E. Amato, Phys. Rev. Lett. 122, 051101 (2019), eprint 1901.03609.
- Kalashev and Troitsky (2016) O. Kalashev and S. Troitsky, Phys. Rev. D 94, 063013 (2016), eprint 1608.07421.
- Berezinsky et al. (1997) V. Berezinsky, M. Kachelrieß, and A. Vilenkin, Phys. Rev. Lett. 79, 4302 (1997), eprint astro-ph/9708217.
- Feldstein et al. (2013) B. Feldstein, A. Kusenko, S. Matsumoto, and T. T. Yanagida, Phys. Rev. D88, 015004 (2013), eprint 1303.7320.
- Esmaili and Serpico (2013) A. Esmaili and P. D. Serpico, JCAP 1311, 054 (2013), eprint 1308.1105.
- Crocker and Aharonian (2011) R. M. Crocker and F. Aharonian, Phys. Rev. Lett. 106, 101102 (2011), eprint 1008.2658.
- Lunardini and Razzaque (2012) C. Lunardini and S. Razzaque, Phys. Rev. Lett. 108, 221102 (2012), eprint 1112.4799.
- Andersen et al. (2018) K. J. Andersen, M. Kachelrieß, and D. V. Semikoz, Astrophys. J. 861, L19 (2018), eprint 1712.03153.
- Dzhappuev et al. (2019) D. D. Dzhappuev et al., EPJ Web Conf. 207, 03004 (2019), eprint 1812.02663.
- Di Sciascio (2016) G. Di Sciascio (LHAASO), Nucl. Part. Phys. Proc. 279-281, 166 (2016), eprint 1602.07600.
- Desiati (2014) P. Desiati (IceCube), Nucl. Instrum. Meth. A 742, 199 (2014), eprint 1308.0246.
- Bouyahiaoui et al. (2019) M. Bouyahiaoui, M. Kachelrieß, and D. V. Semikoz, JCAP 1901, 046 (2019), eprint 1812.03522.
- Jansson and Farrar (2012) R. Jansson and G. R. Farrar, Astrophys.J. 761, L11 (2012), eprint 1210.7820.
- Giacinti et al. (2014) G. Giacinti, M. Kachelrieß, and D. V. Semikoz, Phys. Rev. D90, 041302 (2014), eprint 1403.3380.
- Giacinti et al. (2015) G. Giacinti, M. Kachelrieß, and D. V. Semikoz, Phys. Rev. D91, 083009 (2015), eprint 1502.01608.
- Welsh and Shelton (2009) B. Y. Welsh and R. L. Shelton, Astrophys. Space Sci. 323, 1 (2009), eprint 0906.2827.
- Giacinti et al. (2012) G. Giacinti, M. Kachelrieß, D. V. Semikoz, and G. Sigl, JCAP 1207, 031 (2012), eprint 1112.5599.
- Giacinti et al. (2018) G. Giacinti, M. Kachelrieß, and D. V. Semikoz, JCAP 1807, 051 (2018), eprint 1710.08205.
- Knie et al. (1999) K. Knie, G. Korschinek, T. Faestermann, C. Wallner, J. Scholten, et al., Phys.Rev.Lett. 83, 18 (1999).
- Benitez et al. (2002) N. Benitez, J. Maiz-Apellaniz, and M. Canelles, Phys. Rev. Lett. 88, 081101 (2002), eprint astro-ph/0201018.
- Fitoussi et al. (2008) C. Fitoussi et al., Phys. Rev. Lett. 101, 121101 (2008), eprint 0709.4197.
- Wallner et al. (2016) A. Wallner, J. Feige, N. Kinoshita, M. Paul, L. K. Fifield, R. Golser, M. Honda, U. Linnemann, H. Matsuzaki, S. Merchel, et al., Nature (London) 532, 69 (2016).
- Drury et al. (2003) L. O. Drury, E. van der Swaluw, and O. Carroll (2003), eprint astro-ph/0309820.
- Bell and Lucek (2001) A. R. Bell and S. G. Lucek, Mon. Not. Roy. Astron. Soc. 321, 433 (2001).
- Bell (2004) A. R. Bell, Mon. Not. Roy. Astron. Soc. 353, 550 (2004).
- Kachelrieß et al. (2015) M. Kachelrieß, A. Neronov, and D. V. Semikoz, Phys. Rev. Lett. 115, 181103 (2015), eprint 1504.06472.
- Gorbunov et al. (2018a) N. Gorbunov et al. (2018a), eprint 1809.05333.
- Yoon et al. (2017) Y. S. Yoon et al., Astrophys. J. 839, 5 (2017), eprint 1704.02512.
- Apel et al. (2013) W. D. Apel et al., Astropart. Phys. 47, 54 (2013), eprint 1306.6283.
- Kachelrieß et al. (2018) M. Kachelrieß, A. Neronov, and D. V. Semikoz, Phys. Rev. D97, 063011 (2018), eprint 1710.02321.
- Kachelrießet al. (2017) M. Kachelrieß, O. Kalashev, S. Ostapchenko, and D. V. Semikoz, Phys. Rev. D96, 083006 (2017), eprint 1704.06893.
- Gorbunov et al. (2018b) N. Gorbunov et al. (2018b), eprint 1809.05333.
- Alfaro et al. (2017) R. Alfaro et al. (HAWC), Phys. Rev. D96, 122001 (2017), eprint 1710.00890.
- Berezhnev et al. (2015) S. F. Berezhnev et al., Bull. Russ. Acad. Sci. Phys. 79, 348 (2015), [Izv. Ross. Akad. Nauk Ser. Fiz.79,no.3,381(2015)].
- Yoon et al. (2011) Y. S. Yoon et al., Astrophys. J. 728, 8 (2011), eprint 1602.04710.
- Fenu (2017) F. Fenu (Pierre Auger), pp. 9–16 (2017), [PoSICRC2017,486(2018)].
- Sushch et al. (2011) I. Sushch, B. Hnatyk, and A. Neronov, Astron. Astrophys. 525, A154 (2011), eprint 1011.1177.
- Kachelrieß et al. (2014) M. Kachelrieß, I. V. Moskalenko, and S. S. Ostapchenko, Astrophys. J. 789, 136 (2014), eprint 1406.0035.
- Kachelrieß et al. (2019) M. Kachelrieß, I. V. Moskalenko, and S. S. Ostapchenko (2019), eprint 1904.05129.
- Ostapchenko (2008) S. Ostapchenko, Phys. Rev. D77, 034009 (2008), eprint hep-ph/0612175.
- Ostapchenko (2011) S. Ostapchenko, Phys. Rev. D83, 014018 (2011), eprint 1010.1869.