Simulated Response of MuTe, a Hybrid Muon Telescope
Abstract
In this paper we present a complete and detailed computational model of the response of the hybrid Muon Telescope (MuTe), designed to perform muography volcanic studies. This instrument combines two particle detection techniques: first, a muon hodoscope based on two panels of plastic scintillator bars; and a Water Cherenkov detector located behind the rear scintillator panel acting both as a coincidence and a discriminating detector. The simulation model includes: materials, geometries, dimensions, and the photo-sensitiveness of the detectors. The simulation results, in agreement with the measured data, were used to set up the muon detector trigger for the expected energy dependent signal.
1 Introduction
Cosmic rays (CR) are continuously impinging on the Earth’s atmosphere producing cascades of secondary particles called extensive air showers (EAS), having three main components: the electromagnetic, the hadronic, and the muonic. The electromagnetic component produced by electrons, positrons, and photons, couple through several processes. The hadronic component generated by barions and mesons originated through QCD effects and finally, the muonic component, due mainly to muons coming from the decay of charged pions, kaons, and other mesons through weak interaction processes. The energy of these muons comprises a broad spectrum, but only those with the highest energies ( TeV, produced during the very first interactions of the evolving particles cascade such as the decay of charmed mesons) are collectively known as prompt muons and have enough energy to cross from hundreds to thousand meters of rock [1].
Muography is an emerging technique based on measuring the attenuation of the directional muon flux moving traversing geological or anthropic structures [2]. Nowadays we are witnessing several new successful academic and commercial applications such as the detection of hidden materials in containers [3], archaeological building scanning [4, 5], nuclear plant inspection [6], nuclear waste monitoring, underground cavities [7], the overburden of railway tunnels [8] and vulcanology applications (see e.g., [9] and references therein). The existence of more than a dozen active volcanoes in Colombia, which represents significant risks to the nearby population [10, 11, 12], motivated local research groups to explore possible applications of the muography technique [13, 14, 15, 16, 17, 18].
Hodoscopes are the most common detectors designed and used for volcano muography and consist of two or more panels devised to identify muon trajectories. Projects like MU-RAY [19], ToMuVol [20], and DIAPHANE [21] use hodoscopes based on different detection technologies: emulsion plates, resistive plate chambers, micromegas, multi-wire proportional chambers, and scintillators, just to mention the most common ones. Each of these techniques has advantages and disadvantages: emulsion plate detectors [4, 22] provide an excellent spatial resolution of the order of sub-microns, are passive, and easy to handle. On the other hand, they have short lifetimes, and it is not possible to discriminate the time-stamp of dynamic phenomena, because the recorded events accumulate in the plates. Gaseous detectors, Resistive Plate Chambers [23, 24], Micromegas [25], and Multi-Wire Proportional Chambers [26], make possible the capture of the short traces due to the detected particles in the micrometre range. Finally, scintillation based detectors, using segmented [6, 27, 28] or continuous scintillators [29, 30, 31] are more robust and affordable than gaseous and emulsion detectors. Nevertheless, their spatial precision is not as good as the accuracy of the other detectors, since the segments generally are of the order of centimetres.
In this paper, we present a detailed computational Geant4 [32] model of the hybrid Muon Telescope (MuTe) compared with the first data taken in Bucaramanga-Colombia. MuTe combines two techniques: a hodoscope with two detection planes of plastic scintillator bars, and a Water Cherenkov Detector (WCD) which acts as an absorbing element and as a third active coincidence detector. The model includes materials, detailed geometries and dimensions, and the detector photo-sensitive device characteristics. In the next section, we briefly describe the rationale behind the MuTe design. Section 3 discusses the response from the scintillator bar hodoscope to the impinging cosmic ray background, with emphasis on the bar scintillator model and the possible attenuation effects. In section 3.1.2, we compare the simulation results with data obtained from an experimental laboratory setup. The relationship between temperature and the breakdown voltage of the silicon photomultiplier (SiPM) used in the scintillator panels is shown in section 3.3. Section 4 presents the response of the WCD and also compares some of the results with recent lab measurements. Finally in section 5 we compile some final remarks and conclusions.
2 The MuTe instrumental design
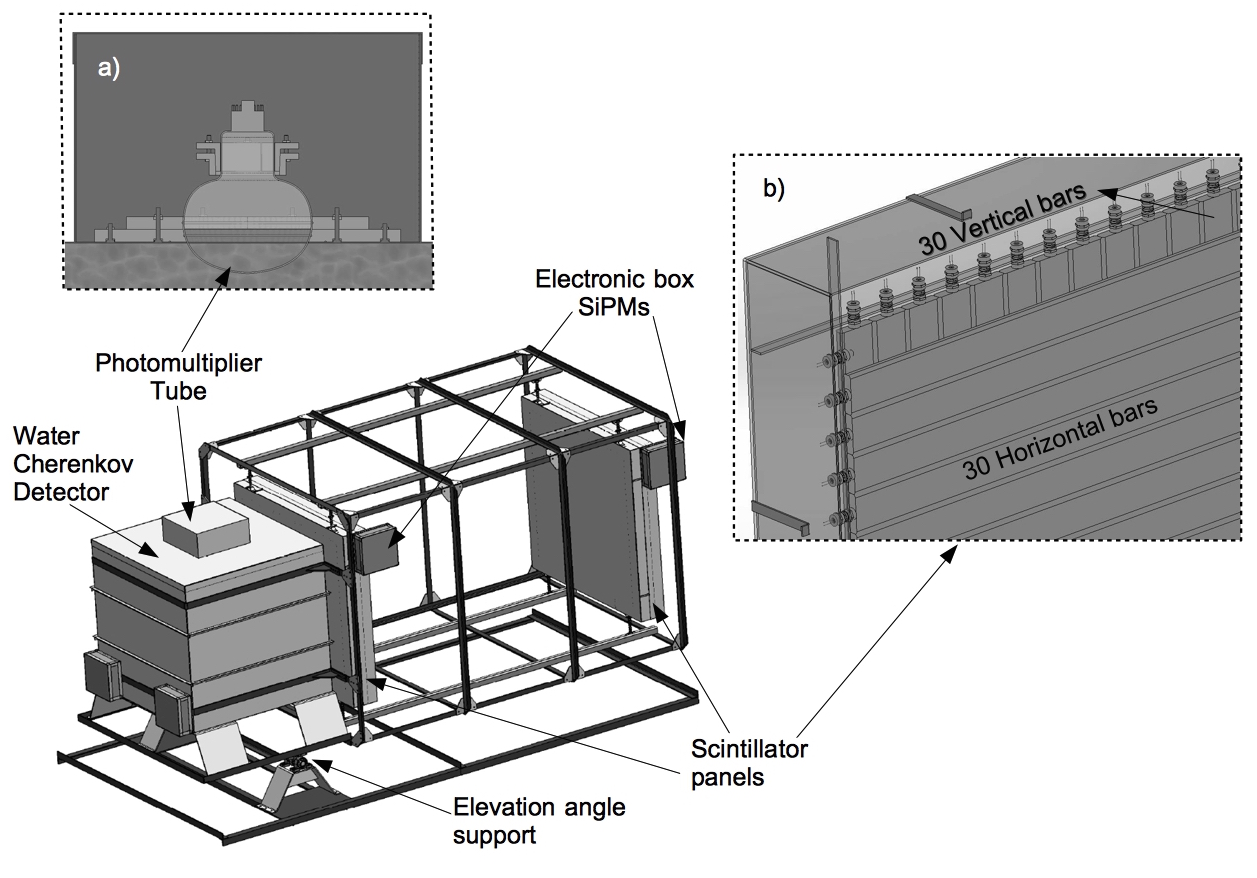
The Muon Telescope shown in figure 1, is a hybrid detector that combines two technologies: a two-panel scintillator bar hodoscope, and a water Cherenkov detector, devised to increase the signal/background ratio and to minimize the upward background [33, 34, 35, 36]. This hybrid technique allows us to estimate not only the incoming flux directions but also the range of energy deposited by the impinging particles [13, 18].
The panels of the hodoscope consist of an array of vertical horizontal scintillator bars (see plate b in figure 1), with dimensions cm cm cm long, providing pixels of cm cm, and a total detection surface of cm2.
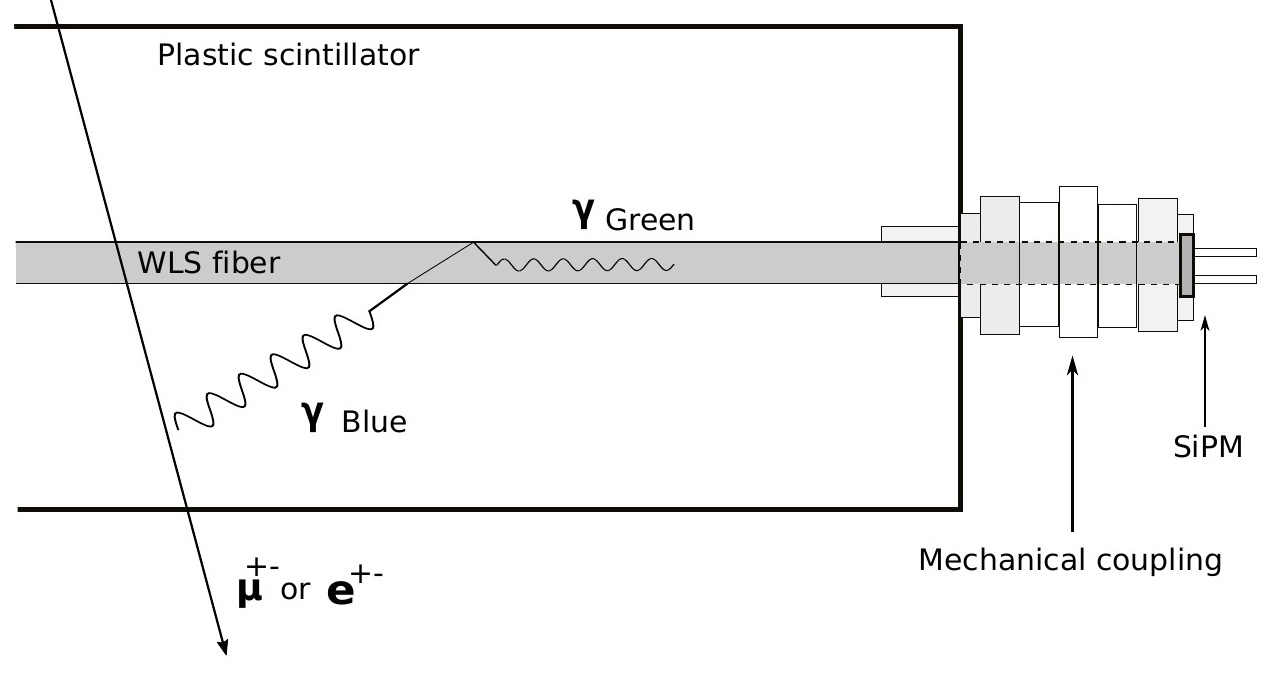
Each bar has a tunnel longitudinally drilled, where is inserted a Saint Gobain BCF92 multi-cladded wavelength shifter optical fiber (WLS) [37]. Scintillation photons produced by the passage of charged particles through the bars are partially collected, absorbed, re-emitted in a different wavelength, and transported along the fiber. One of the ends of the fiber is polished at an angle of to increase internal reflection and to favour photon collection in the opposite end. Mechanically coupled to the fiber, is a silicon photomultiplier (Hamamatsu S-CS) consisting of avalanche photodiodes [38]. This device has a spectral detection range from nm to nm, with its maximum sensitivity around nm.
Casual coincidences detection and discrimination of the muon signals from upward background are enhanced by using an in-house developed Time-of-Flight (ToF) recording system, complemented by a cubic cm side water Cherenkov detector. The WCD consists of a cubic stainless steel container, internally coated with a reflective and diffusive material ( mm Tyvek [39]) and filled with m3 of purified water, having an ” Hamamatsu R5912 photomultiplier tube (PMT) placed at the centre of the tank roof as shown in plate a, figure 1. The photosensitive PMT window is in direct contact with the water and can detect Cherenkov photons.
3 Modelling the MuTe hodoscope
The response of the hodoscope bars refers to the signal produced in the SiPM photo-sensor when a charged particle crosses each scintillator bar. Indirect detection of secondary EAS photons is also possible mainly through Compton scattering and pair production. However, as the scintillation detector volume is relatively small, these mechanisms are highly improbable.
As shown in figure 2, charged particles impinging on the scintillators produce photons in the blue-violet-ultra violet bands, which can be absorbed by the plastic material or collected by the WLS. The fiber cladding captures the photons, where they can be absorbed, re-emitted (in the green optical band) and guided to the photo-sensor device located at one end of the fiber [37].
In the following sections we shall discuss the Geant4 bar simulation model, the estimation of the average response of the hodoscope panels to the passage of charged particles –especially in the energy range of the Muon Reference Signal (MRS) which, for the present work will be of GeV– and the experimental setup to measure the attenuation of the Bar-fiber-SiPM signal (see section 3.3)
All the simulations performed are for muons with GeV, which are the most frequent at the m.a.s.l of Bucaramanga. The Geant4 (version 10.3.2) modelling for the MuTe scintillator bar and WCD uses the QGSP_BERT_HP physics list. The bar model, based on the WLS optical example, has an extra Optical Physics List that includes the Wavelength Shifter, Cherenkov, Scintillation, Boundary effects and Absorption process, as well as the Rayleigh scattering and the Mie HG Scattering process, to simulate the propagation of photons inside a WLS fiber.
3.1 The scintillator bar model
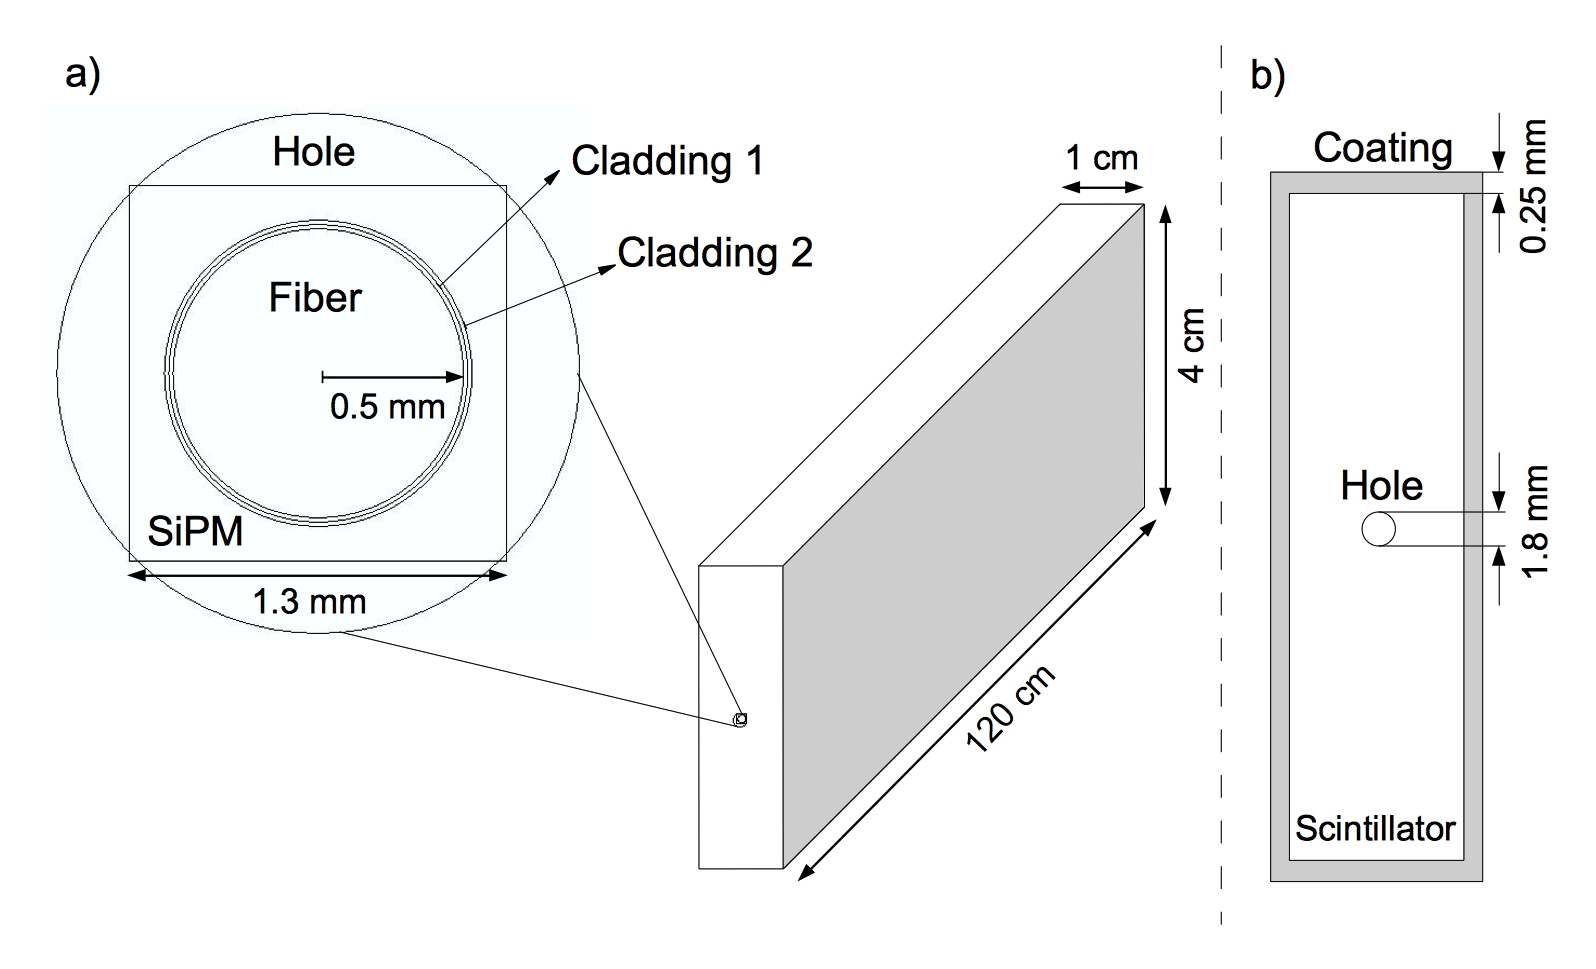
The Geant4 model of the bar, shown in figure 3, consist of a polystyrene scintillation parallelepiped with an index of refraction , and a photon absorption length of cm. This bar has a coating material made of % TiO2 and % polystyrene, with a reflectivity of and a thickness of mm (see figure 3 plate b). The optical surface between the coating and the scintillator bar is a Glisur model dielectric-dielectric interface defined in Geant4 with Ground finish and polishment . There is a tunnel ( mm diameter), drilled through the central axis of the bar, in which a multi-cladded WLS fiber is inserted. As shown in plate a, figure 3, the fiber model is a solid cylinder of poly-methyl methacrylate, cm long and mm radius. The first cladding is a cylindrical shell of polyethylene mm thick and the second one is of fluorinated polyethylene with the same thickness. The optical surfaces between the fiber and the first cladding, and between the claddings are Glisur models with Ground finish dielectric-dielectric interface, polishment and reflectance .
We model the SiPM as a square surface of side mm attached to one end of the fiber. The simulation employs the photon detection efficiency of the SiPM Hamamatsu S-CS installed in MuTe.
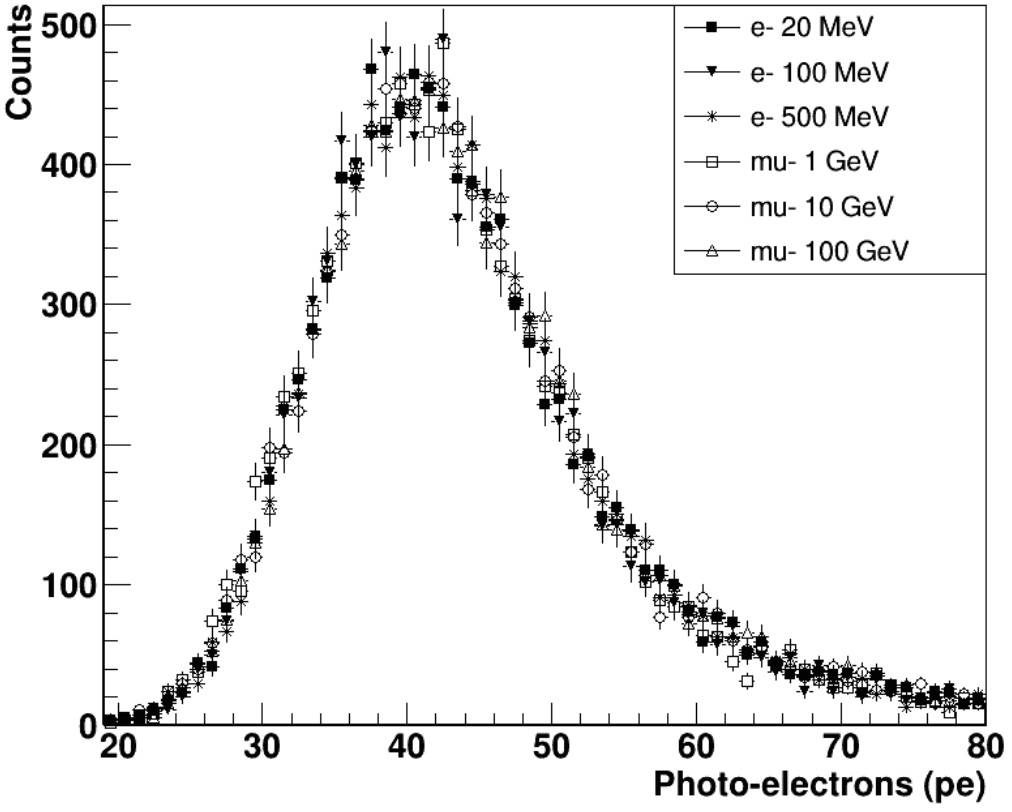
Figure 4 displays the simulation results of the scintillator bar response to charged particles of different energies. The distribution of the number of photo-electrons generated by electrons of MeV, MeV and MeV has the same profile as those corresponding to the muons of GeV, GeV and GeV, with a mean value around pe. This occurs because both these particles have a similar stopping power in polystyrene, i.e. [40], so they all deposit about MeV of energy when passing through cm of polystyrene,
| (3.1) |
where cm, is the distance traveled by the particles in the bar and g/cm3 is the polystyrene density. Therefore this detector is not able to distinguish muons from electrons, and it is necessary to use the WCD to distinguish between muon events and background.
3.1.1 SiPM-Fiber coupling
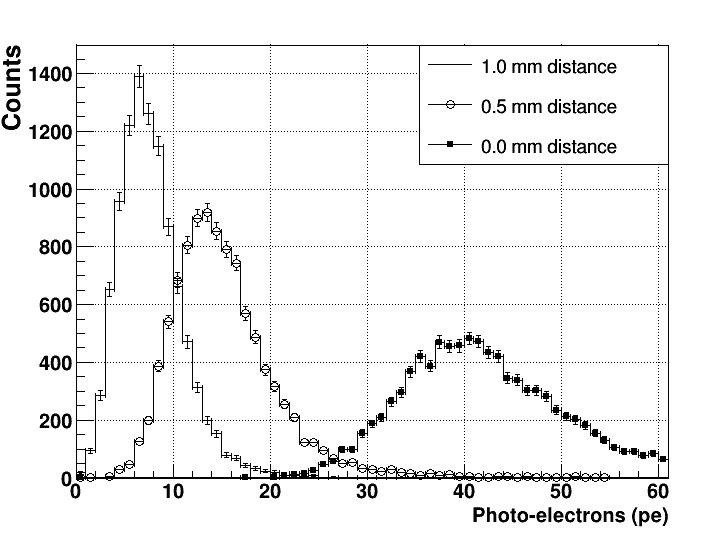
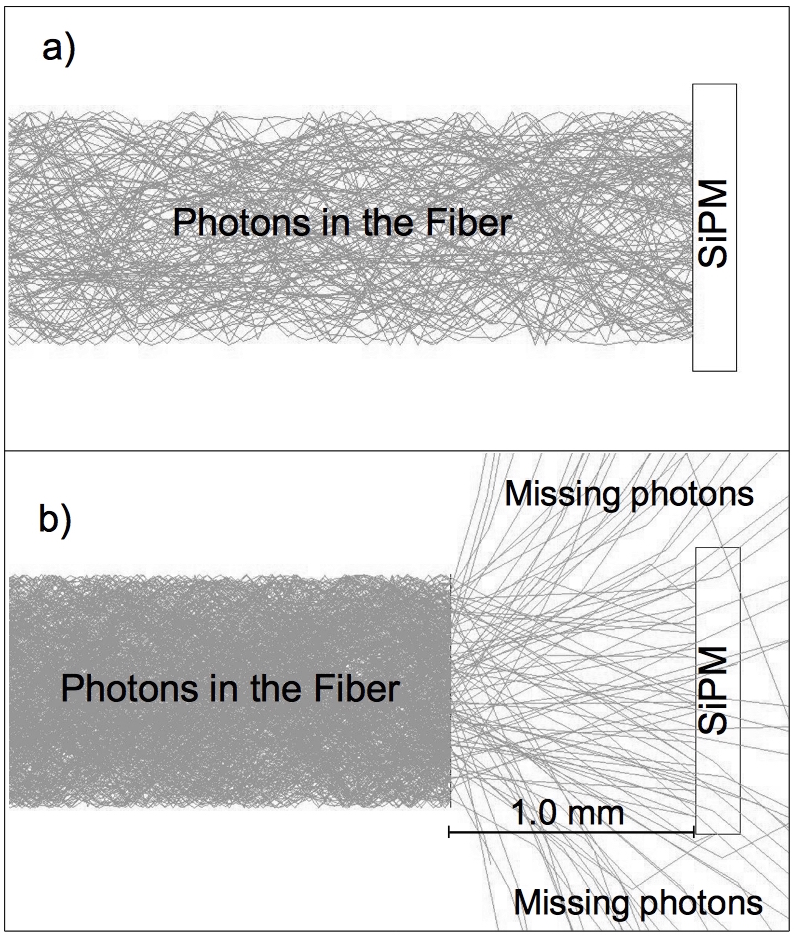
The Geant4 model allows estimating the quality of the coupling between SiPM and fiber. This coupling is ideal when they are side by side, without any space between them (see figure 5 plate a). Thus, all the travelling photons at the edge of the fiber impact directly on the SiPM obtaining an average number of photo-electrons for an ideal coupling of pe. Two non-ideal coupling were simulated with distances of 0.5 mm and 1.0 mm between the SiPM and the fiber (shown in figure 5 plate b). This space is filled with air to make the simulation as real as possible. The number of pe reduces to at mm of distance, representing a loss of 82% of the signal compared to the ideal case, as shown in figure 5. This result gives an idea of when a Bar-Fiber-SiPM system of the real detector is poorly coupled and should be replaced/checked.
3.1.2 Attenuation of the photons in the Bar-Fiber-SiPM system
The light that propagates within the WLS fiber suffers an inevitable attenuation due to: photons escaping from the optical guide, and others absorbed by the material while being transported to the SiPM.
From the simulations of the scintillation detector, we can count the number of pe generated in the SiPM when a MRS crosses the bar at different distances, , from the point of impact to the SiPM location (see Figure 6). These distances were chosen to take into account the width of the pixels of the hodoscope, i.e., cm wide. Therefore varies as, cm, , and we obtain a distribution of the number of photo-electrons produced in SiPM as a function of . We average its value through a Gaussian adjustment. The attenuation values are normalized to the maximum value, i.e. pe (when the MRS impacts at cm from the SiPM).
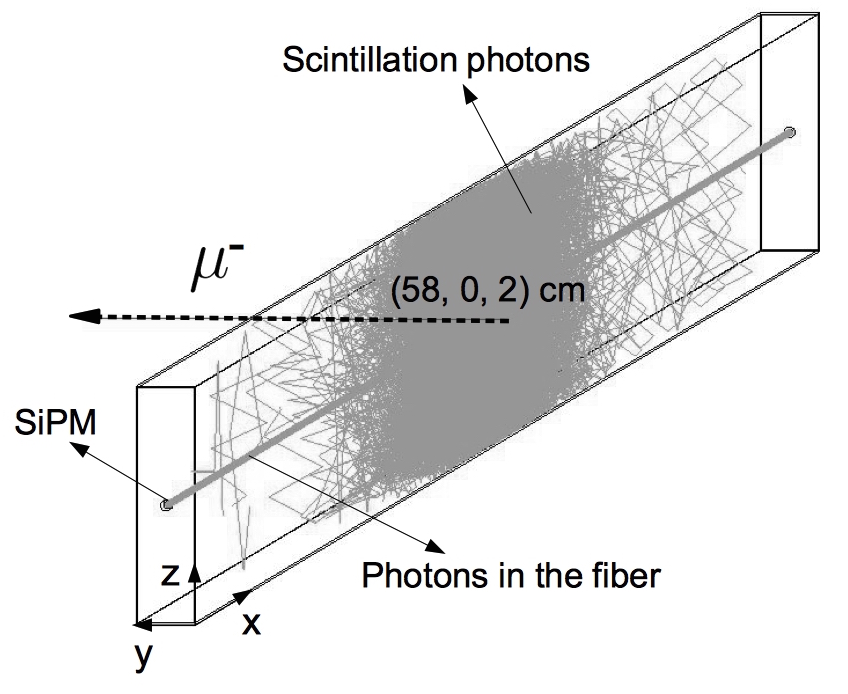
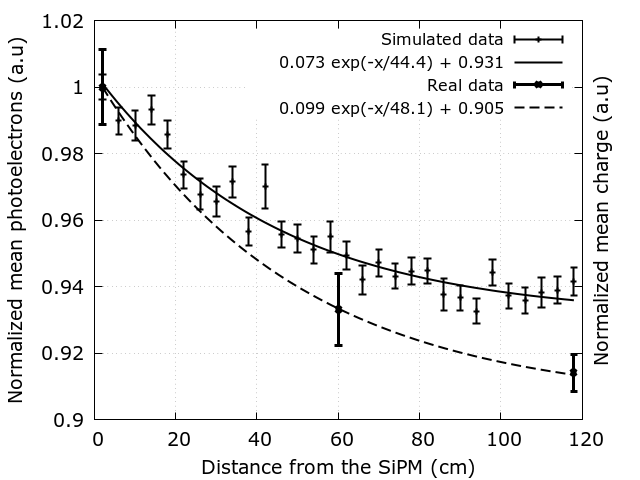
Figure 7 shows the result of this simulation. If the particle impacts at the position closest to the SiPM (i.e. cm), the simulated data has the maximum mean value of photo-electrons that decreases with the distance from the SiPM as an exponential function ,
| (3.2) |
From this plot, it follows that the attenuation in the Bar-Fiber-SiPM system is around %, which agrees with the experimental data () as shown in figure 7. The fit function of the attenuation in the measured data is,
| (3.3) |
and the comparison with shows a resemblance between both attenuation factors, and , which indeed are very close. In section 3.3 we discuss the details of the experimental set-up to obtain the measured attenuation.
The MRS detection with scintillator bar generates a number of pe in the SiPM at a time and we can use figure 8 to estimate the time needed to collect the total number of photo-electrons produced. From the left plate of figure 8 we notice that % of the total photo-electrons occurs in the first ns when the MRSs hit the bar cm from the SiPM. From the right plate of the same figure, we observe that only % of the pe are produced in the same time, when the MRSs impact at cm from the SiPM. In both cases, the total number of pe is reached by ns, which is, the average time necessary to collect the total of pe produced by a muon impinging at any point of impact in the bar.


3.2 Simulated attenuation in the hodoscope
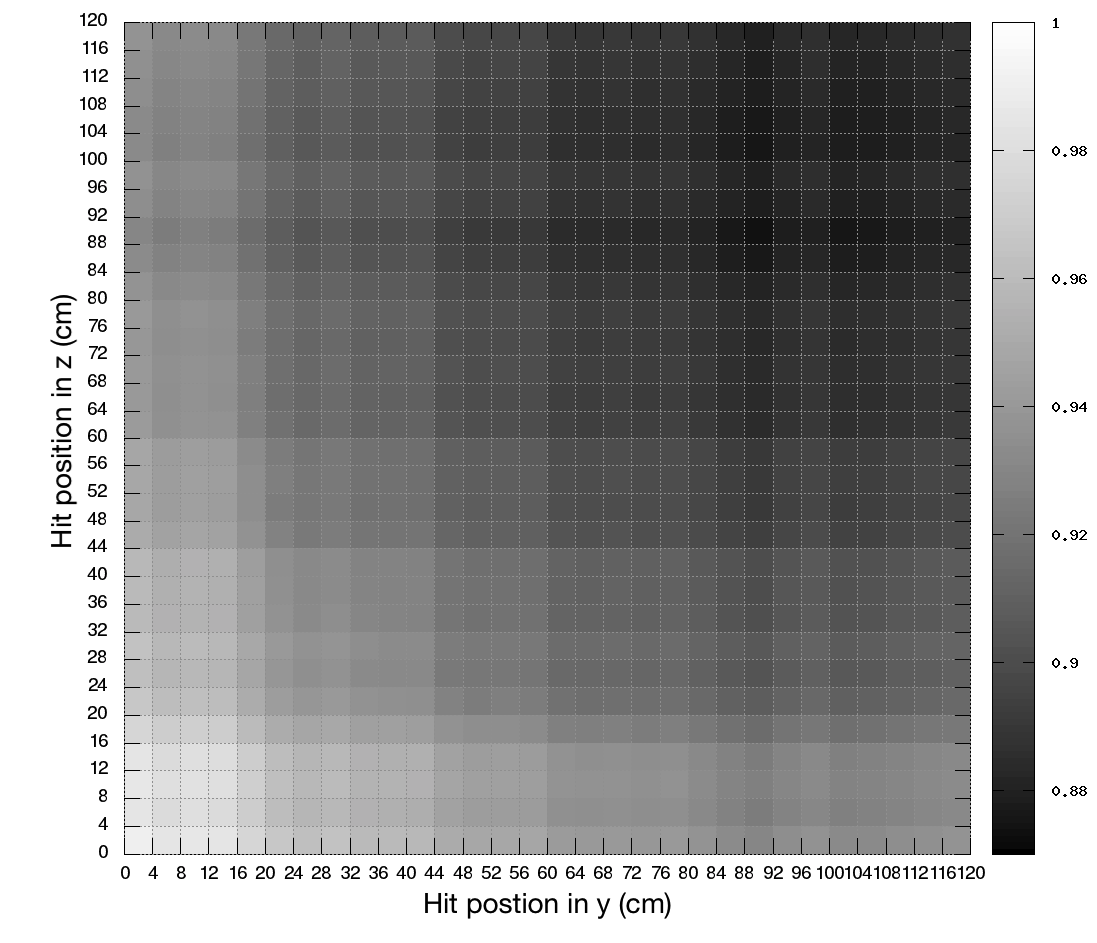
The probability of producing photo-electrons in the horizontal and vertical scintillators bar is a crucial concept in determining the response of each panel of the hodoscope. The bar simulation generates the response of a detection panel to MRSs, and due to attenuation, independent events in a particular pixel are given by
| (3.4) |
where and represent the probabilities from the horizontal () and vertical () bars, respectively.
Figure 9 displays the probability of photo-electrons produced by GeV muons striking each panel pixel, obtained from equation 3.4. These results are valid for the front and rear panels, and display a gradual decrease in both and -direction, as the pixel is further away from the SiPM. In pixel, the maximum number of pe is produced and then decreases with distance up to % at the furthest position. This difference can be associated with the attenuation of photons in the Bar-Fiber-SiPM system.
3.3 Experimental set-up to measure the Bar-Fiber-SiPM signal attenuation
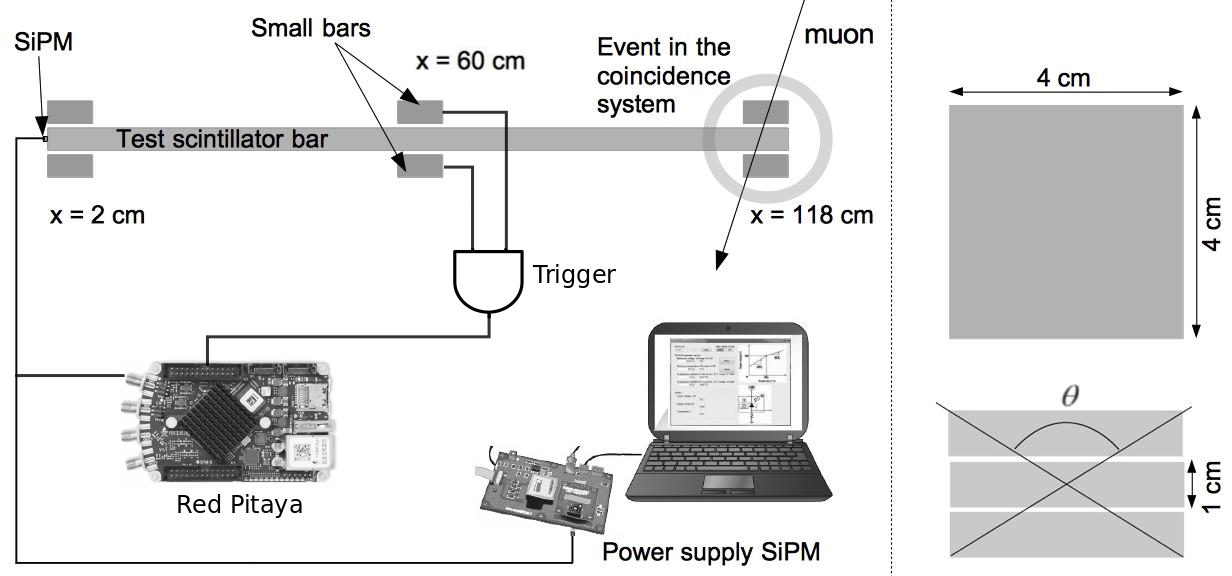
Figure 10 displays the experimental setup of the coincidence system. An event is recorded if a simultaneous signal appears in the scintillator bar and in two small bars above and below. The maximum angle for the coincidence system is . To estimate the attenuation of the Bar-Fiber-SiPM system, we measure the signal produced by charged particles crossing at three points: cm, cm and cm.
The acquisition system (Red Pitaya development board) records pulses with a frequency of MHz. The system was synchronized for coincidence pulses at each position in the test scintillator bar. The frequency of events per minute, measured with an oscilloscope Tektronix TDS 2002B, was per minute for cm2. Thus, with this rate, it is possible to detect particles min-1 cm-2. After calibrating for noise, we recorded pulses in the three positions. From each averaged pulse, the mean deposited charge was estimated by calculating the attenuation percentage, and normalizing values using figure 7.
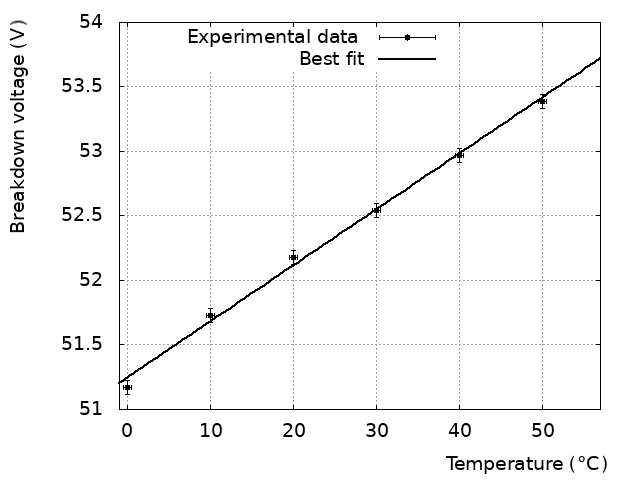
The thermal stability of the SiPMs was analyzed before performing the measurements. The SiPM can vary their operation mode when the bias voltage, , is less than the breakdown voltage, , which changes with temperature. Therefore, a temperature-controlled box regulated by a TEC1-12706 thermoelectric Peltier cell was built and mounted on an aluminium frame, where we placed the SiPM.
Dark-Current [42] measurements ranging from C to C illustrate the linear dependence of with temperature (see figure 11). It is clear that with each C of temperature, the changes around V.
4 Modelling MuTe water Cherenkov detector response
The WCD indirectly detects charged particles, by the Cherenkov light emission from those secondaries travelling through the water. The photo-multiplier tube detects photo-electrons according to its quantum efficiency, which depends on the wavelength of the impacting photon. Next, we will discuss some results from the detector simulation, as well as the first data recorded by the WCD in Bucaramanga, Colombia.
4.1 The WCD model
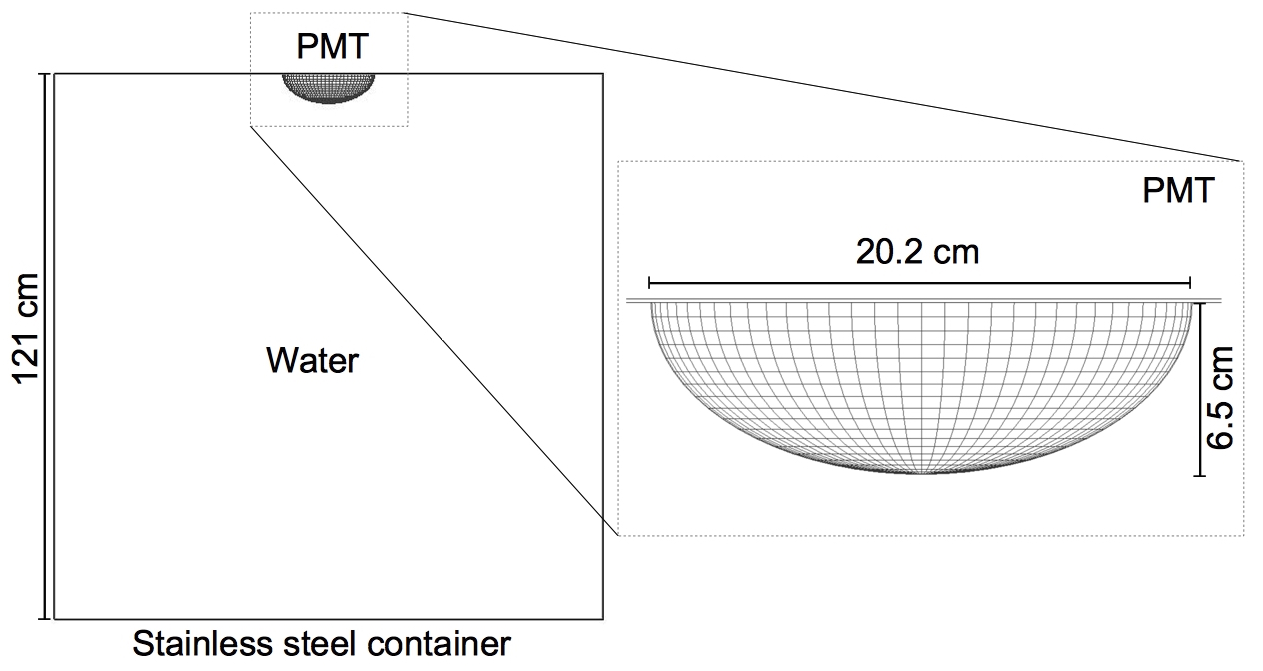
The WCD Geant4 model is a stainless steel cube of length cm, filled with purified water. The water has a refractive index , which varies between and , and a photon absorption length ranging from m to m depending on the energy. The Tyvek is a LUT model between the water and the container, with groundtyvek finish, a dielectric-LUT interface and a reflection index .
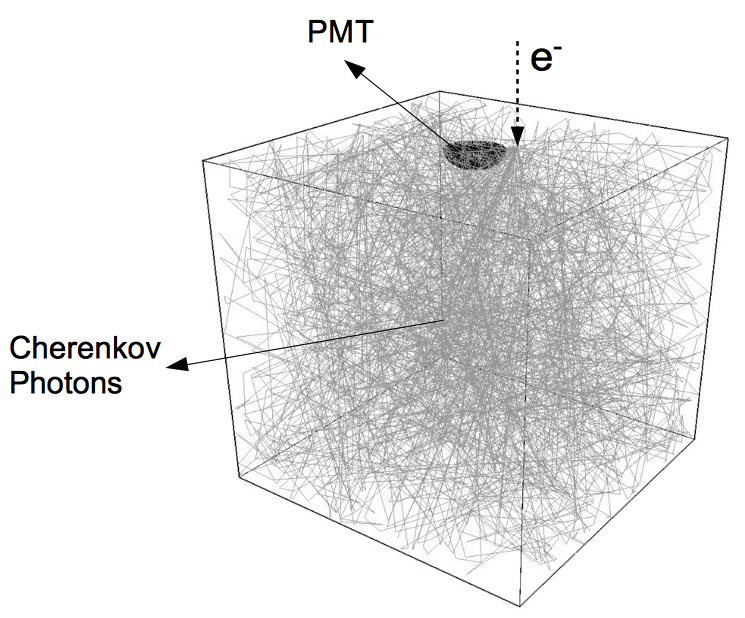
We simulate the photo-cathode of the PMT as a half-ellipsoid located on top of the water cube, as shown in figure 12. The Quantum Efficiency (QE) function of this device was introduced in the code, taking into account the reference data of the Hamamatsu R5912 [38], and represents an improvement over previous simulations of WCDs [43]. The QE determines whether photons reaching the outer surface of the photo-cathode will produce photo-electrons. The WCD response is given in terms of the number of pe generated by each particle interacting with it.
4.2 Estimation of the Vertical Equivalent Muon unit
The Vertical Equivalent Muon (VEM) –defined as the average charge collected in the PMT when a high-energy muon crosses the entire detector vertically– is generally adopted as the unit in the calibration of the energy deposited by incident particles, and is independent of the detection position [44].
The Geant4 simulation allows the injection of muons with a chosen energy and direction. In the modelling, we inject vertical muons with GeV over the WCD. These particles produce many Cherenkov photons, , which strike the surface of the photo-cathode, producing numerous photo-electrons, , depending on their wavelength. We can estimate the efficiency of the WCD in the following way: one VEM of GeV generates around Cherenkov photons in cm of water. Since only of those photons reach the external surface of the photo-cathode, and on average about pe are produced, the system has a muon detection efficiency of %, that is,
| (4.1) |
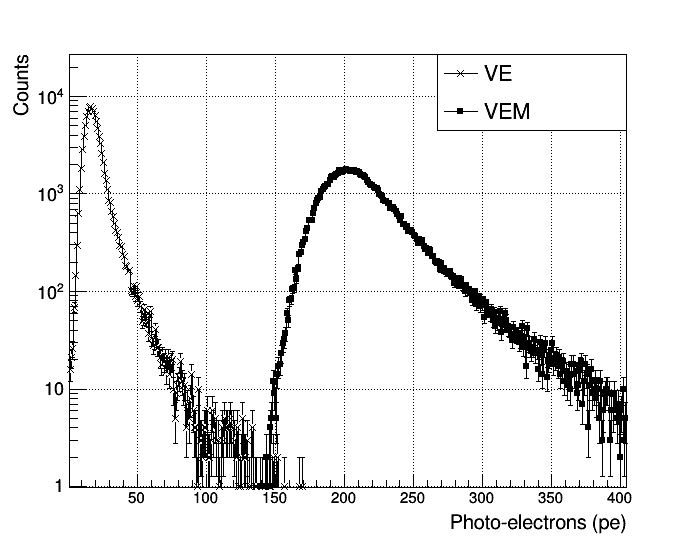
To compare the WCD response to muons and electrons at Bucaramanga, we simulated the impact of vertical electrons (VE) of MeV with the same initial directions and impact points (see figure 13). The histograms illustrating the distribution of the number of photo-electrons of VE and VEM are shown in figure 13, where we can see that the mean value of the VE is smaller than that of the VEM, pe, i.e the VE is around % of the VEM.
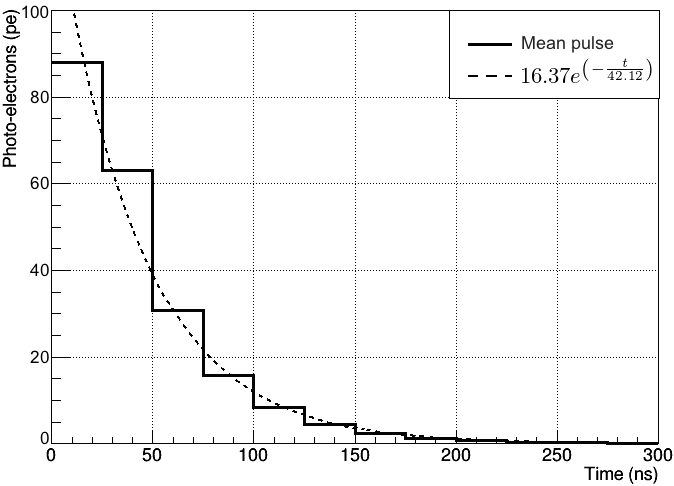
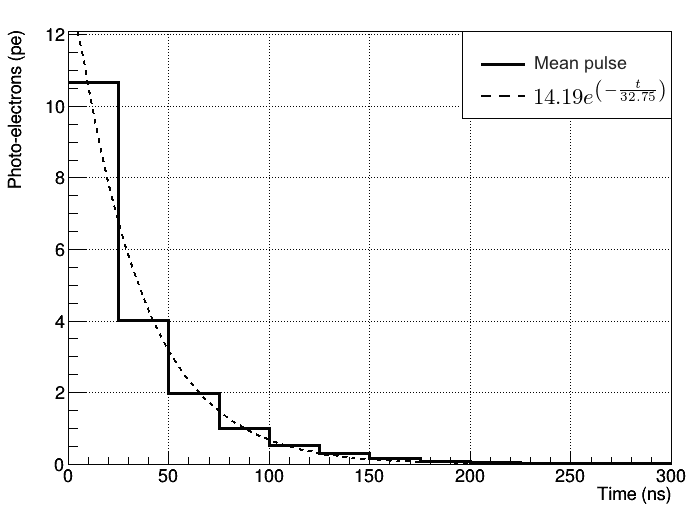
Next, in figure 14 the number of pe versus time is shown for both pulses: VEM (left) and VE (right). We obtain attenuation in time and length from the best fits to the distribution histograms. Finally, table 1 summarizes the comparison between both muons and electrons.
| ( GeV) | ( MeV) | |
|---|---|---|
| (120 1) cm | (10 1) cm | |
| 46857 13 | 3538 1 | |
| 1617 1 | 132.1 0.1 | |
| 203.2 0.2 | 16.729 0.003 | |
| (42.12 0.01) ns | (32.75 0.03) ns | |
| (7.332 0.001) m | (9.430 0.002) m |
4.3 WCD response to the cosmic ray background radiation
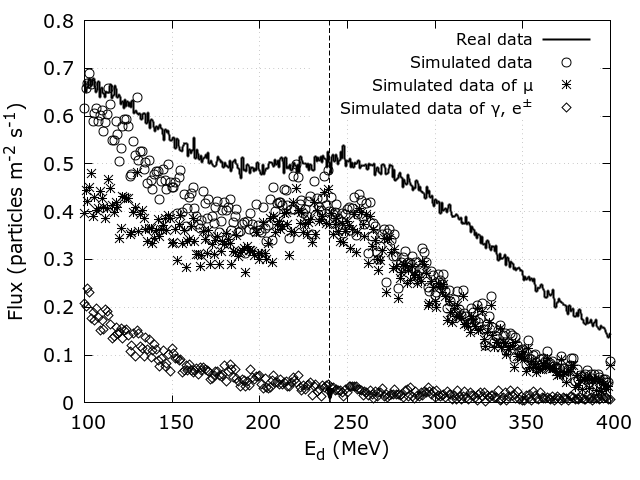
The LAGO-ARTI framework allows us to estimate the response of the WCD to the cosmic ray background radiation flux () at any site [45]. This toolkit employs a Geant4 code to estimate the number of Cherenkov photons detected by the PMT with its quantum efficiency. The ARTI framework uses the energy and the momentum of the particles from as input and obtains the flux by using the CORSIKA code [46], with a geomagnetic correction from the MAGCOS code [47]. For examples of this precise simulation chain see references [48] and [49].
Figure 15 compares the simulated and measured data of the energy deposited in the WCD by all particles at Bucaramanga [18]. From the simulated data, it is possible to identify the second hump of the distribution, dominated by the muonic component, i.e., from MeV to MeV we can discriminate the events corresponding to the muon component of the impacting particles.
5 Conclusions
The MuTe detector is an innovative setup which differentiates it from some previous detectors, combining two independent detectors:
- •
-
•
Water Cherenkov Detector: The WCD is a purified water cube of cm side, located behind the rear scintillator panel, which acts as an absorbing element and as a third active coincidence detector.
From the Geant4 modelling of the scintillator detector, we obtain that the number of pe decreases about %, with regard to those produced at the near end of the SiPM. This reduction occurs due to the attenuation of the photons that travel in the fiber, since, the more distance they travel within it, the more energy they lose and thus fewer photons reach the SiPMs. This result is in agreement with the % attenuation obtained with the experimental setup described in section 3.3. This attenuation seems to be insignificant in the bar, but it is more noticeable in the hodoscope panels, since, the difference between the closest corner to the SiPMs and the furthest, is around %.
The results obtained lead to a definition of a MuTe muon detection trigger in terms of the energy deposited by each component. That is, muons must deposit about MeV in two scintillator bars on the front panel, then about the same energy in two bars on the rear panel of the hodoscope, and finally be discriminated from the background in the WCD. Lastly the muon must lose about MeV to be counted as an event.
The capacity for determining an accurate muon signal emerging from a volcano is a critical factor for muography studies. There could be fake signals produced in the hodoscope by electrons/positrons because the signal produced in the hodoscope is equal for muon and electrons as shown in figure 4. Due to the dimensions and location, the WCD filters most of the upward background (low energies electrons, protons, and muons coming from the backward free sky), which could cause overestimation in the hodoscope counts [35]. It is also capable of isolating the muonic component of the incident particle flux, as shown in figure 13. Additionally, from the charge histogram, obtained by time integration of the individual pulses measured in the WCD, it is possible to separate the two components of the incident flux: electromagnetic part (photon, electron & positron) and the component [48].
The computational model developed and presented in this work is a first approximation in understanding the response of MuTe to the cosmic ray background, in view that this instrument works as an observatory. In the coming months, we will be installing the MuTe detector in Cerro Machín volcano [13] and start on-field data acquisition, providing new information about the density distribution inside the volcanic edifice.
Acknowledgments
We gratefully acknowledge the observations, sugestions and criticisms for the anonymous referees, improving the presentation and clarity of the present work. The authors recognise the financial support of Departamento Administrativo de Ciencia, Tecnología e Innovación de Colombia (ColCiencias) under contract FP44842-082-2015 and to the Programa de Cooperación Nivel II (PCB-II) MINCYT-CONICET-COLCIENCIAS 2015, under project CO/15/02. We are also very thankful to LAGO and the Pierre Auger Collaboration for their continuous support. The simulations in this work were partially possible thanks to The Red Iberoamericana de Computación de Altas Prestaciones (RICAP, 517RT0529), co-funded by the Programa Iberoamericano de Ciencia y Tecnología para el Desarrollo (CYTED) under its Thematic Networks Call. We also thank the computational support from the Universidad Industrial de Santander (SC3UIS) High Performance and Scientific Computing Centre. We would also like to thank Vicerrectoría Investigación y Extensión Universidad Industrial de Santander for its permanent sponsorship. We recognise many very fruitful discussions with D. Sierra-Porta, thanks a lot.
References
- [1] J. Marteau, et al. Muons tomography applied to geosciences and volcanology. Nucl. Instrum. Meth. A, 695:23 – 28, 2012. New Developments in Photodetection NDIP11.
- [2] R. Kaiser. Muography: overview and future directions. Philos. T. R. Soc. A., 377(2137):20180049, January 2019.
- [3] G. Blanpied, et al. Material discrimination using scattering and stopping of cosmic ray muons and electrons: Differentiating heavier from lighter metals as well as low-atomic weight materials. Nucl. Instrum. Meth. A, 784:352–358, jun 2015.
- [4] K. Morishima, et al. Discovery of a big void in khufu’s pyramid by observation of cosmic-ray muons. Nature, 552(7685):386, 2017.
- [5] H. Gómez, et al. Studies on muon tomography for archaeological internal structures scanning. In J. Phys. Conf. Ser., page 052016. IOP Publishing, 2016.
- [6] H. Fujii, et al. Performance of a remotely located muon radiography system to identify the inner structure of a nuclear plant. Prog. Theor. Exp. Phys., 2013(7), jul 2013.
- [7] G. Saracino, et al. Imaging of underground cavities with cosmic-ray muons from observations at mt. echia (naples). Sci. Rep., 7(1), apr 2017.
- [8] L. F. Thompson, et al. The application of muon tomography to the imaging of railway tunnels. arXiv e-prints, page arXiv:1906.05814, Jun 2019.
- [9] H. K. M. Tanaka and L. Oláh. Overview of muographers. Philos. T. R. Soc. A., 377(2137):20180143, January 2019.
- [10] G.P. Cortés. Informe de actividad volcánica segmento norte de colombia diciembre de 2016. Technical report, Reporte interno, Manizales, Colombia. INGEOMINAS, 2016.
- [11] A. Agudelo. Informe técnico de actividad de los volcanes nevado del huila, puracé y sotará, durante el periodo de diciembre de 2016. Technical report, Reporte Interno, Popayan, Colombia, Servicio Geológico Colombiano, 12 2016.
- [12] E. Muñoz. Informe mensual de actividad de los volcanes galeras,cumbal,chiles y cerro negro, las ánimas, dona juana y azufral. Technical report, Reporte interno, Pasto, Colombia. INGEOMINAS, 2017.
- [13] A. Vesga-Ramirez, et al. Muon Tomography sites for Colombia volcanoes. ArXiv e-prints, arXiv 1705.09884, May 2017.
- [14] H. Asorey, et al. Astroparticle projects at the eastern colombia region: facilities and instrumentation. Scientia et technica, 23(3):391–396, 2018.
- [15] H. Asorey, et al. minimute: A muon telescope prototype for studying volcanic structures with cosmic ray flux. Scientia et technica, 23(3):386–390, 2018.
- [16] I.D. Guerrero, et al. Design and construction of a muon detector prototype for study the galeras volcano internal structure. In J. Phys. Conf. Ser., page 012020. IOP Publishing, 2019.
- [17] J.S. Useche-Parra and C.A. Avila-Bernal. Estimation of cosmic-muon flux attenuation by monserrate hill in bogota. J. Instrum., 14(02):P02015, 2019.
- [18] J. Peña-Rodríguez, et al. Calibration and first measurements of MuTe: a hybrid muon telescope for geological structures. In 36th International Cosmic Ray Conference (ICRC2019), volume 36, 2019.
- [19] A. Anastasio, et al. The mu-ray detector for muon radiography of volcanoes. Nucl. Instrum. Meth. A, 732:423 – 426, 2013. Vienna Conference on Instrumentation 2013.
- [20] C. Carloganu, et al. Towards a muon radiography of the puy de dôme. Geosci. Instrum. Meth., 2:55–60, 2013.
- [21] N. Lesparre, et al. Geophysical muon imaging: feasibility and limits. Geophys. J. Int., 183(3):1348–1361, 2010.
- [22] K. Nagamine. Radiography with cosmic-ray and compact accelerator muons; exploring inner-structure of large-scale objects and landforms. P. Jpn. Acad. B-Phys., 92(8):265–289, 2016.
- [23] R. Sehgal, et al. Simulations and track reconstruction for muon tomography using resistive plate chambers. In DAE Symp. Nucl. Phys., volume 61, pages 1034–1035, 2016.
- [24] F. Fehr and Tomuvol Collaboration. Density imaging of volcanos with atmospheric muons. In J. Phys. Conf. Ser., page 052019. IOP Publishing, 2012.
- [25] S. Bouteille, et al. A micromegas-based telescope for muon tomography: The watto experiment. Nucl. Instrum. Meth. A, 834:223–228, 2016.
- [26] L. Oláh, et al. High-definition and low-noise muography of the sakurajima volcano with gaseous tracking detectors. Sci. Rep., 8(1):3207, 2018.
- [27] N. Lesparre, et al. Design and operation of a field telescope for cosmic ray geophysical tomography. Geosci. Instrum. Meth., 1:33–42, 2012.
- [28] H.K.M. Tanaka, et al. Cosmic-ray muon imaging of magma in a conduit: Degassing process of satsuma iwojima volcano, japan. Geophys. Res. Lett., 36(1), 2009.
- [29] K. Nagamine, et al. Method of probing inner-structure of geophysical substance with the horizontal cosmic-ray muons and possible application to volcanic eruption prediction. Nucl. Instrum. Meth. A, 356(2):585 – 595, 1995.
- [30] P. Aguiar, et al. Geant4-gate simulation of a large plastic scintillator for muon radiography. IEEE Trans. Nucl. Sci., 62(3):1233–1238, 2015.
- [31] S.W Tang, et al. A large area plastic scintillation detector with 4-corner-readout. Chinese Physics C, 40(5):056001, 2016.
- [32] S. Agostinelli, et al. Geant4: a simulation toolkit. Nucl. Instrum. Meth. A, 506(3):250–303, 2003.
- [33] R. Nishiyama, S. Miyamoto, and N. Naganawa. Experimental study of source of background noise in muon radiography using emulsion film detectors. Geosci. Instrum. Meth., 3(1):29–39, April 2014.
- [34] T. Kusagaya and H.K.M. Tanaka. Muographic imaging with a multi-layered telescope and its application to the study of the subsurface structure of a volcano. P. Jpn. Acad. B-Phys., 91(9):501–510, 2015.
- [35] R. Nishiyama, et al. Monte carlo simulation for background study of geophysical inspection with cosmic-ray muons. Geophys. J. Int., 206(2):1039–1050, 2016.
- [36] H. Gómez, et al. Forward scattering effects on muon imaging. J. Instrum., 12(12):P12018, 2017.
- [37] Saint-Gobain Ceramics & Plastics. Plastic Scintillating Fibers, 2017. Rev. 1.
- [38] Hamamatsu. MPPCs for precision measurement, 5 2018. Rev. 1.
- [39] A. Filevich, et al. Spectral-directional reflectivity of tyvek immersed in water. Nucl. Instrum. Meth. A, 423(1):108–118, 1999.
- [40] D.G. Michael, et al. The magnetized steel and scintillator calorimeters of the minos experiment. Nucl. Instrum. Meth. A, 596(2):190–228, 2008.
- [41] Red Pitaya. Red pitaya documentation. Release 0.97. url: http://redpitaya. readthedocs. io/en/latest/(visited on 02/11/2017), 2016.
- [42] D. Renker. Geiger-mode avalanche photodiodes, history, properties and problems. Nucl. Instrum. Meth. A, 567(1):48–56, 2006.
- [43] R. Calderón, H. Asorey, and L.A. Núñez. Geant4 based simulation of the water cherenkov detectors of the lago project. Nucl. Part. Phys. Proc., 267:424–426, 2015.
- [44] A. Etchegoyen, et al. D.G. Melo, A.C. Rovero, A.D. Supanitsky, and A. Tamashiro. Muon-track studies in a water cherenkov detector. Nucl. Instrum. Meth. A, 545(3):602 – 612, 2005.
- [45] R. Calderón-Ardila, et al. Modeling the LAGO’s detectors response to secondary particles at ground level from the Antarctic to Mexico. In 36th International Cosmic Ray Conference (ICRC2019), volume 36, 2019.
- [46] D. Heck, et al. Corsika : A monte carlo code to simulate extensive air showers. Technical Report FZKA 6019, Forschungszentrum Karlsruhe GmbH, 1998.
- [47] L. Desorgher. MAGNETOSCOSMICS, Geant4 application for simulating the propagation of cosmic rays through the Earth magnetosphere. Technical report, Physikalisches Institut, University of Bern, Bern, Germany, 2003.
- [48] H. Asorey, et al.. The LAGO space weather program: Directional geomagnetic effects, background fluence calculations and multi-spectral data analysis. In The 34th International Cosmic Ray Conference, volume PoS(ICRC2015), page 142, 2015.
- [49] H. Asorey, L. A. Núñez, and M. Suárez-Durán. Preliminary results from the latin american giant observatory space weather simulation chain. Space Weather, 16(5):461–475, 2018.
- [50] T. Uchida, H. K.M. Tanaka, and M. Tanaka. Space saving and power efficient readout system for cosmic-ray muon radiography. IEEE Trans. Nucl. Sci., 56(2):448–452, 2009.
- [51] D. Gibert, et al. Muon tomography: Plans for observations in the lesser antilles. Earth Planets Space, 62(2):153–165, 2010.