Great Impostors: Extremely Compact, Merging Binary Neutron Stars in the Mass Gap Posing as Binary Black Holes
Abstract
Can one distinguish a binary black hole undergoing a merger from a binary neutron star if the individual compact companions have masses that fall inside the so-called mass gap of ? For neutron stars, achieving such masses typically requires extreme compactness and in this work we present initial data and evolutions of binary neutron stars initially in quasiequilibrium circular orbits having a compactness . These are the most compact, nonvacuum, quasiequilibrium binary objects that have been constructed and evolved to date, including boson stars. The compactness achieved is only slightly smaller than the maximum possible imposed by causality, , which requires the sound speed to be less than the speed of light. By comparing the emitted gravitational waveforms from the late inspiral to merger and postmerger phases between such a binary neutron star vs a binary black hole of the same total mass we identify concrete measurements that serve to distinguish them. With that level of compactness, the binary neutron stars exhibit no tidal disruption up until merger, whereupon a prompt collapse is initiated even before a common core forms. Within the accuracy of our simulations the black hole remnants from both binaries exhibit ringdown radiation that is not distinguishable from a perturbed Kerr spacetime. However, their inspiral leads to phase differences of the order of rad over an km separation (1.7 orbits) while typical neutron stars exhibit phase differences of rad. Although a difference of rad can be measured by current gravitational wave laser interferometers (e.g., aLIGO/Virgo), uncertainties in the individual masses and spins will likely prevent distinguishing such compact, massive neutron stars from black holes.
Introduction.—Determining the neutron star (NS) maximum mass is a one of the most fascinating, unresolved issues in modern astrophysics. The answer is intimately related to identifying the correct equation of state (EOS) that describes matter at supranuclear densities Lattimer (2012). Currently the highest observed NS mass is Cromartie et al. (2019). In principle, the upper limit allowing only for causality and a matching density to a well-understood EOS somewhere around nuclear density, can be as high as Hartle (1978), while recent studies based on the detection of the gravitational wave (GW) signal GW170817 place it around Ruiz et al. (2018); Shibata et al. (2019); Rezzolla et al. (2018); Margalit and Metzger (2017). All these studies adopt a number of underlying assumptions whose validity will require new observations to be verified or modified accordingly. Observationally, merging binary black holes (BHBHs), black hole-neutron stars (BHNSs) or binary neutron stars (NSNSs) whose companions have masses that fall into the mass gap range are hard to distinguish Hannam et al. (2013); Littenberg et al. (2015); Mandel et al. (2015); Yang et al. (2018). The identification of a compact object becomes even more challenging when one includes exotic configurations, such as quark stars, boson stars, etc., or alternative theories of gravity.
The parameter that encodes how much mass a compact star can hold in a certain volume is the compactness, defined as the dimensionless ratio . Here is the Arnowitt-Desser-Misner (ADM) mass, and the areal (Schwarzschild) radius of an isolated, nonrotating star with the same baryon mass. Our sun has , a small number indicative of its nonrelativistic nature, while the upper limit, , is set by a Schwarzschild BH. Typical NSs have compactions around with the precise number determined by the as yet unknown EOS. An extreme case is the incompressible fluid limit that yields , the so-called Buchdahl limit Buchdahl (1959). This limit is unrealistic since it predicts an infinite sound speed. If one satisfies the causality criterion for the sound speed (i.e. ) then the upper limit for compactness drops to Haensel and Zdunik (1989); Koranda et al. (1997); Lattimer and Prakash (2011).
Compact binary systems provide some of the best laboratories to test the predictions of general relativity, as well as to probe possible deviations from its description of strong gravity. Despite the large progress that has been achieved in numerical relativity we are still lacking theoretical simulations that involve extremely compact NSs in binaries. In Ref. Taniguchi and Shibata (2010) NSNS initial data in quasiequilibrium were constructed with compactness up to using the lorene code Taniguchi and Gourgoulhon (2002); Gourgoulhon et al. (2001). Similarly, in Ref. Henriksson et al. (2016) BHNS initial data were presented using the spec code Foucart et al. (2008); Pfeiffer et al. (2003) that reach the same compactness. Recently Tichy et al. (2019), NSNS initial data with compactness up to , together with preliminary evolution simulations, were computed using the sgrid code Tichy (2009, 2011).
The purpose of this work is to quantify the difference between a BHBH and an NSNS system when the total ADM mass falls inside the mass gap and to provide useful GW diagnostics that may distinguish them. First, we construct the most massive NSNSs in quasicircular orbit with the highest compactness to date using our initial data solver cocal Tsokaros et al. (2015, 2018); Uryū and Tsokaros (2012). The system has ADM mass and each star a compactness of . This value (which is even higher than the maximum possible compactness that can be achieved by solitonic boson stars Palenzuela et al. (2017)) is only slightly smaller than the limiting compactness set by causality. Second, using the Illinois GRMHD code Etienne et al. (2012, 2012a, 2012b); Paschalidis et al. (2015), we evolve this NSNS system and perform a detailed comparison of the gravitational waveforms with a BHBH system having the same initial ADM mass. We find that an NSNS system having the above compactness inspirals very similarly to the BHBH system and merges without essentially any tidal disruption. We conjecture that to be true irrespective of the EOS for this level of compaction. The merged NSNS remnant collapses to a BH even before a common core forms. Since there is no disk formation, and a negligible escaping mass, one may not expect a sGRB or a kilonova from such an NSNS event. The GW phase difference at the peak GW amplitude of the NSNS system is rad with respect to the BHBH binary inside the band . This phase difference corresponds to of the accumulated phase during the last orbits (corresponding to an initial separation of km) and can be detected by the aLIGO/Virgo network. On the other hand the postmerger remnants have ringdown waveforms that cannot be distinguished from the Kerr BH ringdown within the accuracy of our simulations.
In the following we employ geometric units in which , unless stated otherwise.
EOS and numerical methods.—In this work we employ the cold EOS adopted in Ref. Tsokaros et al. (2019a) which we called ALF2cc. It is based on the ALF2 EOS Alford et al. (2005) where the region with rest-mass density is replaced by the maximum stiffness EOS given by
| (1) |
Here is a dimensionless parameter, is the total energy density, and the pressure at . The solutions presented in this work assume , i.e. a core at the causal limit, which represents the maximally compact, compressible EOS Lattimer and Prakash (2016). The matching density is, in principle, the point beyond which current nuclear studies cannot confidently describe matter and it is a multiple of nuclear matter density . In our current study though, we simply take in order to maximize the NS compactness and thereby provide a benchmark upon which future studies can be compared (see also Refs. Lai and Xu (2009); Zhou et al. (2018) for other EOSs that support such high compactions).
Our NSNS initial data are computed using the cocal code Tsokaros et al. (2015, 2016, 2018); Uryū and Tsokaros (2012) while the BHBH initial data using the TwoPunctures code Ansorg et al. (2004); Paschalidis et al. (2013). For the NSNS binary each NS has a rest mass which corresponds to a spherical star with compactness . The ADM mass of the system is , the coordinate separation is km, and the orbital angular velocity is . All NS radii are approximately 10 km. Although the distance between the two NSs is very large compared with typical NSNS simulations it only results in orbits prior to merger according to the lowest order post-Newtonian (PN) formula Blanchet (2014), [], due to the very large gravitational mass of the system. The challenge both for the initial data calculation, as well as for the evolution, is to resolve a relatively small and very compact NS over such a large binary separation. In Fig. 1 we plot the rest-mass density profile across the axis that passes through the center of each star. The profiles look very similar to self-bound quark stars whose density at the surface is finite. The red horizontal line divides the region with the causal EOS Eq. (1) (above the red line) from the polytropic ALF2 crust (below the red line). The region near the surface is expanded in the inset of Fig. 1 which shows that our stars exhibit m of crust, which is of their radius but only of the rest mass. The blue vertical line pinpoints the surface of the NS while the red lines mark the change of the EOS.




We perform evolutions of the BHBH and NSNS systems using the Illinois GRMHD adaptive-mesh-refinement code Etienne et al. (2012, 2012a, 2012b); Paschalidis et al. (2015) which employs the Baumgarte-Shapiro-Shibata-Nakamura (BSSN) formulation of Einstein’s equations Shibata and Nakamura (1995); Baumgarte and Shapiro (1998, 2010) to evolve the spacetime metric and the matter fields (see Ref. Tsokaros et al. (2019a) for an evolution that also adopts the ALF2cc EOS). For the NSNS binary we use two resolutions: Resolution R1nsns uses eight refinement boxes with m, while resolution R2nsns employs m. Both R1nsns and R2nsns can resolve the crust by four or five points (initially). In the Supplemental Material we plot the violations of the constraint equations, where their peak values indeed come from the crust. Future simulations will improve the accuracy. For the BHBH binary, resolution Rbhbh uses nine refinement boxes with m. Reflection symmetry is imposed across the orbital plane. Both resolutions that we use are among the highest in NSNS simulations. According to Ref. Kiuchi et al. (2017) one needs m to achieve sub-radian accuracy ( rad) and nearly convergent waveforms in approximately 15 orbits. In our case the high compactness of our NSs necessitate the use of such resolution, while lower resolutions seem inadequate to keep the stars in bound orbits.
For the GW diagnostics we use the methods described in Ref. Tsokaros et al. (2019b) and denote by the strain of the mode and the corresponding GW frequency.
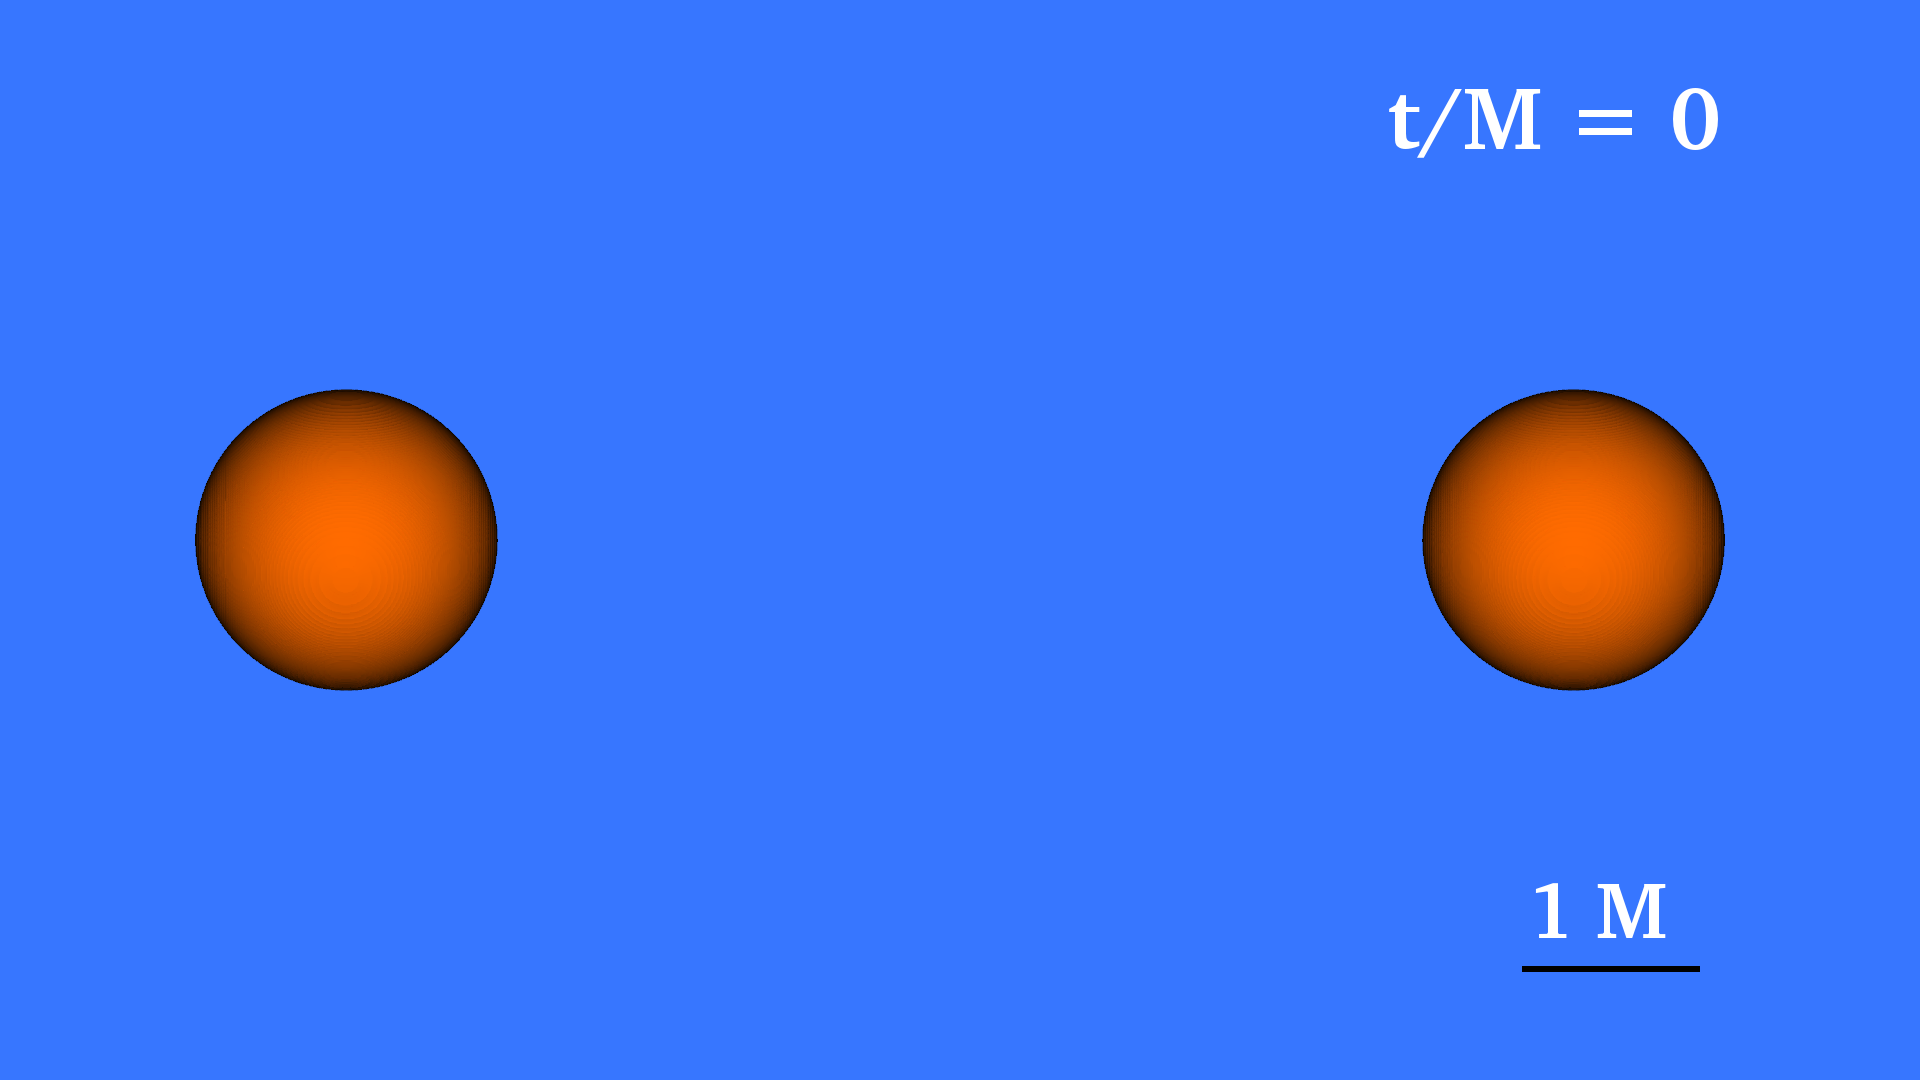
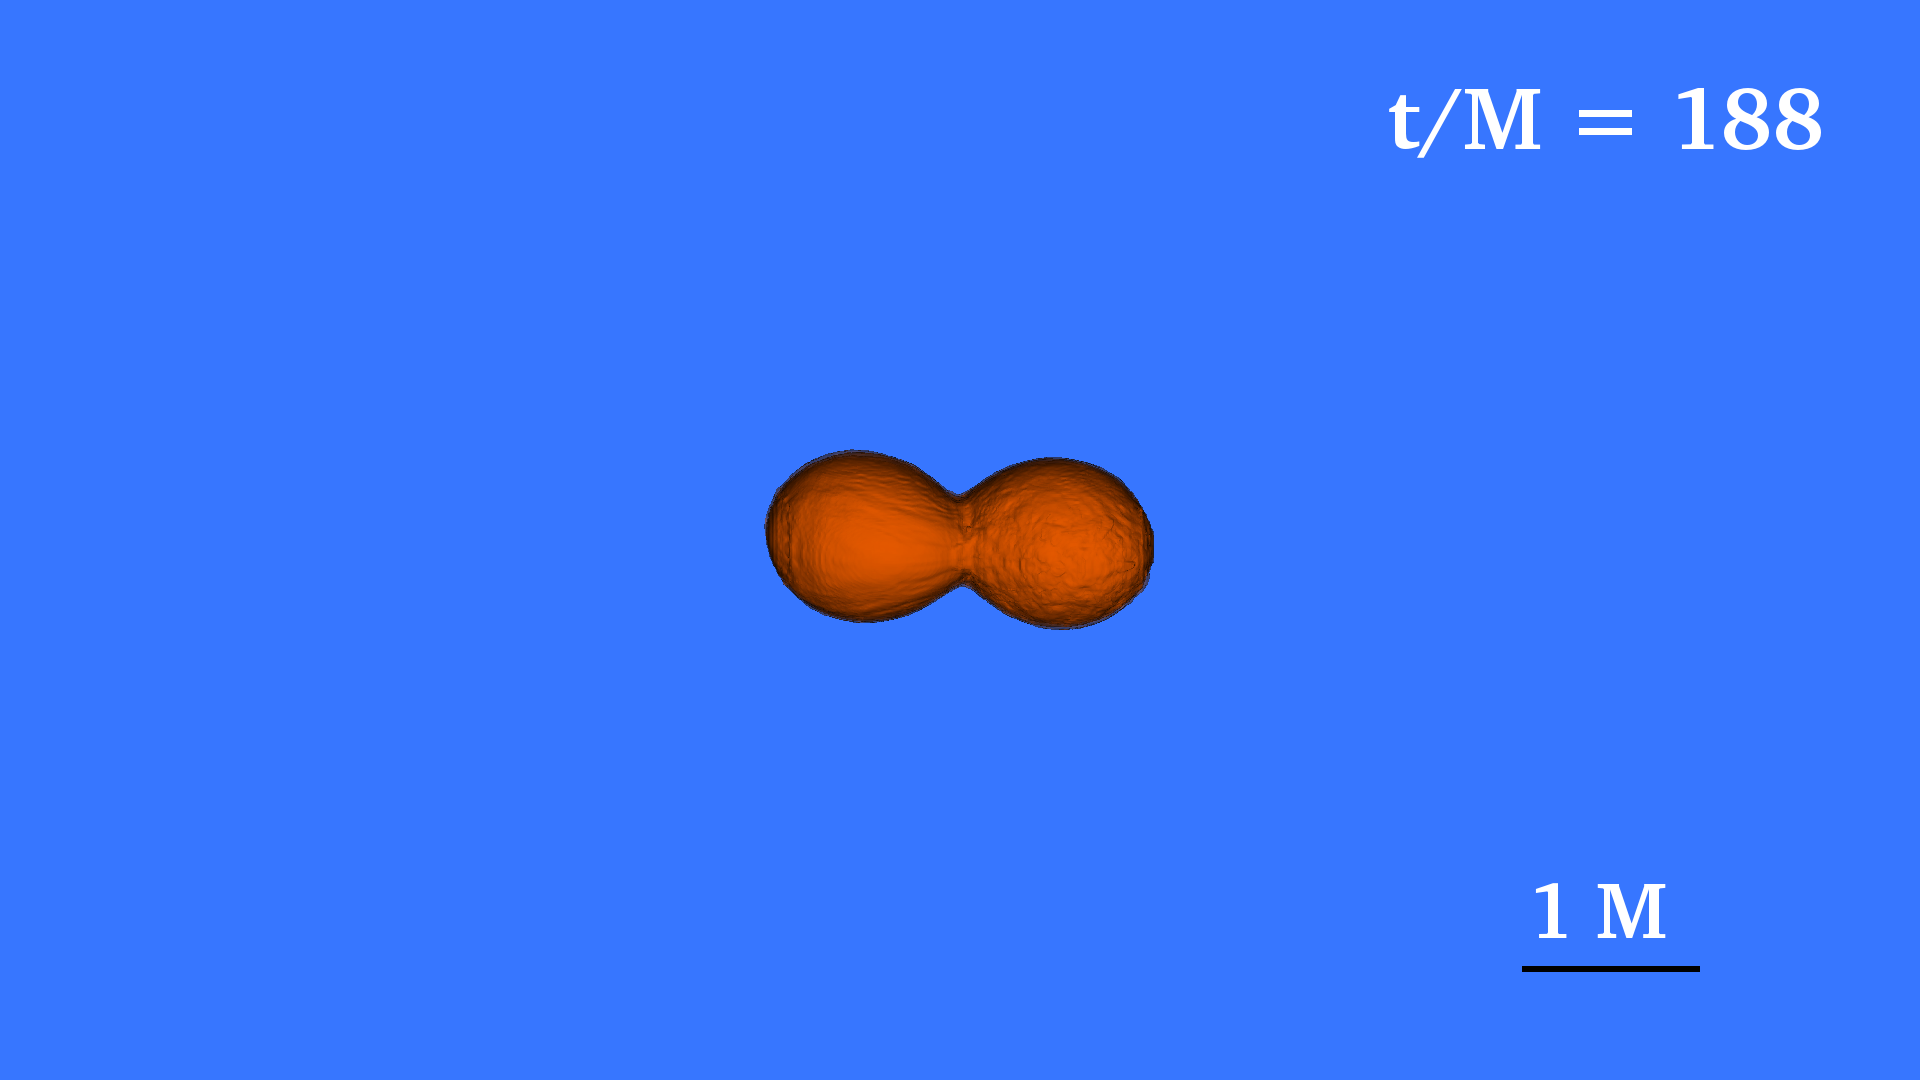
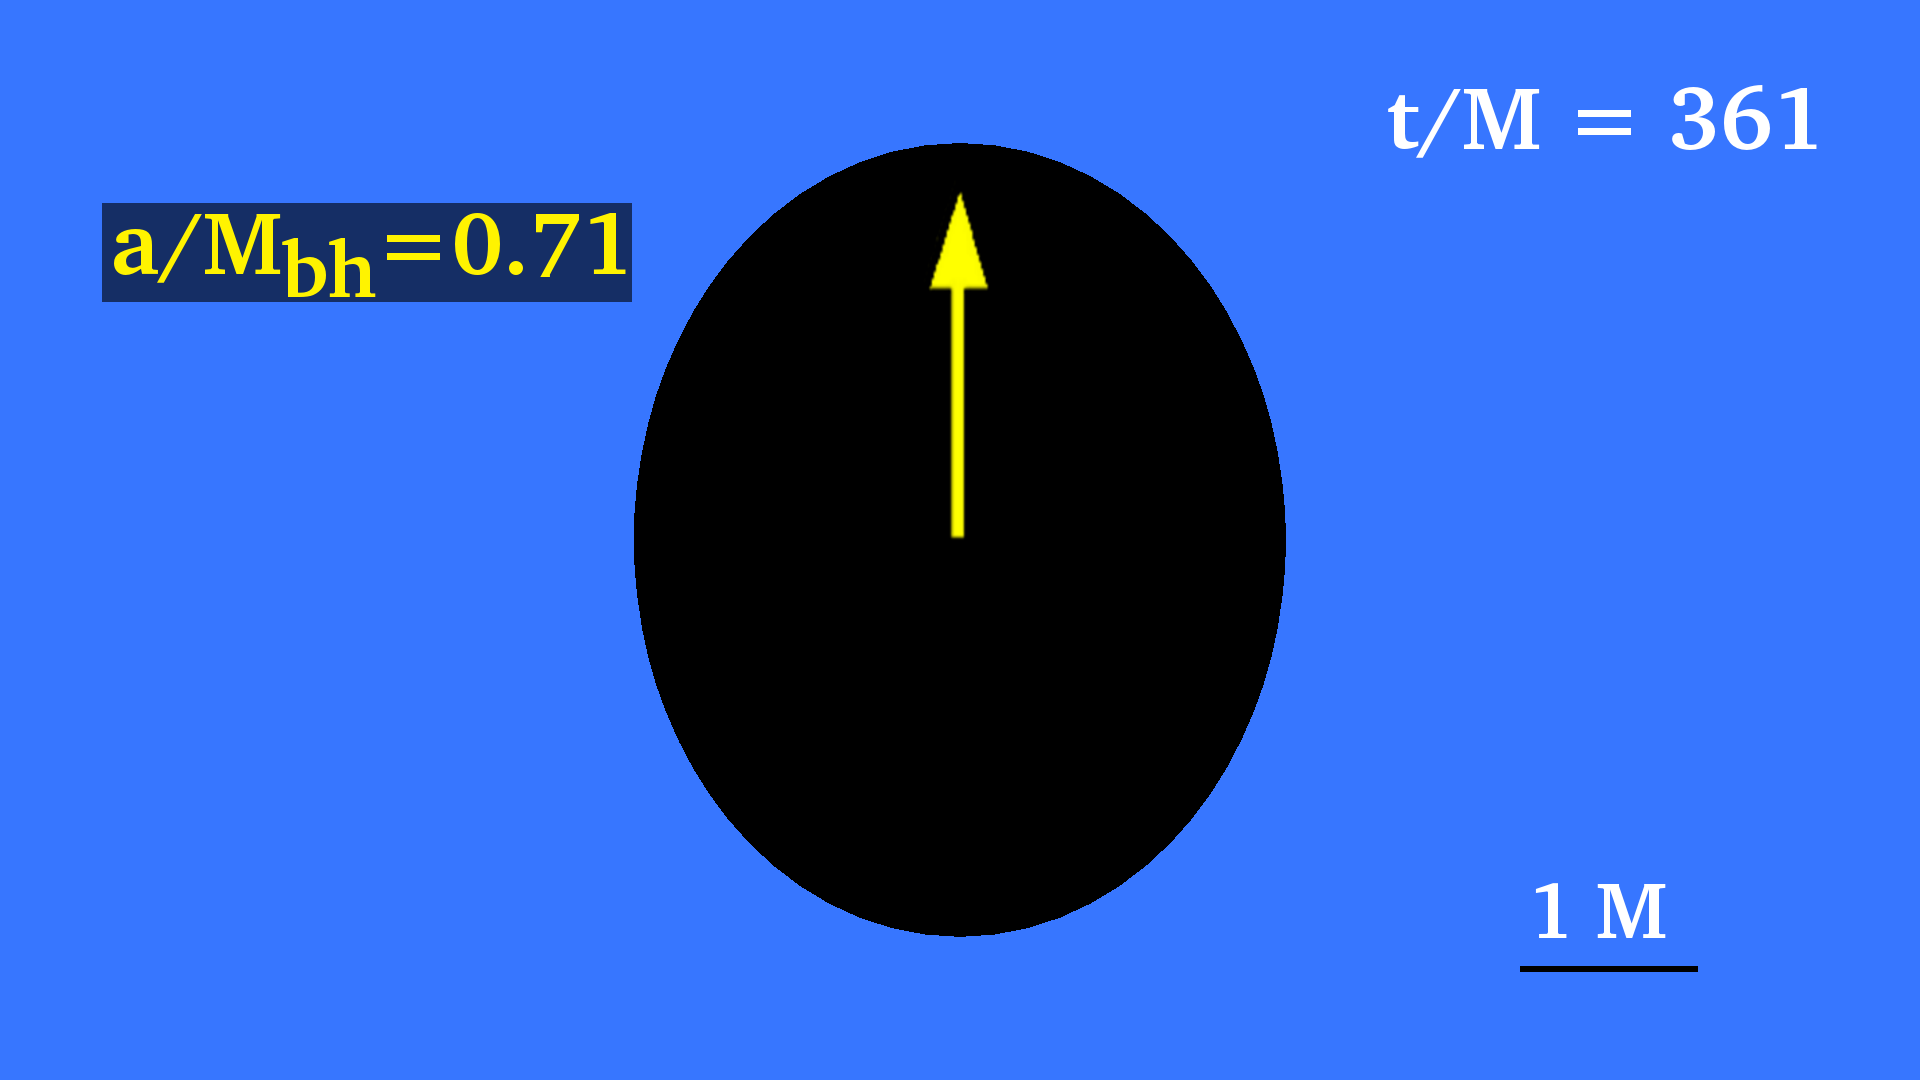
Results.—The evolution of the NSNS system is depicted in Fig. 2 where isocontours at density are plotted at various times during the inspiral. This isocontour corresponds to the density at a radial distance measured from the maximum density point in the NSs; therefore it is an accurate representation of the surface of the star. In accordance with the (PN) prediction the binary performs approximately orbits with the two stars starting as two spherical configurations to high accuracy. Tidal distortion becomes evident only at orbits when . Shortly afterwards (less than a quarter of an orbit) merger begins with no cusp formation (cf. Ref. Baiotti et al. (2008)). The surface remains intact up until the merging of the two NSs at where they actually touch. Immediately thereafter the remnant collapses, at , when the structure still has a clear dumbbell shape as in the snapshot at the left column, bottom panel of Fig. 2 (with ). The apparent horizon immediately after collapse has a spherical shape but settles as a prolate configuration at the end of the simulation. This is simply a gauge effect caused by the NSNS moving puncture coordinates. The ratio of polar to equatorial proper circumferences asymptotes to (see postmerger section) mov .
Inspiral.—In the top panel of Fig. 3 we plot the normalized strain of the (2,2) mode ( is the areal radius). Despite the small number of orbits performed by our NSNS system one can appreciate the fact that the early part of the inspiral is very similar for both NSNS and BHBH, with differences starting to appear when the tidal interactions begin at . This observation is expected since our NSs are very compact and thus have small radii ; at initial separations of the inspiral should develop according to the point-particle approximation. For the same reason one expects that tidal effects will start to develop later on, which is what we find. For all simulations we extract at seven different radii from the orbital center and verify the expected “peeling” property const. In the figures shown here we used an extraction radius km.


As expected the NSNS binary merges earlier than the BHBH binary even though tidal effects are minimal. Also, by comparing the two NSNS resolutions, we observe that the NSNS evolved with the high resolution (R2nsns) merges slightly earlier than R1nsns. In the bottom panel of Fig. 3 we plot the phase of the GW strain of the (2,2) mode as a function of frequency up until the moment of maximum strain. At a given time the angular velocity of the BHBH binary is smaller than the corresponding of the NSNS binary, leading to delayed merger. Although our two NSNS resolutions produce a small phase difference between them, the important quantity here is the phase difference . The largest dephasing between the BHBH and NSNS curves is rad within KHz. If we extrapolate our results to infinite resolution (see Refs. Etienne et al. (2008, 2010); Tsokaros et al. (2019b); Espino et al. (2019) and the Supplemental Material) we conclude that a BHBH binary will have maximum rad difference with respect to an NSNS of compaction in the aforementioned bandwidth. This result is in accordance with other studies Dietrich et al. (2019); Tsokaros et al. (2019b) where typical NSNS binaries are employed and phase differences rad were recorded depending on the EOS, and the NSNS binary properties. Our maximally compact stars yield a minimal but measurable phase difference. Given the fact that this phase difference is produced in the last orbits, or through an accumulated phase of only rad, we calculate that the dephasing relative to the BHBH case is significant .


In Fig. 4 top panel we plot the Fourier spectrum at 100 Mpc of the (2,2) mode for the NSNS (two resolutions, blue and green lines) and BHBH (red line) binaries. We also plot the aLIGO noise curve (gray line) Shoemaker , as well as the Newtonian prediction Cutler and Flanagan (1994) (dashed lines). Vertical blue lines correspond to the initial and ringdown GW frequency of the (2,2) mode (see next section). The power spectral density for the two kind of binaries is very similar, thus in order to quantify their difference we compute the match function Allen et al. (2012) where the maximization is taken over a large set of phase shifts and time shifts . Here denotes the standard noise-weighted inner product Allen et al. (2012). For both resolutions R1nsns and R2nsns we find , i.e. the waveforms emitted at Mpc are distinguishable with current detectors for a signal-to-noise ratio of, e.g., 25 Harry and Hinderer (2018); Chatziioannou et al. (2017), comparable to GW150914 Abbott et al. (2016). However, uncertainties in the individual masses and spins will likely prevent these detectors from distinguishing these compact, massive NS binaries from BH binaries.
Postmerger.—In order to diagnose the spin of the remnant BHs we use two methods. First, using the isolated horizon formalism Dreyer et al. (2003) we calculate (using R1nsns and Rbhbh for the NSNS and BHBH runs, respectively). Second, for the Kerr spacetime the ratio of proper polar horizon circumference, , to the equatorial one, is , where is the complete elliptic integral of the second kind. Following Ref. Brandt and Seidel (1995) we can approximate this expression by . By computing the ratio directly from the metric one can get an estimate of using the latter approximate formula. This quantity is plotted in the bottom panel of Fig. 4. The two spin diagnostics agree to a level of for both binaries, while the spin of the BHBH binary remnant differs from the one of the NSNS binary remnant by with the NSNS remnant BH having higher spin. This is consistent with the calculated GW angular momentum emission and the conservation of angular momentum diagnostic shown in the Supplemental Material.
Although the mode frequencies of the GW signal during inspiral and merger are described by complicated functions of time, during ringdown the GW signal can be described with high accuracy as a simple superposition of damped sinusoids characterized by three indices: the two spherical harmonic indices and a third overtone index, , which here we assume to be the fundamental one Kokkotas and Schmidt (1999); Berti et al. (2006). As a consequence of the no-hair theorem, all dimensionless mode frequencies, , and damping times depend only on the dimensionless spin of the remnant BH. For our BHBH and NSNS binaries the dominant modes are the (2,2) and (4,4) ones. The frequencies of the (2,2) modes for the NSNS and BHBH binaries are very close to each other and lead to a BH spin which is consistent with the values presented in Fig. 4 and discussed in the previous paragraph. In particular we find that while . The (4,4) modes are more noisy and yield and .
In order to compare the ringdown of our models to well-known results from perturbation theory for Kerr BHs we use the fits provided in Ref. Berti et al. (2006):
| (2) | |||||
Using the (2,2) frequencies of our models we find and in very good agreement with the values shown in Fig. 4. The (4,4) mode predicts spins which differ by from the ones coming from the (2,2) one. This is within the accuracy of our angular momentum conservation (see Supplemental Material) but is also expected due to the larger noise in our simulation for those higher order modes. In conclusion, the ringdown of both the NSNS and BHBH binaries is consistent with the ringdown of a perturbed Kerr BH, with the mass and angular momentum of the remnants closely matching the ones predicted by the Kerr metric.
It is a pleasure to thank J. Creighton and N. Yunes for useful discussions. We thank the Illinois Relativity Group REU team, G. Liu, K. Nelli, and M. N.T Nguyen for assistance in creating Fig. 2. This work was supported by NSF Grant No. PHY-1662211 and NASA Grant No. 80NSSC17K0070 to the University of Illinois at Urbana-Champaign, as well as by JSPS Grant-in-Aid for Scientific Research (C) 15K05085 and 18K03624 to the University of Ryukyus. This work made use of the Extreme Science and Engineering Discovery Environment (XSEDE), which is supported by National Science Foundation Grant No. TG-MCA99S008. This research is part of the Blue Waters sustained-petascale computing project, which is supported by the National Science Foundation (Grants No. OCI-0725070 and No. ACI-1238993) and the State of Illinois. Blue Waters is a joint effort of the University of Illinois at Urbana-Champaign and its National Center for Supercomputing Applications. Resources supporting this work were also provided by the NASA High-End Computing (HEC) Program through the NASA Advanced Supercomputing (NAS) Division at Ames Research Center.
References
- Lattimer (2012) J. M. Lattimer, Ann. Rev. Nucl. Part. Sci. 62, 485 (2012), arXiv:1305.3510 [nucl-th] .
- Cromartie et al. (2019) H. T. Cromartie et al., (2019), 10.1038/s41550-019-0880-2, arXiv:1904.06759 [astro-ph.HE] .
- Hartle (1978) J. B. Hartle, Physics Reports 46, 201 (1978).
- Ruiz et al. (2018) M. Ruiz, S. L. Shapiro, and A. Tsokaros, Phys. Rev. D97, 021501 (2018), arXiv:1711.00473 [astro-ph.HE] .
- Shibata et al. (2019) M. Shibata, E. Zhou, K. Kiuchi, and S. Fujibayashi, Phys. Rev. D100, 023015 (2019), arXiv:1905.03656 [astro-ph.HE] .
- Rezzolla et al. (2018) L. Rezzolla, E. R. Most, and L. R. Weih, Astrophys. J. 852, L25 (2018), [Astrophys. J. Lett.852,L25(2018)], arXiv:1711.00314 [astro-ph.HE] .
- Margalit and Metzger (2017) B. Margalit and B. D. Metzger, Astrophys. J. 850, L19 (2017), arXiv:1710.05938 [astro-ph.HE] .
- Hannam et al. (2013) M. Hannam, D. A. Brown, S. Fairhurst, C. L. Fryer, and I. W. Harry, The Astrophysical Journal 766, L14 (2013).
- Littenberg et al. (2015) T. B. Littenberg, B. Farr, S. Coughlin, V. Kalogera, and D. E. Holz, Astrophys. J. 807, L24 (2015), arXiv:1503.03179 [astro-ph.HE] .
- Mandel et al. (2015) I. Mandel, C.-J. Haster, M. Dominik, and K. Belczynski, Mon. Not. Roy. Astron. Soc. 450, L85 (2015), arXiv:1503.03172 [astro-ph.HE] .
- Yang et al. (2018) H. Yang, W. E. East, and L. Lehner, The Astrophysical Journal 856, 110 (2018).
- Buchdahl (1959) H. A. Buchdahl, Phys. Rev. 116, 1027 (1959).
- Haensel and Zdunik (1989) P. Haensel and J. L. Zdunik, Nature (London) 340, 617 (1989).
- Koranda et al. (1997) S. Koranda, N. Stergioulas, and J. Friedman, Astrophysical Journal 488, 799 (1997), cited By 72.
- Lattimer and Prakash (2011) J. M. Lattimer and M. Prakash, in From Nuclei to Stars: Festschrift in Honor of Gerald E Brown, edited by S. Lee (2011) pp. 275–304, arXiv:1012.3208 [astro-ph.SR] .
- Taniguchi and Shibata (2010) K. Taniguchi and M. Shibata, The Astrophysical Journal Supplement Series 188, 187 (2010).
- Taniguchi and Gourgoulhon (2002) K. Taniguchi and E. Gourgoulhon, Phys. Rev. D 66, 104019 (2002).
- Gourgoulhon et al. (2001) E. Gourgoulhon, P. Grandclément, K. Taniguchi, J.-A. Marck, and S. Bonazzola, Phys. Rev. D 63, 064029 (2001).
- Henriksson et al. (2016) K. Henriksson, F. Foucart, L. E. Kidder, and S. A. Teukolsky, Class. Quant. Grav. 33, 105009 (2016), arXiv:1409.7159 [gr-qc] .
- Foucart et al. (2008) F. Foucart, L. E. Kidder, H. P. Pfeiffer, and S. A. Teukolsky, Phys. Rev. D 77, 124051 (2008).
- Pfeiffer et al. (2003) H. P. Pfeiffer, L. E. Kidder, M. A. Scheel, and S. A. Teukolsky, Computer Physics Communications 152, 253 (2003).
- Tichy et al. (2019) W. Tichy, A. Rashti, T. Dietrich, R. Dudi, and B. Brügmann, (2019), arXiv:1910.09690 [gr-qc] .
- Tichy (2009) W. Tichy, Class. Quant. Grav. 26, 175018 (2009), arXiv:0908.0620 [gr-qc] .
- Tichy (2011) W. Tichy, Phys. Rev. D84, 024041 (2011), arXiv:1107.1440 [gr-qc] .
- Tsokaros et al. (2015) A. Tsokaros, K. Uryū, and L. Rezzolla, Phys. Rev. D91, 104030 (2015), arXiv:1502.05674 [gr-qc] .
- Tsokaros et al. (2018) A. Tsokaros, K. Uryu, M. Ruiz, and S. L. Shapiro, Phys. Rev. D98, 124019 (2018), arXiv:1809.08237 [gr-qc] .
- Uryū and Tsokaros (2012) K. Uryū and A. Tsokaros, Phys. Rev. D85, 064014 (2012), arXiv:1108.3065 [gr-qc] .
- Palenzuela et al. (2017) C. Palenzuela, P. Pani, M. Bezares, V. Cardoso, L. Lehner, and S. Liebling, Phys. Rev. D96, 104058 (2017), arXiv:1710.09432 [gr-qc] .
- Etienne et al. (2012) Z. B. Etienne, V. Paschalidis, and S. L. Shapiro, Phys.Rev. D86, 084026 (2012).
- Etienne et al. (2012a) Z. B. Etienne, Y. T. Liu, V. Paschalidis, and S. L. Shapiro, prd 85, 064029 (2012a).
- Etienne et al. (2012b) Z. B. Etienne, V. Paschalidis, and S. L. Shapiro, prd 86, 084026 (2012b).
- Paschalidis et al. (2015) V. Paschalidis, M. Ruiz, and S. L. Shapiro, Astrophys. J. Letters 806, L14 (2015).
- Tsokaros et al. (2019a) A. Tsokaros, M. Ruiz, L. Sun, S. L. Shapiro, and K. Uryū, Phys. Rev. Lett. 123, 231103 (2019a), arXiv:1907.03765 [gr-qc] .
- Alford et al. (2005) M. Alford, M. Braby, M. Paris, and S. Reddy, Astrophys. J. 629, 969 (2005), nucl-th/0411016 .
- Lattimer and Prakash (2016) J. M. Lattimer and M. Prakash, Phys. Rept. 621, 127 (2016).
- Lai and Xu (2009) X. Y. Lai and R. X. Xu, Monthly Notices of the Royal Astronomical Society 398, L31 (2009), arXiv:0905.2839 [astro-ph.HE] .
- Zhou et al. (2018) E. Zhou, A. Tsokaros, L. Rezzolla, R. Xu, and K. Uryū, Phys. Rev. D97, 023013 (2018), arXiv:1711.00198 [astro-ph.HE] .
- Tsokaros et al. (2016) A. Tsokaros, B. C. Mundim, F. Galeazzi, L. Rezzolla, and K. Uryū, Phys. Rev. D94, 044049 (2016), arXiv:1605.07205 [gr-qc] .
- Ansorg et al. (2004) M. Ansorg, B. Brügmann, and W. Tichy, prd 70, 064011 (2004).
- Paschalidis et al. (2013) V. Paschalidis, Z. B. Etienne, R. Gold, and S. L. Shapiro, (2013), arXiv:1304.0457 [gr-qc] .
- Blanchet (2014) L. Blanchet, Living Rev. Rel. 17, 2 (2014), arXiv:1310.1528 [gr-qc] .
- Shibata and Nakamura (1995) M. Shibata and T. Nakamura, Phys. Rev. D 52, 5428 (1995).
- Baumgarte and Shapiro (1998) T. W. Baumgarte and S. L. Shapiro, prd 59, 024007 (1998).
- Baumgarte and Shapiro (2010) T. W. Baumgarte and S. L. Shapiro, Numerical Relativity: Solving Einstein’s Equations on the Computer (Cambridge University Press, 2010).
- Kiuchi et al. (2017) K. Kiuchi, K. Kawaguchi, K. Kyutoku, Y. Sekiguchi, M. Shibata, and K. Taniguchi, Phys. Rev. D96, 084060 (2017), arXiv:1708.08926 [astro-ph.HE] .
- Tsokaros et al. (2019b) A. Tsokaros, M. Ruiz, V. Paschalidis, S. L. Shapiro, and K. Uryū, Phys. Rev. D100, 024061 (2019b), arXiv:1906.00011 [gr-qc] .
- Baiotti et al. (2008) L. Baiotti, B. Giacomazzo, and L. Rezzolla, Phys. Rev. D78, 084033 (2008).
- (48) Movies highlighting results of our simulations can be found at http://research.physics.illinois.edu/cta/ movies/Peqrho_EOS/.
- Etienne et al. (2008) Z. B. Etienne, J. A. Faber, Y. T. Liu, S. L. Shapiro, K. Taniguchi, et al., Phys.Rev. D77, 084002 (2008).
- Etienne et al. (2010) Z. B. Etienne, Y. T. Liu, and S. L. Shapiro, prd 82, 084031 (2010).
- Espino et al. (2019) P. L. Espino, V. Paschalidis, T. W. Baumgarte, and S. L. Shapiro, Phys. Rev. D100, 043014 (2019), arXiv:1906.08786 [astro-ph.HE] .
- Dietrich et al. (2019) T. Dietrich, A. Samajdar, S. Khan, N. K. Johnson-McDaniel, R. Dudi, and W. Tichy, Phys. Rev. D100, 044003 (2019), arXiv:1905.06011 [gr-qc] .
- (53) D. Shoemaker, LIGO Report No. LIGO-T0900288-v2, 2009, the high-power detuned model used in this paper is given in the data file ZERO_DET_HIGH_P.TXT.
- Cutler and Flanagan (1994) C. Cutler and E. E. Flanagan, Phys. Rev. D49, 2658 (1994).
- Allen et al. (2012) B. Allen, W. G. Anderson, P. R. Brady, D. A. Brown, and J. D. E. Creighton, Phys. Rev. D 85, 122006 (2012).
- Harry and Hinderer (2018) I. Harry and T. Hinderer, Classical and Quantum Gravity 35, 145010 (2018).
- Chatziioannou et al. (2017) K. Chatziioannou, A. Klein, N. Yunes, and N. Cornish, Phys. Rev. D 95, 104004 (2017).
- Abbott et al. (2016) B. P. Abbott et al. (LIGO Scientific Collaboration and Virgo Collaboration), Phys. Rev. Lett. 116, 061102 (2016).
- Dreyer et al. (2003) O. Dreyer, B. Krishnan, D. Shoemaker, and E. Schnetter, prd 67, 024018 (2003).
- Brandt and Seidel (1995) S. R. Brandt and E. Seidel, Phys. Rev. D 52, 870 (1995).
- Kokkotas and Schmidt (1999) K. D. Kokkotas and B. G. Schmidt, Living Rev. Rel. 2, 2 (1999), arXiv:gr-qc/9909058 [gr-qc] .
- Berti et al. (2006) E. Berti, V. Cardoso, and C. M. Will, Phys. Rev. D73, 064030 (2006), arXiv:gr-qc/0512160 [gr-qc] .
I Supplemental Material


II EoS
As argued in Ref. Haensel and Zdunik (1989); Koranda et al. (1997) the most compact configuration will result from a combination of a cold, soft EoS at small densities and a cold stiff one at larger ones. Given our current ignorance, there is much freedom in constructing such an allowed EoS. Doing so involves choices about the small density part as well as the matching density to the stiff section. In this work we employ the EoS adopted in Ref. Tsokaros et al. (2019a) which we called ALF2cc. Eq. (1) relates the pressure to the total energy density when , while for one typically specifies the pressure in terms of the rest-mass density in the form of a polytropic-like function. To express the EoS we can integrate the first law of the thermodynamics in the form and with the use of Eq. (1) we can write the pressure, energy density and enthalpy as a function of the rest-mass density. For
| (3) | |||||
| (4) | |||||
| (5) |
where . The value can be evaluated from the polytropic piece before the core. Spherical equilibrium models for both the ALF2 and ALF2cc EoSs are presented in Fig. 5 where the gravitational mass and the compactness of the stars are plotted vs the rest-mass density. For the ALF2 EoS the maximum mass is at rest-mass density and compactness . For the ALF2cc EoS we have at and compactness .

III Apparent horizon area and ringdown frequencies
One key characteristic of the stationary black holes at the end of our simulations both for the NSNS and BHBH runs is their horizon area. We compute the area in two ways: first as a surface integral over the apparent horizon, and second by using the Kerr formula , where is the Boyer-Lindquist radial coordinate of the event horizon. For the latter case we use , where and are the BH angular momentum and mass, respectively, as calculated by the isolated horizon formalism Dreyer et al. (2003). For both the NSNS and the BHBH runs the two diagnostics yield almost identical results, which shows that (1) the apparent horizon coincides with the event horizon and (2) the area is indeed the one given by the Kerr metric. Comparing the areas of the remnant BHs of the NSNS and BHBH runs we find that they agree to (though their coordinate shapes are quite different).
In Fig. 6 we plot the dominant modes (blue curve) and (red curve) discussed in the text. Vertical solid lines correspond to the retarded times at which the amplitudes of (solid blue line) and (solid red line) acquire their maximum values. The vertical dashed lines correspond to after peak strain times, at which time we assume that the ringdown starts. Black curves are best fits for the (4,4) modes and horizontal lines correspond to average asymptotic values. The frequencies of the (2,2) modes for the NSNS and BHBH binaries are very close to each other and lead to determination of the dimensionless BH spin that is consistent with the values presented in Fig. 4 and discussed in the previous paragraphs.
IV Diagnostics
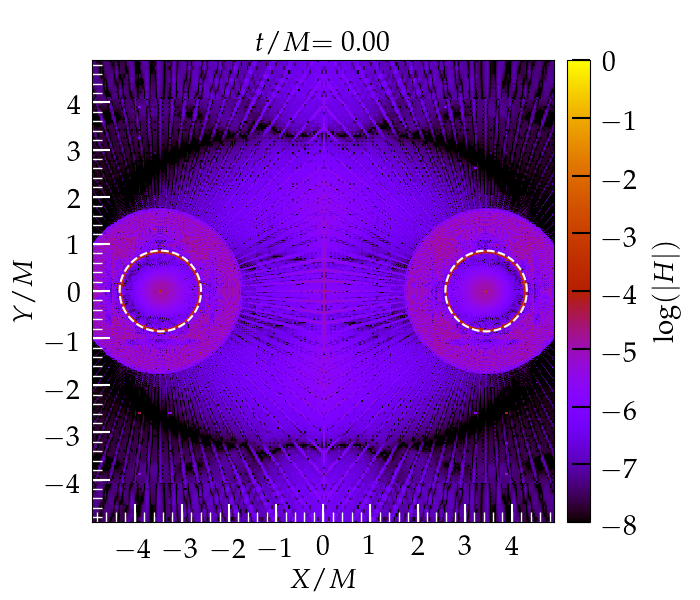
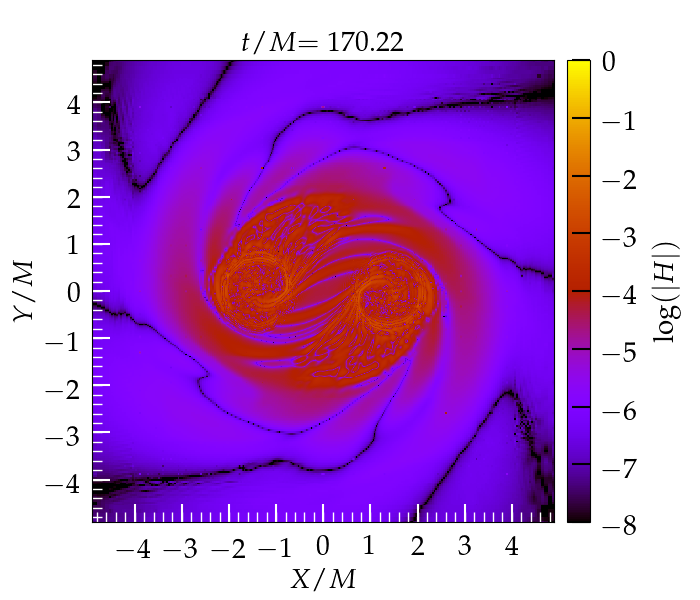
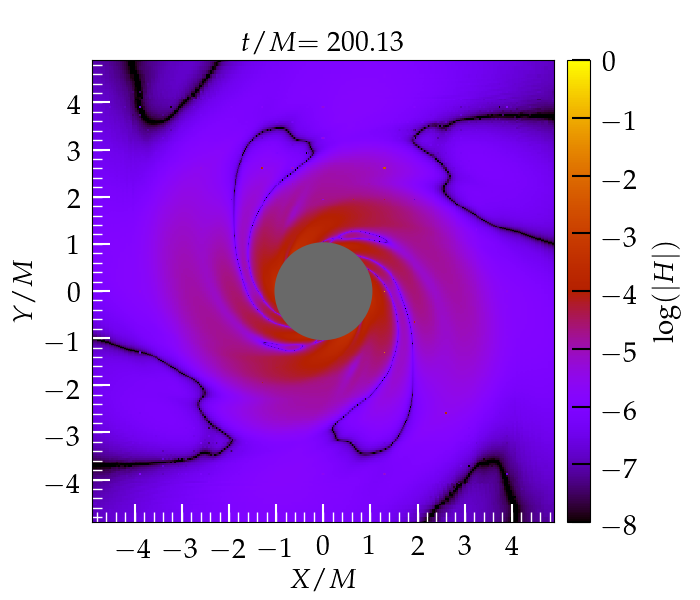
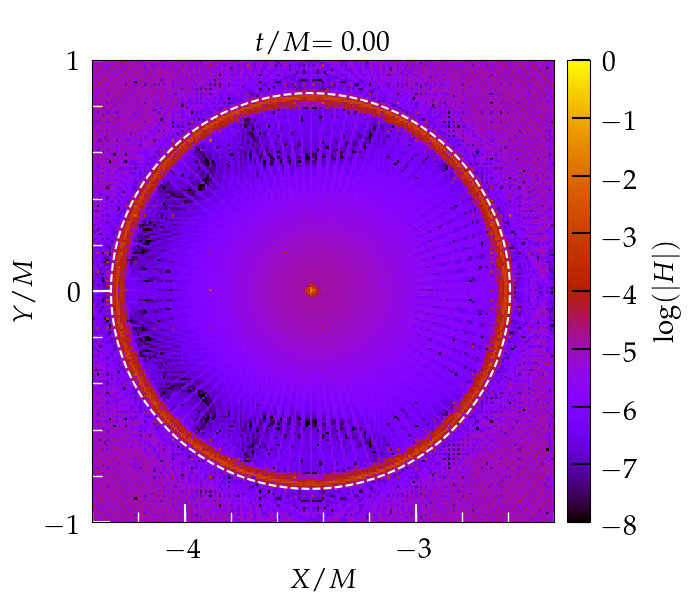
In Fig. 7 we plot the violations of the Hamiltonian constraints on the xy plane at , and just before and after merger. For the initial data, the general level is very similar to the violations presented in Ref. Tsokaros et al. (2016) where a simple polytropic EoS was used. In the panel white dashed curves (almost circles) correspond to the surfaces of the stars as calculated from the cocal code. The violations of the constraints at the center of the star, which have been seen and explained in Ref. Tsokaros et al. (2016), are due to the spherical coordinate system of the cocal code, and are washed out almost immediately after the evolution starts. The red circles where the violations are also larger are in reality thin shells that can be seen clearly in Fig. 8, where we zoom into the NS on the negative x axis. The width of the shell corresponds to the ALF2 crust and is the region where the rest-mass density drops steeply from a finite value to zero (see Fig. 1). As the binary inspirals these violations similarly track the paths of the stars and contaminate the region around them (middle panel in Fig. 7). With the formation of the AH these large violations progressively move inside it and disappear.
In the top panel of Fig. 9 we show the normalized angular momentum as calculated by a surface integral close to the outer boundary (dashed lines) as well as the total angular momentum of the systems which includes the one emitted by GWs, . The BHBH binary conserves angular momentum better than while the NSNS binary better than . At the end of the simulations of the total angular momentum of the NSNS systems has been radiated away while for the BHBH binary that number is . This is also consistent with the spin angular momemntum diagnostics of the remnant refered to Fig. 4. Similarly, conservation of mass is shown in the bottom panel of Fig. 9, with the radiated mass being of the total.
V Phase extrapolation
In order to compute the phase difference at infinite resolution between the NSNS and BHBH binaries we note that if are the quantities at two resolutions , then
| (6) |
where is the order of convergence. In our NSNS case and the order of convergence of the Illinois GRMHD code is Etienne et al. (2008, 2010); Tsokaros et al. (2019b); Espino et al. (2019). Using at resolutions R1nsns and R2nsns (Fig. 3, bottom panel) and Eq. (6), one can calculate at infinite resolution as a function of the frequency. For a select set of frequencies Hz and we find rad. Note that a smaller order of convergence will increase this phase difference and thus predict higher probability for distinguishability.