Modeling earthquakes with off-fault damage using the combined finite-discrete element method
Kurama Okubo,1 Esteban Rougier,2, Zhou Lei, 2, Harsha S. Bhat3
-
1.
Earth and Planetary Sciences, Harvard University, Cambridge, MA, USA
-
2.
EES-17 - Earth and Environmental Sciences Division, Los Alamos National Laboratory, New Mexico, USA
-
3.
Laboratoire de Géologie, École Normale Supérieure, CNRS-UMR 8538, PSL Research University, Paris, France.
When a dynamic earthquake rupture propagates on a fault in the Earth’s crust, the medium around the fault is dynamically damaged due to stress concentrations around the rupture tip. Recent field observations, laboratory experiments and canonical numerical models show the coseismic off-fault damage is essential to describe the coseismic off-fault deformation, rupture dynamics, radiation and overall energy budget. However, the numerical modeling of “localized” off-fault fractures remains a challenge mainly because of computational limitations and model formulation shortcomings. We thus developed a numerical framework for modeling coseismic off-fault fracture networks using the combined finite-discrete element method (FDEM) and we applied it to simulate dynamic ruptures with coseismic off-fault damage on various fault configurations. This paper addresses the role of coseismic off-fault damage on rupture dynamics associated with a planar fault, as a base case, and with a number of first-order geometrical complexities, such as fault kink, step-over and roughness.
1 Introduction
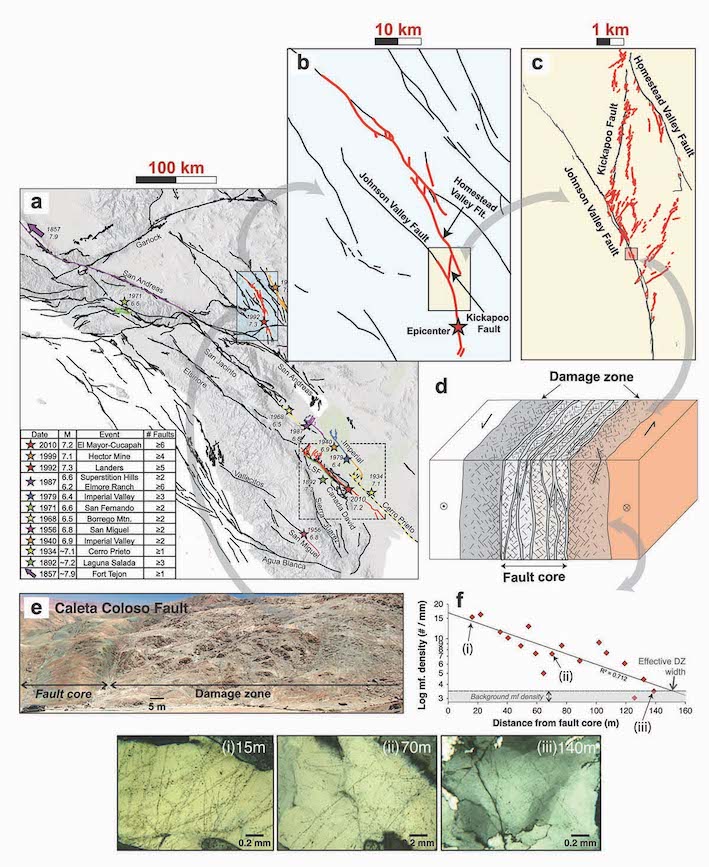
The contribution of inelastic off-fault deformation to the rupture dynamics has been pointed out since 1970’s. Sibson (1977) conceptually proposed a formulation for the overall energy budget of dynamic earthquake ruptures; a part of the energy released from accumulated strain energy by interseismic deformation is converted to seismic wave radiation, while the rest is expended in inelastic deformation processes within the fault zone. Then numerous studies via field observations have shown evidence of fractured rock surrounding the fault core, which can be coseismically damaged due to dynamic earthquake ruptures (e.g. Chester et al., 1993; Shipton and Cowie, 2001; Faulkner et al., 2011). Furthermore, Mitchell and Faulkner (2009) showed that microfracture density is significantly higher in the near-fault region while it exponentially decreases with distance from the fault core, evidencing the presence of a well-defined off-fault damage zone.
Figure 1 shows the hierarchical fault system in a wide range of length scales. Generally, fault geometrical complexity associated with an earthquake event is discussed in kilometric scale (Figures 1a and 1b). However, when we focus on a smaller portion of the fault system, we find off-fault fractures in subkilometric scale (Figures 1c and 1d). These smaller scale off-fault fractures are either not included in kinematic and conventional dynamic earthquake rupture models, or their effects are homogenized using elastic-plastic constitutive damage models (i.e. Andrews, 2005; Templeton and Rice, 2008). In these approaches the localized off-fault fractures indicated by red lines in Figure 1c remain to be fully modeled because of limitations in the damage model formulations, although their contributions might be significant on the rupture dynamics, deformation and residual stress field. Therefore, we need a numerical framework which allows for modeling both dynamic rupture on complex fault systems and coseismic generation of off-fault damage to investigate its effects on them.
This paper first describes the numerical framework of modeling dynamic earthquake rupture using the combined finite-discrete element method (FDEM) (Munjiza, 2004; Munjiza et al., 2011, 2015) that allows for modeling localized coseismic off-fault fractures and for quantifying their contributions to rupture dynamics, seismic radiation and energetics of earthquakes. We then perform a series of dynamic rupture modeling cases, showing FDEM’s capability for modeling dynamic earthquake ruptures with dynamically activated tensile and shear fractures in the off-fault medium. Both friction and cohesion laws are applied on the fracture surfaces, providing a quantitative measure for energy dissipation due to the off-fault fracturing.
Since FDEM uses unstructured meshes, it can be used to model ruptures on complex fault systems such as fault kink, step-over and roughness. We demonstrate the rupture modeling on these fault configurations with first-order geometrical complexity in order to identify the damage pattern associated with each case and to investigate the rupture dynamics for first-order geometrical complexities. This case study eventually contributes to decompose the effects of coseismic off-fault damage on real fault systems with further parametric studies as a real fault system is formed by the aggregation of those simpler geometrical complexities.
2 Continuum-discontinuum approach for dynamic earthquake rupture modeling
In the numerical framework of modeling both dynamic earthquake rupture and coseismic off-fault damage, geological faults and off-fault fractures are equivalently defined as discontinuities within a continuum medium. From this perspective, we consider both the faults and the off-fault damage in the same framework as an aggregation of fractures at different length scales. The activation of new fractures in the medium is represented as the loss of cohesive resistance. Frictional processes then take place at the boundary of the fractured surfaces, and they have a significant contribution in earthquakes’ overall energy budget. Therefore, we need a modeling scheme able to handle both continuum (deformation) as well as discontinuum processes (fractures) within the same framework. Furthermore, this model requires efficient contact algorithms to resolve contact, cohesive and frictional forces, operating on every fracture surface and potential failure planes. We first provide a general description of the numerical framework using FDEM to model the dynamic earthquake ruptures on the prescribed fault system.
2.1 Formulation of FDEM
The application of FDEM, pioneered by Munjiza et al. (1995), has been expanded in the last couple of decades to solve broad scientific problems associated with fracturing and failure of solid media such as block caving, rock blasting, dam stability, rock slope stability and hydraulic fracturing (e.g. Mahabadi et al., 2014; Lisjak et al., 2014; Lei et al., 2014; Zhao et al., 2014; Lei and Ke, 2018; Lei et al., 2019; Rougier et al., 2014; Gao et al., 2019; Euser et al., 2019). In the FDEM framework, a solid medium is firstly discretized into finite elements, in which the deformation is governed by stress-strain constitutive laws as in the conventional finite element method (FEM). The interaction among individual elements is then computed based of prescribed cohesion and friction laws. In this study, we utilized the FDEM-based software tool, HOSSedu (Hybrid Optimization Software Suite - Educational Version), developed by Los Alamos National Laboratory (LANL) (Knight et al., 2015). More details of main algorithmic solutions used within HOSSedu can be found in a series of monographs (Munjiza, 2004; Munjiza et al., 2011, 2015).
2.2 Model description
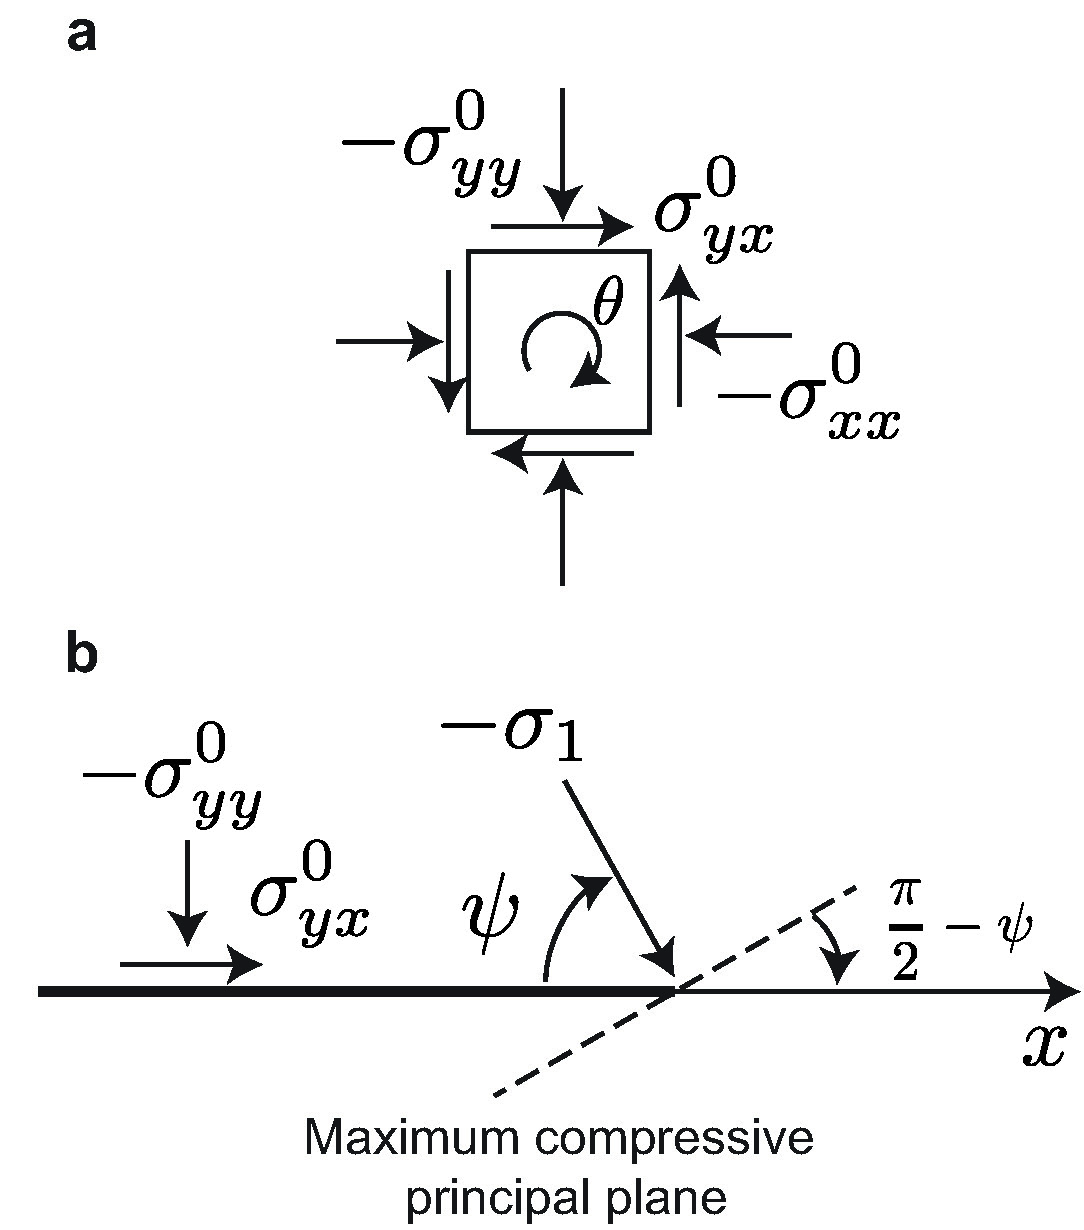
In this section we describe the prestress condition and failure criteria used for dynamic earthquake rupture modeling with coseismic off-fault damage. The sign convention used in this work considers that tensile stresses and clockwise rotations are positive as shown in Figure 2.
2.3 Initial stress state with depth
We follow a similar process to that proposed by Templeton and Rice (2008) and Xu et al. (2012) to make an assumption of initial stress state as a function of depth. For the sake of simplicity, we assume the prestress state linearly increases in depth based on lithostatic and hydrostatic conditions; therefore, it does not represent to a certain regional stress at depth.
A main fault plane is set parallel to the depth direction while the - plane is perpendicular to . The x-axis is aligned with the main fault and the origin of the x-y coordinate system is located in the middle of the main fault. The initial stress state is set for triggering a right-lateral strike-slip on the main fault. We solve this problem assuming plane strain conditions. The initial stress state is initially uniform in the homogeneous and isotropic elastic medium, and is given by
| (1) |
Let normal stress on the main fault be given by linear overburden effective stress gradient such that
| (2) |
where is the density of rock, is the density of water, is the gravitational acceleration and is the depth measured from the ground surface. The initial shear stress is estimated in terms of the seismic ratio, defined by Andrews (1976), on the main fault such as
| (3) |
where and are the static and dynamic friction coefficients respectively. The value of the ratio defines whether the rupture velocity is supershear (), or remains sub-Rayleigh () in 2-D. Thus the initial shear stress on the main fault can be written as
| (4) |
The horizontal compressive stress is then determined by the normal stress , shear stress and the given orientation of the initial compressive principal stress to the main fault (indicated in Figure 2b) as follows:
| (5) |
The relationship of the magnitude of and depends on in the following manner:
| (6) |
which is consistent with the condition of initial stress state defined by Poliakov et al. (2002) and Rice et al. (2005).
2.4 Failure criteria
In the FDEM framework, cracks are represented as a loss of cohesion at the interfaces of the finite elements in the model. The combined single and smeared discrete crack approach (Munjiza et al., 1999) is generally accepted as a crack model based on fracture energy, where the cohesion and friction are prescribed following actual representations of experimental stress-strain curves (Lei et al., 2014). It is worth noting that the cohesion and the friction against the opening or sliding motion between contactor and target are a function of displacements defined by the aperture and the slip between the contactor and the target.
The cohesive and frictional resistances are applied on every interface between elements (i.e., at every edge), which is regarded as a potential failure plane. Both cohesion and friction curves are divided into two parts, an elastic loading part and a displacement-weakening part as shown in Figure 4. In the elastic loading part, the resistant forces against displacements acting on the interface increase non-linearly (for the case of cohesion) or linearly (for the case of friction) with the stiffness of the elastic loading portions being respectively. Since this elastic loading part ideally should be zero to represent the material continuity, the stiffnesses, and , are chosen to be much higher than the Young’s modulus of the material in order to minimize the extra compliance introduced by the interfaces’ elastic loading portions. In this study, we chose , and is chosen in the same order of as described in the following section. When the applied traction on the interface reaches the peak tensile or shear cohesion strengths , the interface bonding starts to be weakened (i.e., damage starts to accumulate), and eventually it loses the cohesion (Figure 4b). When the shear traction reaches to frictional strength , it decreases down to the residual strength at critical displacements as shown in Figure 4c. The friction curve follows the linear slip-weakening law originally proposed by Ida (1972) and Palmer and Rice (1973), which has been widely used for dynamic earthquake rupture modeling (e.g. Andrews, 1976; Aochi and Fukuyama, 2002; De La Puente et al., 2009). Eventually, the medium’s shear strength follows the Mohr-Coulomb failure criteria. Note that the friction law is operating both on the main fault and the secondary cracks activated in the off-fault medium.

The mixed mode fracture is evaluated by a damage parameter, , which is defined as
| (7) |
| (8) |
| (9) |
where () are the components of damage for tensile and shear modes, are the normal and tangential displacements, are the initial critical displacements for elastic loading, are the maximum displacements during linear-softening where are the initial critical displacements for the linear-weakening part, is the degree of damage and indicates the type of damage. Similar expressions can be found in Rougier et al. (2011) and Lisjak et al. (2014).
Since we employed a linear softening law, the fracture energies related with cohesion for tensile (mode I) and shear (mode II) (i.e., the energy required to completely break the bonds between finite elements) are evaluated as
| (10) |
where are the tensile and the shear fracture energies and are the tensile and the shear cohesive strengths. The fracture energy for friction is, following Palmer and Rice (1973), described as
| (11) |
where is the fracture energy for friction, is the critical slip distance for friction and and are the peak strength and the residual strength for friction, defined as
| (12) |
| (13) |
where and are the static and dynamic friction coefficients and is the normal stress on the contact surface. Note that the elastic loading part is much smaller than , so that the representation of fracture energy by equation (11) is acceptable even without the consideration of elastic loading part.
2.5 Friction law
When the amount of slip exceeds the elastic slip distance for cohesion , the cohesive force starts weakening. We assume that the friction starts weakening at so that the cohesion and the friction start weakening at the same amount of slip. We do this by adjusting the stiffness of elastic loading for friction , as follows
| (14) |
The fracture energy related with friction, , is approximated from the equation (11).
One interesting question is, as pointed out by Rice et al. (2005), what parameters vary with depth. In our parametrization, normal stress on the fault lithostatically increases with depth. Lachenbruch (1980) proposed a formula of frictional resistance similar to the exponential slip-weakening law, where the slip-weakening distance on the fault is almost independent of depth because it is composed by physical parameters like the width of fault gouge and other coefficients related with pore fluid or rock material, which are assumed to be constant with depth (also referred in Rice et al. (2005)). In this case, on the fault derived by equation (11) increases with depth as the strength drop linearly increases as in our model description, described as
| (15) |
where is a given constant critical slip distance with depth. This is the first scenario that we consider. The second scenario is to assume that on the fault is kept constant with depth. In this case, decreases with depth, as a function of a given constant on the fault, as follows
| (16) |
For the sake of simplicity, we call the first scenario constant case, and the second scenario constant case.
In both scenarios, as proposed by Palmer and Rice (1973), the process zone size for the quasi-stationary crack, over which the friction is weakened with ongoing slip to the residual strength, is described as
| (17) |
for the constant case, while
| (18) |
for the constant case. As shown by equations (17) and (18), decreases with depth as for constant case and for constant case.
Note that since the size of potential failure area is of the same order of magnitude as (e.g. Poliakov et al., 2002), the damage zone is expected to decrease with depth, as mentioned by Rice et al. (2005).
To artificially nucleate the rupture from a part of pre-exisisting fault, a slippery zone where frictional resistance is lower than the rest of the fault is set in the nucleation patch. The length of the slippery zone is slightly greater than the critical nucleation length at instability, , derived by Palmer and Rice (1973) such as
| (19) |
2.6 Closeness to failure
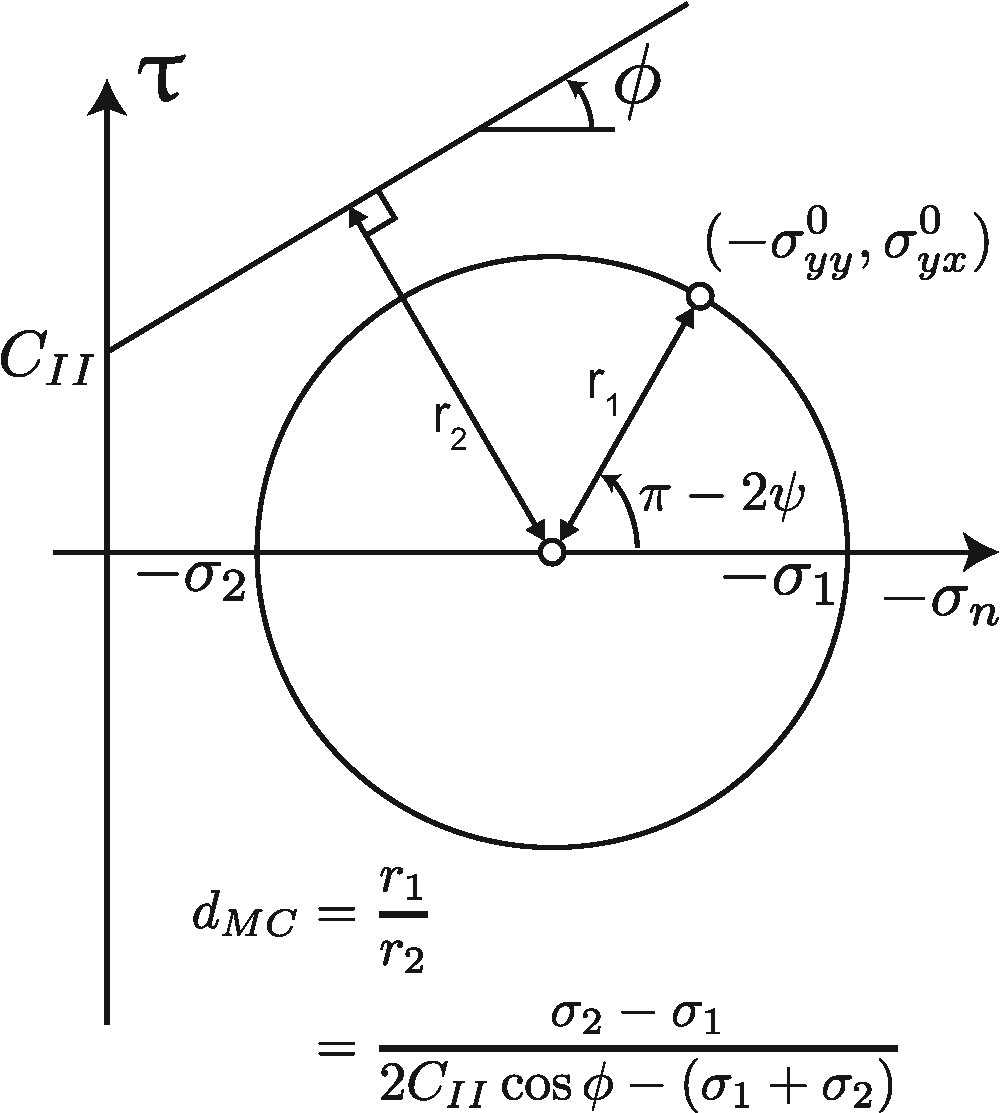
Here, we describe the parametrization of the failure criteria based on the fracture energy estimated from the experiments and observations (Viesca and Garagash, 2015; Passelègue et al., 2016), and the closeness to failure, proposed by Templeton and Rice (2008) and Viesca et al. (2008), which indicates the safety of the initial stress state to the failure of the material represented by the ratio of the radius of the Mohr’s circle to the distance to the Mohr-Coulomb criteria. Let and be the maximum and minimum compressive principal stresses. Assume a Mohr-Coulomb friction criteria with shear peak strength . Then the closeness to failure, , is derived from geometrical relationships such that
| (20) |
where is the friction angle as (Figure 5). Thus means no failure and implies the initiation of failure in shear on the corresponding plane. Note that locally changes due to perturbations of the stress field.
To make the medium equally close to failure, regardless of the stress state, is kept constant with depth. By assuming the constant angle of maximum compressive principal stress and the seismic ratio , the ratio of principal stresses is derived to be constant with depth. Thus from equation (20), the ratio has to be kept constant to obtain an equal closeness to failure with depth, implying that peak cohesion must increase linearly in depth. Therefore we first calculate as described in previous section, and then we then derive as follows
| (21) |
where should be chosen carefully to avoid being negative. is chosen from the experiments (Cho et al., 2003), and is kept constant with depth. See Okubo (2018) for the rest of parameters to define cohesion curve such as and .
3 Results
In this section we present the results obtained from FDEM simulations for a number of relevant earthquake rupture cases: 1) Rupture of a planar fault (base case), 2) Rupture along a fault with a kink, 3) Rupture on a step-over fault system, and 4) Rupture along a rough fault.
3.1 Rupture on a planar fault
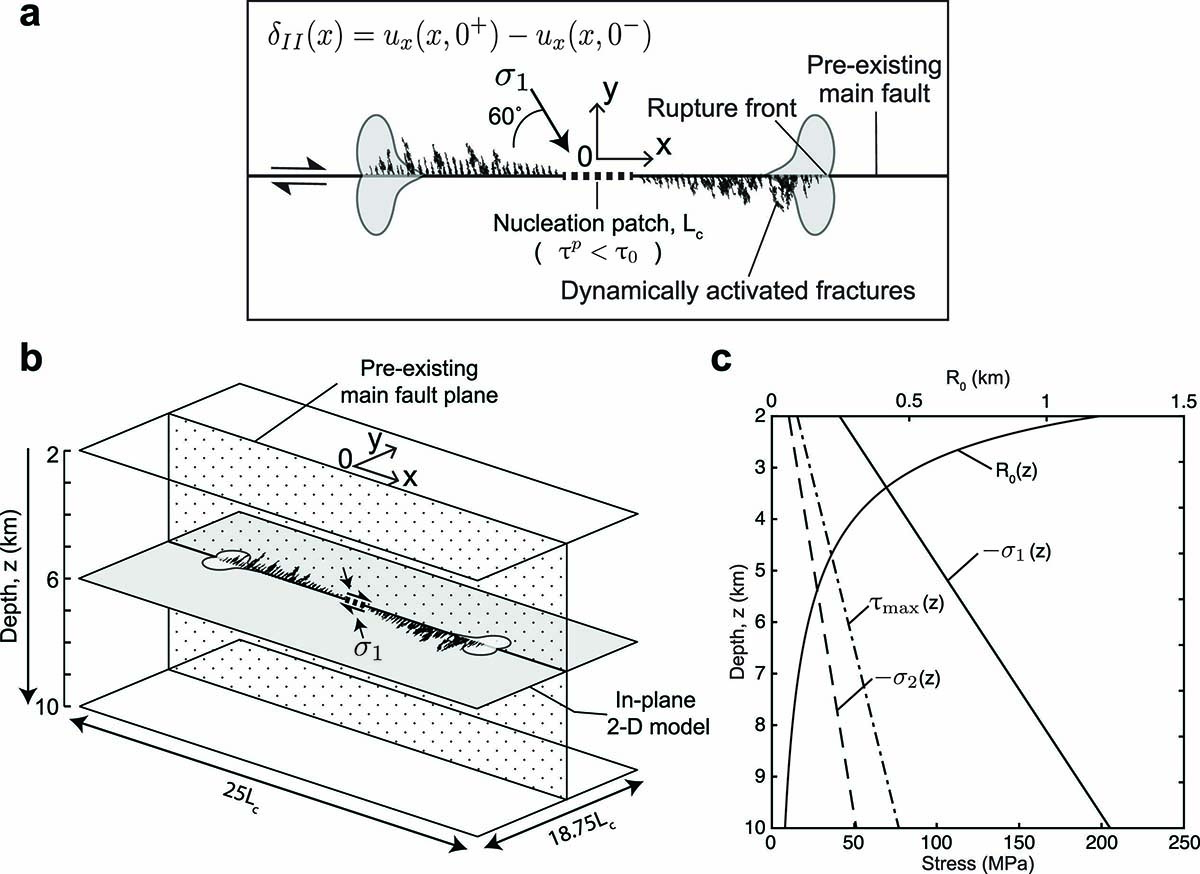
We performed the dynamic earthquake rupture modeling with a planar strike-slip fault, surrounded by intact rock, in plane strain conditions allowing for the generation of off-fault fractures. Figure 3a shows the model description for the 2-D dynamic earthquake rupture modeling. In this paper, we show the result of 2km depth for sub-Rayleigh and supershear cases, where the height and width of model are 25Lc (77km) and 18.75Lc (58km) with sub-Rayleigh case, respectively. The material properties and parameters for contact interactions used in this section are listed in Tables 1 and 2.
| Valuables | Values | Descriptions |
| 75 GPa | Young’s modulus | |
| 30 GPa | Shear modulus | |
| 0.25 | Poisson’s ratio | |
| 2700 kg m-3 | Density | |
| 60∘ | Orientation of | |
| 33.3 MPa | Normal stress on the main fault | |
| 1192 m | Quasi-static process zone size | |
| 79.5 m | Grid size on the main fault | |
| 0.11 ms | time step | |
| Sub-Rayleigh | ||
| 13.3 MPa | Shear stress on the main fault | |
| 1.0 | S ratio | |
| 3092 m | Nucleation length | |
| Supershear | ||
| 14.5 MPa | Shear stress on the main fault | |
| 0.7 | S ratio | |
| 2234 m | Nucleation length |
On the main fault
| 0.6 | Static friction coefficient | |
| 0.2 | Dynamic friction coefficient | |
| 0.45 m | Characteristic slip distance | |
| 3 MJ m-2 | Fracture energy for friction |
In the off-fault medium
| 0.6 | Static friction coefficient | |
| 0.2 | Dynamic friction coefficient | |
| 1.0 mm | Characteristic slip distance | |
| 0.7 KJ m-2 | Fracture energy for tensile cohesion | |
| 5.0 KJ m-2 | Fracture energy for shear cohesion and friction | |
| 0.45 | Closeness to failure | |
| 8.0 MPa | Peak cohesion for opening crack in low cohesion zone | |
| 0.18 mm | Critical displacement for softening of tensile cohesion | |
| Sub-Rayleigh | ||
| 24.5 MPa | Peak cohesion for shear crack in low cohesion zone | |
| 0.41 mm | Critical displacement for softening of shear cohesion | |
| Supershear | ||
| 28.1 MPa | Peak cohesion for shear crack in low cohesion zone | |
| 0.35 mm | Critical displacement for softening of shear cohesion |
The rupture is artificially nucleated from the nucleation patch, where the peak friction is lower than the initial shear traction on the main fault. The size of nucleation patch is determined by the critical crack length (Palmer and Rice, 1973). Then it propagates bilaterally on the main fault, dynamically activating off-fault fractures. The x axis is along the fault-parallel direction, while the y axis is along the fault-normal direction. The z axis is thus along depth. Figure 3b shows the schematic of case study with depth. We performed a set of 2-D dynamic earthquake rupture modeling to investigate the evolution of coseismic off-fault damage and its effects as a function of depth. We conducted 2-D simulations for depths ranging from z = 2km to 10km in 1km intervals, imposing the corresponding initial stress states as shown in Figure 3c. We assume lithostatic condition with depth so that the confining pressure linearly increases with depth. The quasi-static process zone size (see eq. 18) decreases with depth while the fracture energy on the main fault is kept constant (Figure 3c). Note that the case study does not address the 3-D effect (e.g. free surface) as we model the dynamic ruptures in plane strain conditions.
For the sake of fair comparison between different depths, the model parameters are nondimensionalized (i.e., made dimensionless) by a combination of scaling factors. [m] and shear wave velocity [m/s] are used to scale the length [m] and the time [s] by and , respectively. Subsequently, other variables are also nondimensionalized by a combination of those two scaling factors. Since the medium’s density does not change during the simulations, there is no need for a mass non-dimensionalization in our problem.
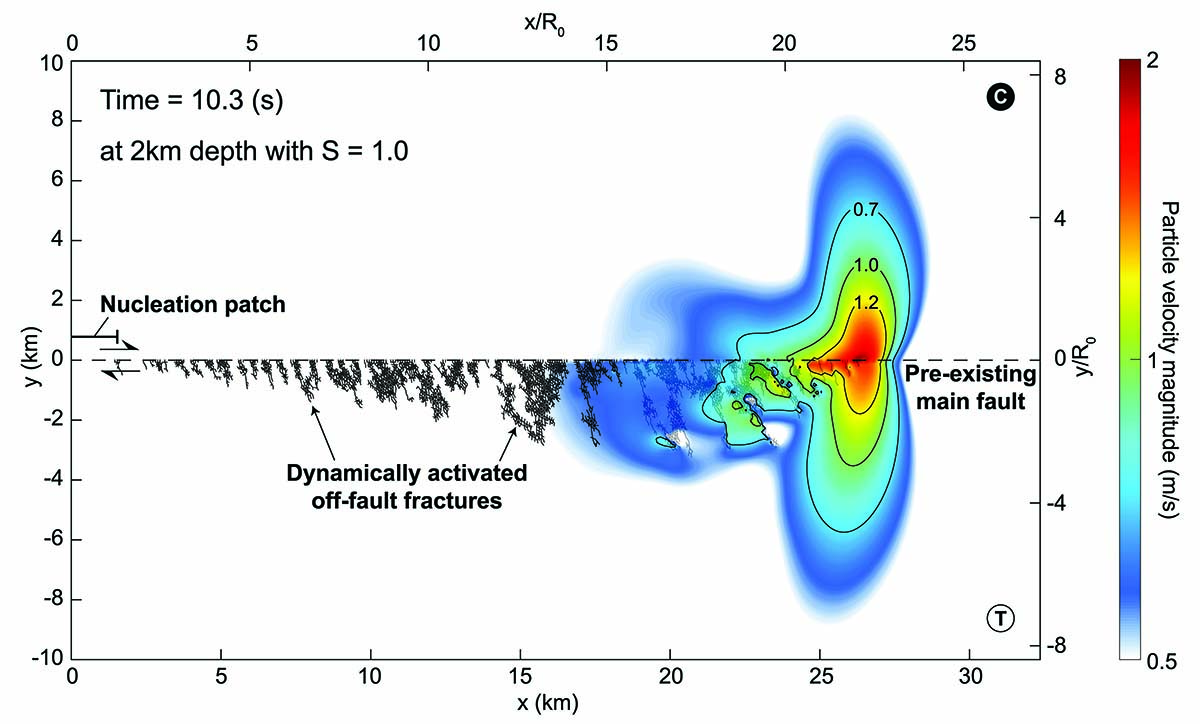
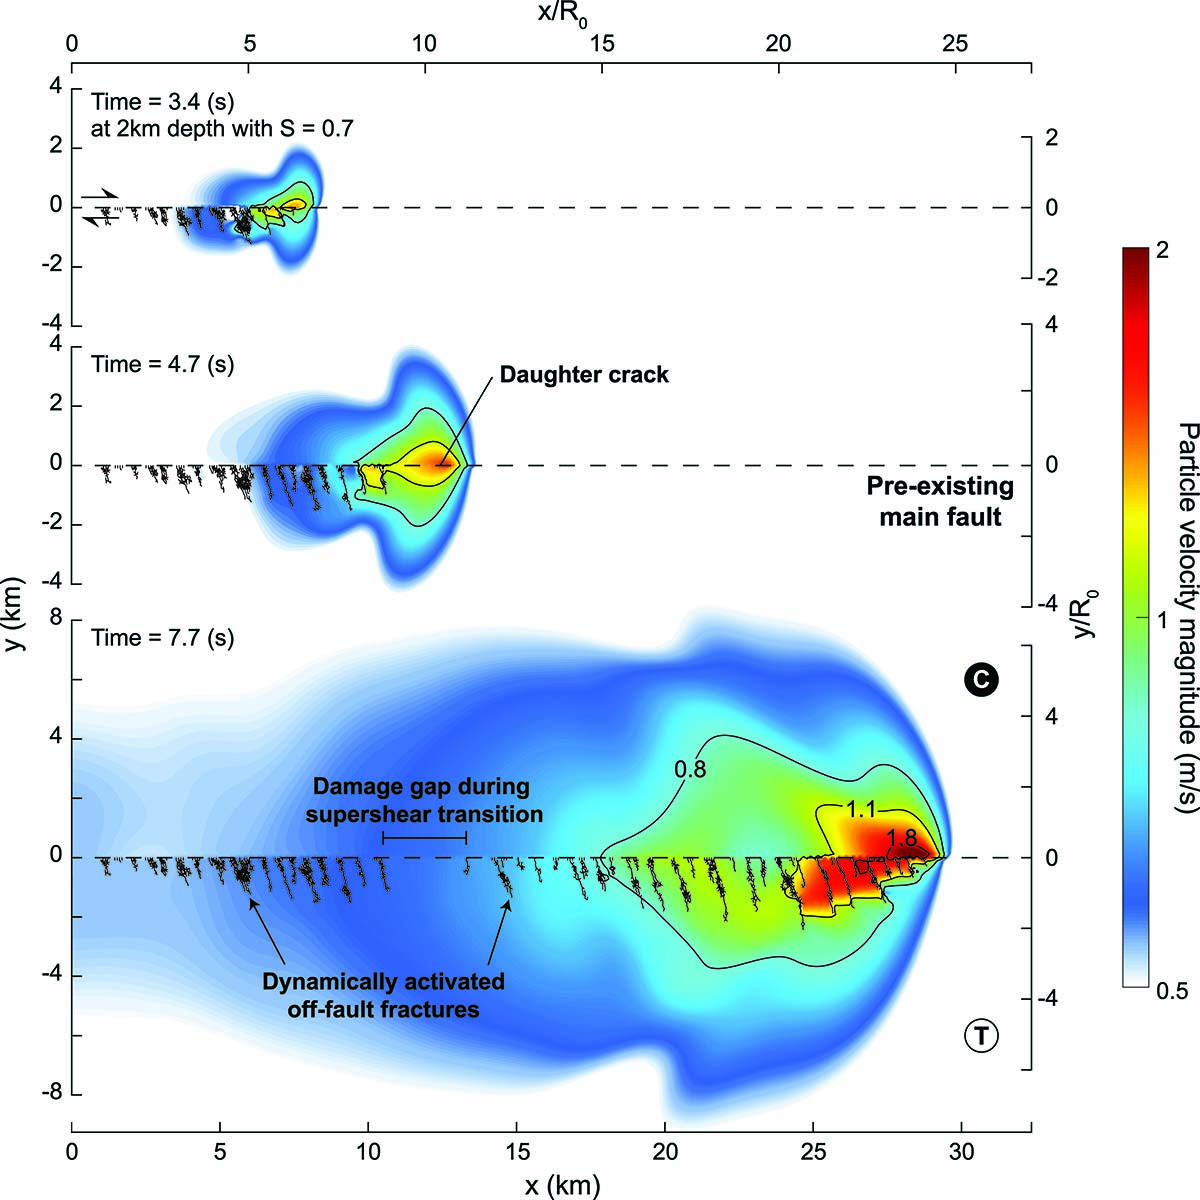
Figure 6 shows a snapshot of a dynamic earthquake rupture simulation with dynamically activated off-fault fractures, where the particle velocity field and the fracture traces around the main fault are superimposed. The seismic ratio is equal to 1.0 (see eq. 3), which results in a sub-Rayleigh rupture. The off-fault fractures are plotted when the traction applied on the potential failure plane (i.e. interfaces between finite elements within the mesh) reaches the cohesive strength and the cohesion starts weakening. Bottom and left axes indicate the fault-parallel and fault-normal distances in physical length scales, while top and right axes indicate the nondimensionalized length scales.
The off-fault fractures are initiated around the rupture tip, forming an intricate fracture network as the main rupture propagates along the main fault. The particle velocity field is significantly perturbed due to the generation of coseismic off-fault damage. The extensional side of the main fault is mostly damaged, which is supported by theoretical analyses of potential failure areas (Poliakov et al., 2002; Rice et al., 2005) and other numerical simulation studies (e.g. Andrews, 2005). The intricate network is formed by means of fracture coalescence between tensile, shear and mixed mode fractures. We later discuss this off-fault fracturing process under a relatively steep angle of the maximum compressive principal stress to the fault ( = 60∘), and its effects on the near field radiation and overall energy budget.
Figure 7 shows a set of snapshots for the supershear case with . The rupture is nucleated and propagates at sub-Rayleigh speeds in the earlier phase. Then a daughter crack is born ahead of the rupture front at s, which then transitions to a supershear rupture. During the rupture transition from sub-Rayleigh to supershear, characteristic damage patterns appear; there is a gap of coseismic off-fault damage around the transition phase (around x = 12km in Figure 7). This characteristic damage gap has been also pointed out by Templeton and Rice (2008) and Thomas and Bhat (2018). This can be explained by the Lorentz contraction of the dynamic process zone size . The dynamic process zone size asymptotically shrinks at the rupture’s limiting speed, i.e., Rayleigh’s wave speed. Hence the damage zone size is minimized around when rupture velocity jumps from sub-Rayleigh to supershear, causing the damage gap in the region.
3.1.1 Rupture velocity
We next focus on analysing the rupture velocity changes along the main fault. Figure 8 shows the evolution of slip velocity on the main fault for four cases; or 0.7 at 2km depth, each of which with or without considering off-fault damage. For the cases without off-fault damage, the activation of secondary fractures is prevented by imposing very high values of cohesion strength for both tensile and shear modes. Here, we plot the contour of slip velocity in space and time. In Figure 8a, there is a clear transition from sub-Rayleigh to supershear around , which is also shown in the inset. However, when the coseismic off-fault damage is taken into account, the supershear transition is not observed during the simulation as shown in Figure 8b. Hence, the secondary fractures can arrest, or delay, supershear transition in certain stress conditions. This can be explained by the increase in critical slip distance due to the coseismic off-fault damage. The supershear transition length can be estimated from the Andrews’ result (Andrews, 1985; Xia et al., 2004) as follows
| (22) |
where is the threshold for the supershear transition ( for 2-D), is the Poisson’s ratio of the medium, , and are peak friction (eq. 12), residual friction (eq. 13) and shear traction on the fault, respectively, is the shear modulus and is the critical slip distance for friction (eq. 16). is initially uniform on the main fault. However, the effective critical slip distance, which takes into account the fracture energy associated with both on and off the fault, increases with the evolution of coseismic off-fault damage (see Okubo (2018)). Therefore, also increases as it is proportional to Dc.
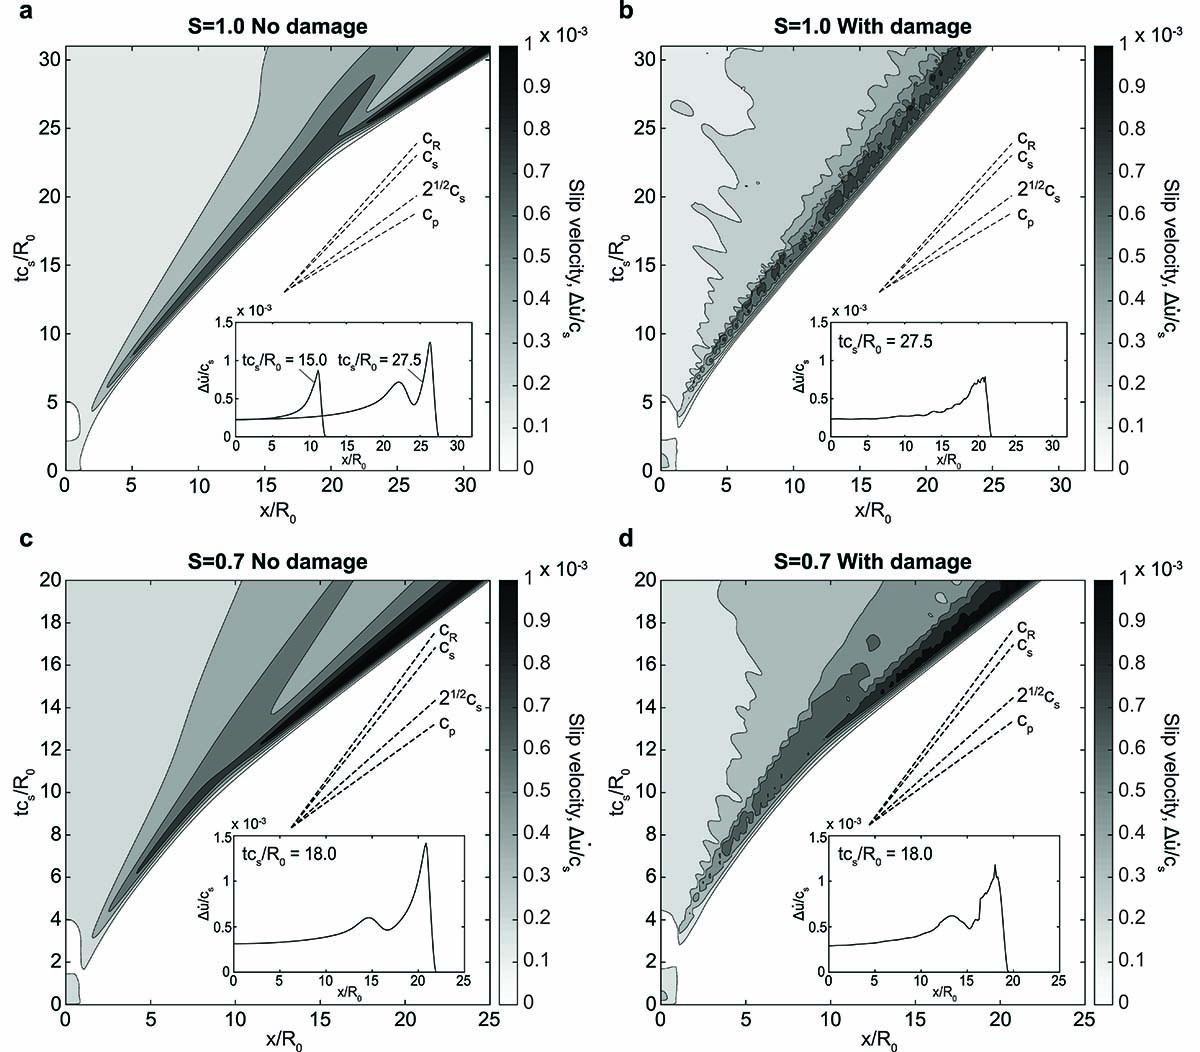
Figures 8c and 8d show the cases with , where the rupture transitions to supershear for both cases with and without off-fault damage because of the large contrast of the initial shear traction to the normal traction on the main fault. The time at which the supershear transition happens is delayed for the cases with off-fault damage due to the decrease of rupture velocity, whereas the difference of transition length is still obscure with these results. The two insets shown in figures 8c and 8d show a clear difference in the slip velocity peak and the fluctuations. In addition, the rupture arrival is delayed by the coseismic off-fault damage, implying a decrease in rupture velocity.
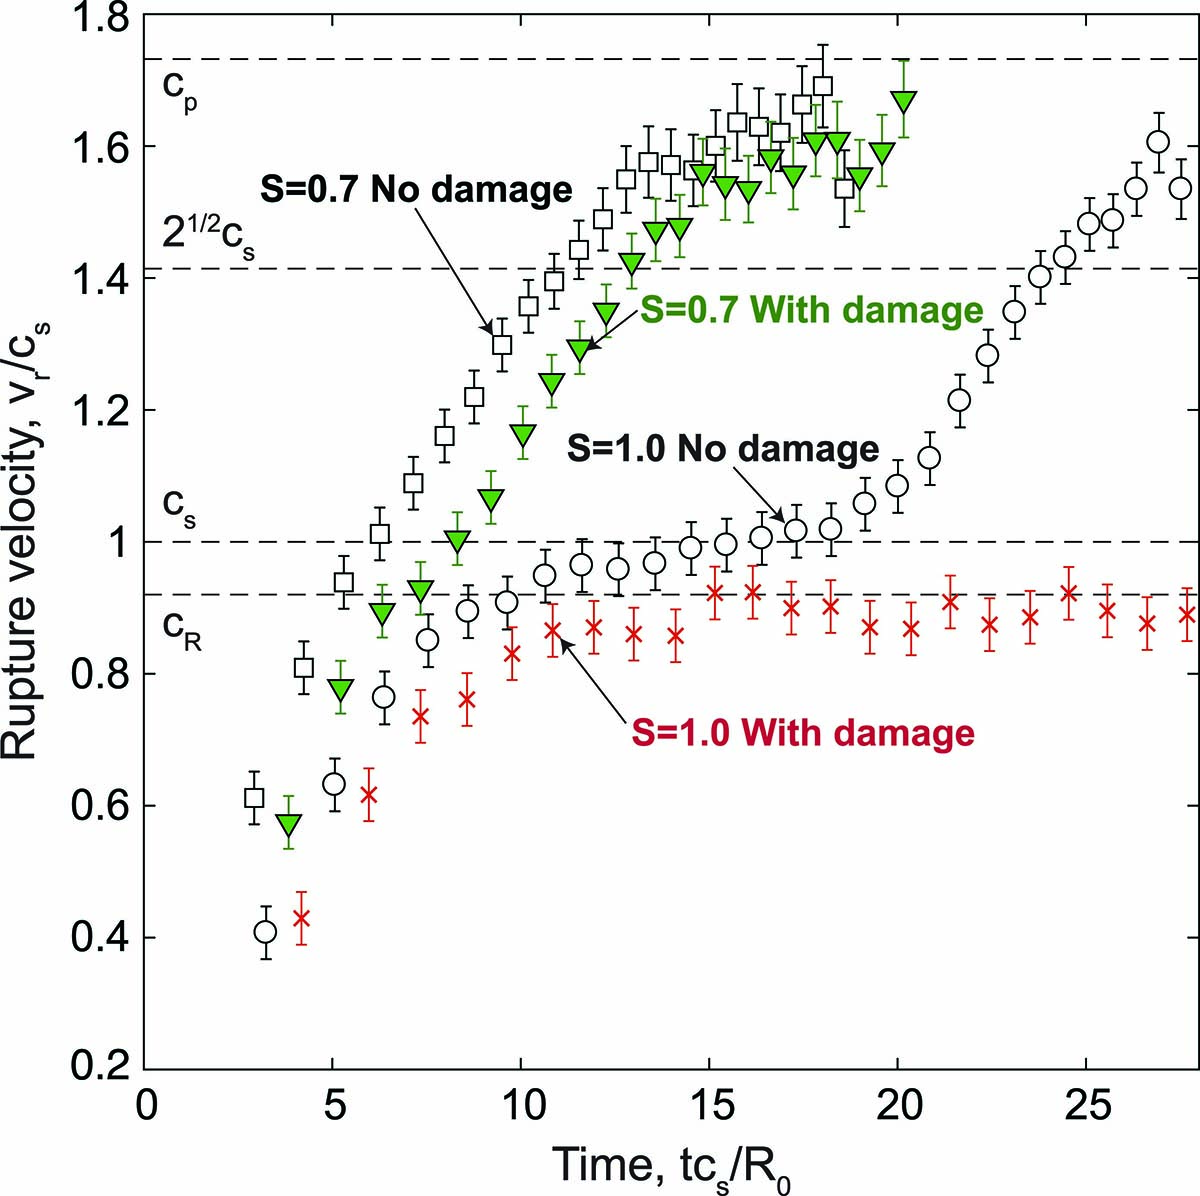
The rupture velocity is calculated based on first arrival times along the main fault. Figure 9 shows the evolution of rupture velocity as a function of time. We take the time derivatives of first arrival time in discretized space along the main fault to calculate the representative rupture velocity at a certain position. Since it is difficult to capture the exact time when the rupture velocity jumps to supershear, which is where the curve of first arrival time has a kink and is non-differentiable, the error caused by the smoothing of the rupture velocity is taken into account as shown by the error bars in Figure 9. Therefore, the markers in the forbidden zone do not conclusively indicate that the rupture velocity is between them due to the uncertainty in the method used to calculate it.
Regardless of the uncertainty, the comparison between the cases with and without off-fault damage shows the effects of coseismic off-fault damage on the rupture velocity and on the supershear transition. The rupture transitions to supershear for both cases with , though the rate of increase in rupture velocity is lower for the case with off-fault damage. However, the supershear transition is suppressed due to the coseismic off-fault damage with .
Further discussion on the rupture dynamics with coseismic off-fault damage using an infinite planar fault model can be found in Okubo (2018) and Okubo et al. (2019). In this subsection, we summarized the modeling with this fault model as it is fundamental for the rupture modeling with first-order geometrical complexity demonstrated in the following section.
3.2 Rupture along a kink
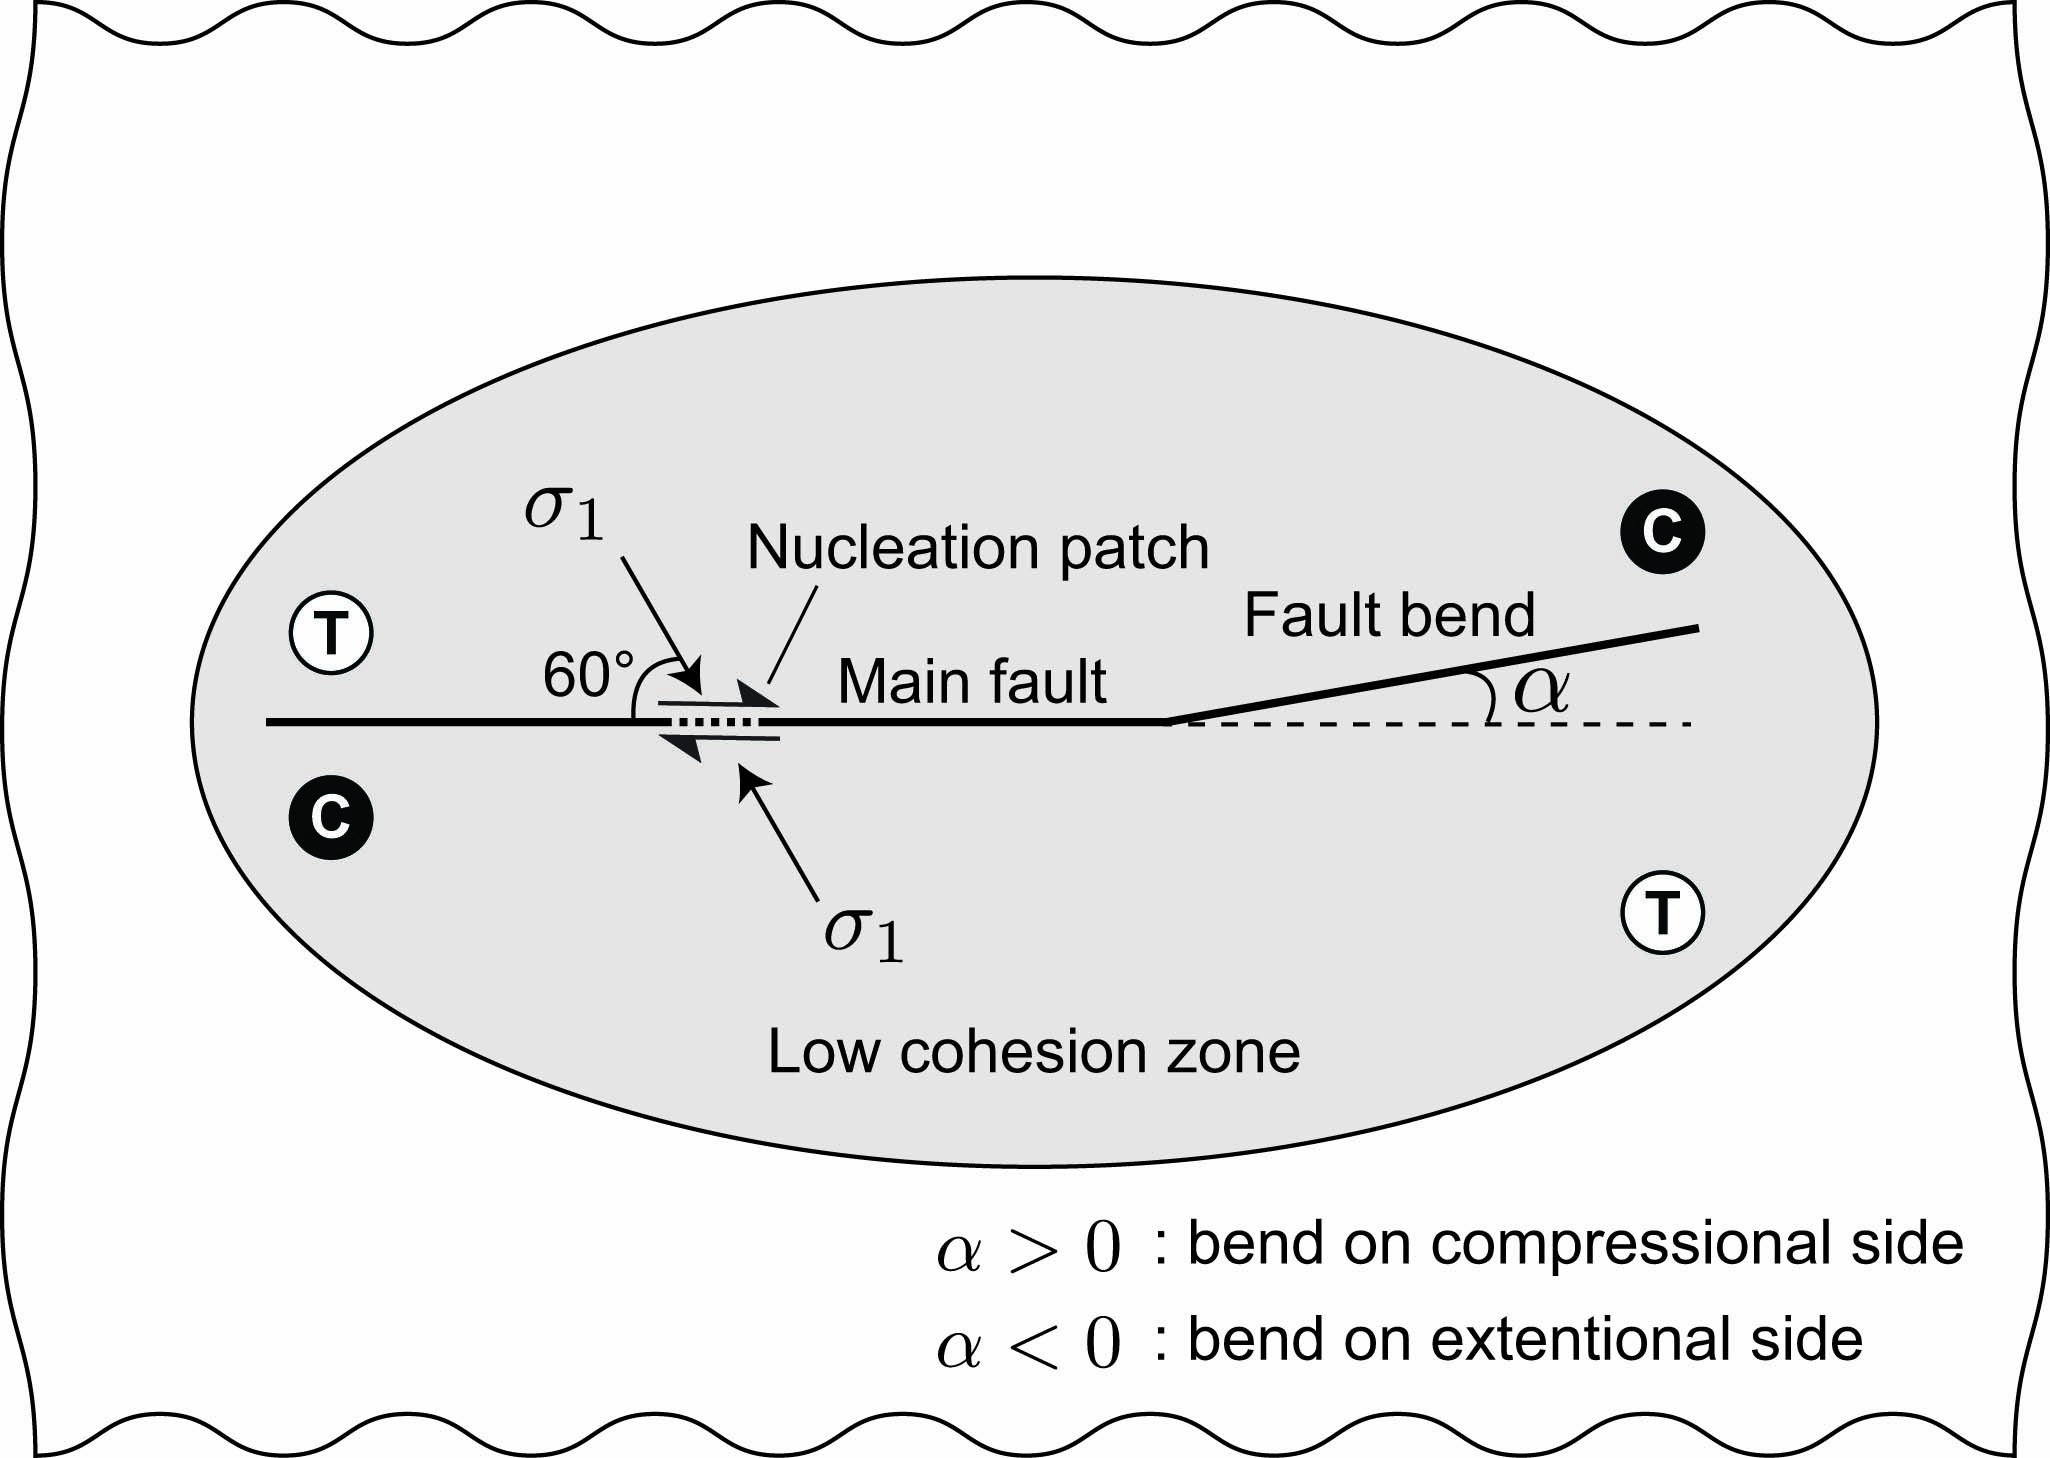
Next, we model dynamic earthquake rupture along a fault kink. Since the stress is locally concentrated due to the fault kink, the coseismic off-fault damage could be enhanced around the kink. We thus conducted dynamic earthquake rupture modeling with the fault kink, which bends towards either the compressional or extensional side of the fault.
| Valuables | Values | Descriptions |
|---|---|---|
| 75 GPa | Young’s modulus | |
| 30 GPa | Shear modulus | |
| 0.25 | Poisson’s ratio | |
| 2700 kg m-3 | Density | |
| 40 MPa | Normal stress on the main fault | |
| 16 MPa | Shear stress on the main fault | |
| 49 MPa | Maximum compressive principal stress | |
| 12 MPa | Minimum compressive principal stress | |
| 1.0 | S ratio | |
| 0.45 | Closeness to failure | |
| 60 ∘ | Orientation of | |
| 552 m | Quasi-static process zone size | |
| 1200 m | Nucleation length | |
| 55 m | Grid size on the main fault |
On the main fault
| 0.6 | Static friction coefficient | |
| 0.2 | Dynamic friction coefficient | |
| 0.25 m | Characteristic slip distance | |
| 2 MJ m-2 | Fracture energy for friction |
In the off-fault medium
| 0.6 | Static friction coefficient | |
| 0.2 | Dynamic friction coefficient | |
| 12.5 mm | Characteristic slip distance | |
| 8 KJ m-2 | Fracture energy for tensile cohesion | |
| 90 KJ m-2 | Fracture energy for shear cohesion and friction | |
| 8 MPa | Peak cohesion for opening crack in low cohesion zone | |
| 30 MPa | Peak cohesion for shear crack in low cohesion zone | |
| 2.0 mm | Critical displacement for softening of tensile cohesion | |
| 6.0 mm | Critical displacement for softening of shear cohesion |
Figure 10 shows the model setup for a fault kink. The model parameters and are listed in Tables 3 and 4. The angle of bend, , is an important parameter for the rupture propagation on the fault kink. When , the fault bends on the compressional side of the main fault. In this case, the ratio of shear traction to the normal traction, , decreases as increases. Thus the rupture is less likely to propagate along a fault bend with large . On the other hand, when , the fault bends on the extensional side of the main fault, where the is larger on the fault bend than on the main fault.
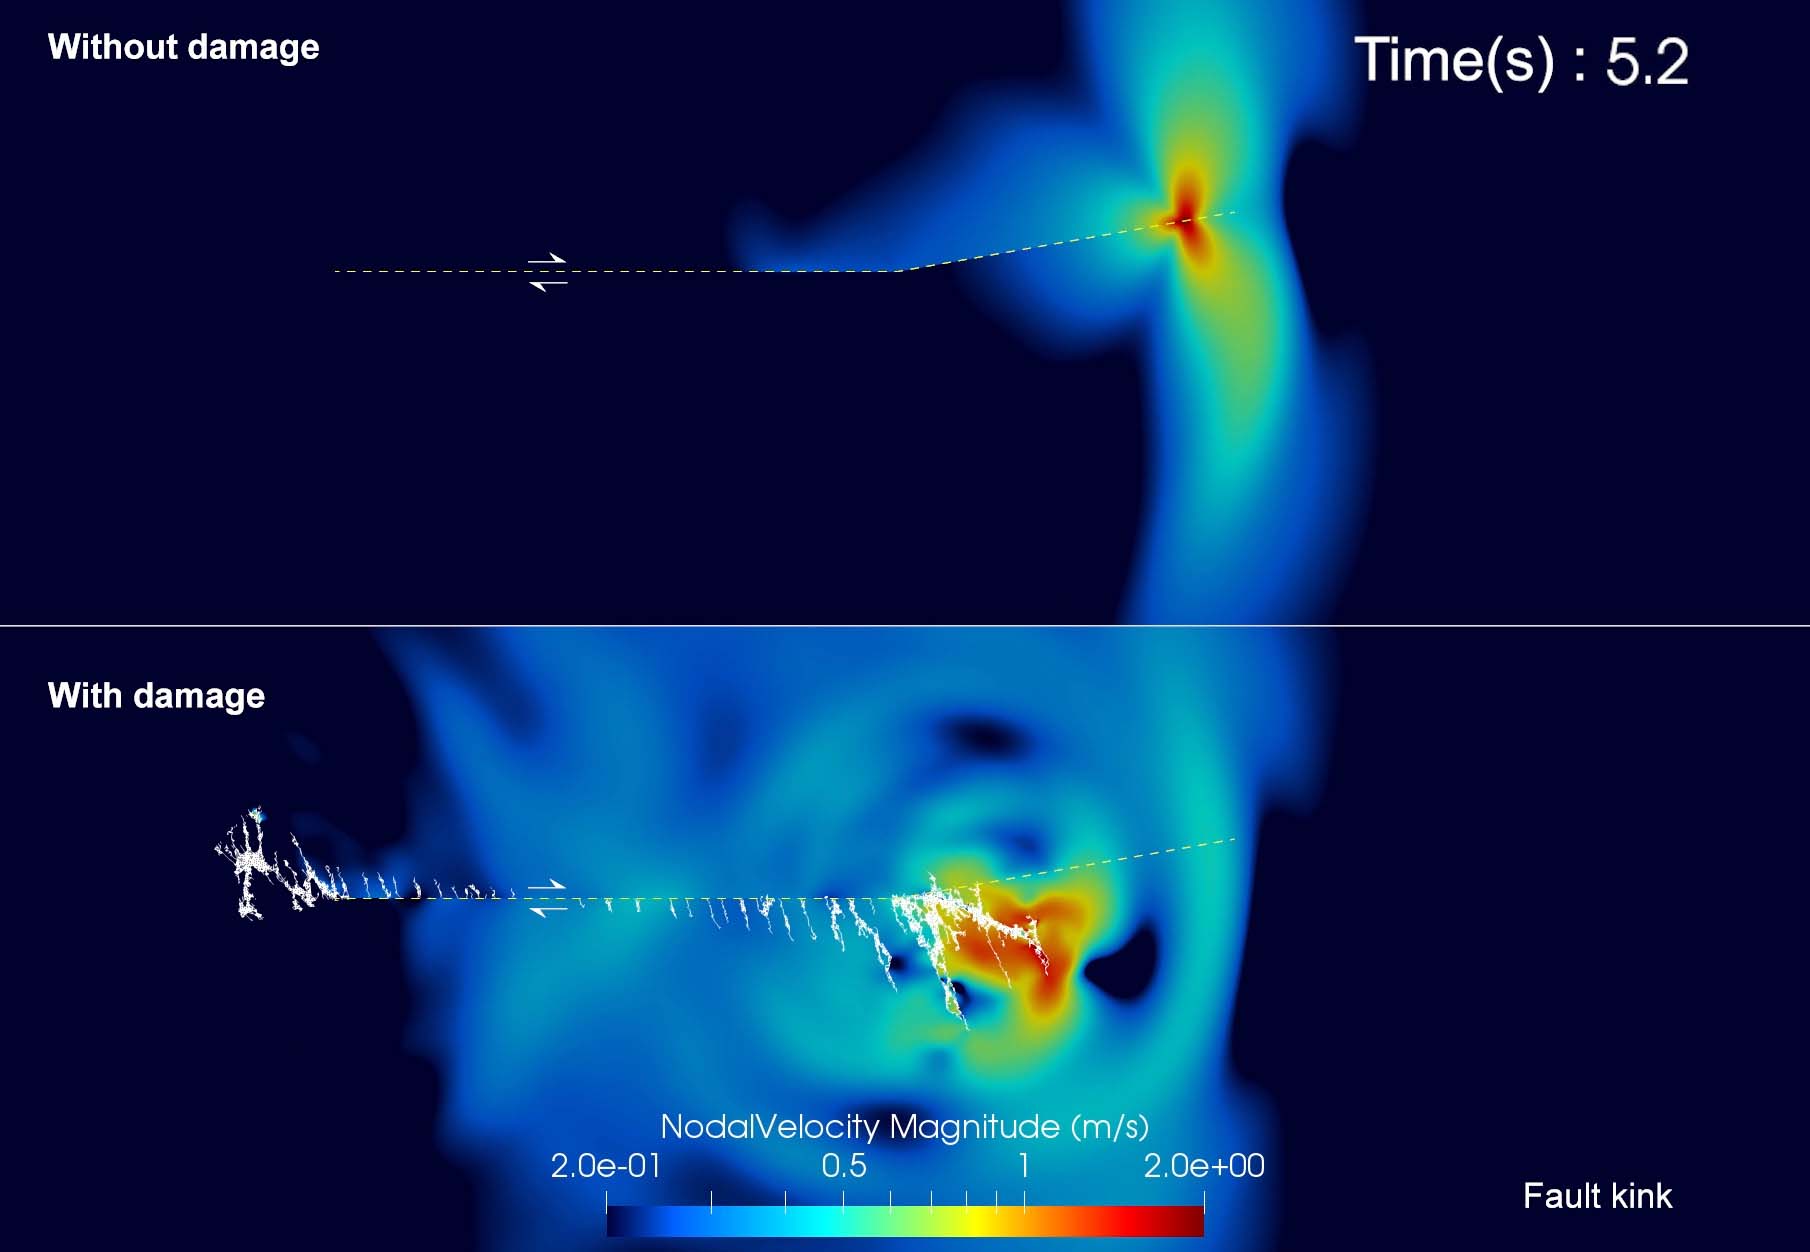
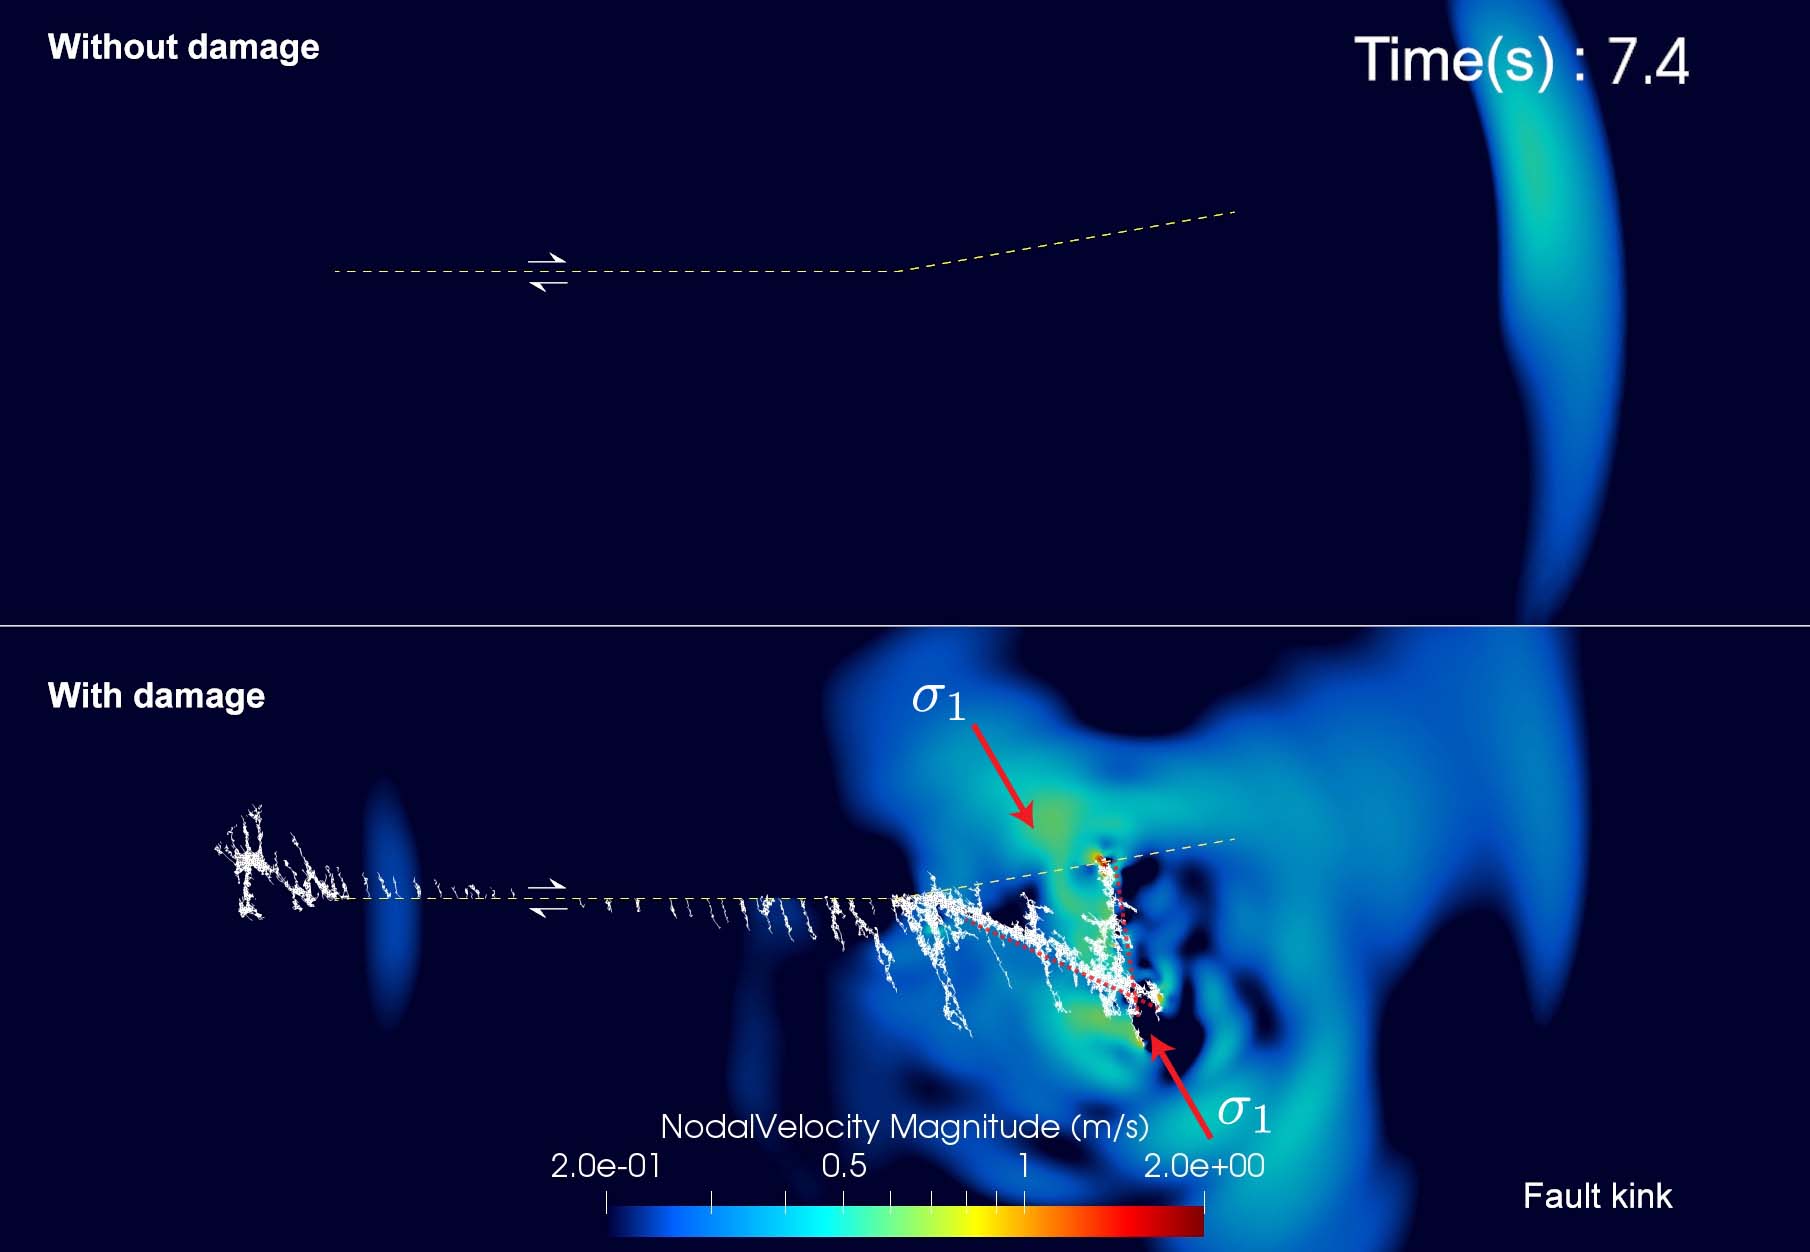
Here, we demonstrate the cases for with and without coseismic off-fault damage to investigate the rupture dynamics and the associated damage patterns (see Okubo (2018) for the case with ). Figures 11 and 12 show the results obtained for a fault kink bent on the compressional side of the main fault. In this case, the rupture is less likely to propagate along the fault bend due to the decrease in . Nevertheless, in the case without off-fault damage, the rupture propagates completely along the prescribed fault. This result is in accordance with Templeton et al. (2009). However, in the case with coseismic off-fault damage, the rupture is arrested at the kink, while a significant amount of damage is caused on the extensional side, resulting in the formation of a secondary fault branch. Eventually, two major fracture paths are generated; the orientation of these branches corresponding to the conjugate failure planes of (Figure 12). Therefore, we expect that secondary fault branches from kinks are naturally generated corresponding to the conjugate failure planes of the regional stress.
3.3 Rupture on a step-over fault system
The step-over faults are another important component of natural fault networks. What is of interest here is determining whether the rupture will jump from the main fault to the step-over fault near the main fault. Systematic numerical experiments of step-over faults, pioneered by Harris et al. (1991), demonstrated the geometrical conditions to nucleate the secondary rupture on the step-over fault. Parallel strike-slip faults are widely used as an example of simple step-over faults (Figure 13). The relative position of the fault with respect to the main fault is controlled by two parameters: width and overlap. The ability of the main rupture jumping onto the fault segments depends on whether the fault is located on the compressional side (compressional step) or the extensional side (dilational step) of the main fault. Harris et al. (1991) shows that the dilational step is more likely to induce a second rupture on the fault. Thus in this section, we demonstrate the dilation step, and compare the cases with and without off-fault damage to investigate the effects of coseismic off-fault damage on the rupture dynamics for the faults.
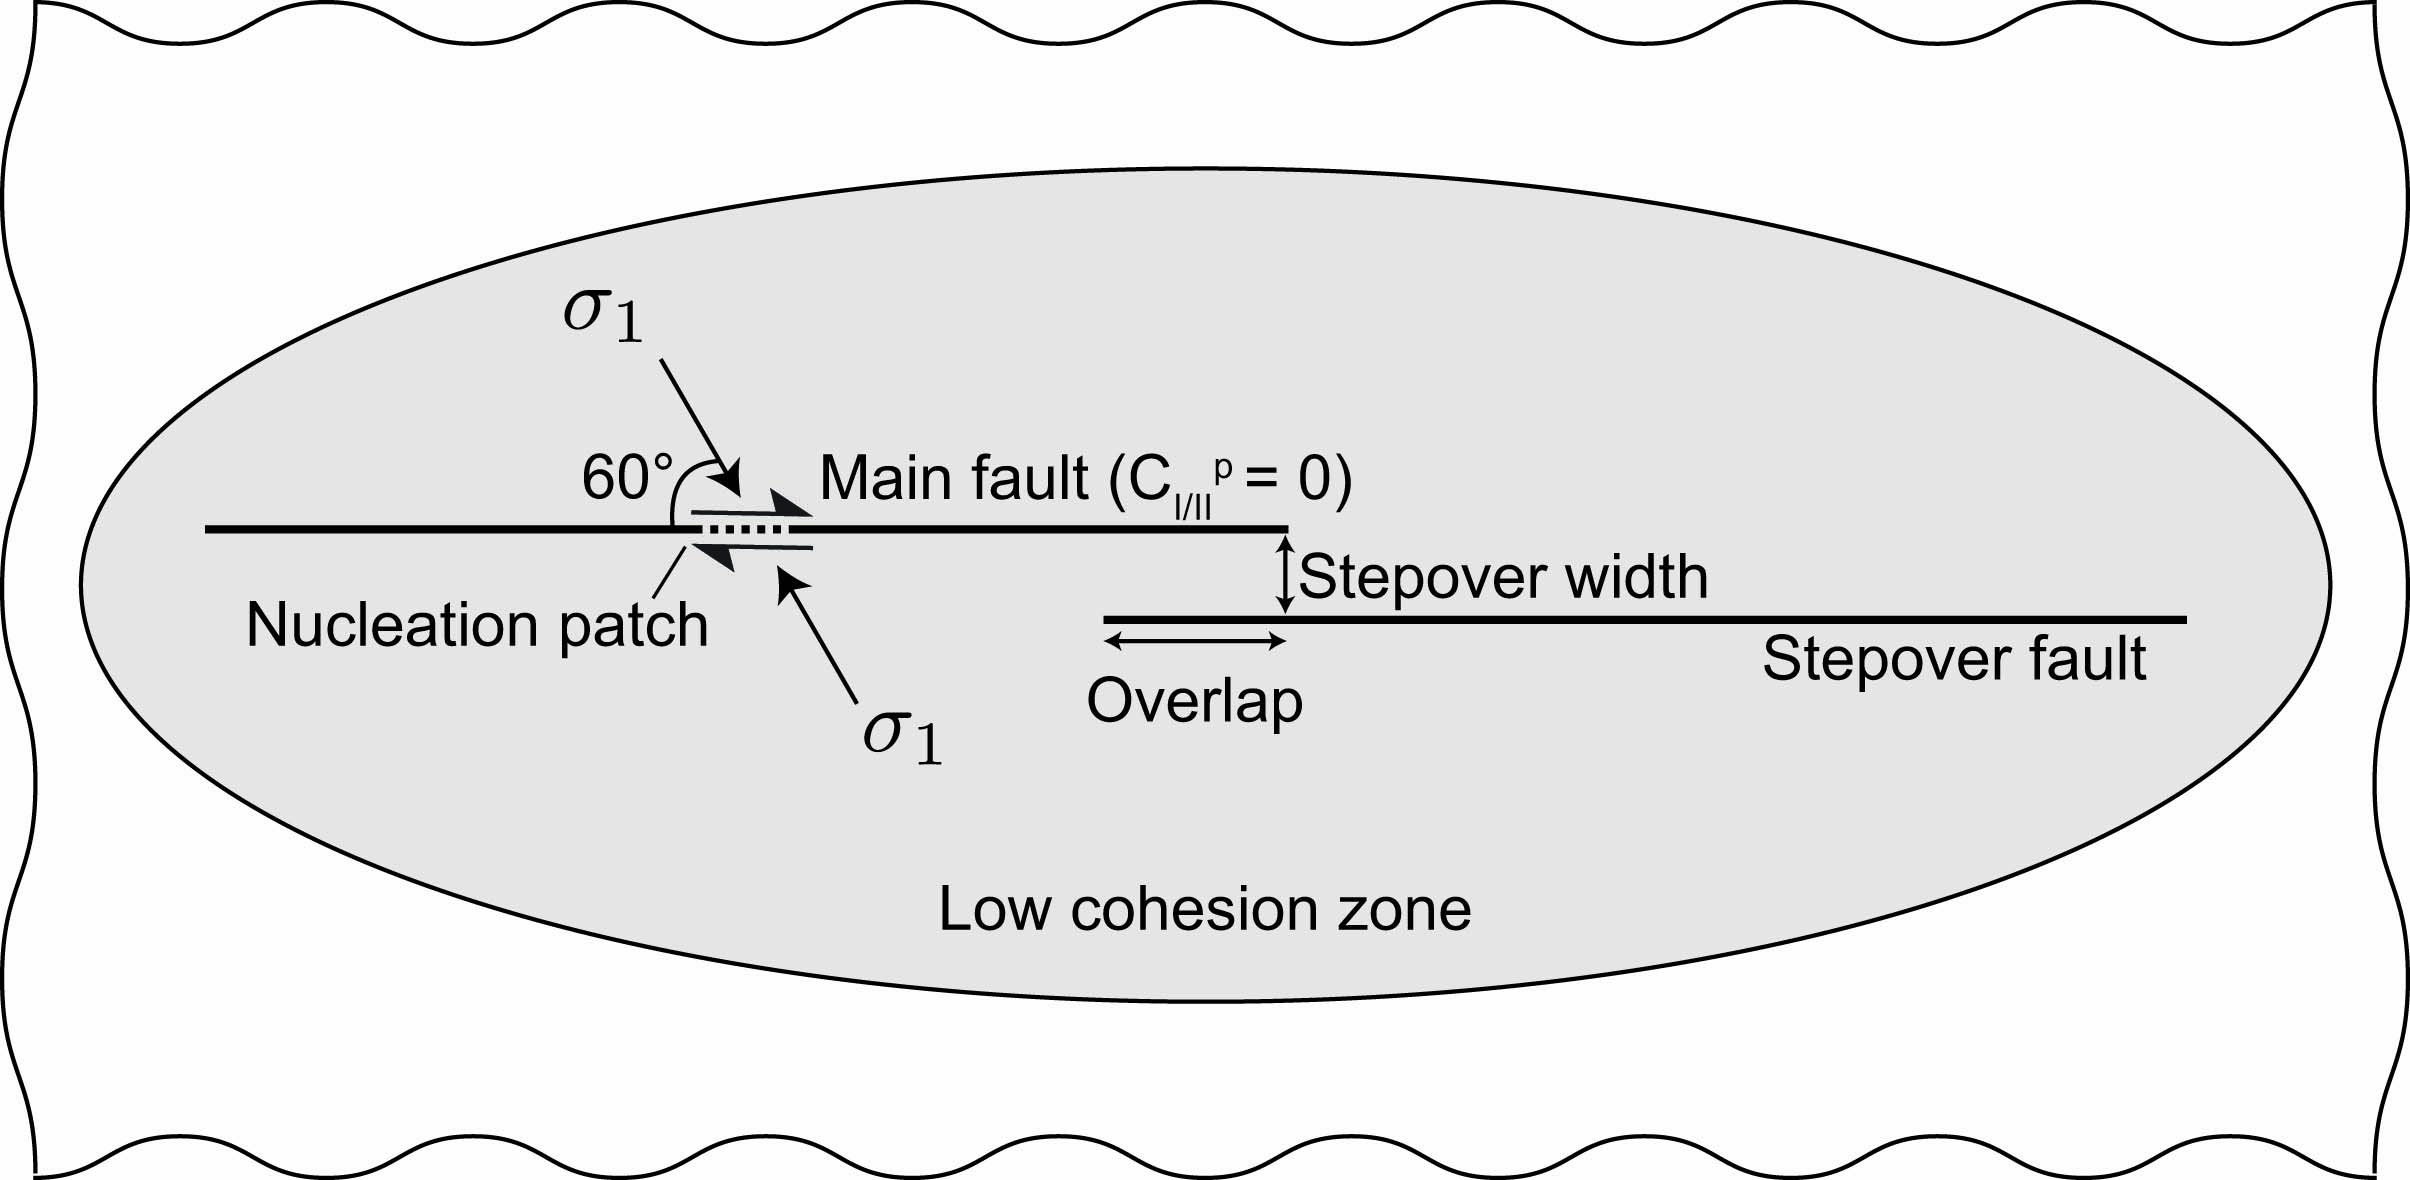
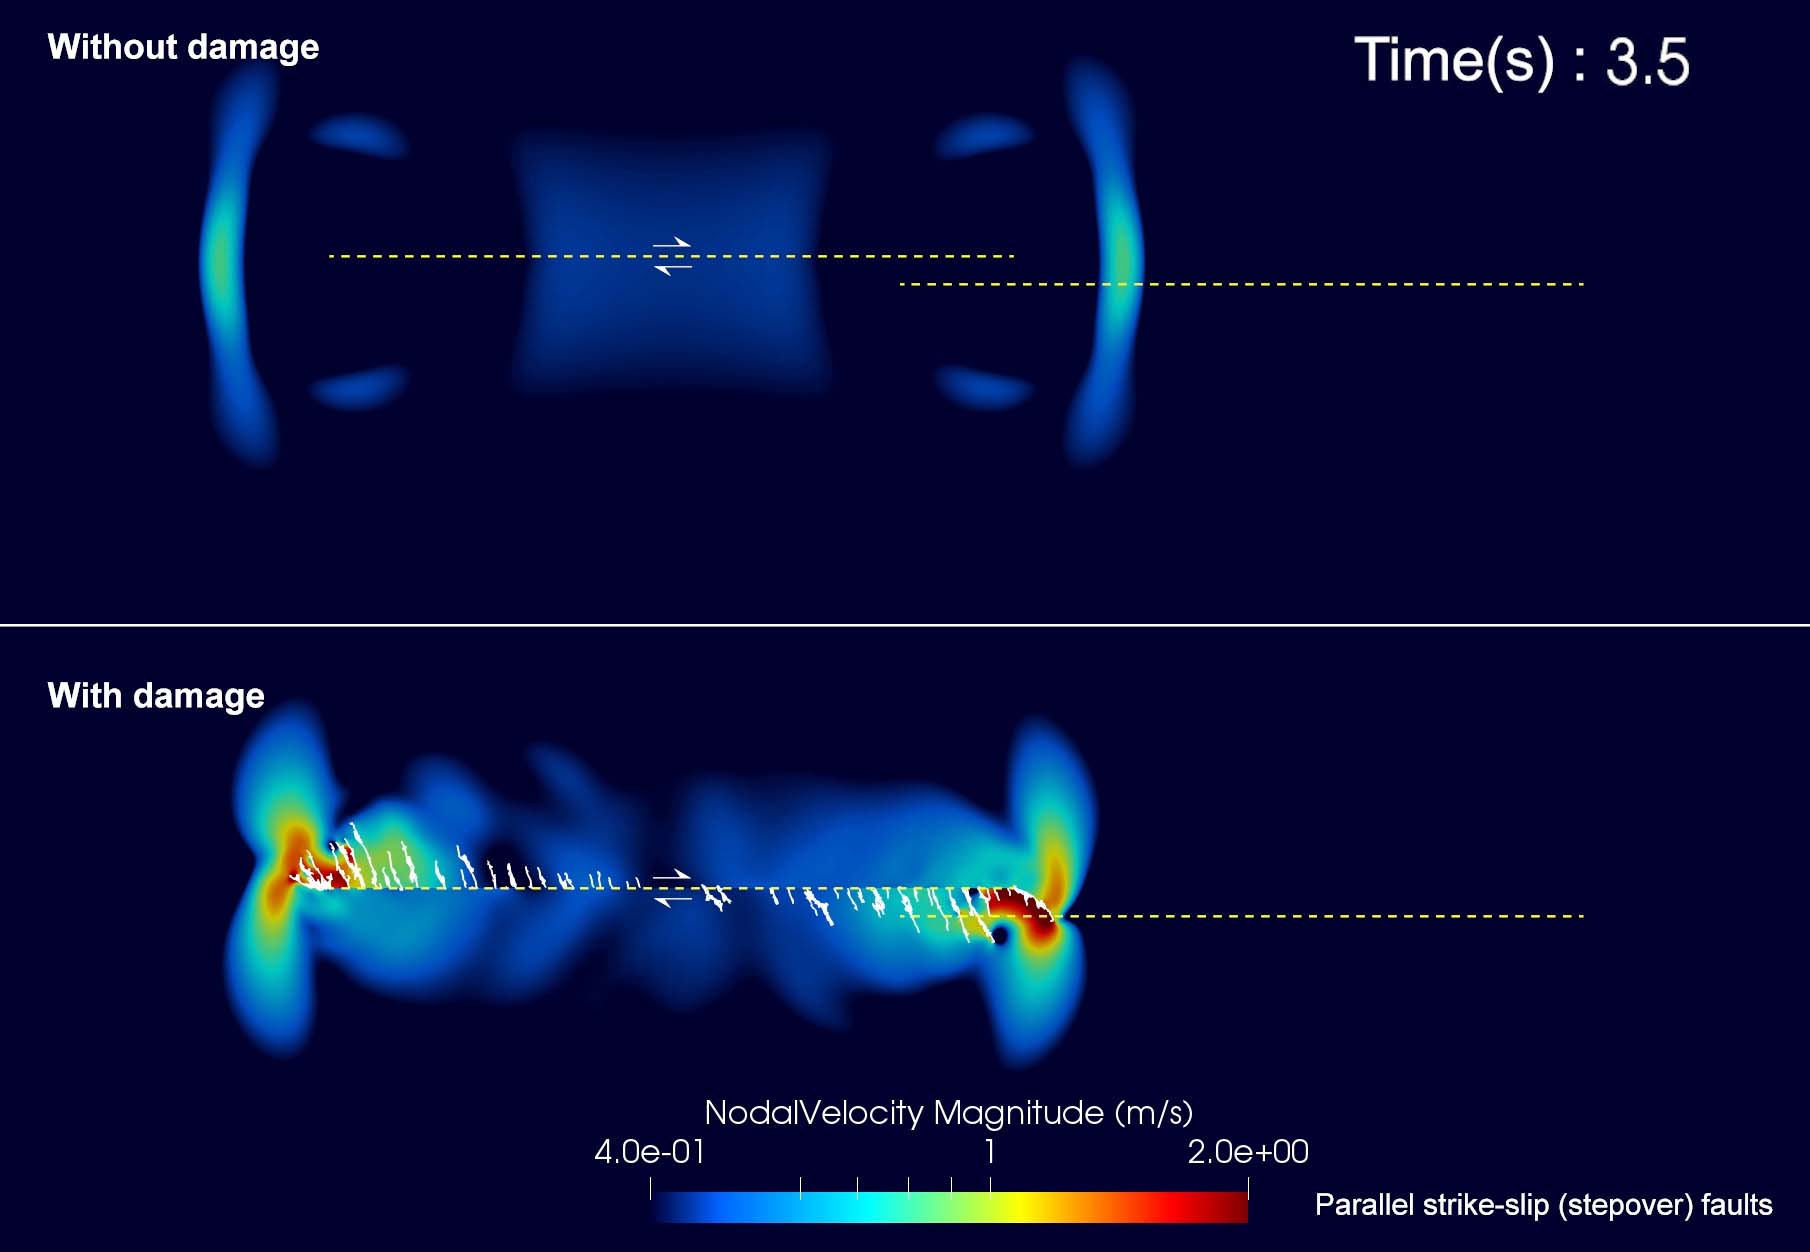
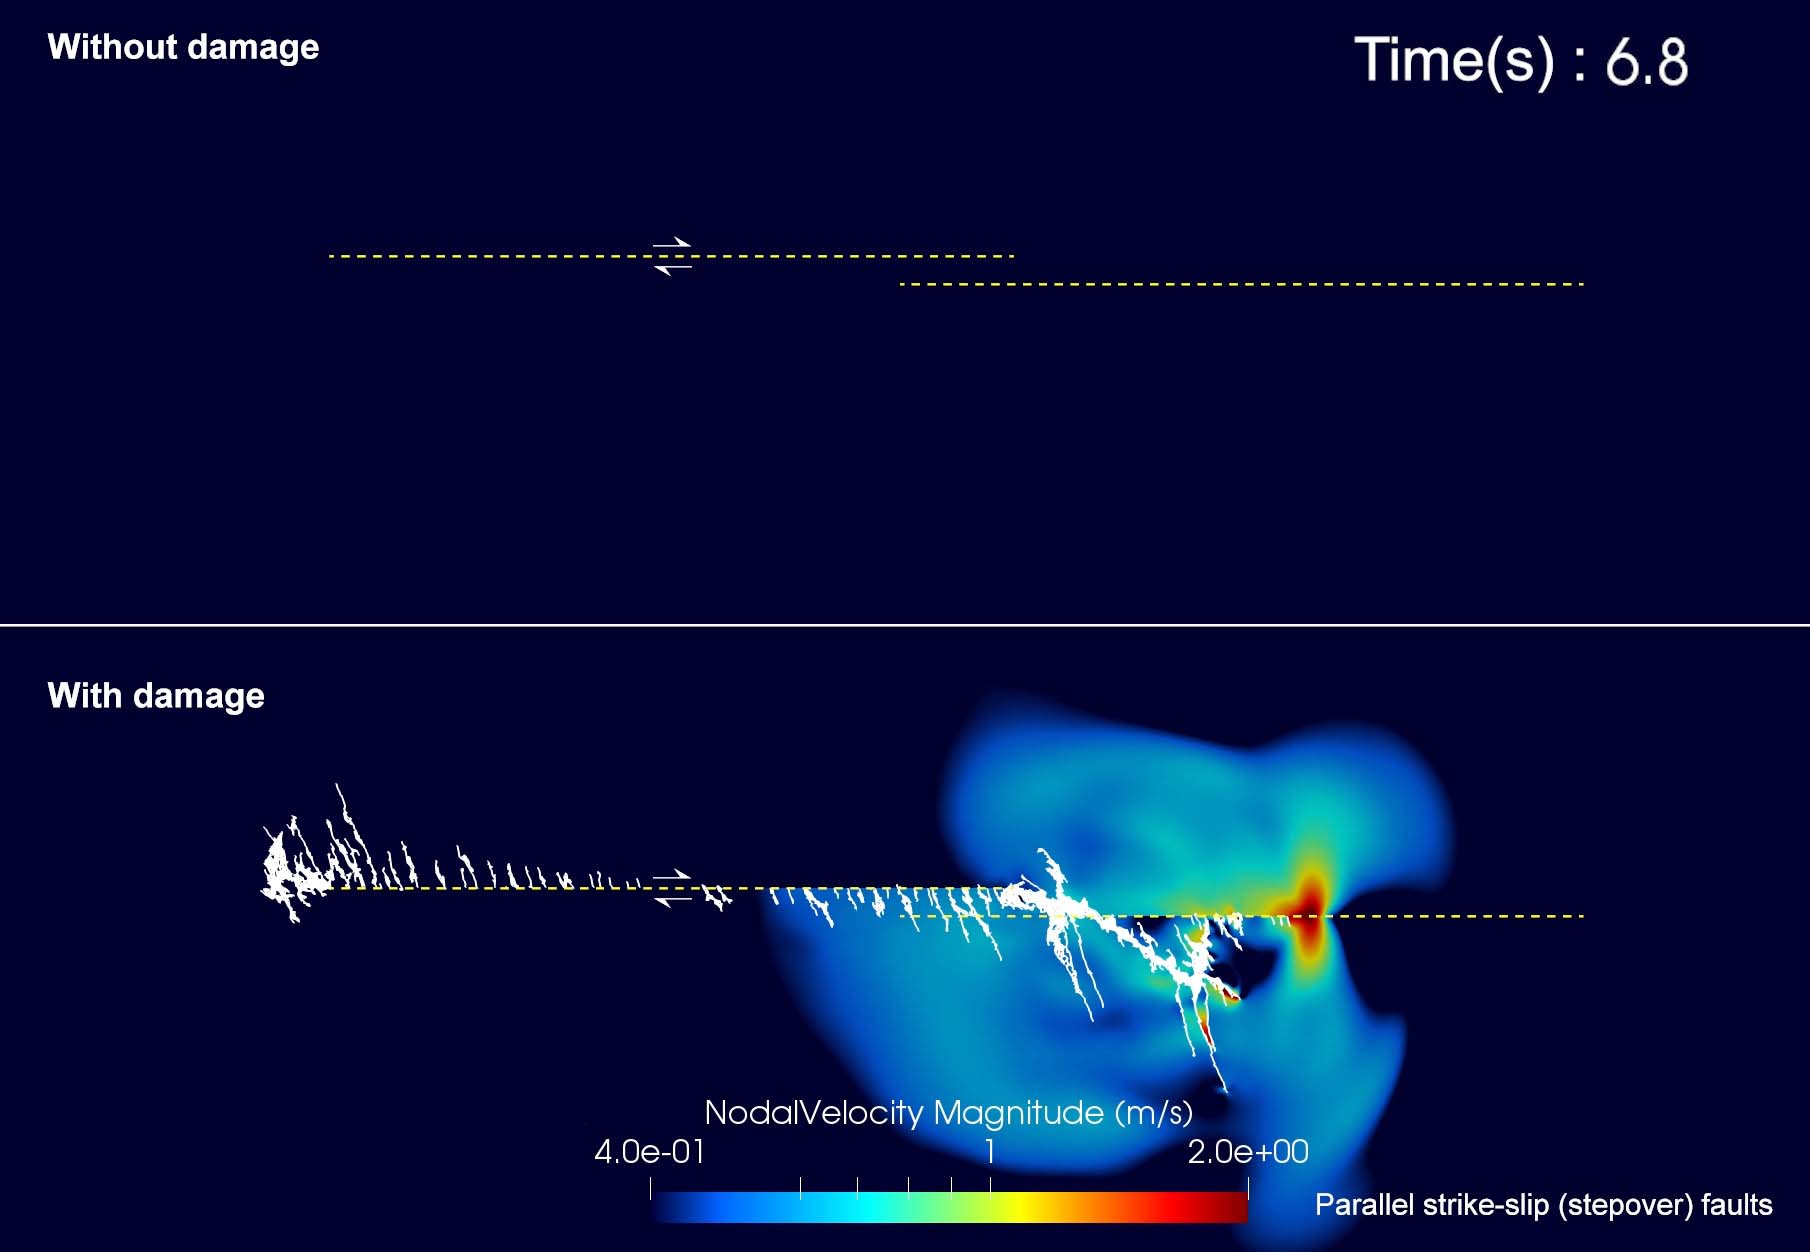
Figures 14 and 15 show two snapshots of the results obtained for a dilational step case both with and without coseismic off-fault damage. The rupture is nucleated in the middle of the main fault and propagates bilaterally. The is set as 600m ( 0.5), and the overlap is 2.5km ( 2.1). When the rupture reaches the edges of the main fault, the rupture is arrested for the case without coseismic off-fault damage, and does not induce a second rupture on the fault (Figure 14). However, when off-fault damage is considered major off-fault fracture paths evolve from the right edge of the main fault, which reach the fault. Then as the coseismic off-fault damage evolves around the edge of the main fault, the secondary rupture is nucleated close to the major damage zone on the fault (Figure 15). Since the secondary rupture is not nucleated for the case without coseismic off-fault damage, implying this combination of fault geometry and initial stress conditions is not favorable for ”rupture jumping”, we conclude that the coseismic off-fault damage around the fault can increase the probability of rupture jump onto the fault. These preliminary results for the faults demonstrate the need of parametric studies to rectify the conditions of rupture jumps with coseismic off-fault damage.
3.4 Rupture along a rough fault
In the previous sections, we only consider a combination of planar faults even though it has a kink, or step over faults. However, it is recognized that fault roughness also plays a crucial role in rupture dynamics, radiations and coseismic off-fault damage (e.g. Dunham et al., 2011). In this section, we demonstrate a preliminary result with a self-similar fault to investigate the rupture processes on the rough faults with coseismic off-fault damage. The self-similar fault geometry is reproduced based on Dunham et al. (2011). The self-similar fault profile has a spectral density, , as follows
| (23) |
where is the wave number and is a parameter to determine the magnitude of fluctuation of the fault.
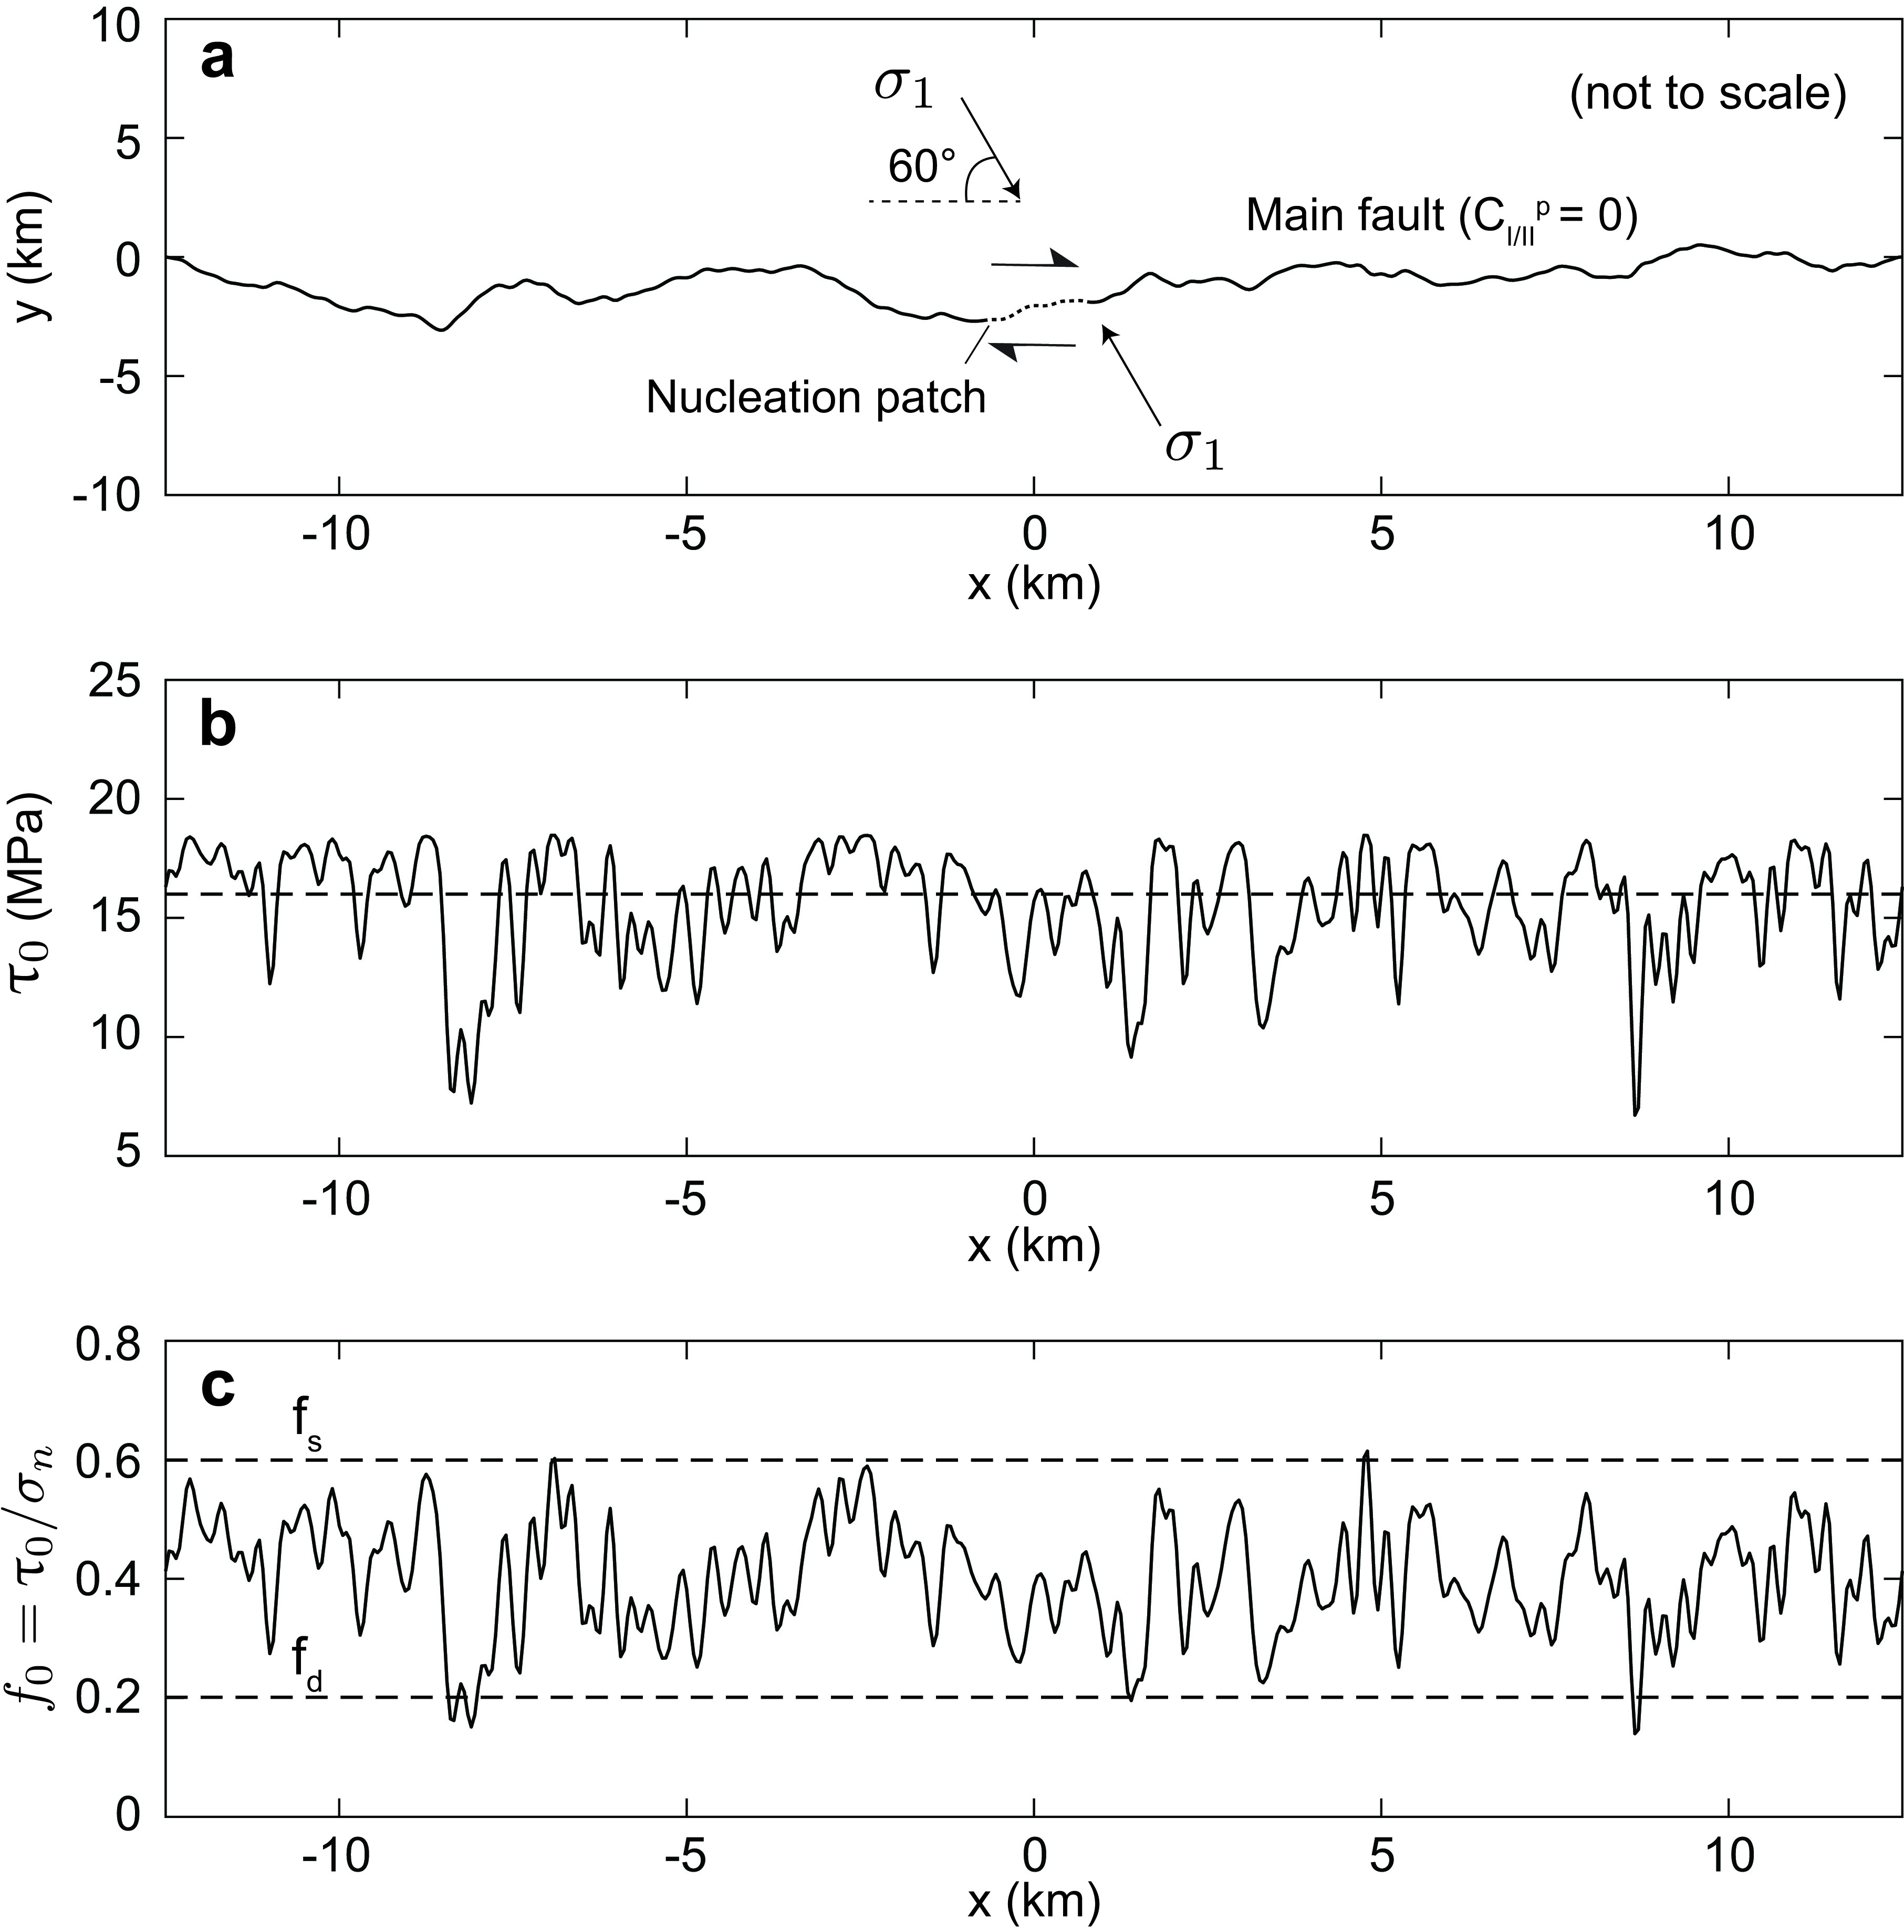
Figure 16 shows the self-similar fault geometry and the shear traction on the fault. is to 3.2 X 10⁻³. We chose the fault geometry so that the initial ratio of to , , is globally less than the static friction coefficient, to avoid unexpected rupture nucleation during the loading phase.
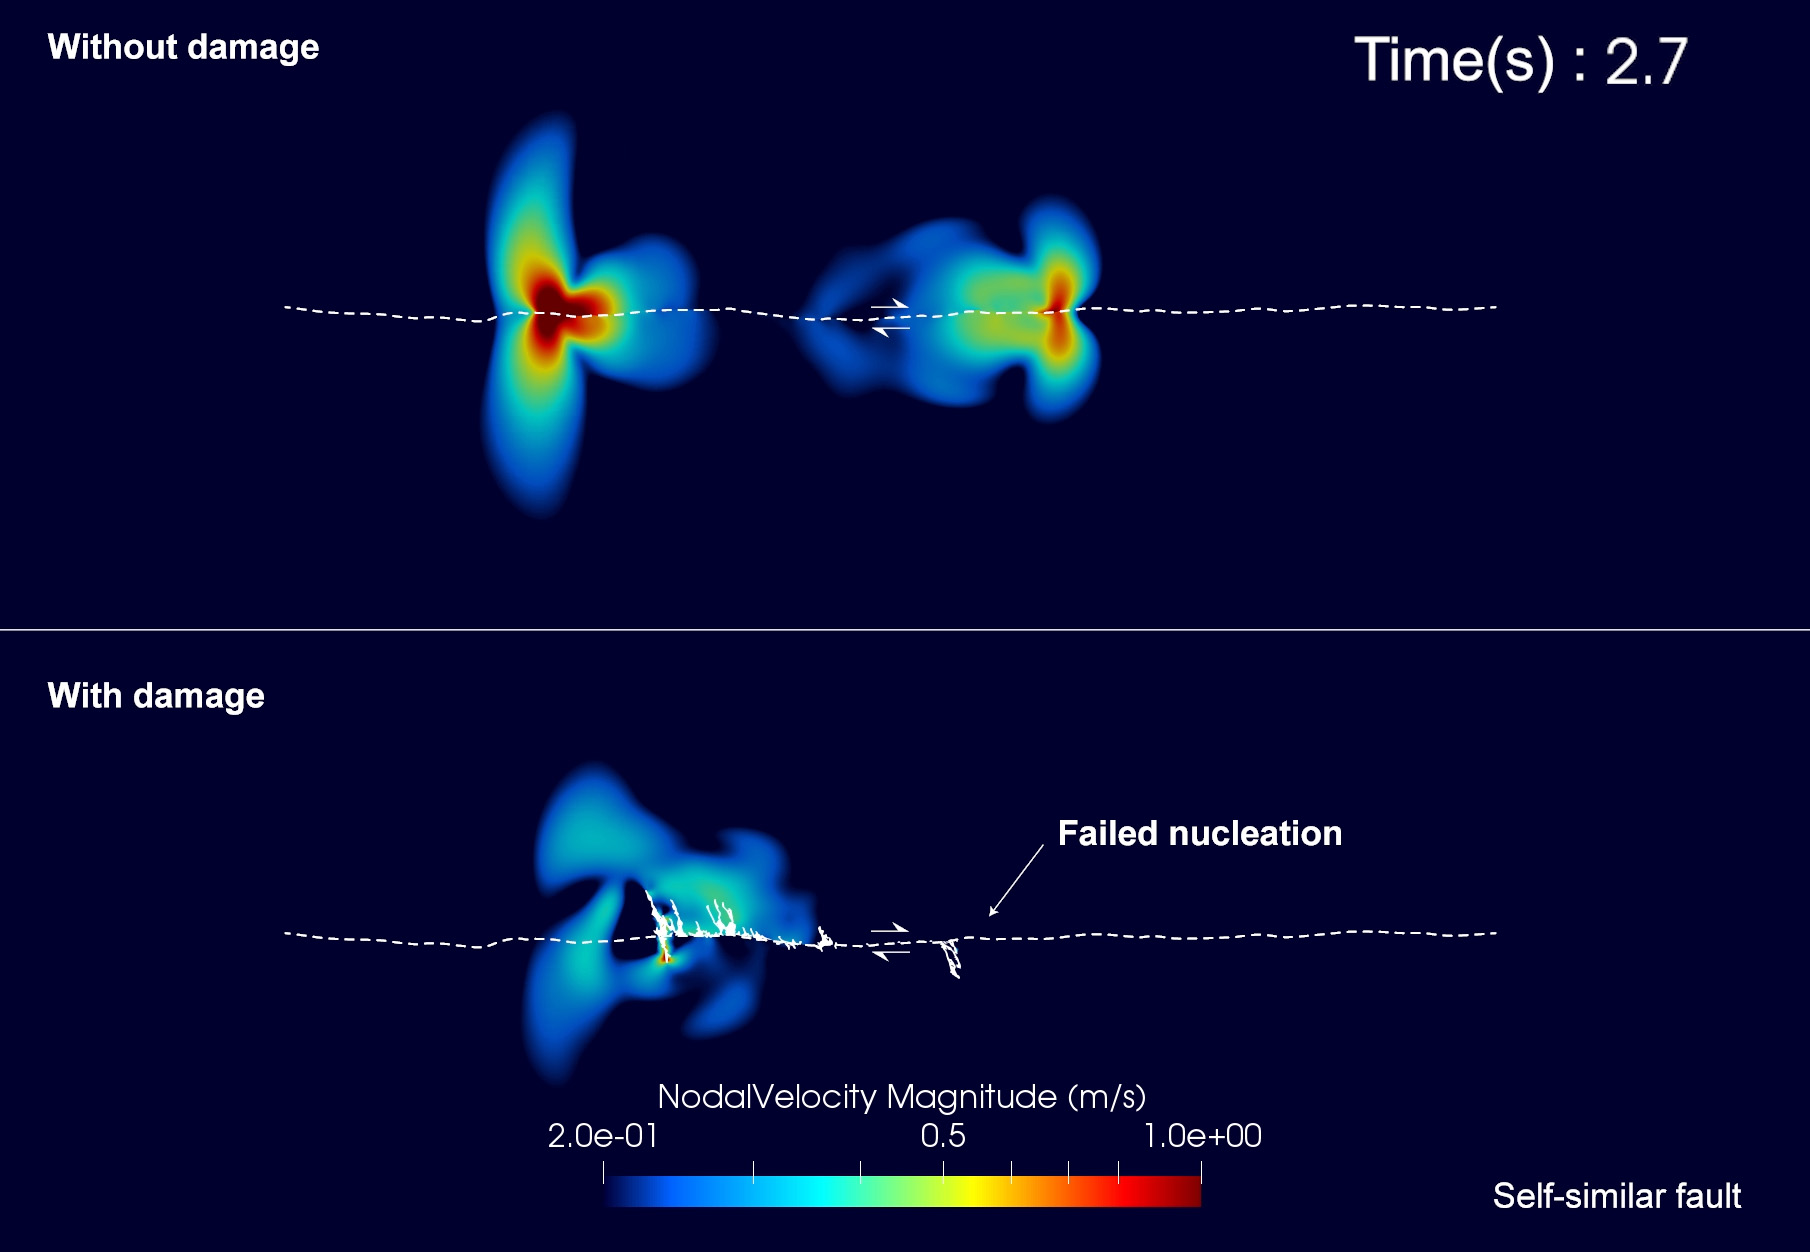
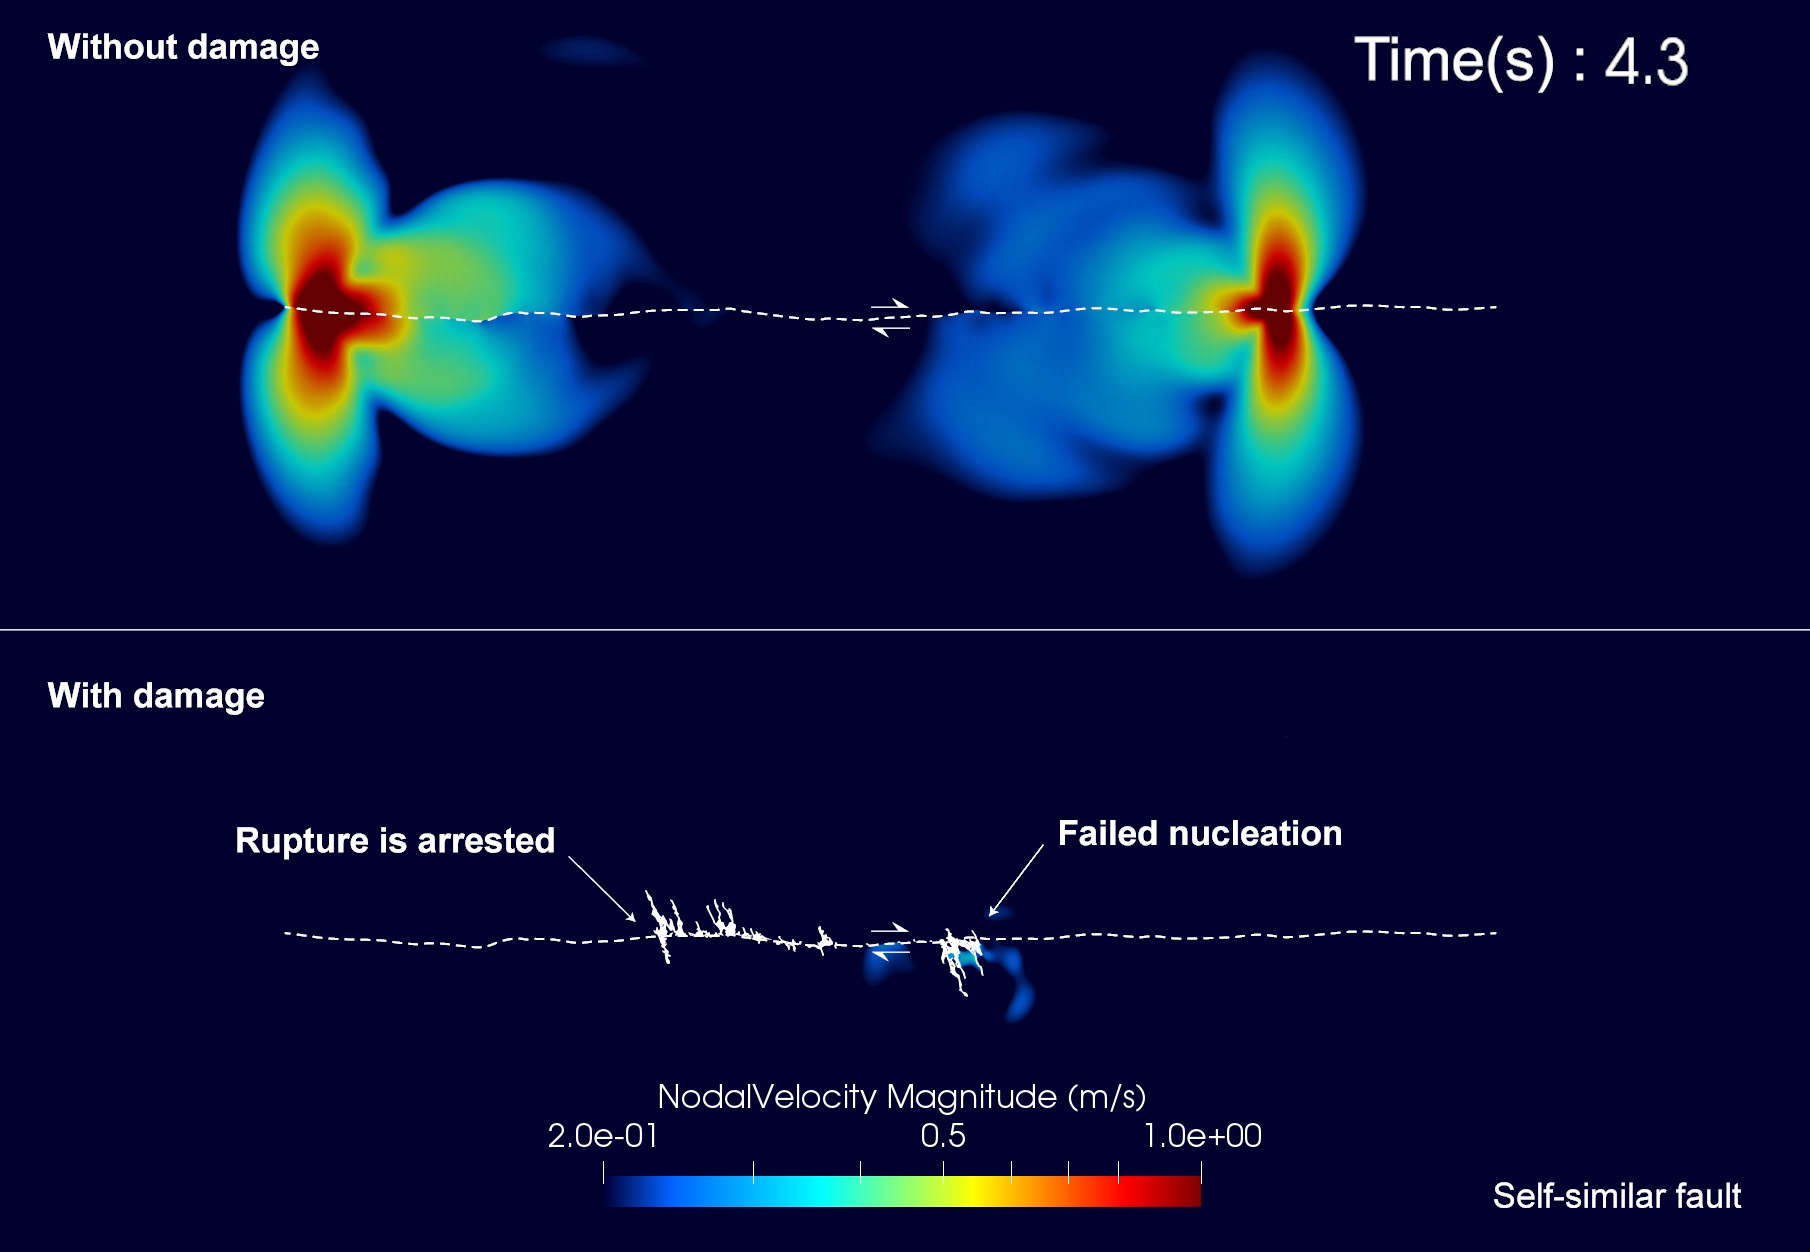
Figures 17 and 18 show snapshots for the cases with and without off-fault damage. In the case without off-fault damage, the rupture is nucleated and propagates bilaterally. However, in the case with off-fault damage, the rupture is not successfully nucleated on the right side of the nucleation patch (Figure 17) due to prominent cracking at the edges of nucleation patch. One of the reasons for the nucleation failure is the artificial manipulation of nucleation process, where low is assigned within the nucleation patch, which causes abrupt change of at the edges of nucleation patch and consequent stress concentrations. Thus the nucleation process needs to be reconsidered to nucleate rupture on the rough fault.
In addition, the rupture on the left side is also arrested by the coseismic off-fault cracks (Figure 18). Thus the main fault is not fully ruptured for the case with coseismic off-fault damage. Therefore, we conclude that the roughness tends to arrest the earthquake ruptures due to the coseismic off-fault damage. Further parametric studies are needed to investigate the condition of the arrest of ruptures and the associated off-fault damage patterns on the rough fault.
4 Conclusion
We demonstrated the continuum-discontiuum approach using FDEM, showing the capability of modeling dynamic earthquake rupture with the coseismic activation of localized off-fault fractures and its effect on the rupture dynamics. Although the number of parameters to define the constitutive law and the contact interactions increases in comparison to the canonical FEM, we can fairly constrain those parameters following a set of formulations presented in the section 2. The result shows the non-negligible effect of coseismic off-fault damage on the rupture dynamics such as the decrease in rupture velocity.
Each first-order complex fault geometry has a unique coseismic off-fault damage pattern, which would help elucidate the complicated earthquake rupture scenario on the real fault system. We need to further explore these fundamental fault system to address the following questions:
-
1.
What is the critical angle associated with fault kink, which decides whether the rupture propagates on the pre-existing fault or generates a dominant fracture path in the orientation of conjugate failure plane?
-
2.
How does the off-fault damage modify the criteria of rupture jump onto the step-over fault?
-
3.
How is the off-fault damage pattern and residual stress on the rough fault?
This paper demonstrates that FDEM is an appropriate numerical approach to conduct parametric studies on fault systems, such as those described above, in order to answer key standing questions in the earthquake rupture arena.
References
- Andrews (1976) Andrews DJ (1976) Rupture velocity of plane strain shear cracks. J Geophys Res 81(B32):5679–5689, DOI 10.1029/JB081i032p05679
- Andrews (1985) Andrews DJ (1985) Dynamic plane-strain shear rupture with a slip-weakening friction law calculated by a boundary integral method. Bull Seism Soc Am 75:1–21
- Andrews (2005) Andrews DJ (2005) Rupture dynamics with energy loss outside the slip zone. J Geophys Res 110:1307, DOI 10.1029/2004JB003191
- Aochi and Fukuyama (2002) Aochi H, Fukuyama E (2002) Three-dimensional nonplanar simulation of the 1992 landers earthquake. J Geophys Res 107(B2), DOI 10.1029/2000JB000061
- Chester et al. (1993) Chester FM, Evans JP, Biegel RL (1993) Internal structure and weakening mechanisms of the san andreas fault. J Geophys Res 98:771–786, DOI 10.1029/92JB01866
- Cho et al. (2003) Cho SH, Ogata Y, Kaneko K (2003) Strain-rate dependency of the dynamic tensile strength of rock. Int J Rock Mech Min Sci 40(5):763–777, DOI 10.1016/S1365-1609(03)00072-8
- De La Puente et al. (2009) De La Puente J, Ampuero JP, Käser M (2009) Dynamic rupture modeling on unstructured meshes using a discontinuous Galerkin method. J Geophys Res 114(B10):B10302, DOI 10.1029/2008JB006271
- Dunham et al. (2011) Dunham EM, Belanger D, Cong L, Kozdon JE (2011) Earthquake ruptures with strongly rate-weakening friction and off-fault plasticity, part 2: Nonplanar faults. Bull Seism Soc Am 101(5):2308–2322, DOI 10.1785/0120100076
- Euser et al. (2019) Euser B, Rougier E, Lei Z, Knight EE, Frash LP, Carey JW, Viswanathan H, Munjiza A (2019) Simulation of fracture coalescence in granite via the combined finite–discrete element method. Rock Mechanics and Rock Engineering 52(9):3213–3227, DOI 10.1007/s00603-019-01773-0
- Faulkner et al. (2011) Faulkner DR, Mitchell TM, Jensen E, Cembrano J (2011) Scaling of fault damage zones with displacement and the implications for fault growth processes. J Geophys Res 116(B05403), DOI 10.1029/2010JB007788
- Fletcher et al. (2014) Fletcher JM, Teran OJ, Rockwell TK, Oskin ME, Hudnut KW, Mueller KJ, Spelz RM, Akciz SO, Masana E, Faneros G, et al. (2014) Assembly of a large earthquake from a complex fault system: Surface rupture kinematics of the 4 April 2010 El Mayor–Cucapah (Mexico) Mw 7.2 earthquake. Geosphere 10(4):797–827, DOI 10.1130/GES00933.1
- Gao et al. (2019) Gao K, Rougier E, Guyer RA, Lei Z, Johnson PA (2019) Simulation of crack induced nonlinear elasticity using the combined finite-discrete element method. Ultrasonics 98:51 – 61, DOI https://doi.org/10.1016/j.ultras.2019.06.003
- Harris et al. (1991) Harris RA, Archuleta RJ, Day SM (1991) Fault steps and the dynamic rupture process: 2-D numerical simulations of a spontaneously propagating shear fracture. Geophys Res Lett 18(5):893–896, DOI 10.1029/91GL01061
- Ida (1972) Ida Y (1972) Cohesive force across tip of a longitudinal-shear crack and griffiths specific surface-energy. J Geophys Res 77:3796–3805, DOI JB077i020p03796
- Knight et al. (2015) Knight EE, Rougier E, Lei Z (2015) Hybrid optimization software suite (HOSS) – educational version LA-UR-15-27013. Tech. rep., Los Alamos National Laboratory
- Lachenbruch (1980) Lachenbruch AH (1980) Frictional heating, fluid pressure, and the resistance to fault motion. J Geophys Res 85(B11):6097–6112, DOI 10.1029/JB085iB11p06097
- Lei and Ke (2018) Lei Q, Ke G (2018) Correlation between fracture network properties and stress variability in geological media. Geophys Res Lett 45(9):3994–4006, DOI 10.1002/2018GL077548
- Lei et al. (2014) Lei Z, Rougier E, Knight E, Munjiza A (2014) A framework for grand scale parallelization of the combined finite discrete element method in 2d. Comp Part Mech 1(3):307–319, DOI 10.1007/s40571-014-0026-3
- Lei et al. (2019) Lei Z, Rougier E, Munjiza A, Viswanathan H, Knight EE (2019) Simulation of discrete cracks driven by nearly incompressible fluid via 2d combined finite-discrete element method. International Journal for Numerical and Analytical Methods in Geomechanics 43(9):1724–1743, DOI 10.1002/nag.2929
- Lisjak et al. (2014) Lisjak A, Grasselli G, Vietor T (2014) Continuum–discontinuum analysis of failure mechanisms around unsupported circular excavations in anisotropic clay shales. Int J Rock Mech Min Sci 65:96–115, DOI 10.1016/j.ijrmms.2013.10.006
- Mahabadi et al. (2014) Mahabadi O, Tatone B, Grasselli G (2014) Influence of microscale heterogeneity and microstructure on the tensile behavior of crystalline rocks. J Geophys Res 119(7):5324–5341, DOI 10.1002/2014JB011064
- Mitchell and Faulkner (2009) Mitchell TM, Faulkner DR (2009) The nature and origin of off-fault damage surrounding strike-slip fault zones with a wide range of displacements: a field study from the Atacama fault system, northern Chile. J Struct Geol 31(8):802–816, DOI 10.1016/j.jsg.2009.05.002
- Mitchell and Faulkner (2012) Mitchell TM, Faulkner DR (2012) Towards quantifying the matrix permeability of fault damage zones in low porosity rocks. Earth Planet Sc Lett 339–340:24–31, DOI 10.1016/j.epsl.2012.05.014
- Munjiza et al. (1995) Munjiza A, Owen D, Bicanic N (1995) A combined finite-discrete element method in transient dynamics of fracturing solids. Eng Computation 12(2):145–174, DOI 10.1108/02644409510799532
- Munjiza et al. (1999) Munjiza A, Andrews KRF, White JK (1999) Combined single and smeared crack model in combined finite-discrete element analysis. Int J Numer Meth Eng 44(1):41–57, DOI 10.1002/(SICI)1097-0207(19990110)44:1¡41::AID-NME487¿3.0.CO;2-A, URL http://dx.doi.org/10.1002/(SICI)1097-0207(19990110)44:1¡41::AID-NME487¿3.0.CO;2-A
- Munjiza et al. (2015) Munjiza A, Knight EE, Rougier E (2015) Large strain finite element method: a practical course. John Wiley & Sons
- Munjiza (2004) Munjiza AA (2004) The combined finite-discrete element method. John Wiley & Sons, DOI 10.1002/0470020180
- Munjiza et al. (2011) Munjiza AA, Knight EE, Rougier E (2011) Computational mechanics of discontinua. John Wiley & Sons, DOI 10.1002/9781119971160
- Okubo (2018) Okubo K (2018) Dynamic earthquake ruptures on multiscale fault and fracture networks. PhD thesis, Institut de Physique du Globe de Paris
- Okubo et al. (2019) Okubo K, Bhat HS, Rougier E, Marty S, Schubnel A, Lei Z, Knight EE, Klinger Y (2019) Dynamics, radiation and overall energy budget of earthquake rupture with coseismic off-fault damage. J Geophys Res 124, DOI 10. 1029/2019JB017304
- Palmer and Rice (1973) Palmer AC, Rice JR (1973) Growth of slip surfaces in progressive failure of over-consolidated clay. Proc R Soc Lond Ser-A 332:527–548, DOI 10.1098/rspa.1973.0040
- Passelègue et al. (2016) Passelègue FX, Schubnel A, Nielsen S, Bhat HS, Deldicque D, Madariaga R (2016) Dynamic rupture processes inferred from laboratory microearthquakes. J Geophys Res 121, DOI 10.1002/2015JB012694
- Poliakov et al. (2002) Poliakov ANB, Dmowska R, Rice JR (2002) Dynamic shear rupture interactions with fault bends and off-axis secondary faulting. J Geophys Res 107(B11), DOI 10.1029/2001JB000572
- Rice et al. (2005) Rice JR, Sammis CG, Parsons R (2005) Off-fault secondary failure induced by a dynamic slip pulse. Bull Seism Soc Am 95(1):109–134, DOI 10.1785/0120030166
- Rougier et al. (2011) Rougier E, Knight EE, Munjiza A, Sussman AJ, Broome ST, Swift RP, Bradley CR (2011) The combined finite-discrete element method applied to the study of rock fracturing behavior in 3D. In: 45th US Rock Mechanics/Geomechanics Symposium, American Rock Mechanics Association
- Rougier et al. (2014) Rougier E, Knight EE, Broome ST, Sussman AJ, Munjiza A (2014) Validation of a three-dimensional finite-discrete element method using experimental results of the split hopkinson pressure bar test. Int J Rock Mech Min Sci 70:101–108, DOI 10.1016/j.ijrmms.2014.03.011
- Shipton and Cowie (2001) Shipton ZK, Cowie PA (2001) Damage zone and slip-surface evolution over m to km scales in high-porosity navajo sandstone, utah. J Struct Geol 23(12):1825–1844, DOI 10.1016/S0191-8141(01)00035-9
- Sibson (1977) Sibson RH (1977) Fault rocks and fault mechanisms. J Geol Soc (London, UK) 133(3):191–213, DOI 10.1144/gsjgs.133.3.0191
- Sowers et al. (1994) Sowers JM, Unruh JR, Lettis WR, Rubin TD (1994) Relationship of the Kickapoo fault to the Johnson Valley and Homestead Valley faults, San Bernardino county, California. Bull Seism Soc Am 84(3):528–536
- Templeton and Rice (2008) Templeton EL, Rice JR (2008) Off-fault plasticity and earthquake rupture dynamics: 1. dry materials or neglect of fluid pressure changes. J Geophys Res 113(B09306), DOI 10.1029/2007JB005529
- Templeton et al. (2009) Templeton EL, Baudet A, Bhat HS, Dmowska R, Rice JR, Rosakis AJ, Rousseau CE (2009) Finite element simulations of dynamic shear rupture experiments and dynamic path selection along kinked and branched faults. J Geophys Res B08304, DOI 10.1029/2008JB006174
- Thomas and Bhat (2018) Thomas MY, Bhat HS (2018) Dynamic evolution of off-fault medium during an earthquake: a micromechanics based model. Geophys J Int 214(2):1267–1280, DOI 10.1093/gji/ggy129
- Viesca and Garagash (2015) Viesca RC, Garagash DI (2015) Ubiquitous weakening of faults due to thermal pressurization. Nature Geosci 8(11):875–879, DOI 10.1038/ngeo2554
- Viesca et al. (2008) Viesca RC, Templeton EL, Rice JR (2008) Off-fault plasticity and earthquake rupture dynamics: 2. case of saturated off-fault materials. J Geophys Res 113(B09307), DOI 10.1029/2007JB005530
- Xia et al. (2004) Xia KW, Rosakis AJ, Kanamori H (2004) Laboratory earthquakes: The sub-rayleigh-to-supershear rupture transition. Science 303:1859–1861, DOI 10.1007/s10704-006-0030-6
- Xu et al. (2012) Xu S, Ben-Zion Y, Ampuero JP (2012) Properties of inelastic yielding zones generated by in-plane dynamic ruptures—I. Model description and basic results. Geophys J Int 191(3):1325–1342, DOI 10.1111/j.1365-246X.2012.05679.x
- Zhao et al. (2014) Zhao Q, Lisjak A, Mahabadi O, Liu Q, Grasselli G (2014) Numerical simulation of hydraulic fracturing and associated microseismicity using finite-discrete element method. J Rock Mech Geotech Eng 6(6):574–581, DOI 10.1016/j.jrmge.2014.10.003