Jianhong Chen et al
Jinchao Xu, Department of Mathematics, Pennsylvania State University, University Park, Pennsylvania, USA.
A machine learning method correlating pulse pressure wave data with pregnancy
Abstract
[Abstract] Pulse feeling (中医把脉), representing the tactile arterial palpation of the heartbeat, has been widely used in traditional Chinese medicine (TCM) to diagnose various diseases. The quantitative relationship between the pulse wave and health conditions however has not been investigated in modern medicine. In this paper, we explored the correlation between pulse pressure wave (PPW), rather than the pulse key features in TCM, and pregnancy by using deep learning technology. This computational approach shows that the accuracy of pregnancy detection by the PPW is 84% with an AUC of 91%. Our study is a proof of concept of pulse diagnosis and will also motivate further sophisticated investigations on pulse waves.
keywords:
Pulse diagnosis, pulse pressure wave, pregnancy, deep learning, conventional neural network1 Introduction
Pulse-feeling, obtained by putting the doctor’s fingers on a patient’s wrist pulse (see Fig. 1), has been widely used in Traditional Chinese Medicine (TCM) for thousands of years 1, 2. It has long been claimed that the pulse feeling can be used to detect various health conditions such as kidney failure 3, liver fibrosis 4, cardiovascular disease 5, and pregnancy 6. Every TCM doctor is required to master pulse-feeling, which is a very basic technique, but it is hard to teach and learn. The teaching and learning process often takes years, or even a lifetime since the pulse-feeling varies for different health conditions and patients. The exact mechanism used in the pulse-feeling is highly complex and there have been many types of descriptions and theories in Chinese medical literature, but many of such theories are often be more subjective than objective. One such theory is to characterize a pulse-feeling through three key features 7: length, depth, and pattern. The length is related to the strength and balance of the blood and energy flow, the depth reflects certain types of pathological condition, and the pattern refers to different phases or features of a pulse-feeling (it is usually believed that there are 28 different pulse patterns 8, such as the so-called choppy and slippery pulses).
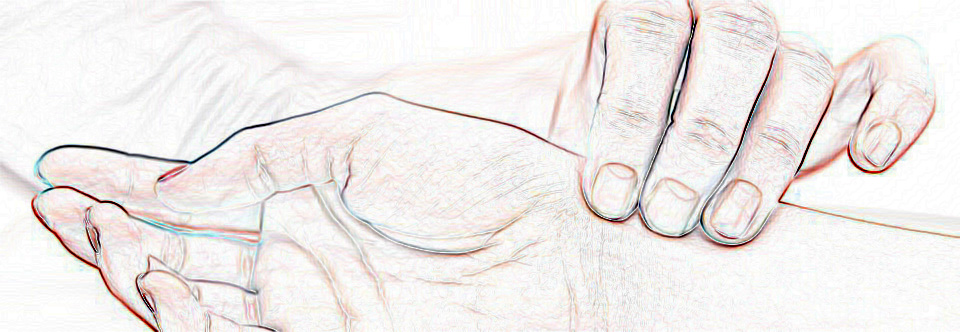
Naturally it is a subject of research and practical interest if the pulse-feeling technique can be studied and understood through a scientific manner. One can imagine this is an extremely challenging task due to the “subjective" aspect of the pulse-feeling process. There are many different approaches in these studies. One such approach is to analyze the aforementioned three key features of pulse-feeling 7, 8, 9 via various computational methods, e.g., artificial neural network (ANN) developed in recent years. By using certain physical parameters of arterial pressure waveform acquired from six locations (left and right cun, guan, and chi) as inputs, an ANN with one hidden layer of width has been employed 7 for a regression study of features of pulse-feeling. The number of data used in the study was and the value of , a standard parameter measuring model performance, for their ANN model was . Another similar ANN with a hidden layer of width has also been developed 8 to classify normotension versus hypertension. This study was based on certain pulse assessment, namely, the intensity of features of pulse-feeling measured by TCM experts, on a dataset with normotension and hypertension. Although the accuracy was , the conclusion in this study was more subjective than objective because features of pulse-feeling highly rely on the doctor’s experience. Thus, the conclusions reached by this approach may vary among different doctors and may even vary when given by the same doctor who examines the same patient but at a different time or in a different environment.
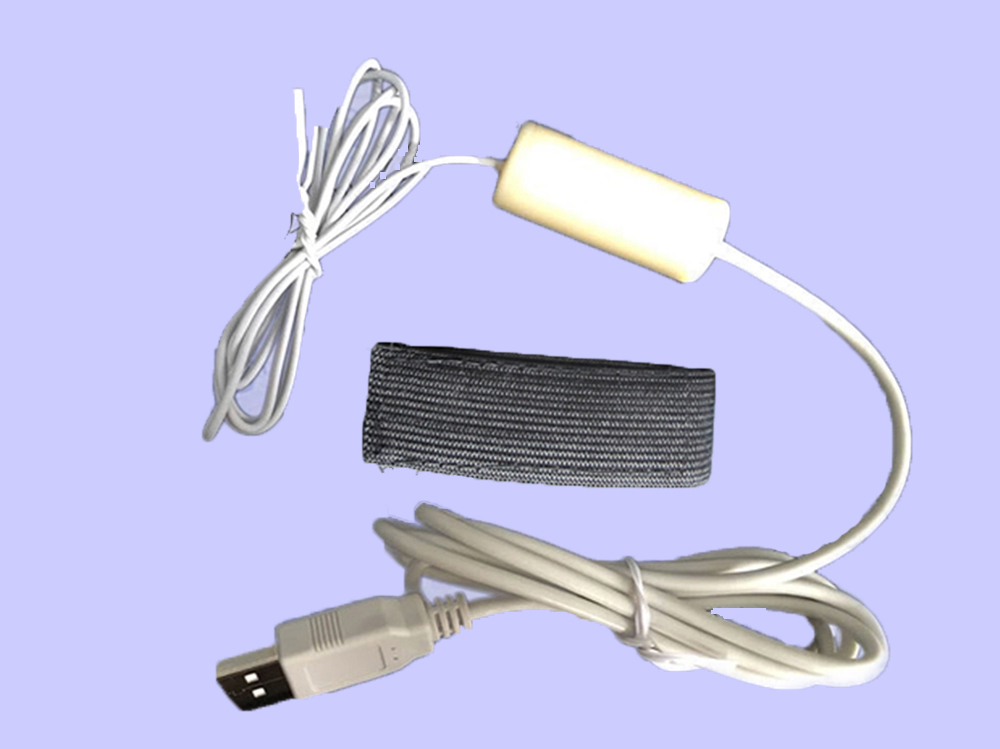
Another approach is to use an appropriate medical device to collect pulse signals and then quantitatively interpret these signals for the health diagnosis. One such device that has been used by researchers is the pulse pressure sensor as shown in Fig. 1 (right). By placing this type of sensor on a patient’s wrist pulse, pulse pressure waves (PPW), as shown in Fig. 2 (left), can be collected. A PPW reflects pressure changes in the wrist blood vessel and is believed to contain certain information that a TCM doctor uses in pulse-feeling diagnosis. Then a quantitative study can be carried out by analyzing these PPWs. For example, by using PPW as the input, a 12-pulse-pattern classification (such as stringy, slippery, etc) was conducted with a 9-layer 1D convolutional neural network (CNN) (with around 2,280 variables). On 200 training and 261 test samples, they obtained a 93.49% accuracy 21. Moreover, a 9-layer 1D CNN was used to further study the correlation between PPW and arteriosclerosis. 60% of the data was used as training data and 40% was used as test data from a dataset with 47 participants (35 arteriosclerosis and 12 non-arteriosclerosis) and obtained a 96.33% accuracy rate on classifying the arteriosclerosis versus non-arteriosclerosis 20. The relationship between important features of the arterial pulse wave (peak, length, etc) and pregnancy has also been studied through using a 4-hidden layer probabilistic neural network (the nodes for each layer are 22, 44, 2, and 1) 22. By using 110 samples of training data (45 pregnant and 65 non-pregnant), the neural network reached 100% accuracy on a test dataset with 20 samples (4 pregnant and 16 non-pregnant). It is interesting to note that all these studies were based on small datasets (around 200 samples), although the number of variables was relatively large (around 2,000). Moreover, the training/test datasets were imbalanced (i.e., pregnant/non-pregnant ratio is 2/3 in the training data but is 1/4 in the test data 22), and there was a lack of cross-validation, which is important for a generalizable computational model.
Other techniques related to PPW are also commonly used in modern medical practices. The most directly related technique is the pulse wave velocity (PWV) that has been used as an index of arterial stiffness 10 and a biomarker of cardiovascular risk 11 and even other diseases 12. Another relevant technique is based on photoplethysmogram (PPG), which is an optically obtained plethysmogram that can be used to detect blood volume changes in a microvascular bed of tissue. A PPG signal, as shown in Fig. 2 (right), is similar to a PPW signal as shown in the left panel of Fig 2. PPG has been widely used in modern clinical practice as a non-invasive diagnostic technique 14, 15 and also for monitoring heart rate 16, cardiac cycle, respiration 17 and other bodily processes.
In this paper, we will use deep learning techniques, more specifically CNN, to study PPW. There are several points in our study that significantly differ from the existing studies. First, our study is based on a relatively large clinical dataset that was collected from over 4,000 women consisting of over 1,800 pregnant and 2,200 non-pregnant women. In comparison, existing studies were based on much smaller datasets (for example, 6 samples 38, 47 samples 20, and 130 samples 22). Second, in this paper, we developed a modern computational approach based on CNN with two different neural network models and data preprocessing methods to analyze the underlying correlation between the PPW and health conditions. Due to the similarity among PPW, PPG, and electrocardiogram (ECG), our approach can be generalized to the diagnosis of human health conditions by other available clinical imaging data (PPG, ECG, etc) 39, 40. Third, we studied the correlation between the PPW and pregnancy as a proof of concept due to the following reasons: 1) the status of pregnancy is clear and definite, unlike kidney weakness 33 and neurasthenia 34, which are vague and unclear; 2) the label of pregnancy is very accurate due to standard and effective techniques for pregnancy detection, such as urine tests (with high accuracy) and blood tests 35; 3) it has been widely claimed in TCM that pregnancy can be accurately detected by pulse feeling 36; 4) during pregnancy, there are many physiological changes in the reproductive system, circulatory system, urinary system, respiratory system, etc. Therefore the maternal blood volume increases by 45% above non-pregnant values 37, which may change pulse wave patterns. By taking the original PPW segments as the only input, our models provided an 85% accuracy of pregnancy prediction. The paper is organized as follows: first, we introduce the data used in our study and two data preprocessing approaches; second, we present our computational approach, which consists two different neural networks; the detailed results for both approaches and discussion are then presented..

2 The available dataset & preprocessing
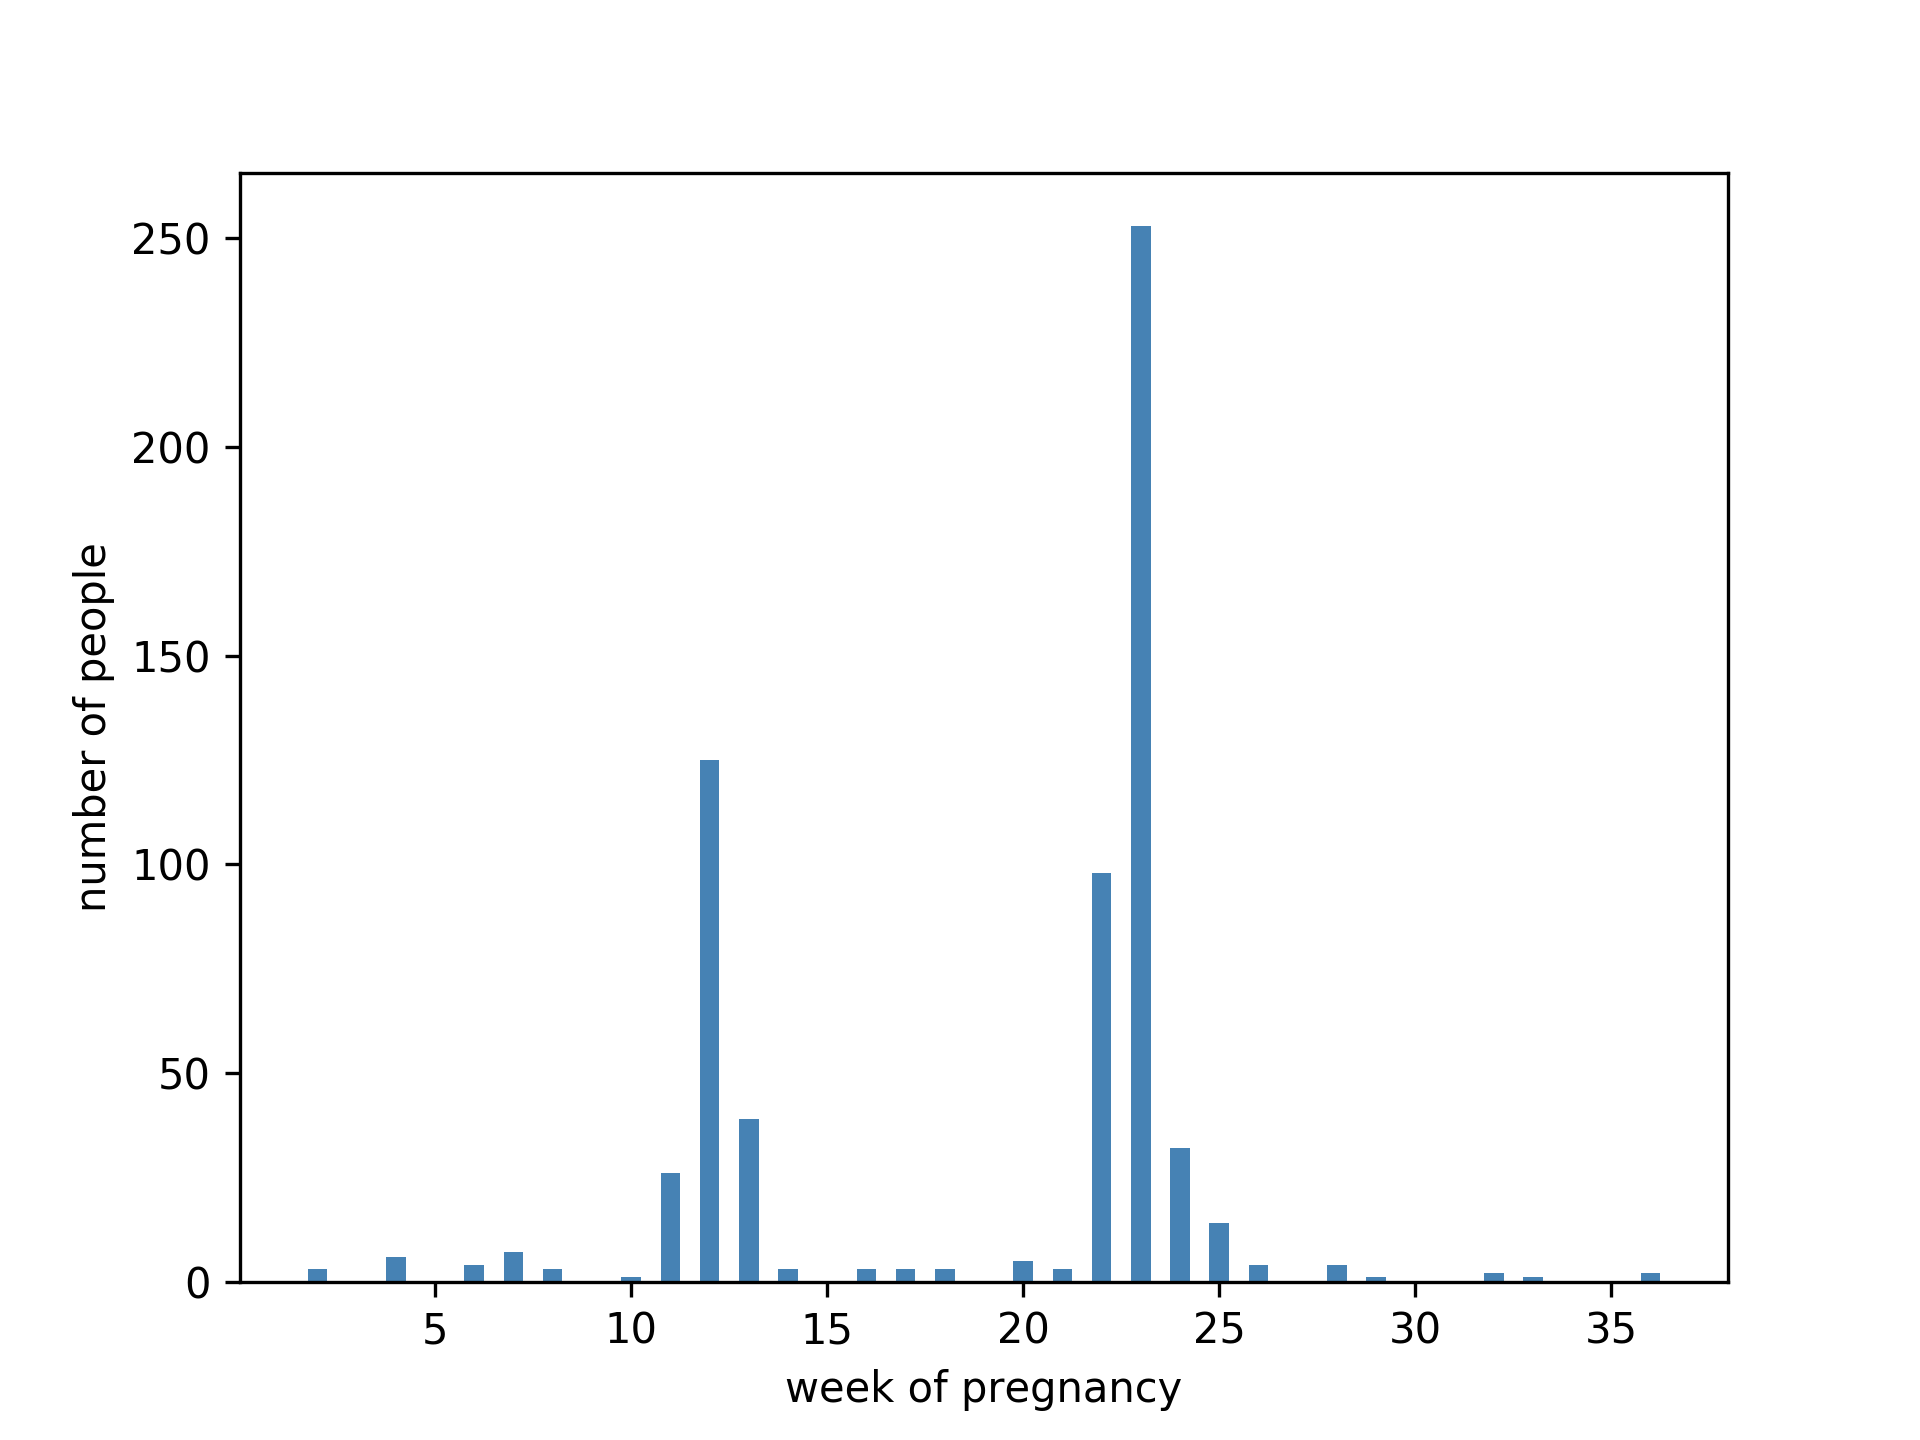
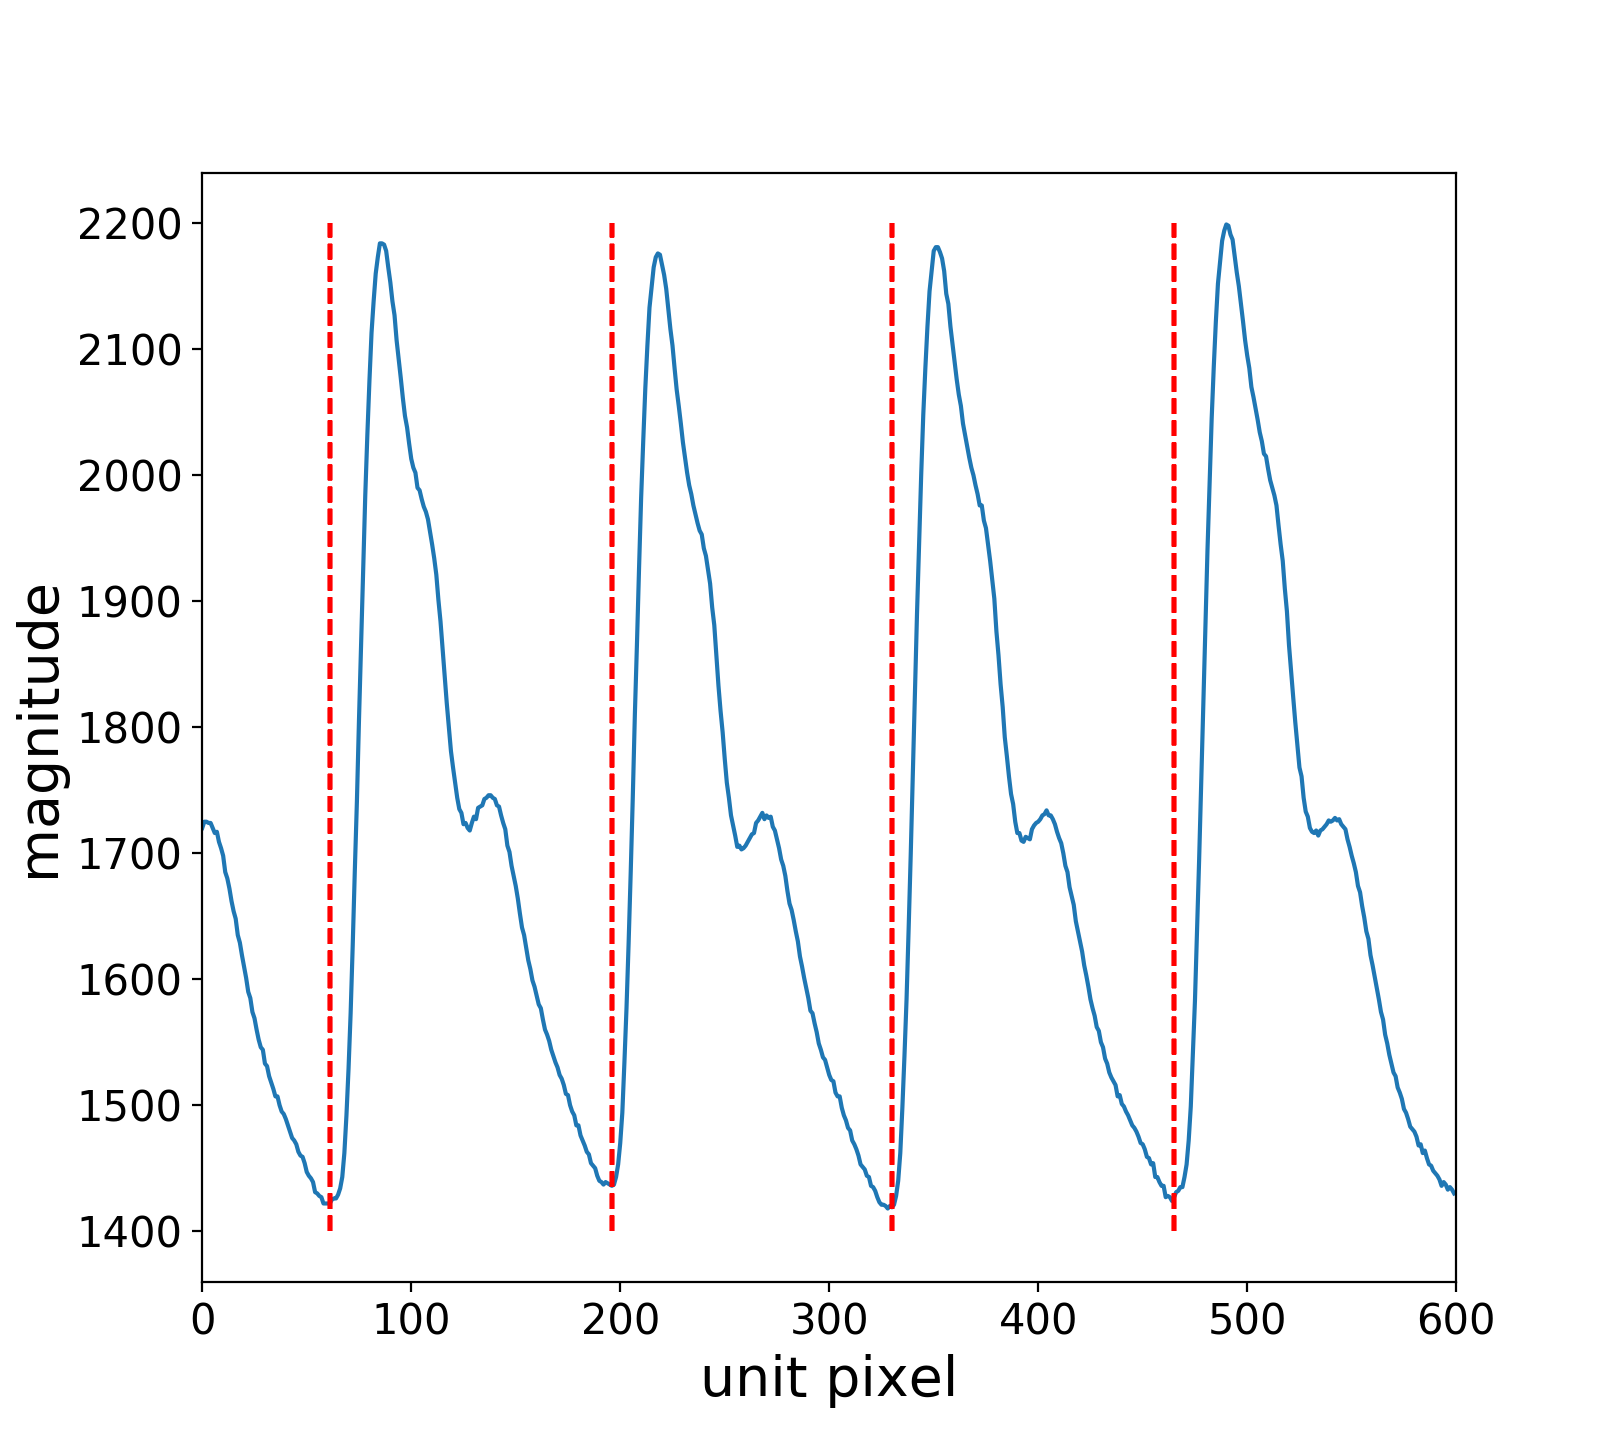
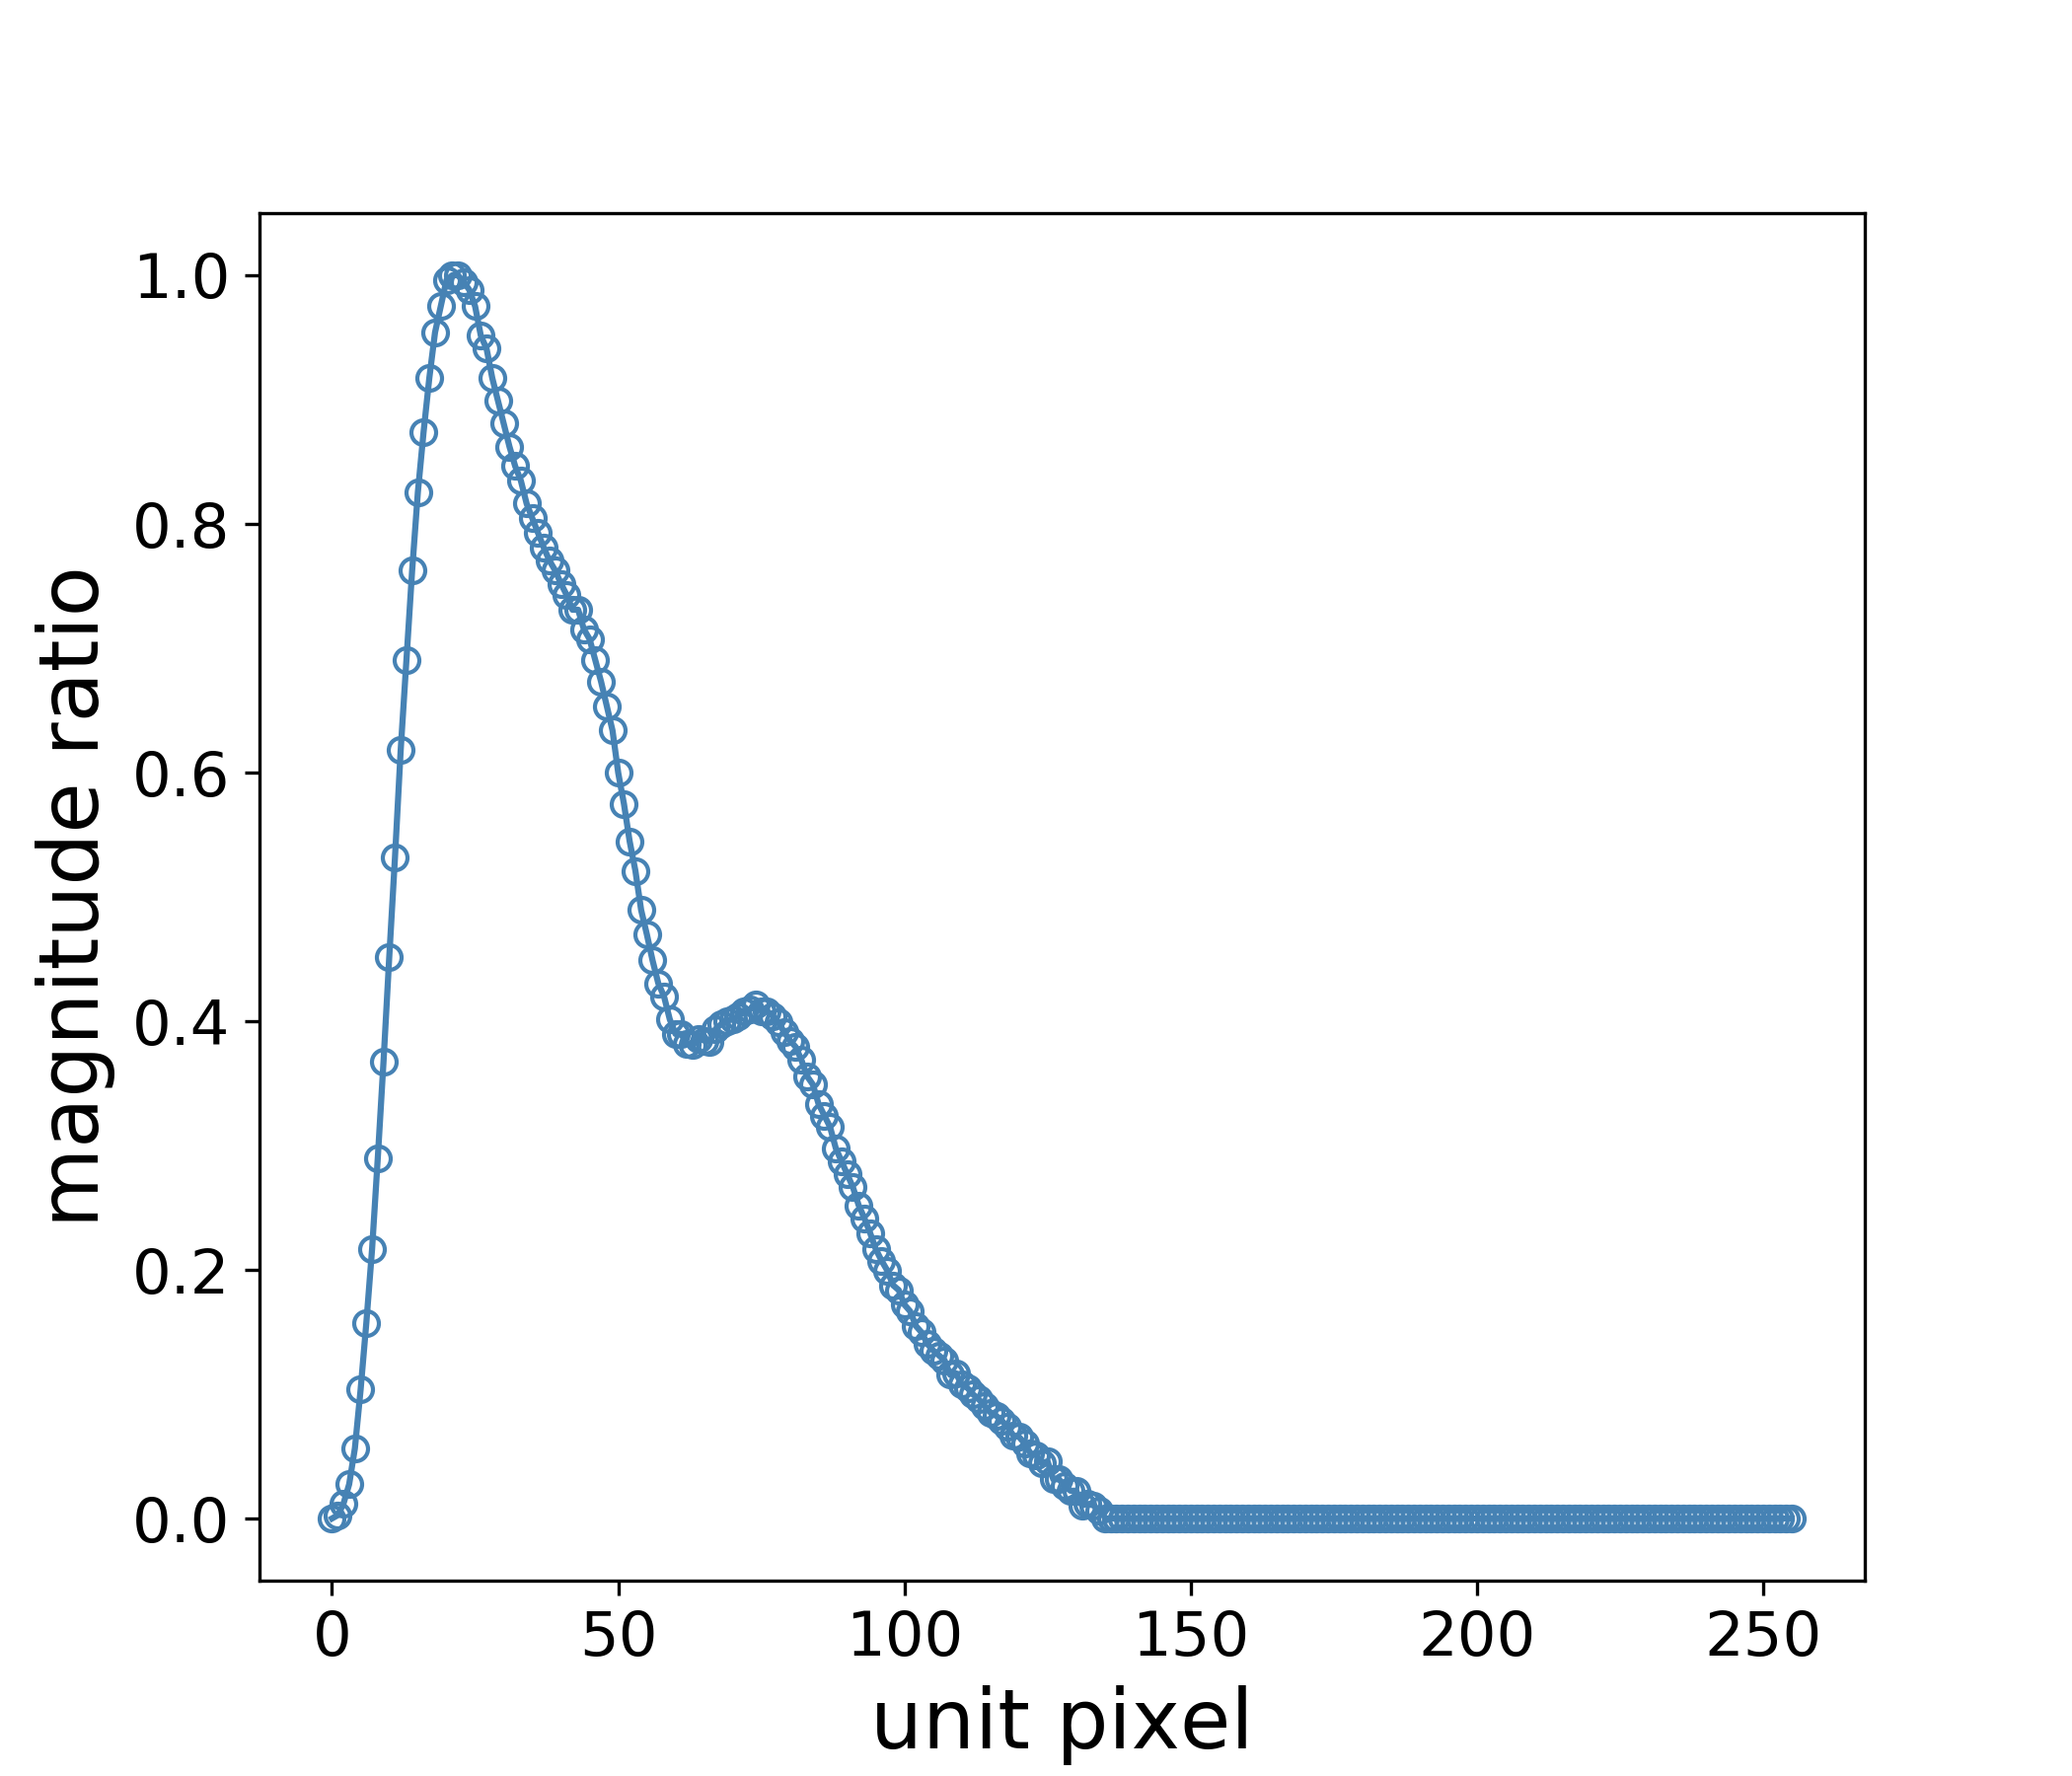
The PPW data was collected from over 4,000 people (age ) in Nanjing Huashijiabao Hospital, China. The collections were taken under the HK-2010/1 single channel pulse sensor, by experienced and trained nurses, from volunteers’ left wrists when the pulse repeated in a regular pattern for about 40 seconds. The pulse sensor measured the blood pressure with a time resolution of seconds. In Fig. 2 we have plotted an image with the -axis assigned to the measurements while the -axis is assigned to the pulse wave amplitude. Then our PPW imaging dataset was selected based on similar periods and amplitudes. The number of people with respect to all pregnancy weeks is shown in Fig 3. There are two peaks centering around the 12th and 23rd weeks since two major pregnancy examinations happen around these weeks. The low quality refers to the irregular pattern and large noise introduced by the external environment and the collecting operation. After this filtering process, only 1,840 samples (of which 645 are pregnant) are left. In order to obtain reliable and reproducible results, we designed a data preprocessing approach: the restrict the PPW to one period and append zeros to construct the measurement interval. In our study, we chose the measurement interval as unit pixels since all the periods are smaller than unit pixels. By denoting our dataset where is one datapoint, we describe the data preprocessing approach to preprocess each data as follows:
-
1.
divide into several sub-intervals by local minimums, which are shown as red lines in the left part of Fig 4;
-
2.
and pick one of the sub-intervals in the first step and normalize linearly into [0,1] with 256 pixels (append zeros if less than 256 since all the periods are less than 256) shown in the right part of Fig 4.
3 Computational models
We applied two different types of 1D-CNN models from 41 and 42 respectively to analyze the PPW data and to compare the results. Model 1, which is based on the 1D ResNet and uses BasicBlocks 41, with more channels and parameters (the number of parameters is 242,642), fewer layers, but a better generalization capability. The detailed structure of Model 1 is shown in Table 1. Here BasicBlocks, which insert identity shortcut connections to the plain convolutional layers 41, are commonly used in deep neural networks of the ResNet to reduce the computational cost. Model 2 is based on the 1D MgNet 42 and uses 18 layers with only 8 channels (the number of parameters is 3,450). We note that the structures (and the number of weights used herein) between Model 1 (which is based on the standard ResNet) and Model 2 (which is based on the new MgNet) are quite different, but, as we shall see later, the outcomes of these two different models are similar, which provides a cross-validation of the liability of using the deep learning approach on the PPW data.
| Layer Name | Input Size | Output Size | Layer Parameters |
|---|---|---|---|
| Convolution | |||
| Pooling | for max pooling | ||
| BasicBlock1 | |||
| Block with downsample1 | |||
| BasicBlock2 | |||
| Block with downsample2 | |||
| BasicBlock3 | |||
| Block with downsample3 | |||
| BasicBlock4 | |||
| Pooling | for average pooling | ||
| Fully Connected |
4 Results
The implementation of these two computational models is based on the PyTorch library 43. The optimization problem is based on the cross-entropy loss, which is defined as
| (1) |
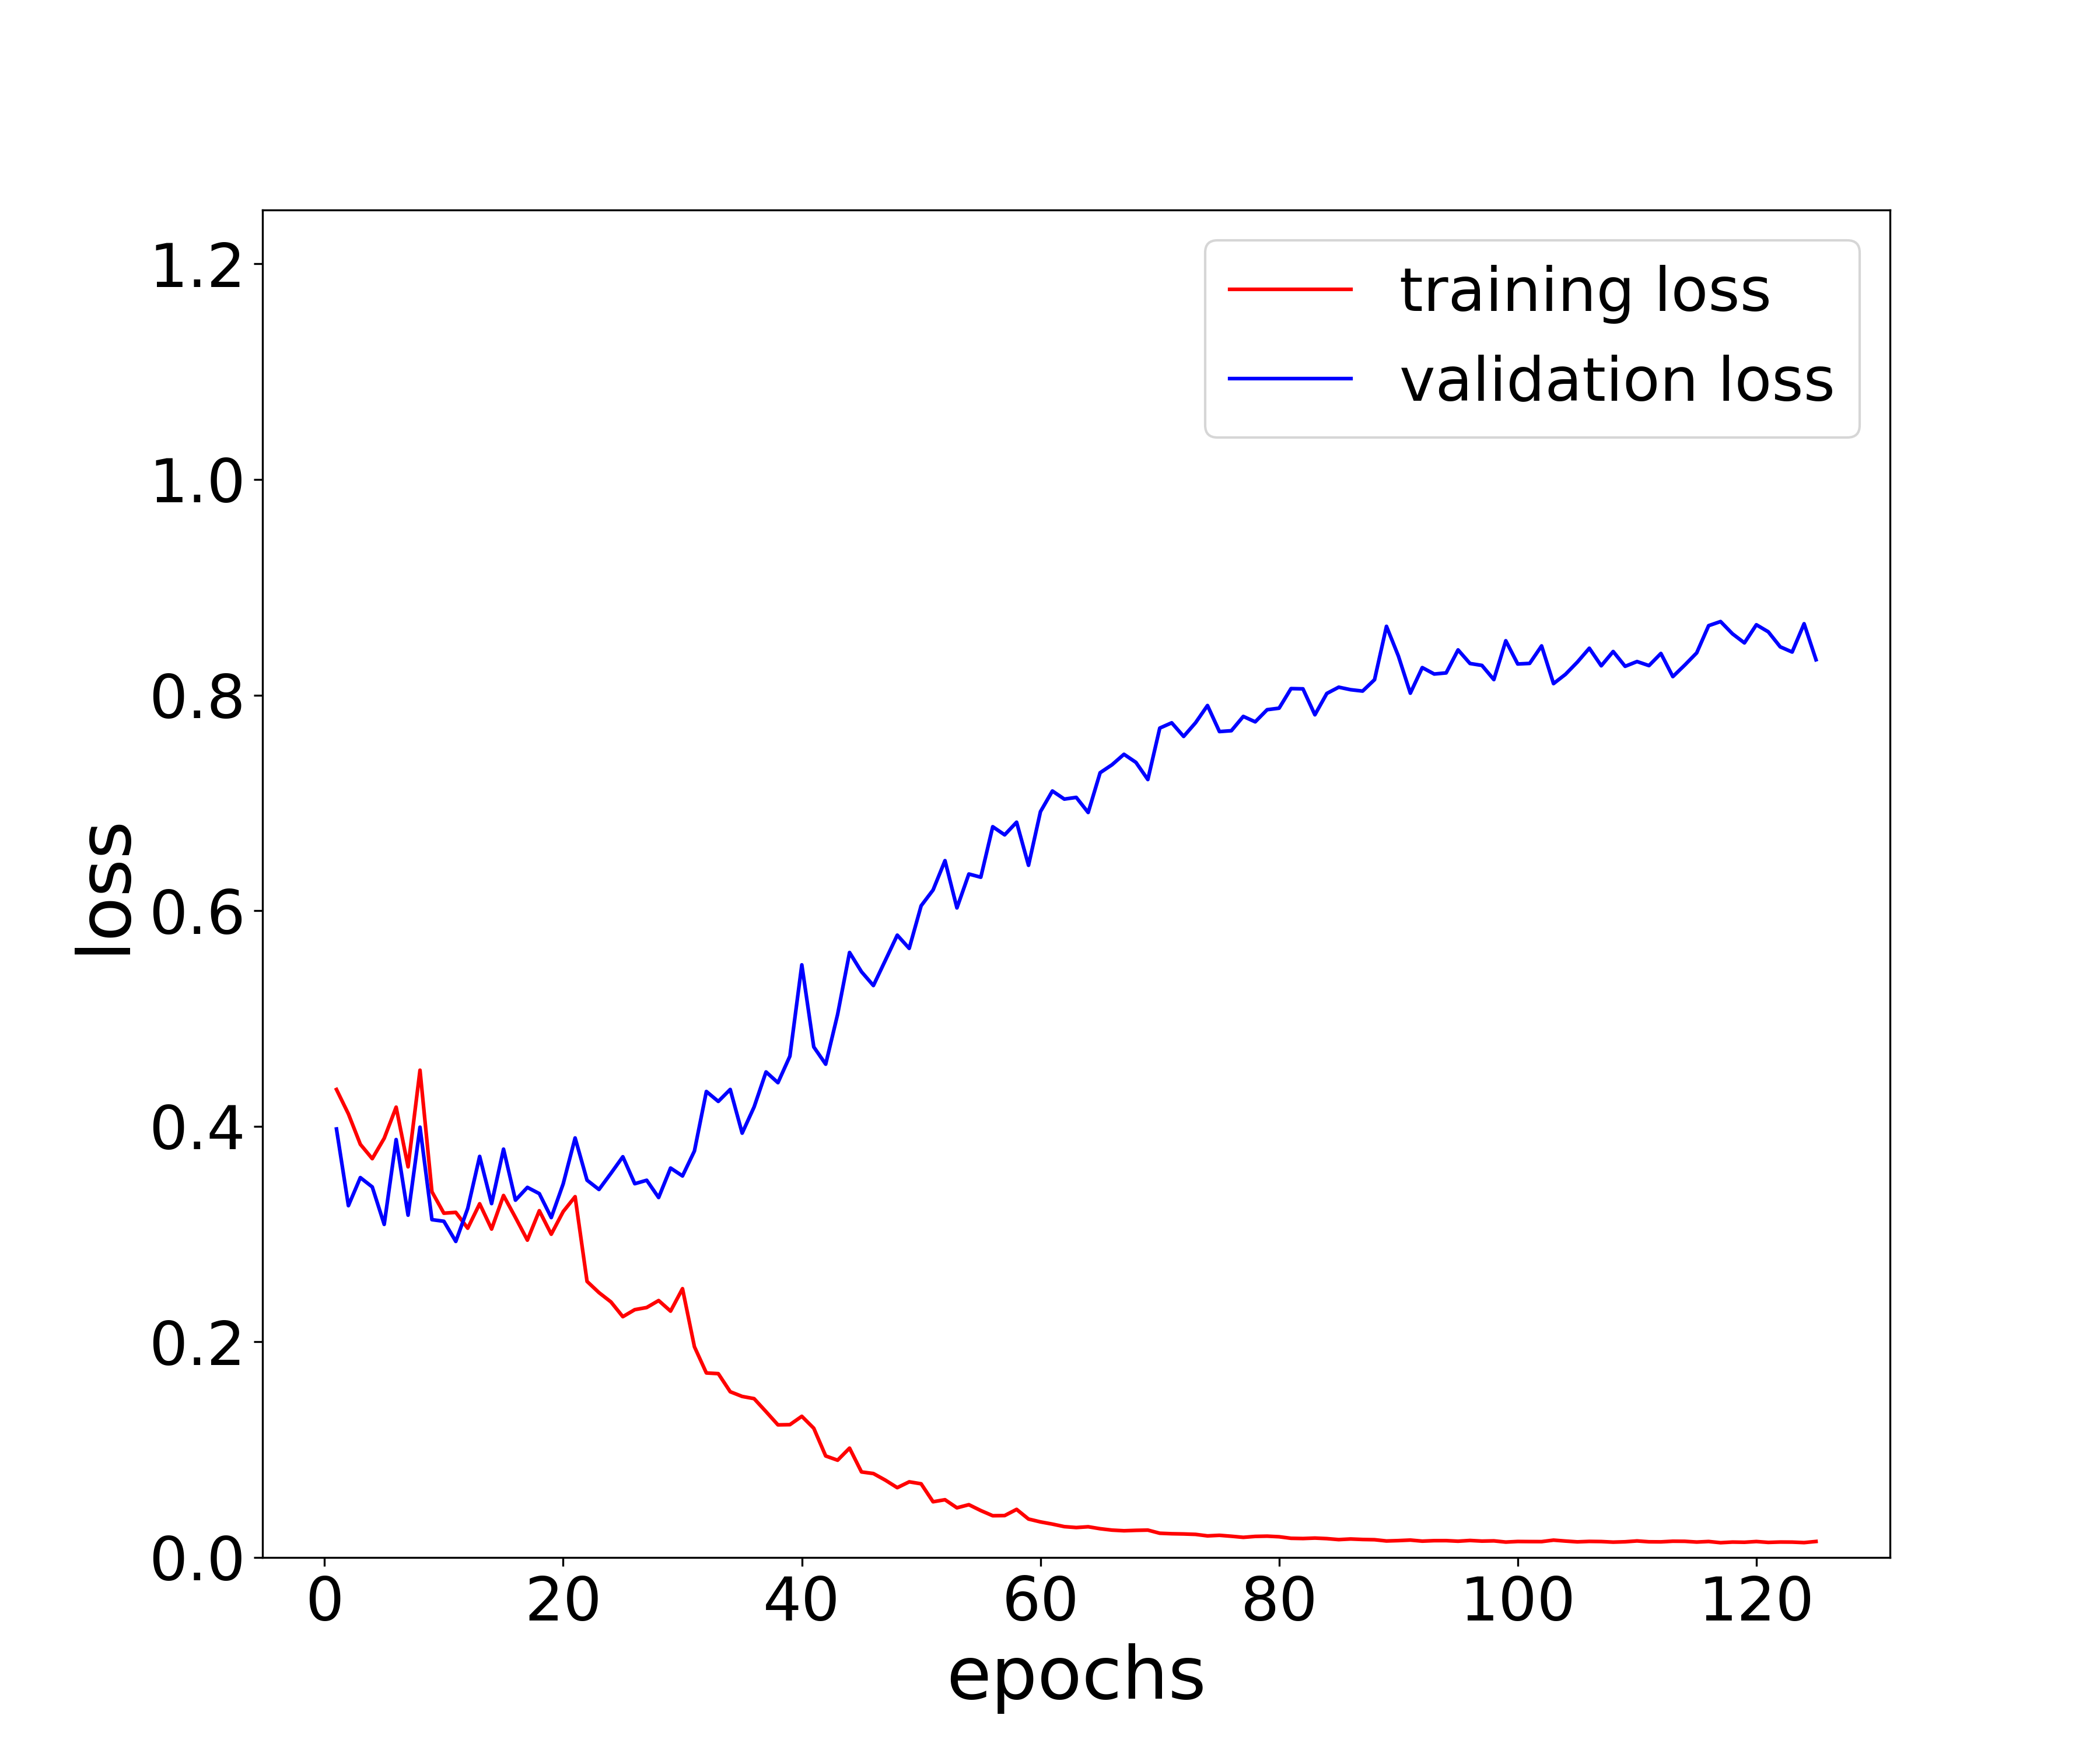
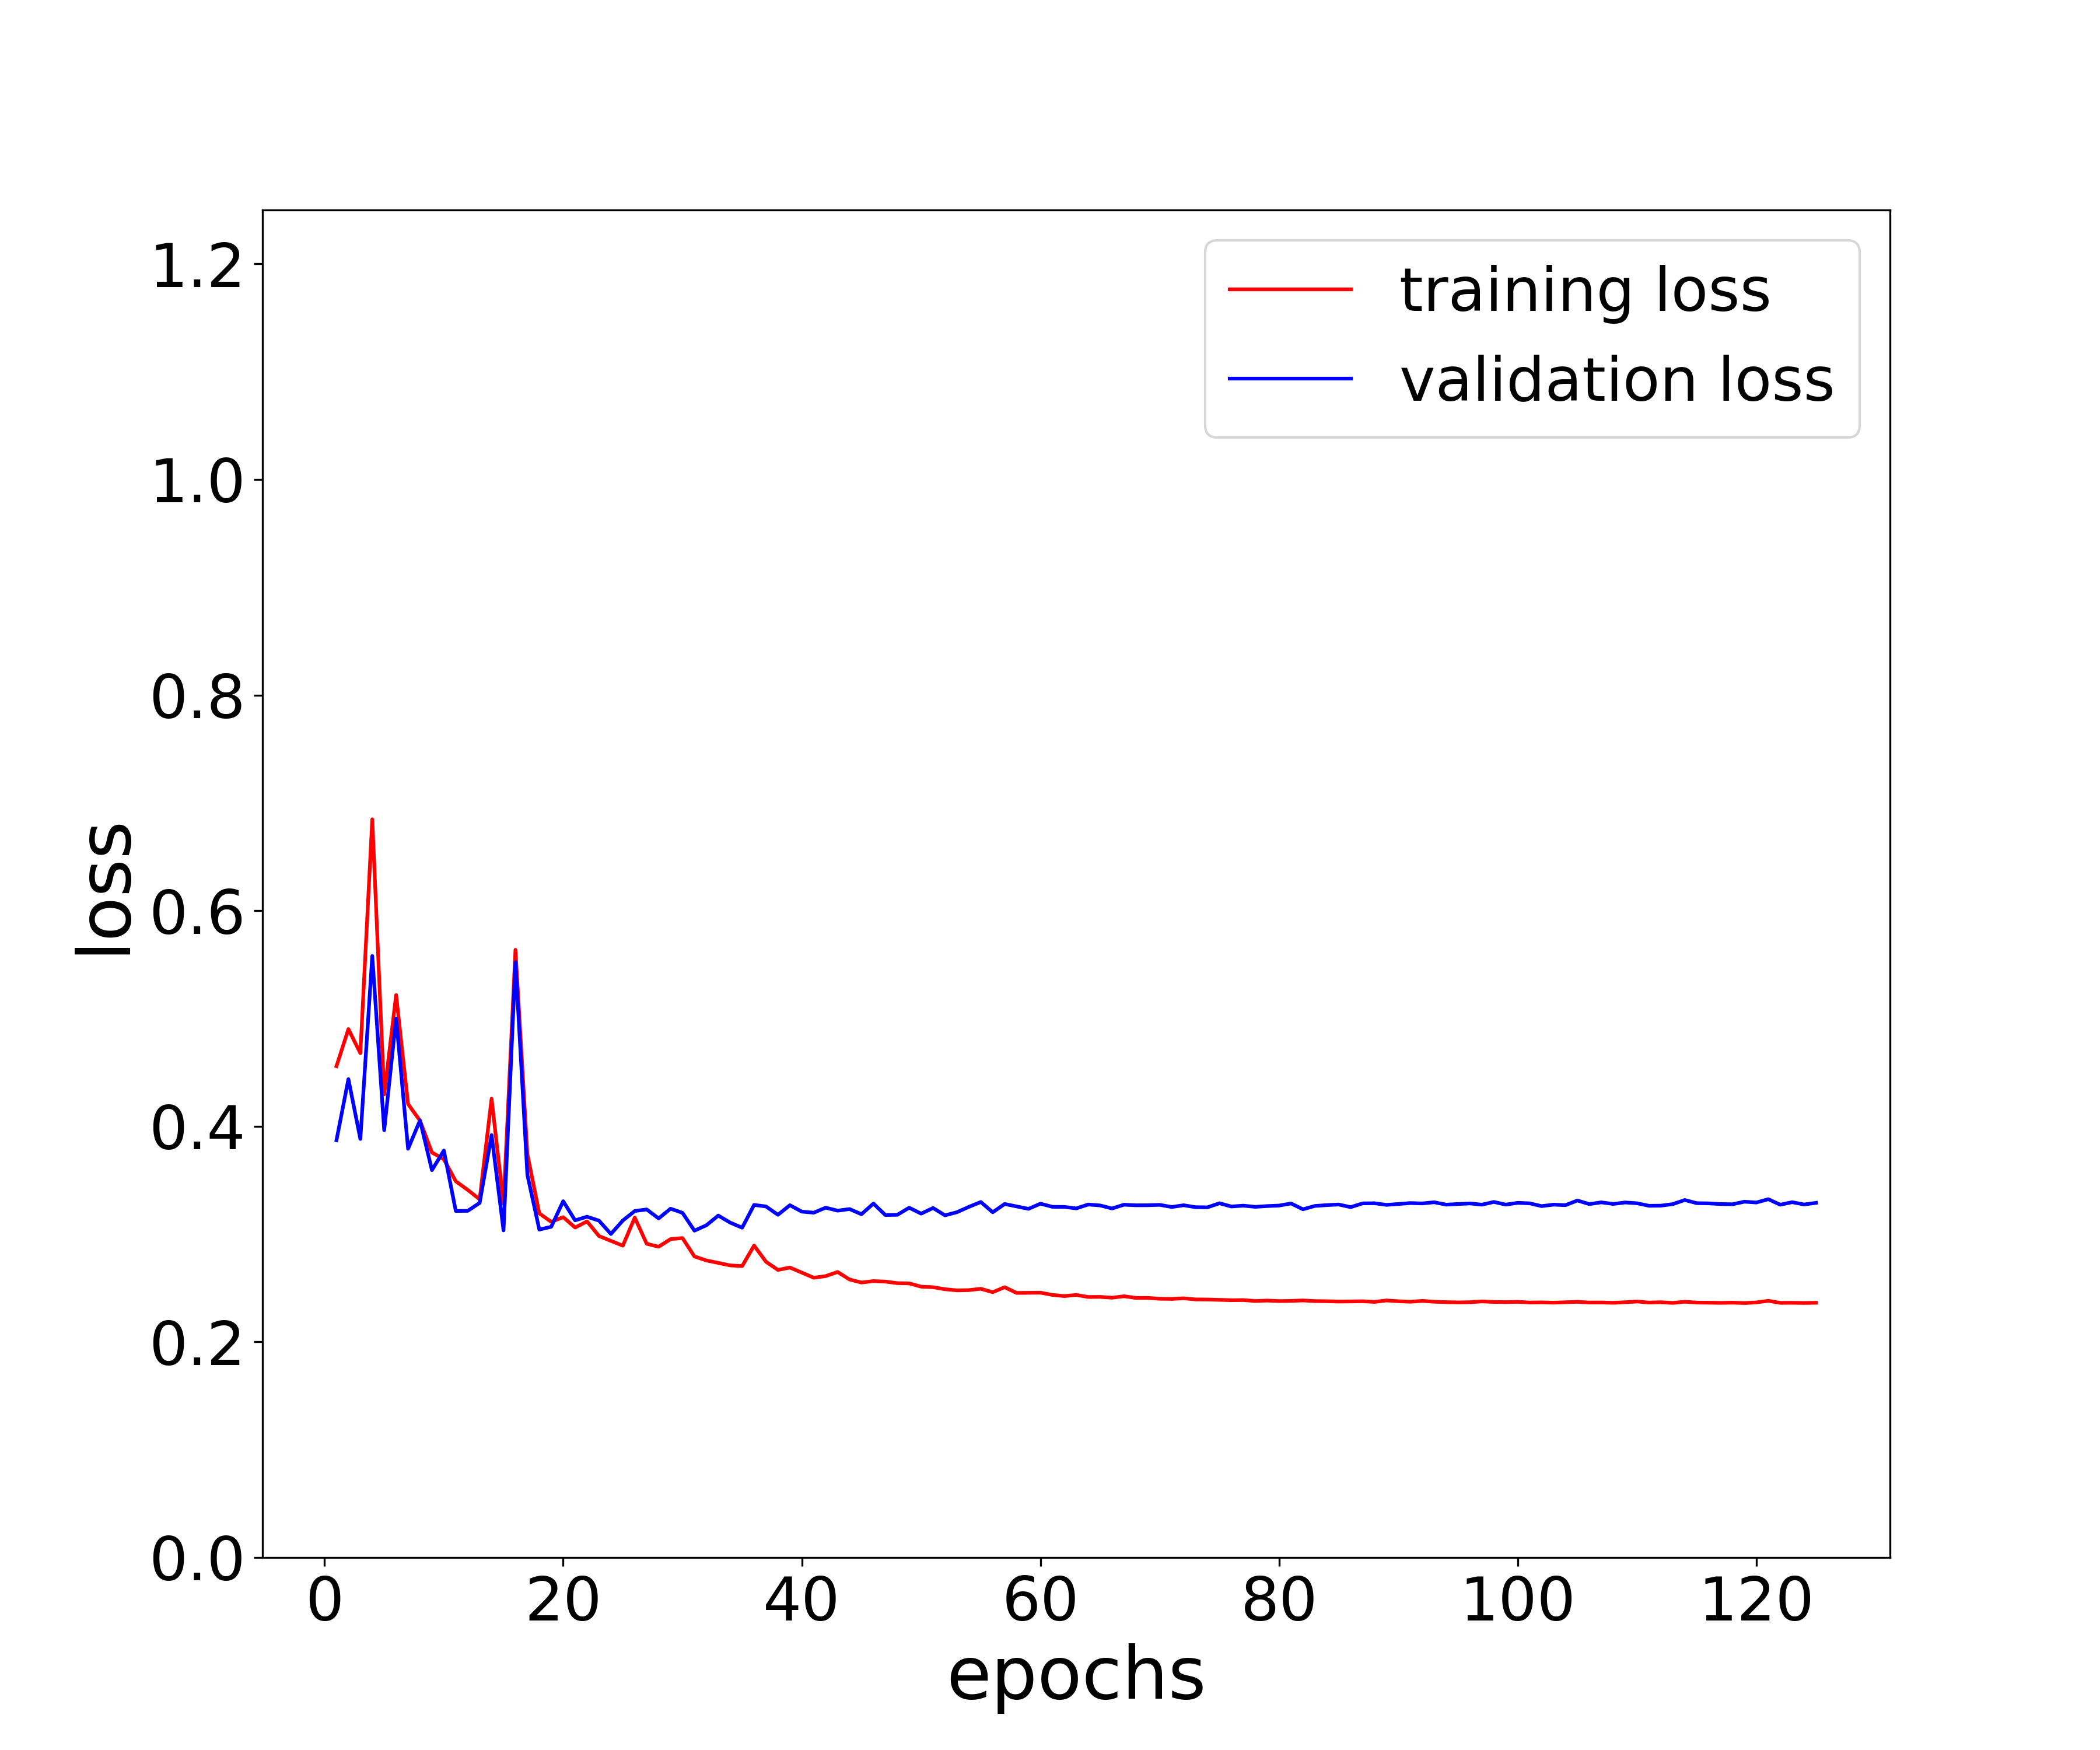
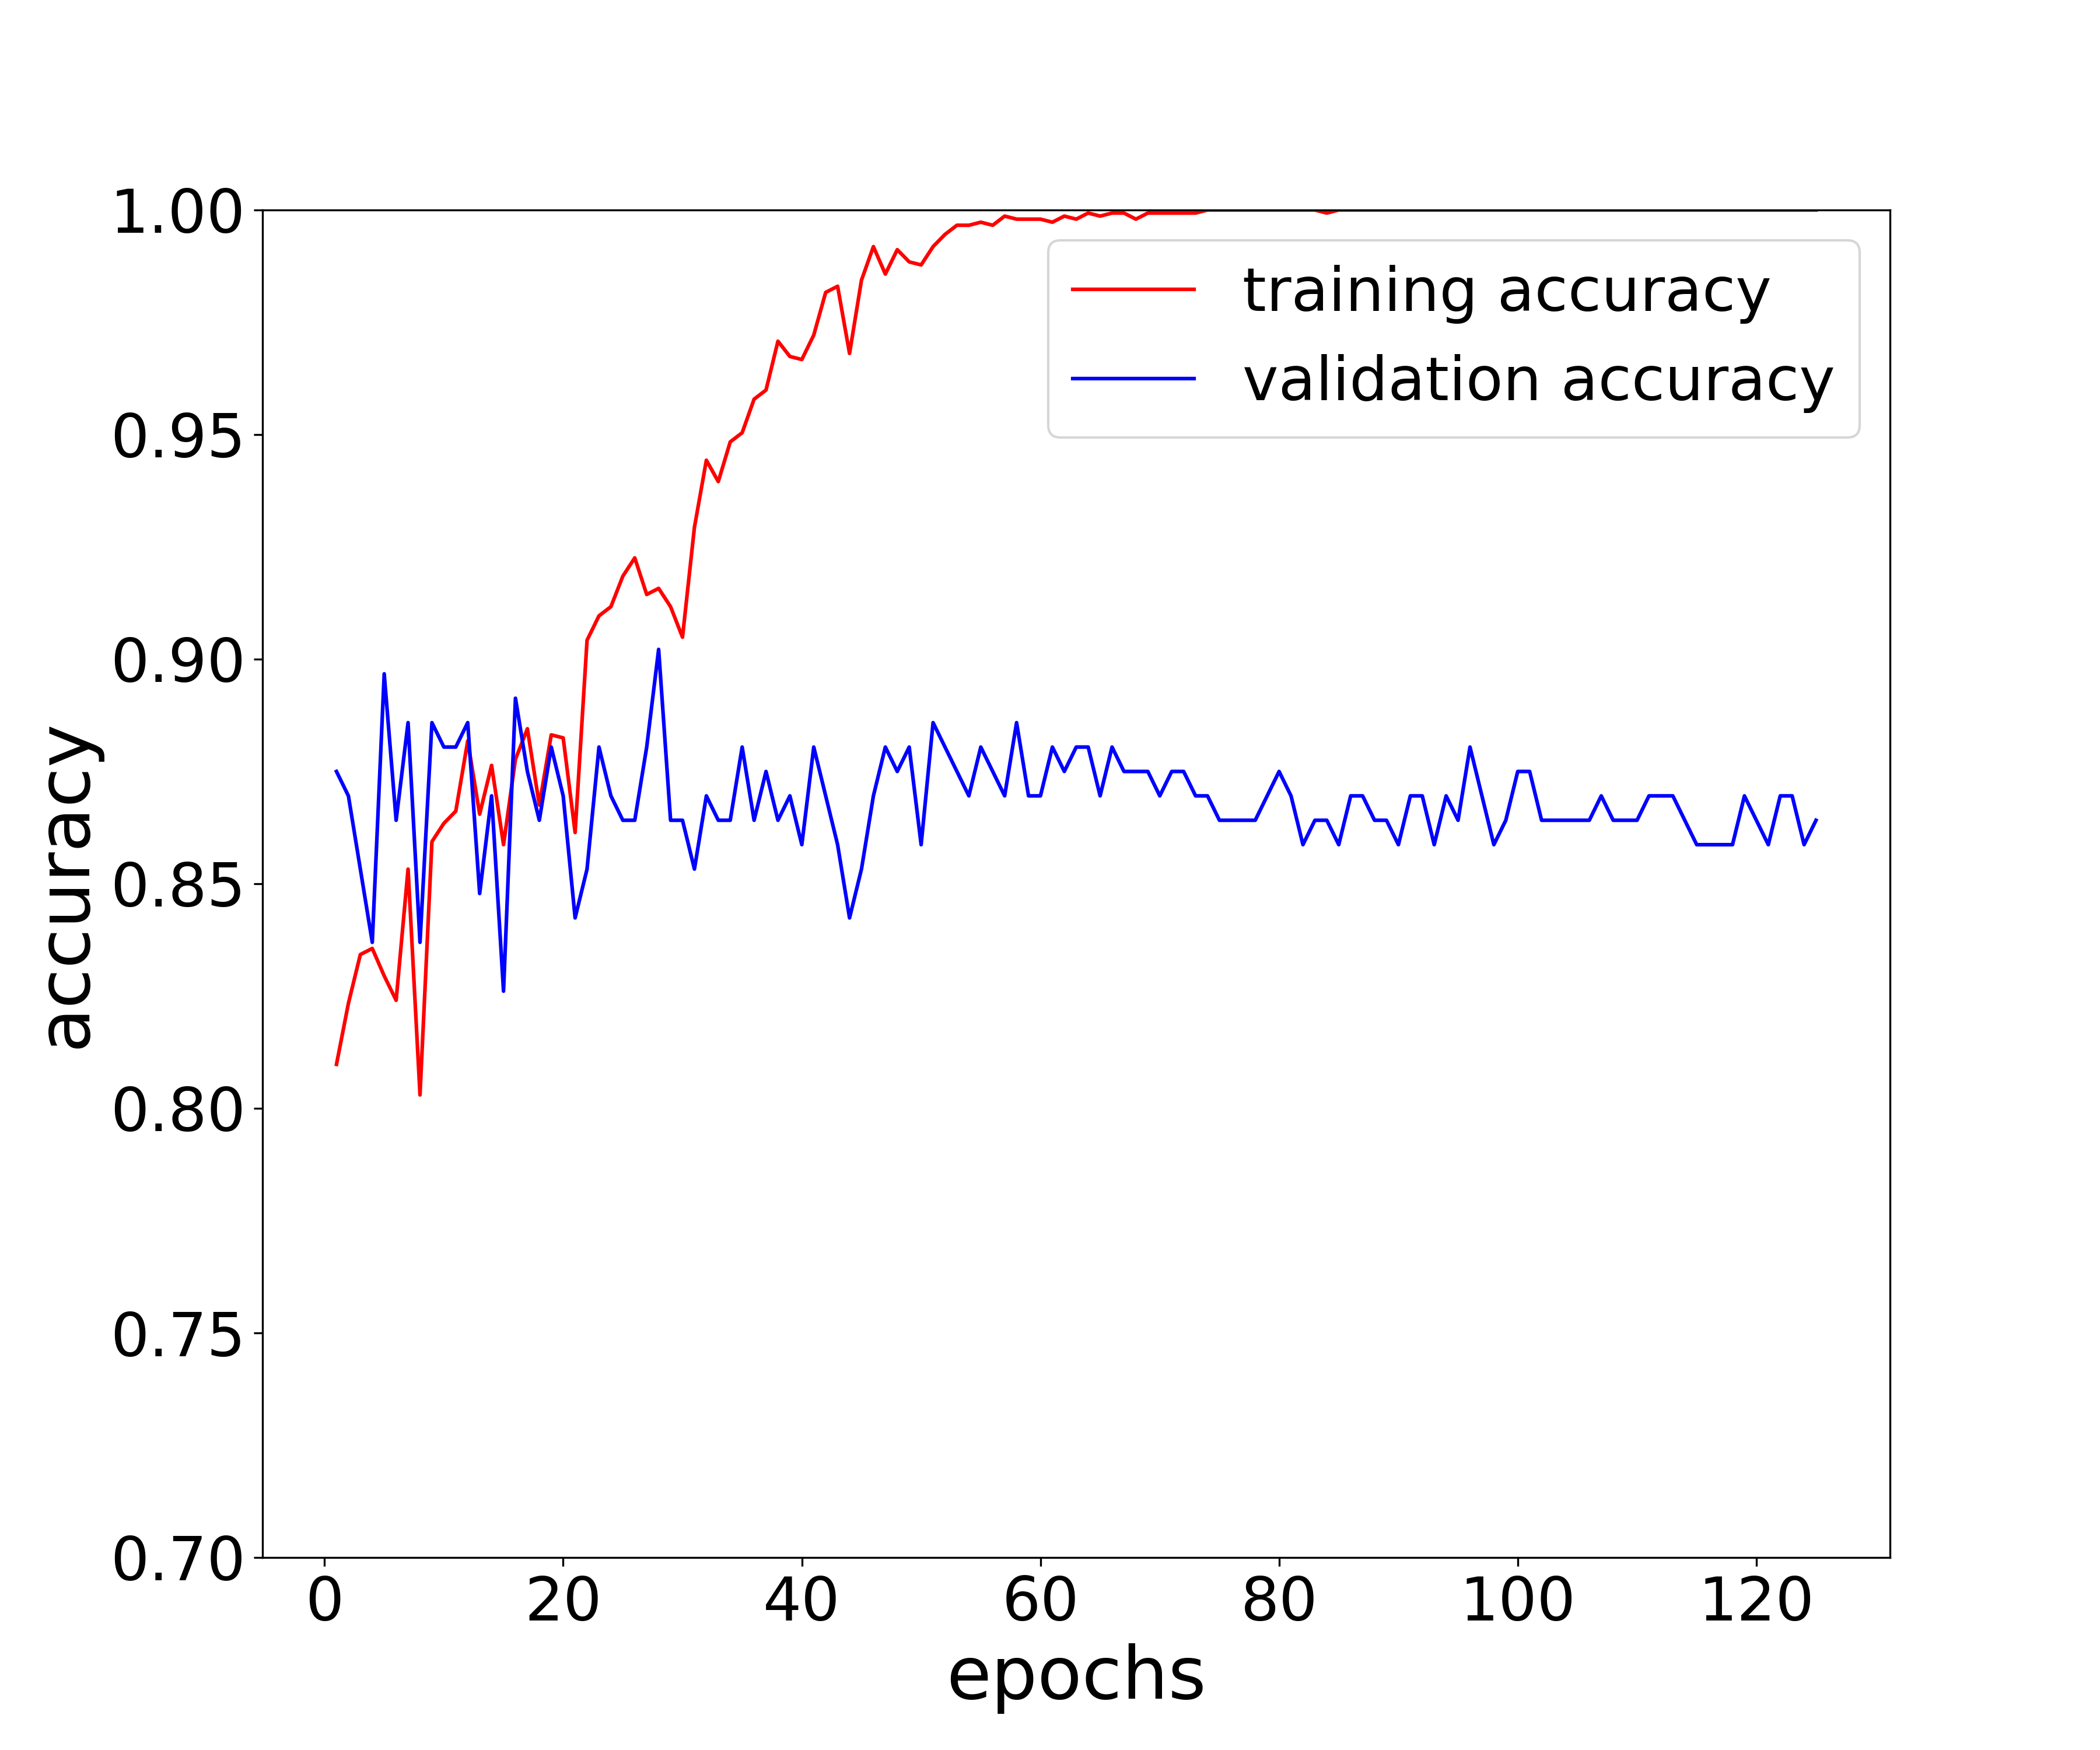
where is the total number of data samples, is the true label for the -th PPW data, and is the predicted label of the computational models. The Adam method 44 was employed to solve the optimization problem. The learning process was stopped after running 200 epochs and then we chose the model with the best validation accuracy. The loss and accuracy of the first fold for both models are shown in Fig. 5. For Model 1, the average testing accuracy is 84.73%, while Model 2’s average testing accuracy is 84.68%.
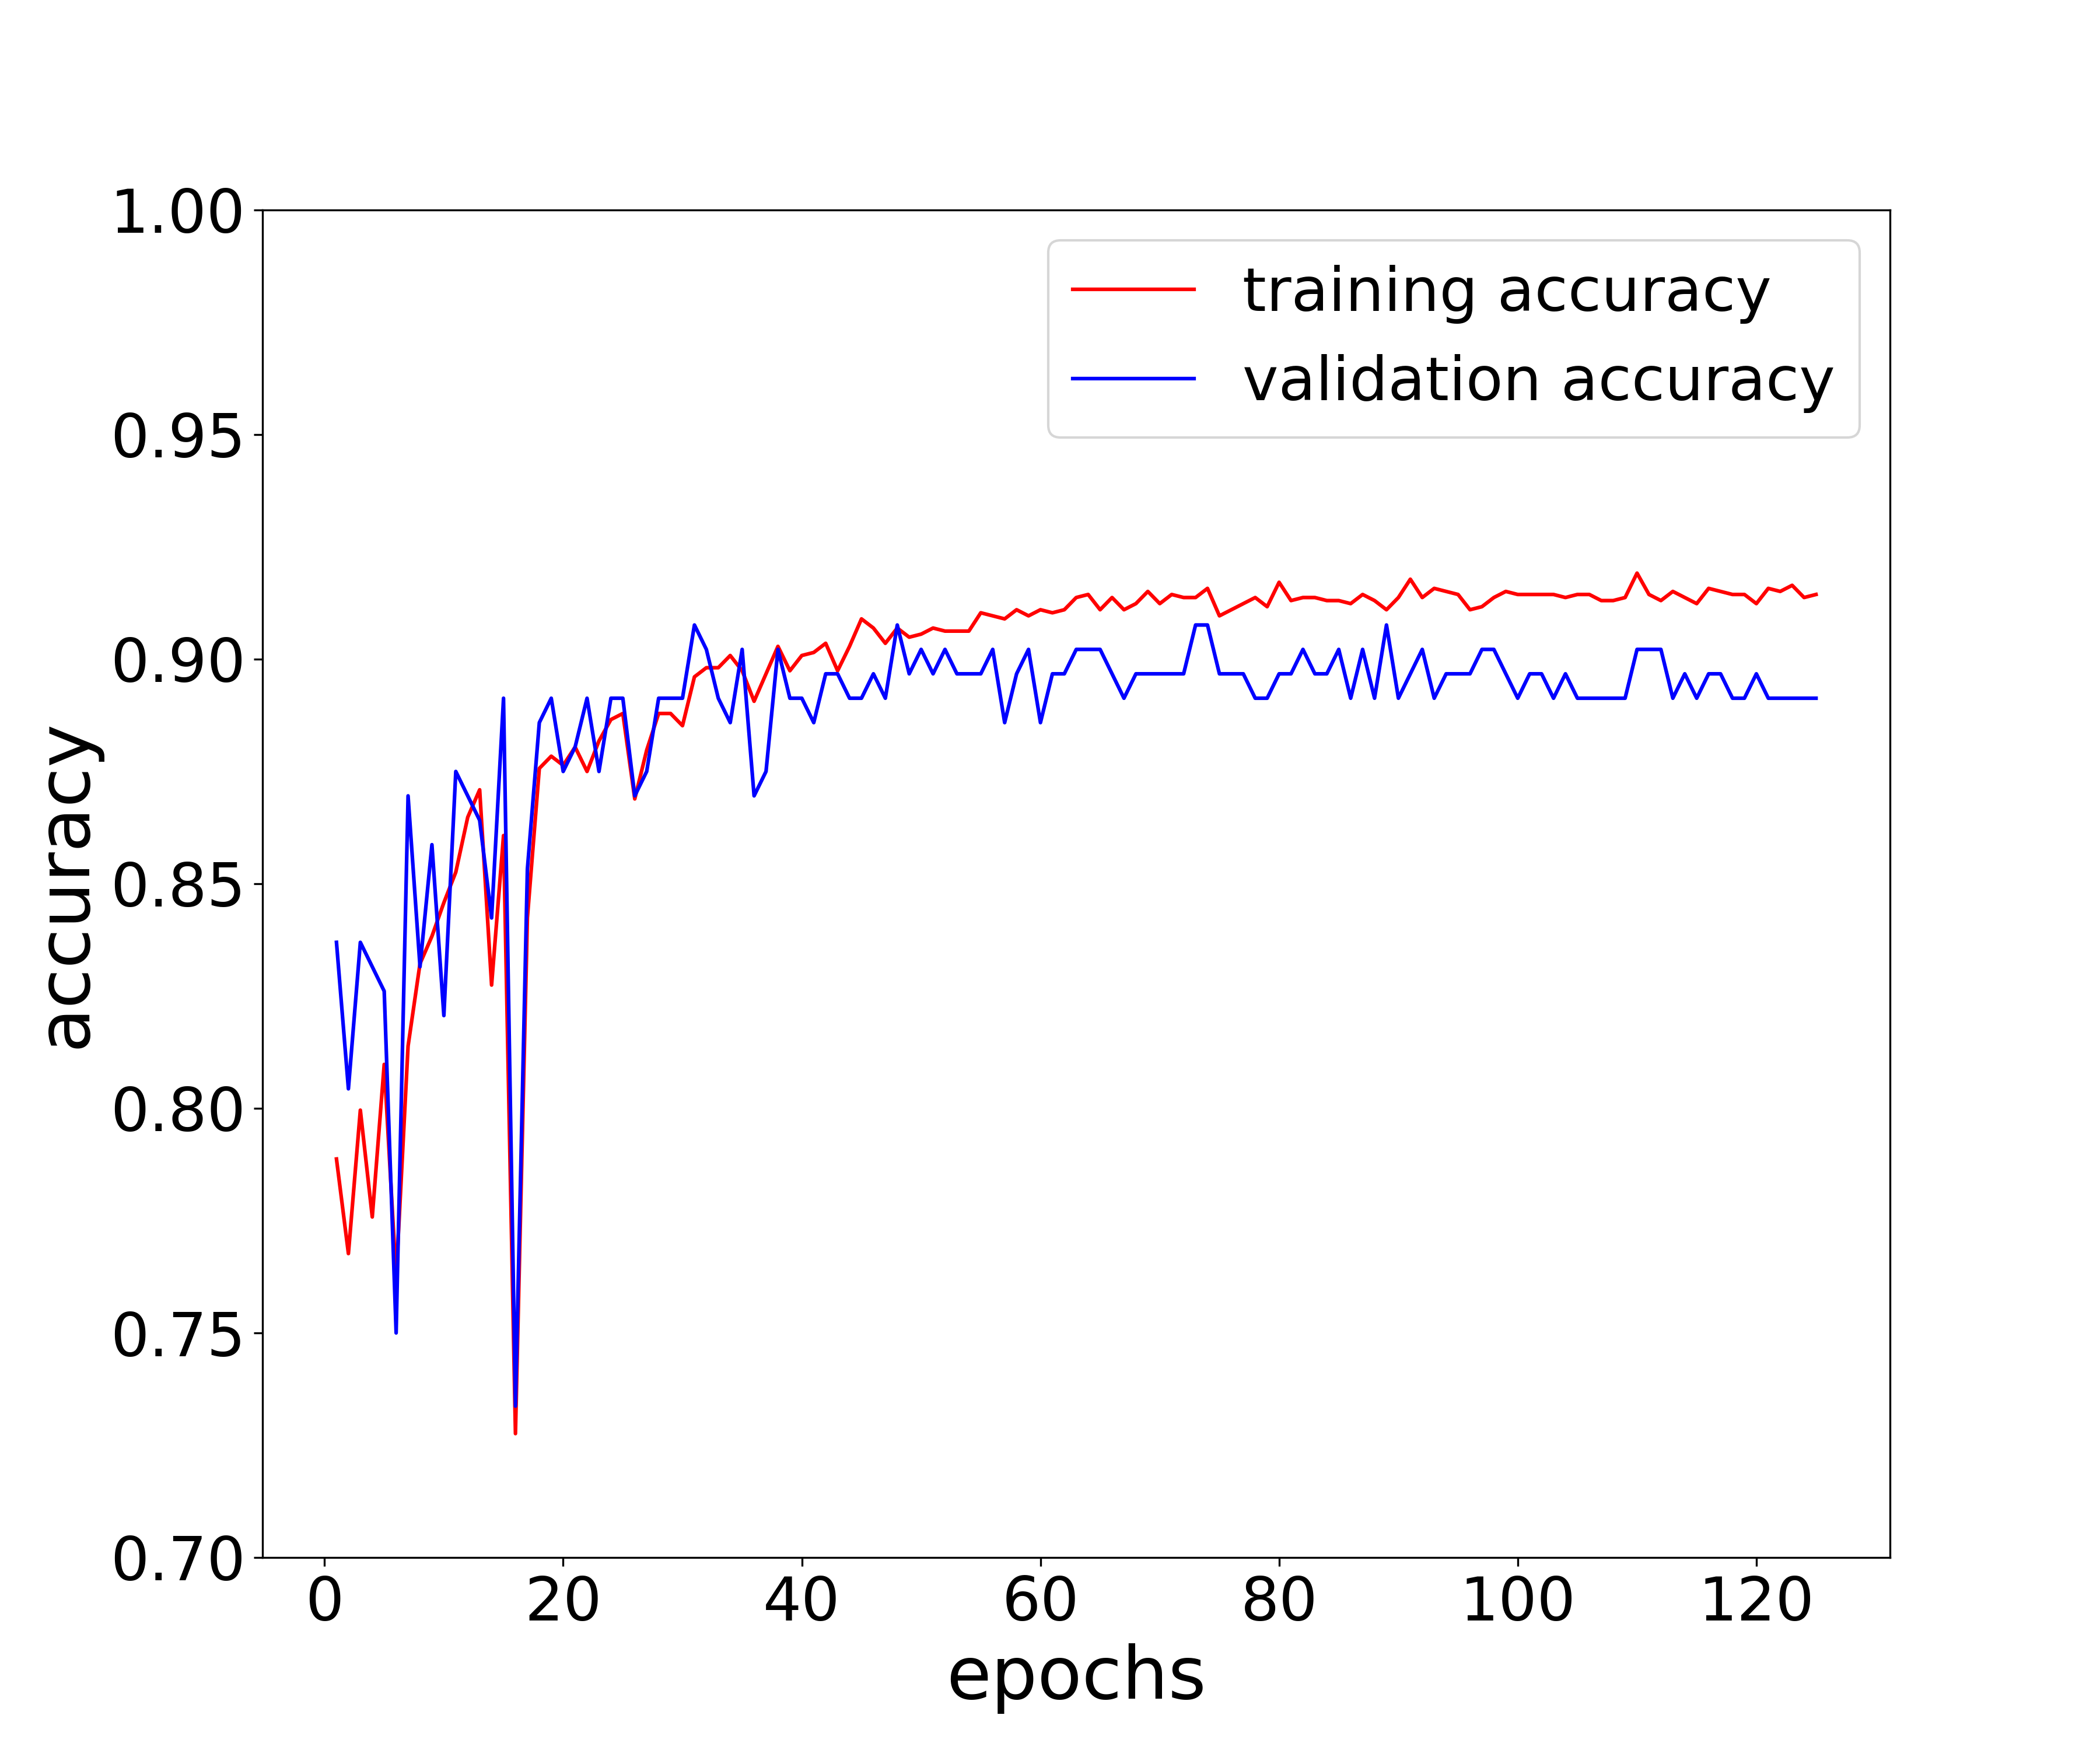
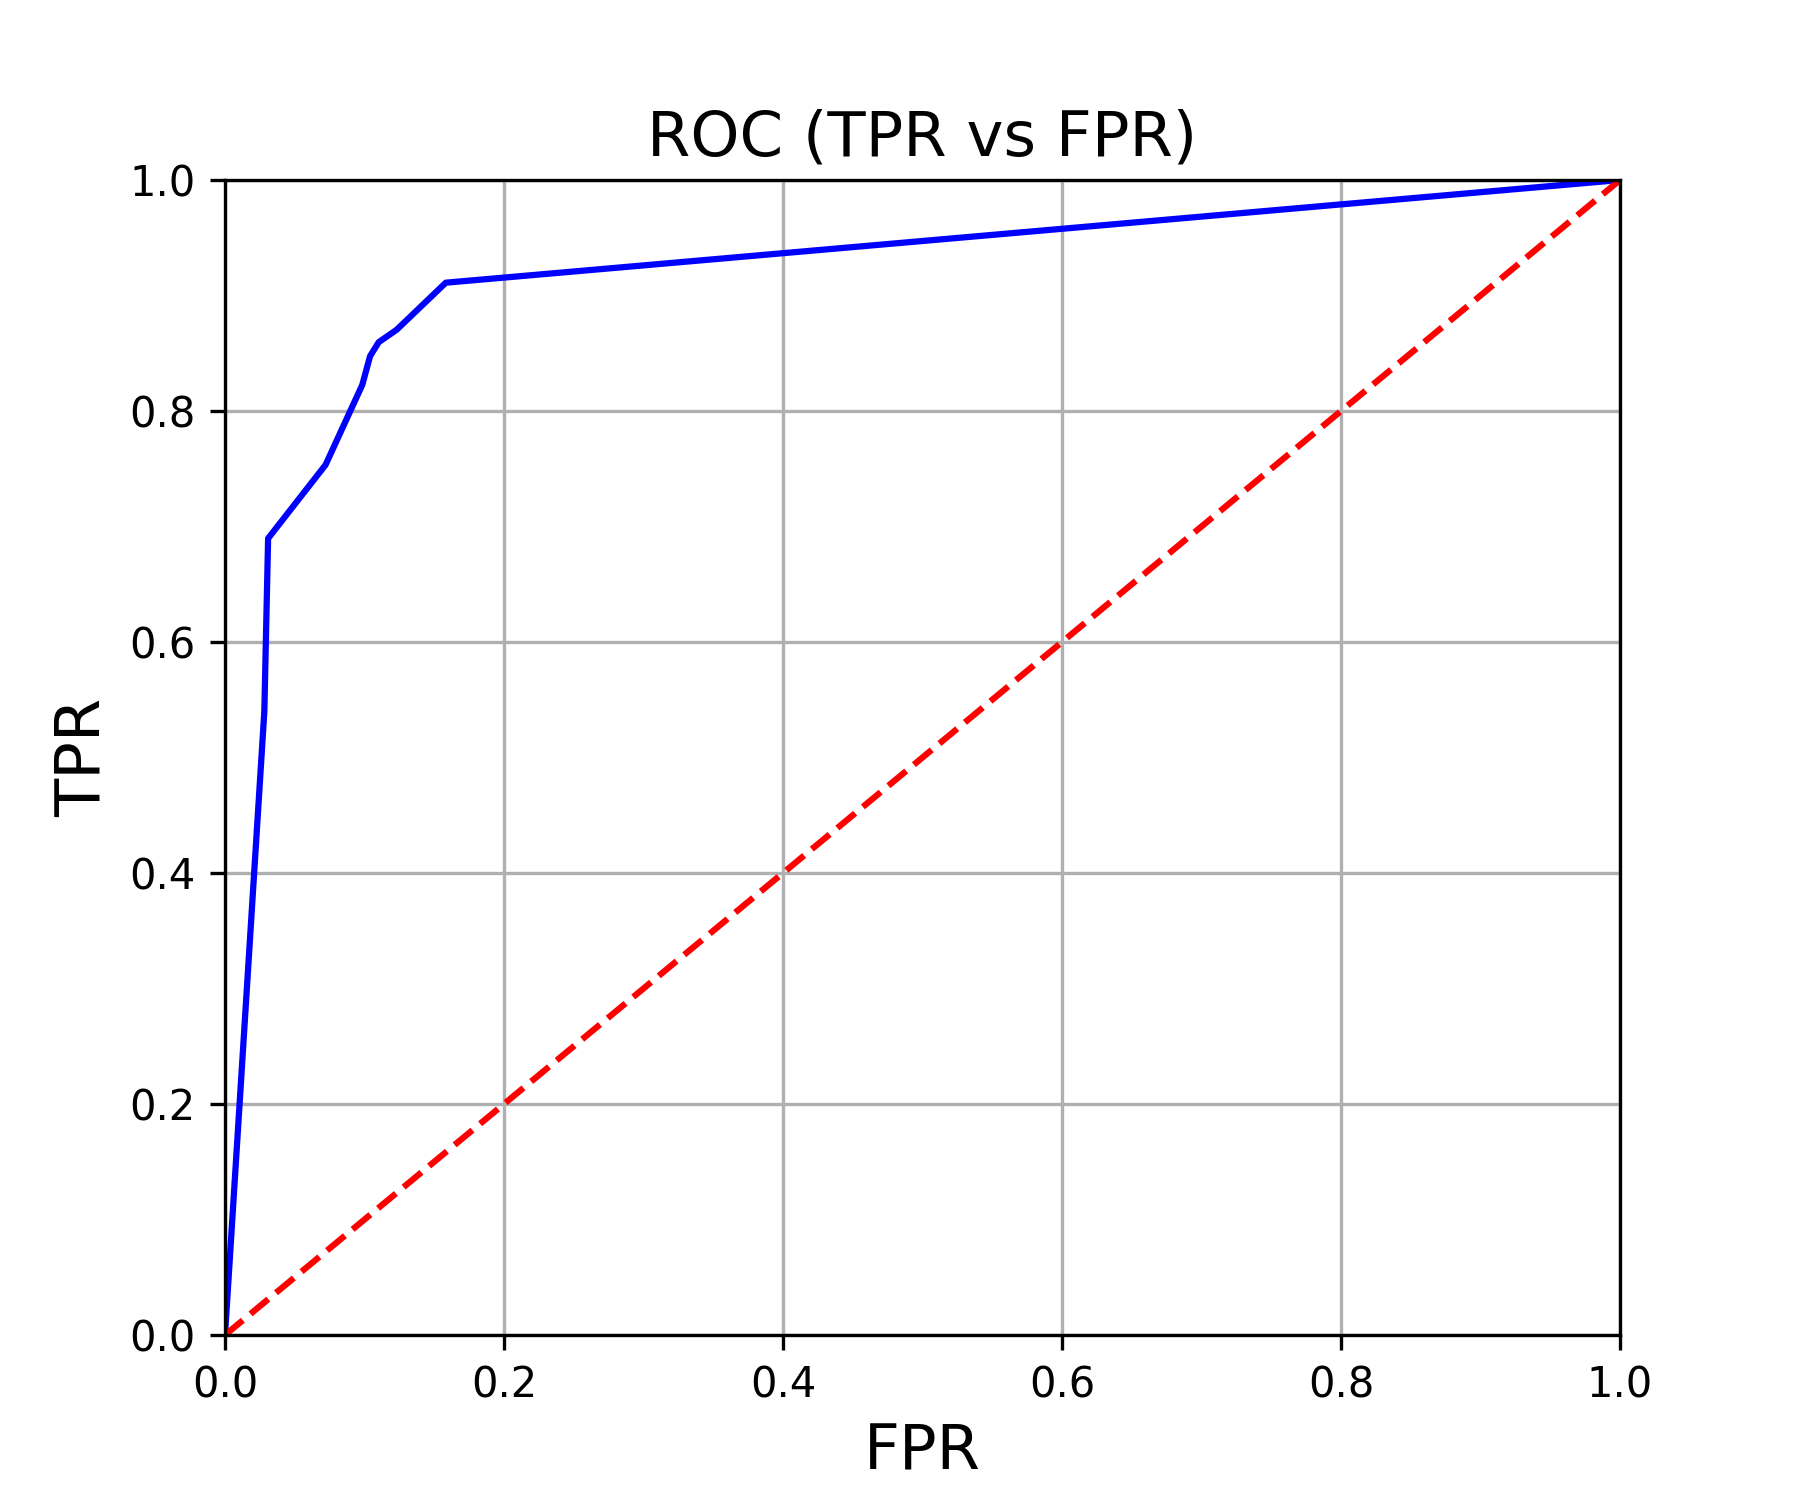
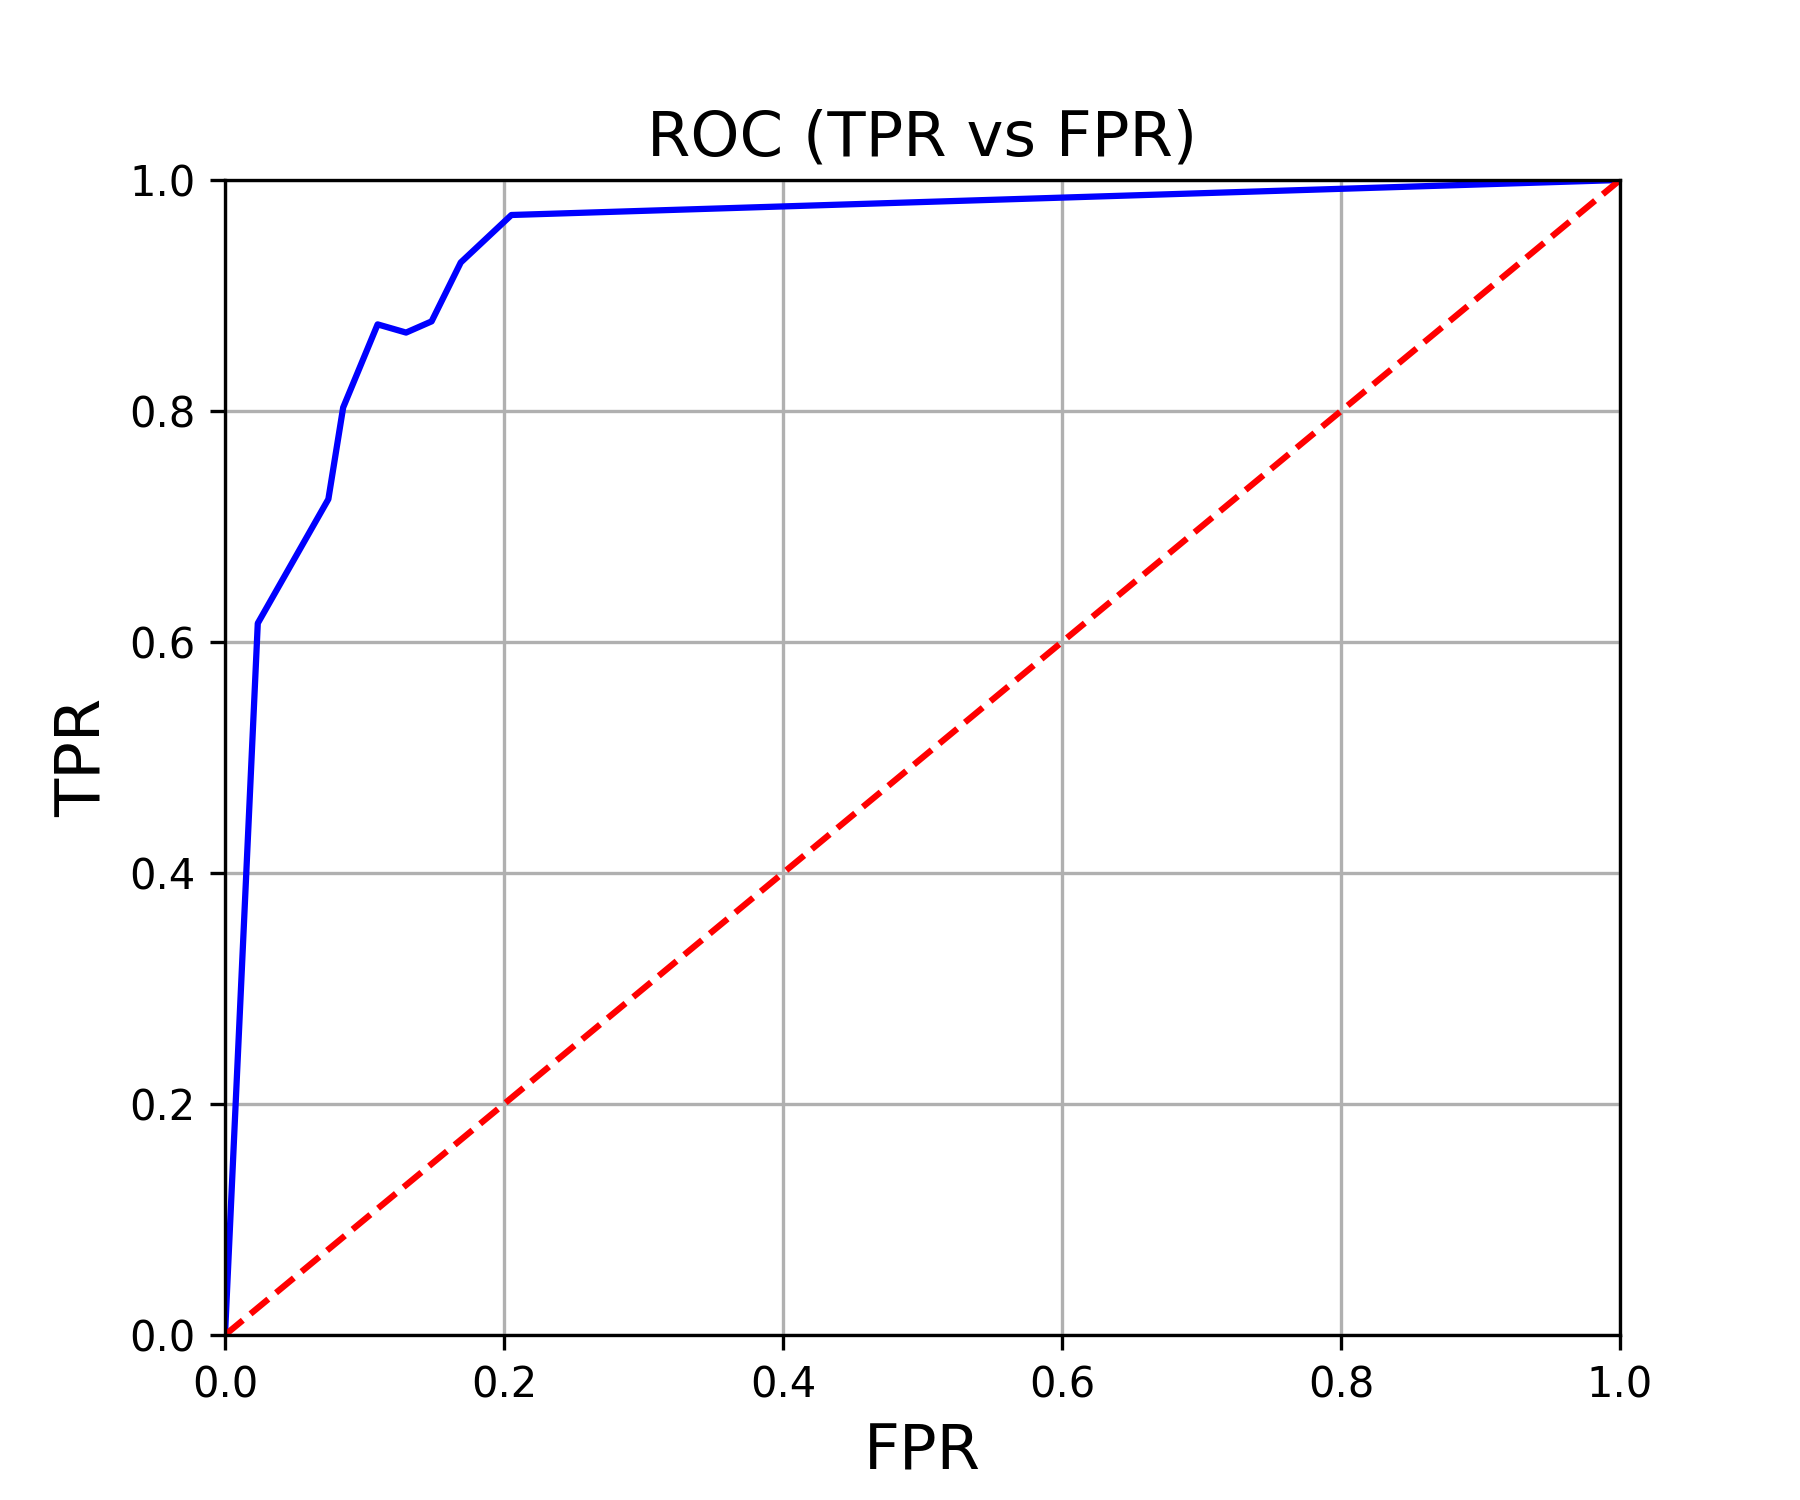
In order to test the generalizability of these computational models, we used the 10-fold cross-validation to test the classification accuracy of our models. In particular, we divided the dataset (n=1,840) into 10 folds of equal sizes, namely 184 data samples in each fold. The test set was chosen from folds 1 to 10, the validation set was chosen from the next fold, and the remaining data was used as the training set. The cross validation results are shown in Table 2 (the left side of each column is for Model 1 while the right side is for Model 2). Moreover, the receiver operating characteristic (ROC) curve of the true positive rate (TPR) versus the false positive rate (FPR), an important indicator in statistics, is plotted in Fig 6 to illustrate the first fold. For all the folds, we computed the test area under the curve (AUC) shown in Table 2. The average AUC is 89.66% (Model 1) and 91.04% (Model 2). Finally, we also compared the results of our models with the SVM, the logistic regression method from the Scikit-learn library 45, and other CNN models 20, 21, 22. The accuracy and the AUC for different models are shown in Table 3, which clearly shows that the results of our computational models are more accurate than the others.
| Test | Training | Accuracy | ||||||||
| fold | epochs | Training | Validation | Testing | AUC(%) | |||||
| 1 | 28 | 31 | 91.58 | 89.61 | 90.22 | 90.76 | 88.04 | 86.96 | 94.20 | 95.12 |
| 2 | 84 | 38 | 100.00 | 90.29 | 84.78 | 84.78 | 87.50 | 87.50 | 89.55 | 91.67 |
| 3 | 81 | 17 | 100.00 | 89.67 | 85.87 | 84.24 | 86.41 | 82.07 | 88.54 | 89.36 |
| 4 | 5 | 29 | 86.48 | 90.08 | 87.50 | 88.59 | 79.35 | 77.17 | 84.39 | 85.69 |
| 5 | 12 | 31 | 88.45 | 90.96 | 88.04 | 86.96 | 83.70 | 82.07 | 92.85 | 91.83 |
| 6 | 18 | 55 | 88.11 | 89.88 | 91.30 | 89.67 | 83.70 | 84.78 | 91.14 | 89.59 |
| 7 | 55 | 29 | 99.46 | 92.53 | 86.41 | 90.22 | 86.96 | 92.93 | 89.04 | 93.90 |
| 8 | 19 | 24 | 91.10 | 90.15 | 85.87 | 86.96 | 84.24 | 86.96 | 93.14 | 91.93 |
| 9 | 67 | 14 | 100.00 | 86.28 | 89.67 | 85.87 | 80.98 | 82.07 | 81.56 | 92.25 |
| 10 | 31 | 51 | 91.85 | 89.33 | 89.67 | 88.59 | 86.41 | 84.24 | 92.18 | 89.10 |
| avg | 40 | 32 | 93.70 | 89.88 | 87.93 | 87.66 | 84.73 | 84.68 | 89.66 | 91.04 |
5 Conclusion & discussion
In this paper, we have employed modern machine learning techniques to explore the relationship between pulse and pregnancy, which has been claimed to exist in TCM over a long history. Two computational models, based on the 1D CNN, have been developed and have shown that the best accuracy of pregnancy detection by PPW is 84% and the best AUC is 91%. The computational models we developed in this paper provide a rigorous and scientific approach to analyze the PPW data. This approach, based on deep learning, provides a systematic way to “learn" the correlation between the PPW data and pregnancy. Although this “learning" approach, similar to the Alpha-go 46, may not be able to understand the underlying biological mechanisms, this approach may be very helpful for the early diagnosis of various diseases such as cardiovascular disease in clinical practice. In order to achieve this long term goal, we need to deal with the following potential barriers in the current setup: 1) the data noise, and 2) the dataset size. Regarding the data noise, due to our straightforward and crude pulse acquisition equipment, the quality of the pulse waves is not satisfactory, so the measurement noise introduced during the collection needs to be quantified more carefully. As far as the dataset size, the current PPW dataset includes about 4,000 samples, which are not quite enough to train a high accuracy deep learning model. Our computational models will be further validated once more clinical data becomes available. We will also explore the correlation between the PPW and time series data, such as the PPW versus the size of arterial plaque, in the future.
6 Acknowledgements
This work is partially supported by the PSU-PKU Joint Center of Computational Mathematics and Applications. We would like thank Yuyan Chen, Juncai He and Xiaodong Jia for many helpful discussions and suggestions related to this paper and we would expecially like to thank the following people for their generous efforts and helps in collecting the PPW data: Gang Chen, Yujuan Chen, Jing Feng, Yanfeng, He, Yaping He, Bo Li, Zichun Lian, Shaobo Liang, Jenny Li, Jun Ma, Dandan Pang, Yanqiu Wang, Bo Yang, Duo Ye, Xiaofeng Zhang, and Shenglan Zhao.
References
- 1 Shu JJ, Sun Y. Developing classification indices for Chinese pulse diagnosis. Complementary therapies in medicine 2007; 15(3): 190–198.
- 2 Lu A, Jiang M, Zhang C, Chan K. An integrative approach of linking traditional Chinese medicine pattern classification and biomedicine diagnosis. Journal of ethnopharmacology 2012; 141(2): 549–556.
- 3 Arulkumaran N, Diwakar R, Tahir Z, Mohamed M, Carlos Kaski J, Banerjee D. Pulse pressure and progression of chronic kidney disease. JN journal of nephrology 2010; 23(2): 189.
- 4 Ghany MG, Doo E. Assessment of liver fibrosis: palpate, poke or pulse?. Hepatology 2005; 42(4): 759–761.
- 5 Safar ME, Levy BI, Struijker-Boudier H. Current perspectives on arterial stiffness and pulse pressure in hypertension and cardiovascular diseases. Circulation 2003; 107(22): 2864–2869.
- 6 Khalil A, Jauniaux E, Cooper D, Harrington K. Pulse wave analysis in normal pregnancy: a prospective longitudinal study. PloS one 2009; 4(7): e6134.
- 7 Tang AC, Chung JW, Wong TK. Digitalizing traditional chinese medicine pulse diagnosis with artificial neural network. Telemedicine and e-Health 2012; 18(6): 446–453.
- 8 Tang ACY, Chung JWY, Wong TKS. Validation of a novel traditional Chinese medicine pulse diagnostic model using an artificial neural network. Evidence-based complementary and alternative medicine 2012; 2012.
- 9 Sun Z, Yi J, Xi G. Multilevel neural network to diagnosis procedure of traditional Chinese medicine. In: Springer. 2005: 801–806.
- 10 Sutton-Tyrrell K, Najjar SS, Boudreau RM, et al. Elevated aortic pulse wave velocity, a marker of arterial stiffness, predicts cardiovascular events in well-functioning older adults. Circulation 2005; 111(25): 3384–3390.
- 11 Blacher J, Asmar R, Djane S, London GM, Safar ME. Aortic pulse wave velocity as a marker of cardiovascular risk in hypertensive patients. Hypertension 1999; 33(5): 1111–1117.
- 12 Blacher J, Safar ME, Guerin AP, Pannier B, Marchais SJ, London GM. Aortic pulse wave velocity index and mortality in end-stage renal disease. Kidney international 2003; 63(5): 1852–1860.
- 13 Wannenburg J, Malekian R. Body sensor network for mobile health monitoring, a diagnosis and anticipating system. IEEE Sensors Journal 2015; 15(12): 6839–6852.
- 14 Yoon G, Lee JY, Jeon KJ, et al. Multiple diagnosis based on photoplethysmography: Hematocrit, SpO2, pulse, and respiration. In: Optics in Health Care and Biomedical optics: Diagnostics and Treatment. 2002: 185–189.
- 15 Ko GKY. Method and apparatus for non-invasive diagnosis of cardiovascular and related disorders. 2000. US Patent 6,135,966.
- 16 Zhang Z. Photoplethysmography-based heart rate monitoring in physical activities via joint sparse spectrum reconstruction. IEEE transactions on biomedical engineering 2015; 62(8): 1902–1910.
- 17 Daimiwal N, Sundhararajan M, Shriram R. Respiratory rate, heart rate and continuous measurement of BP using PPG. In: IEEE. 2014: 999–1002.
- 18 Cui J, Tu Lp, Zhang Jf, Zhang Sl, Zhang Zf, Xu Jt. Analysis of Pulse Signals Based on Array Pulse Volume. Chinese journal of integrative medicine 2018: 1–5.
- 19 Zhang DY, Zuo WM, Zhang D, Zhang HZ, Li NM. Wrist blood flow signal-based computerized pulse diagnosis using spatial and spectrum features. Journal of Biomedical Science and Engineering 2010; 3(04): 361.
- 20 Hu X, Zhu H, Xu J, Xu D, Dong J. Wrist pulse signals analysis based on deep convolutional neural networks. In: IEEE. 2014: 1–7.
- 21 Zhang SR, Sun QF. Human pulse recognition based on convolutional neural networks. In: IEEE. ; 2016: 366–369.
- 22 Wang L, Wen D. Recognition of Arterial Pulse Wave of Pregnant Woman Based on Probabilistic Neural Network. In: IEEE. 2008: 1955–1958.
- 23 Krizhevsky A, Sutskever I, Hinton GE. Imagenet classification with deep convolutional neural networks. In: Advances in neural information processing systems. 2012: 1097–1105.
- 24 Karpathy A, Toderici G, Shetty S, Leung T, Sukthankar R, Fei-Fei L. Large-scale video classification with convolutional neural networks. In: Proceedings of the IEEE conference on Computer Vision and Pattern Recognition. 2014: 1725–1732.
- 25 Kim Y. Convolutional neural networks for sentence classification. arXiv preprint arXiv:1408.5882 2014.
- 26 Kalchbrenner N, Grefenstette E, Blunsom P. A convolutional neural network for modelling sentences. arXiv preprint arXiv:1404.2188 2014.
- 27 Hinton G, Deng L, Yu D, et al. Deep neural networks for acoustic modeling in speech recognition: The shared views of four research groups. IEEE Signal Processing Magazine 2012; 29(6): 82–97.
- 28 Abdel-Hamid O, Mohamed Ar, Jiang H, Deng L, Penn G, Yu D. Convolutional neural networks for speech recognition. IEEE/ACM Transactions on audio, speech, and language processing 2014; 22(10): 1533–1545.
- 29 Mnih V, Kavukcuoglu K, Silver D, et al. Human-level control through deep reinforcement learning. Nature 2015; 518(7540): 529.
- 30 Silver D, Schrittwieser J, Simonyan K, et al. Mastering the game of go without human knowledge. Nature 2017; 550(7676): 354.
- 31 Gulshan V, Peng L, Coram M, et al. Development and validation of a deep learning algorithm for detection of diabetic retinopathy in retinal fundus photographs. Jama 2016; 316(22): 2402–2410.
- 32 Liu Y, Gadepalli K, Norouzi M, et al. Detecting cancer metastases on gigapixel pathology images. arXiv preprint arXiv:1703.02442 2017.
- 33 Gong Y, Liu L, He X, et al. The th17/treg immune balance in ulcerative colitis patients with two different chinese syndromes: dampness-heat in large intestine and spleen and kidney yang deficiency syndrome. Evidence-Based Complementary and Alternative Medicine 2015; 2015.
- 34 Sandiford I. The effect of the subcutaneous injection of adrenalin chlorid on the heat production, blood pressure and pulse rate in man. American Journal of Physiology-Legacy Content 1920; 51(3): 407–422.
- 35 Wide L, Gemzell CA. An immunological pregnancy test. European Journal of Endocrinology 1960; 35(II): 261–267.
- 36 Liao YT, Chen HY, Huang CM, et al. The pulse spectrum analysis at three stages of pregnancy. The Journal of Alternative and Complementary Medicine 2012; 18(4): 382–386.
- 37 Soma-Pillay P, Catherine NP, Tolppanen H, Mebazaa A, Tolppanen H, Mebazaa A. Physiological changes in pregnancy. Cardiovascular journal of Africa 2016; 27(2): 89.
- 38 Shi Hz, Fan Qc, Gao Jy, et al. Evaluation of the health status of six volunteers from the Mars 500 project using pulse analysis. Chinese journal of integrative medicine 2017; 23(8): 574–580.
- 39 Bagha S, Shaw L. A real time analysis of PPG signal for measurement of SpO2 and pulse rate. International journal of computer applications 2011; 36(11): 45–50.
- 40 Das MK, Saha C, El Masry H, et al. Fragmented QRS on a 12-lead ECG: a predictor of mortality and cardiac events in patients with coronary artery disease. Heart Rhythm 2007; 4(11): 1385–1392.
- 41 He K, Zhang X, Ren S, Sun J. Deep residual learning for image recognition. In: Proceedings of the IEEE conference on computer vision and pattern recognition. 2016: 770–778.
- 42 He J, Xu J. MgNet: A unified framework of multigrid and convolutional neural network. Science China Mathematics 2019; 1-24.
- 43 Paszke A, Gross S, Chintala S, et al. Automatic differentiation in pytorch. 2017.
- 44 Kingma DP, Ba J. Adam: A method for stochastic optimization. arXiv preprint arXiv:1412.6980 2014.
- 45 Pedregosa F, Varoquaux G, Gramfort A, et al. Scikit-learn: Machine Learning in Python. Journal of Machine Learning Research 2011; 12: 2825–2830.
- 46 Silver D, Hubert T, Schrittwieser J, et al. A general reinforcement learning algorithm that masters chess, shogi, and Go through self-play. Science 2018; 362(6419): 1140–1144.