font=sf,small \captionsetup[figure]labelfont=bf,labelformat=default,labelsep=period, name=Figure
Global alignment of solution-based single-wall carbon nanotube films via machine-vision controlled filtration
Abstract
Over the past decade, substantial progress has been made in the chemical processing (chiral enrichment, length sorting, handedness selectivity, and filling substance) of single-wall carbon nanotubes (SWCNTs). Recently, it was shown that large, horizontally-aligned films can be created out of post-processed SWCNT solutions. Here, we use machine-vision automation and parallelization to simultaneously produce globally-aligned SWCNT films using pressure-driven filtration. Feedback control enables filtration to occur with a constant flow rate that not only improves the nematic ordering of the SWCNT films, but also provides the ability to align a wide range of SWCNT types and on a variety of nanoporous membranes using the same filtration parameters. Using polarized optical spectroscopic techniques, we show that meniscus combing produces a two-dimensional radial SWCNT alignment on one side of the film. After we flatten the meniscus through silanation, spatially-resolved nematicity maps on both sides of the SWCNT film reveal global alignment across the entire structure. From experiments changing ionic strength and membrane tribocharging, we provide evidence that the SWCNT alignment mechanism stems from an interplay of intertube interactions and ordered membrane charging. This work opens up the possibility of creating globally-aligned SWCNT film structures for a new-generation of nanotube electronics and optical control elements.
keywords:
Nematic ordering, 1D crystals, single-wall carbon nanotubesSignificant interest in one-dimensional (1D) nanocrystals (NCs) follows from their highly anisotropic properties of electrical and thermal transport, optical absorption, radiative emission, and conduction. Typically, physical attributes observed in these NCs are significantly enhanced along the extended 1D crystal axis relative to the short axes, the latter often serving to impose strict quantum mechanical boundary conditions on the band structure. Researchers have utilized the anisotropic nature of 1D NCs in polymer chains, liquid crystals, inorganic crystals, and carbonaceous ribbons (graphene, e.g.), and nanotubes to explore physically-interesting 1D behaviors like Luttinger liquids 1, 2, 3, time-reversal-invariant Majorana chains 4, 5, Wigner crystals 6, ultrastrong light-matter coupling 7, 8, high-harmonic generation 9, Aharonov-Bohm physics 10, 11, intersubband plasmons 12, and topological insulators 13. Additionally, 1D NCs have been envisioned in a wide range of technologically-important applications, such as high current-carrying capacity conductors 14, 15, rectifers 16, far-infrared polarizers 17 and detectors 18, gas and molecular sensing 19, 20, flexible electronics 21, photoelectron emission 22, and directional heat transport 23. Consequently, enhancing these anisotropic effects by aligning 1D NCs along a common axis via easy-to-control mechanical, electrical, or magnetic external forces is highly desirable. However, the high degree of van der Waals interactions per unit mass in these nanosystems promotes particle aggregation, which contributes to the difficulty in creating globally-aligned macroscopic films of 1D NCs.
Among the major 1D NC groupings, single-wall carbon nanotubes (SWCNTs) are particularly difficult to reproducibly align, especially after they have gone through solution-based processing. Despite the well-known challenges involved in nanotube preparation, strong interest remains in working with SWCNTs due to their unique band structures and exemplary physical properties 24. Substantial research into chemically processing SWCNTs to achieve and enhance these superlative behaviors has produced significant breakthroughs in chiral and type enrichment 25, 26, 27, 28, length sorting 29, tube filling with atoms and molecules 30, 31, 32, 33, 34, and handedness selectivity 35, 36. Alignment of nanotubes along a preferred direction has also been achieved, but often with significant caveats or over a limited scope. Researchers have used a variety of techniques to align nanotubes including non-chiral-enriched, vertically-oriented SWCNT forests 37, 38, mechanical pulling of polymers 39, electrostatic-enhanced dropcast films 40, magnetic alignment 41, nanowire self assembly 42, and feedstock-driven growth 19, 43. Recently, a significant step forward in SWCNT alignment was taken when He et al. 44, 45 demonstrated that SWCNTs formed along a particular axis when a nanotube solution was slowly filtered through a hydrophilic, polyvinylpyrrolidone (PVP)-coated nanoporous membrane. This observation allows researchers to produce well-aligned polarized SWCNT films after solution-based chemical processing (e.g., chiral enrichment or length sorting). Unfortunately, this technique is challenging to reproduce and even more difficult to scale up, which has hindered its widespread adoption. Furthermore, previous research with and on aligned SWCNT films claim global alignment, a statement challenged by the absence of a true macroscopic characterization technique, as well as a complete reliance on single-side film measurements.
In this Letter, we use an automated and parallelized filtration system to reproducibly and simultaneously create multiple highly-aligned, solution-based SWCNT films, thus allowing us to explore a large set of chemical and physical parameters under well-controlled conditions. Using machine vision, we both measure and control the filtration flow rate for different filter membrane pore sizes by monitoring the solution meniscus and regulating the transmembrane pressure. This automated feedback loop produces a constant filtration flow rate, which not only improves SWCNT alignment, but also enables this technique to be easily applied to different varieties of synthesized SWCNTs. Additionally, we use a combination of polarized optical techniques and glass silanation to discover and remove the formation of a meniscus-created radial SWCNT alignment. Spatial mapping of both sides of the SWCNT film using polarized Raman scattering shows a two-dimensional nematic ordering parameter, , of 0.9 throughout the film, which unambiguously demonstrates true global alignment from solution-based SWCNTs. Finally, based on experiments tuning the electrostatic environment, we propose that charge ordering on the filter membrane is one of the driving forces involved in the spontaneous alignment of SWCNTs along a common axis.
To prepare our individualized SWCNT solution for filtration, we use Carbon Solutions (Riverside, CA) P2 arc-discharge SWCNTs (lot# 02-A011), which are dispersed via tip sonication 46 in 20 g/L sodium deoxycholate (DOC) in H2O and then centrifuged to remove non-SWCNT contaminants. To mitigate discrepancies between water- and non-water-filled SWCNTs, we used nanotubes filled with C7H16 34. Next, a rate-zonal centrifugation method is applied to sort the nanotube solution to remove bent and very short SWCNTs. At the end of this multi-step procedure 32, which also includes removal of solution components other than H2O, DOC, and SWCNTs via ultrafiltration and increasing the SWCNT concentration, we have a mixed-chirality SWCNT solution composed of long, straight tubes, in 10 g/L DOC, which are ideal for this alignment technique. Before filtration, the SWCNT dispersion is diluted to have a DOC concentration of 0.03 wt.% and an approximate SWCNT concentration of 8 g/mL, which was determined through optical density measurements.
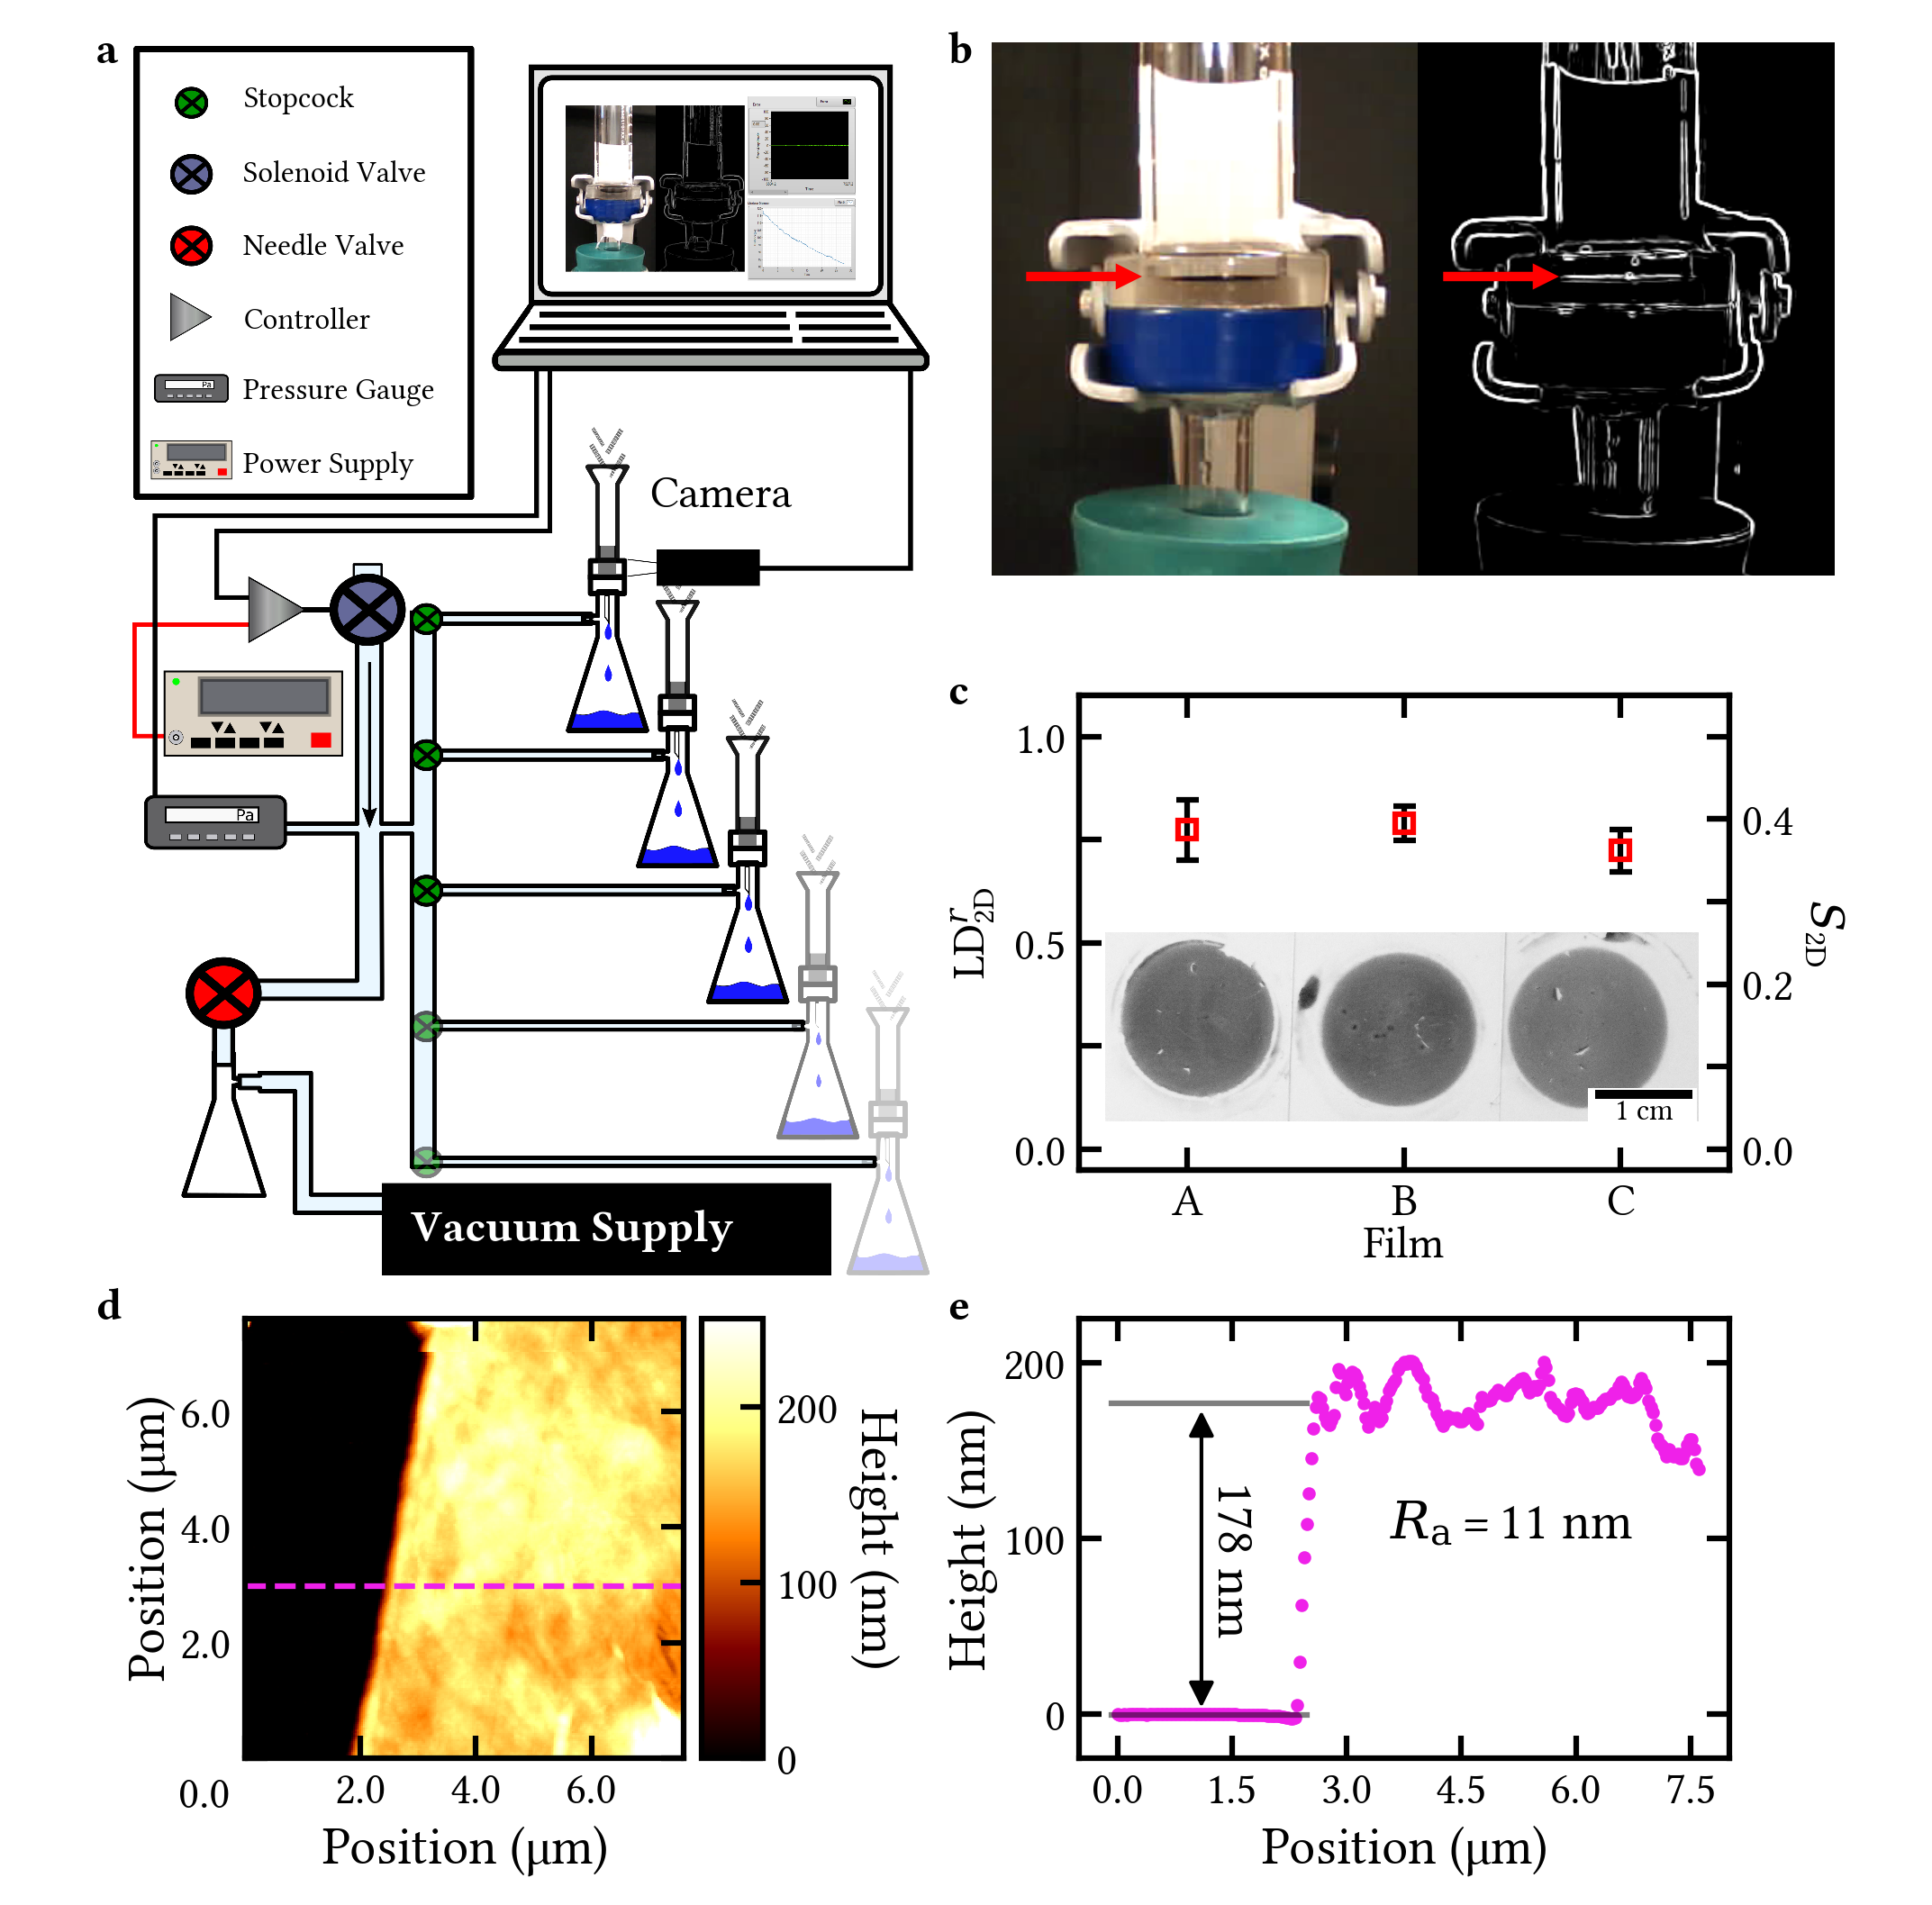
To automate the filtration setup shown in Figure 1a, we developed software to detect, numerically fit, and control the edge of the SWCNT solution meniscus. Meniscus detection and tracking was performed using an adaptable detection algorithm to convert the real image to an edge outline, as shown in Figure 1b. We developed software to numerically fit the meniscus edge from this outline, which significantly reduced fluctuation-created false positives. Because the meniscus is tracked as a function of time, it serves as a measure of flow rate. Pressure is maintained via a PID-controlled variable leak using a proportioning solenoid valve with an applied source vacuum of 28.8 kPa. Accurate and precise (2 Pa) applied pressure control is achieved across a broad pressure range of over four orders of magnitude from 3 Pa to 6000 Pa. The pressure is increased at the end of the filtration process to dry the film and prevent disrupting the still-wet SWCNT structure.
Besides eliminating human control from the alignment process, our machine vision-based SWCNT film configuration easily allows for production upscaling. As detailed in Figure 1a, although just one filtration rig (‘master’) is monitored, multiple films are simultaneously produced by putting filtration assemblies in parallel. Since each parallelized assembly is nearly identical to the master rig, excellent alignment for several SWCNT films is achieved. As an example of this high degree of uniformity achieved by our system, we show in Figure 1c three films simultaneously produced in our parallelized system, which have nearly identical 2D nematic ordering (). We use as a measure of SWCNT alignment in our films throughout this work (measurement details described below, in Figures S1 and S2, and the corresponding Supplementary Information text). As seen in Figures 1d and e, the SWCNT films are 17811 nm thick (in this paper, uncertainty is reported as standard deviation), which is on the order of the length of one nanotube (200 nm to 400 nm). Nanotube film thicknesses on this order (and smaller) are often treated as 2D constructs, because of the dimensionality of their physical properties 47. We note that the film thicknesses measured here are on the high end of the thickness spectrum compared to those reported by prior groups 44, 48, thus supporting our claim of excellent global alignment over a substantial SWCNT deposition amount.
The combination of automation and parallelization enables us to produce multiple copies of aligned films under a wide range of different physical and chemical conditions. Previous SWCNT alignment protocols have been unable to achieve a constant filtration flow rate, which results in a time-varying SWCNT cake (i.e., film during filtration; Figure S4a) deposition rate, thus hindering optimal SWCNT alignment. In order to achieve a constant filtration flow rate, which is expressed as a permeation flux, (), we first had to empirically determine the membrane resistance, , and cake resistance, :
| (1) |
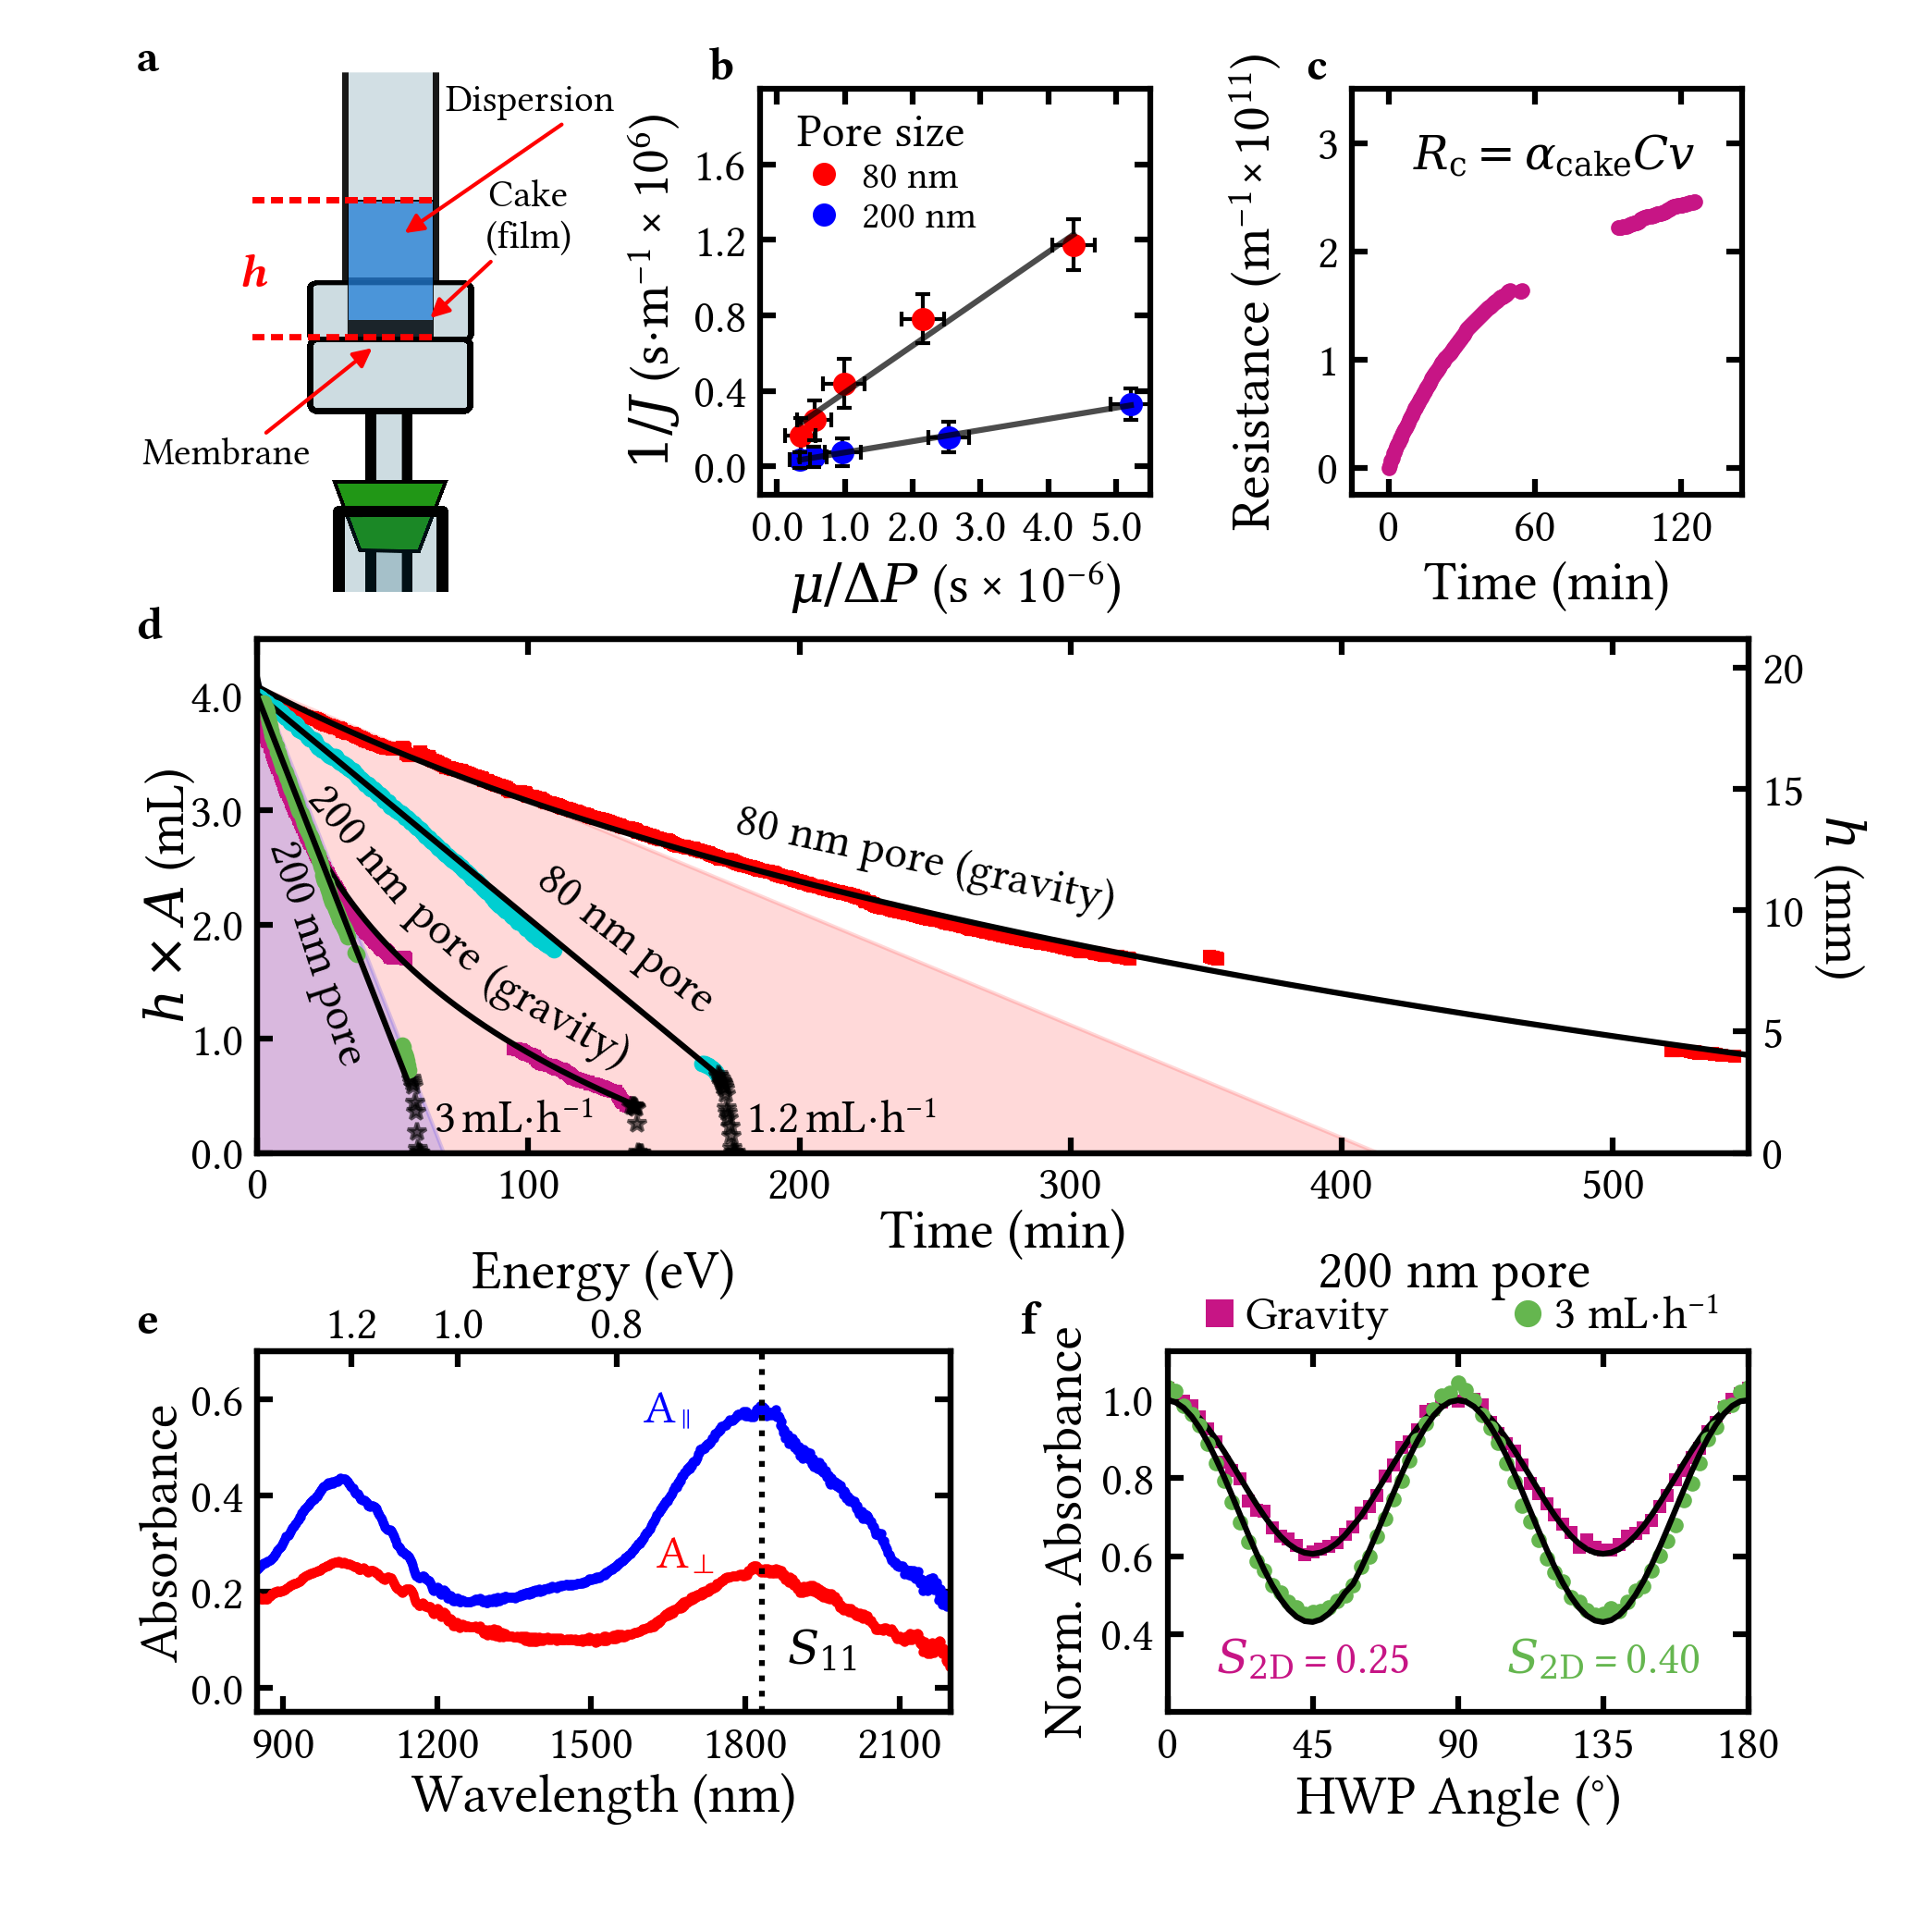
where is the viscosity of the permeate (SWCNT solution), is transmembrane pressure, and with as the specific cake resistance, the dispersion concentration, and the filtrate volume per unit area (see Figure S3 for information about the measurement of ). , which is independently measured through a controlled water filtration experiment shown in Figure S4b, is 2.51011 m-1 for the 80 nm pore-size membrane and 3.81010 m-1 for the 200 nm pore-size membrane. While is nearly constant throughout the filtration process, increases with time as the cake is deposited, which is shown in Figure S4c. Using our determination of the time-independent and the time-dependent , we can then tune throughout the film deposition to keep constant. It should be noted that is the total (time-dependent) transmembrane pressure, which is the sum of the applied pressure, , and the head pressure, , where is the dispersion mass density, is gravitational acceleration, and is the time-dependent solution column height.
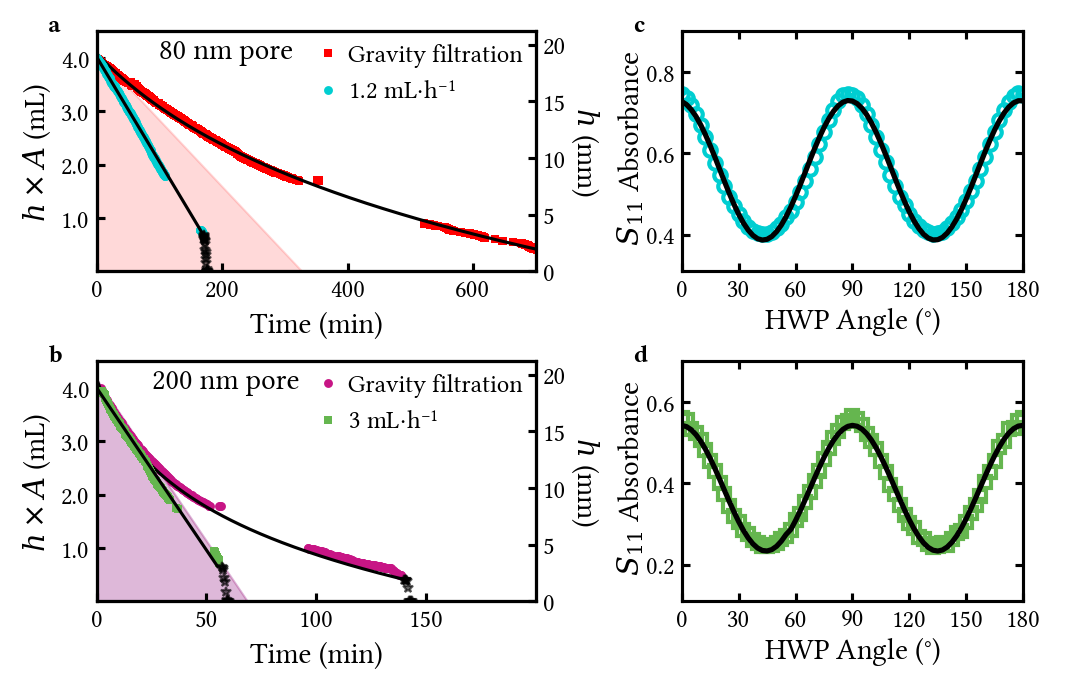
Figure S4d shows our ability to achieve a constant flow rate for two membrane pore sizes (80 nm, cyan trace; and 200 nm, green trace) throughout the entire film deposition process. The gravity-driven filtration (i.e., no applied pressure; red and purple traces) curves demarcate the slowest flow rate possible in our system with a specific , while the colored regions (pink and purple for 80 nm and 200 nm pore-size membranes, respectively) indicate the possible range of flows accessible when external pressure is applied (see Figure S4 for a more-detailed view of Figure 2d). The high value of for the 80 nm pore-size membrane allows for a greater variability of the flow rate, but often at lower values of . Critically, the procedure that we delineate here, measuring and and then tuning to maintain a constant , means that we can apply the parameters described in this work (flow rate, DOC concentration, SWCNT concentration, etc.) to different SWCNT types (laser oven, HiPCO, CoMoCAT, arc discharge, etc.) and membranes with differing pore sizes and materials. As such, our procedure greatly broadens the applicability and utility of this filtration-based alignment method.
Throughout this Letter, we use several optical spectroscopic techniques to determine for our SWCNT films after they have been transferred to either a glass coverslip or quartz substrate (see Figure S5 for details regarding the film transfer). Since SWCNTs have a highly anisotropic absorption coefficient, , polarized optical spectroscopic techniques are commonly used to measure nematicity in SWCNTs. Although these methods are not without their limitations, they provide a straightforward way to measure . In this work, we rely on three polarized optical methods to determine nematicity: reduced linear dichroism, , polarized Raman scattering (Figure S1), and birefringence ratios (Figure S2), whose precise formulations are given in the Supplementary Information. The guiding principle behind all three methods, however, is graphically captured by Figure S4e, which shows that when the optical electric field is parallel to the SWCNT axis, the on-axis absorption coefficient, , is high; in contrast, when the electric field is orthogonal to the SWCNT axis, the off-axis absorption coefficient, , is suppressed. Depending on the optical technique, we either rotate the light polarization angle using a half-wave plate (HWP), or keep the light polarization fixed and rotate the SWCNT film; in both cases, and are probed.
Figure S4f compares the LD of films made via gravity-driven filtration (purple) and using a constant flow rate filtration (green). Although the absorption used to calculate is composed of both SWCNT and non-SWCNT components that are not related to excitonic transitions (thus, underestimating the true value of ), it is very clear from this figure that greater alignment (i.e., a higher value) is achieved when the flow rate is fixed. Thus, in addition to improving reproducibility and allowing us to generalize our parameters to other SWCNT types, precise control of the pressure to make the flow rate constant also greatly enhances SWCNT nematicity.
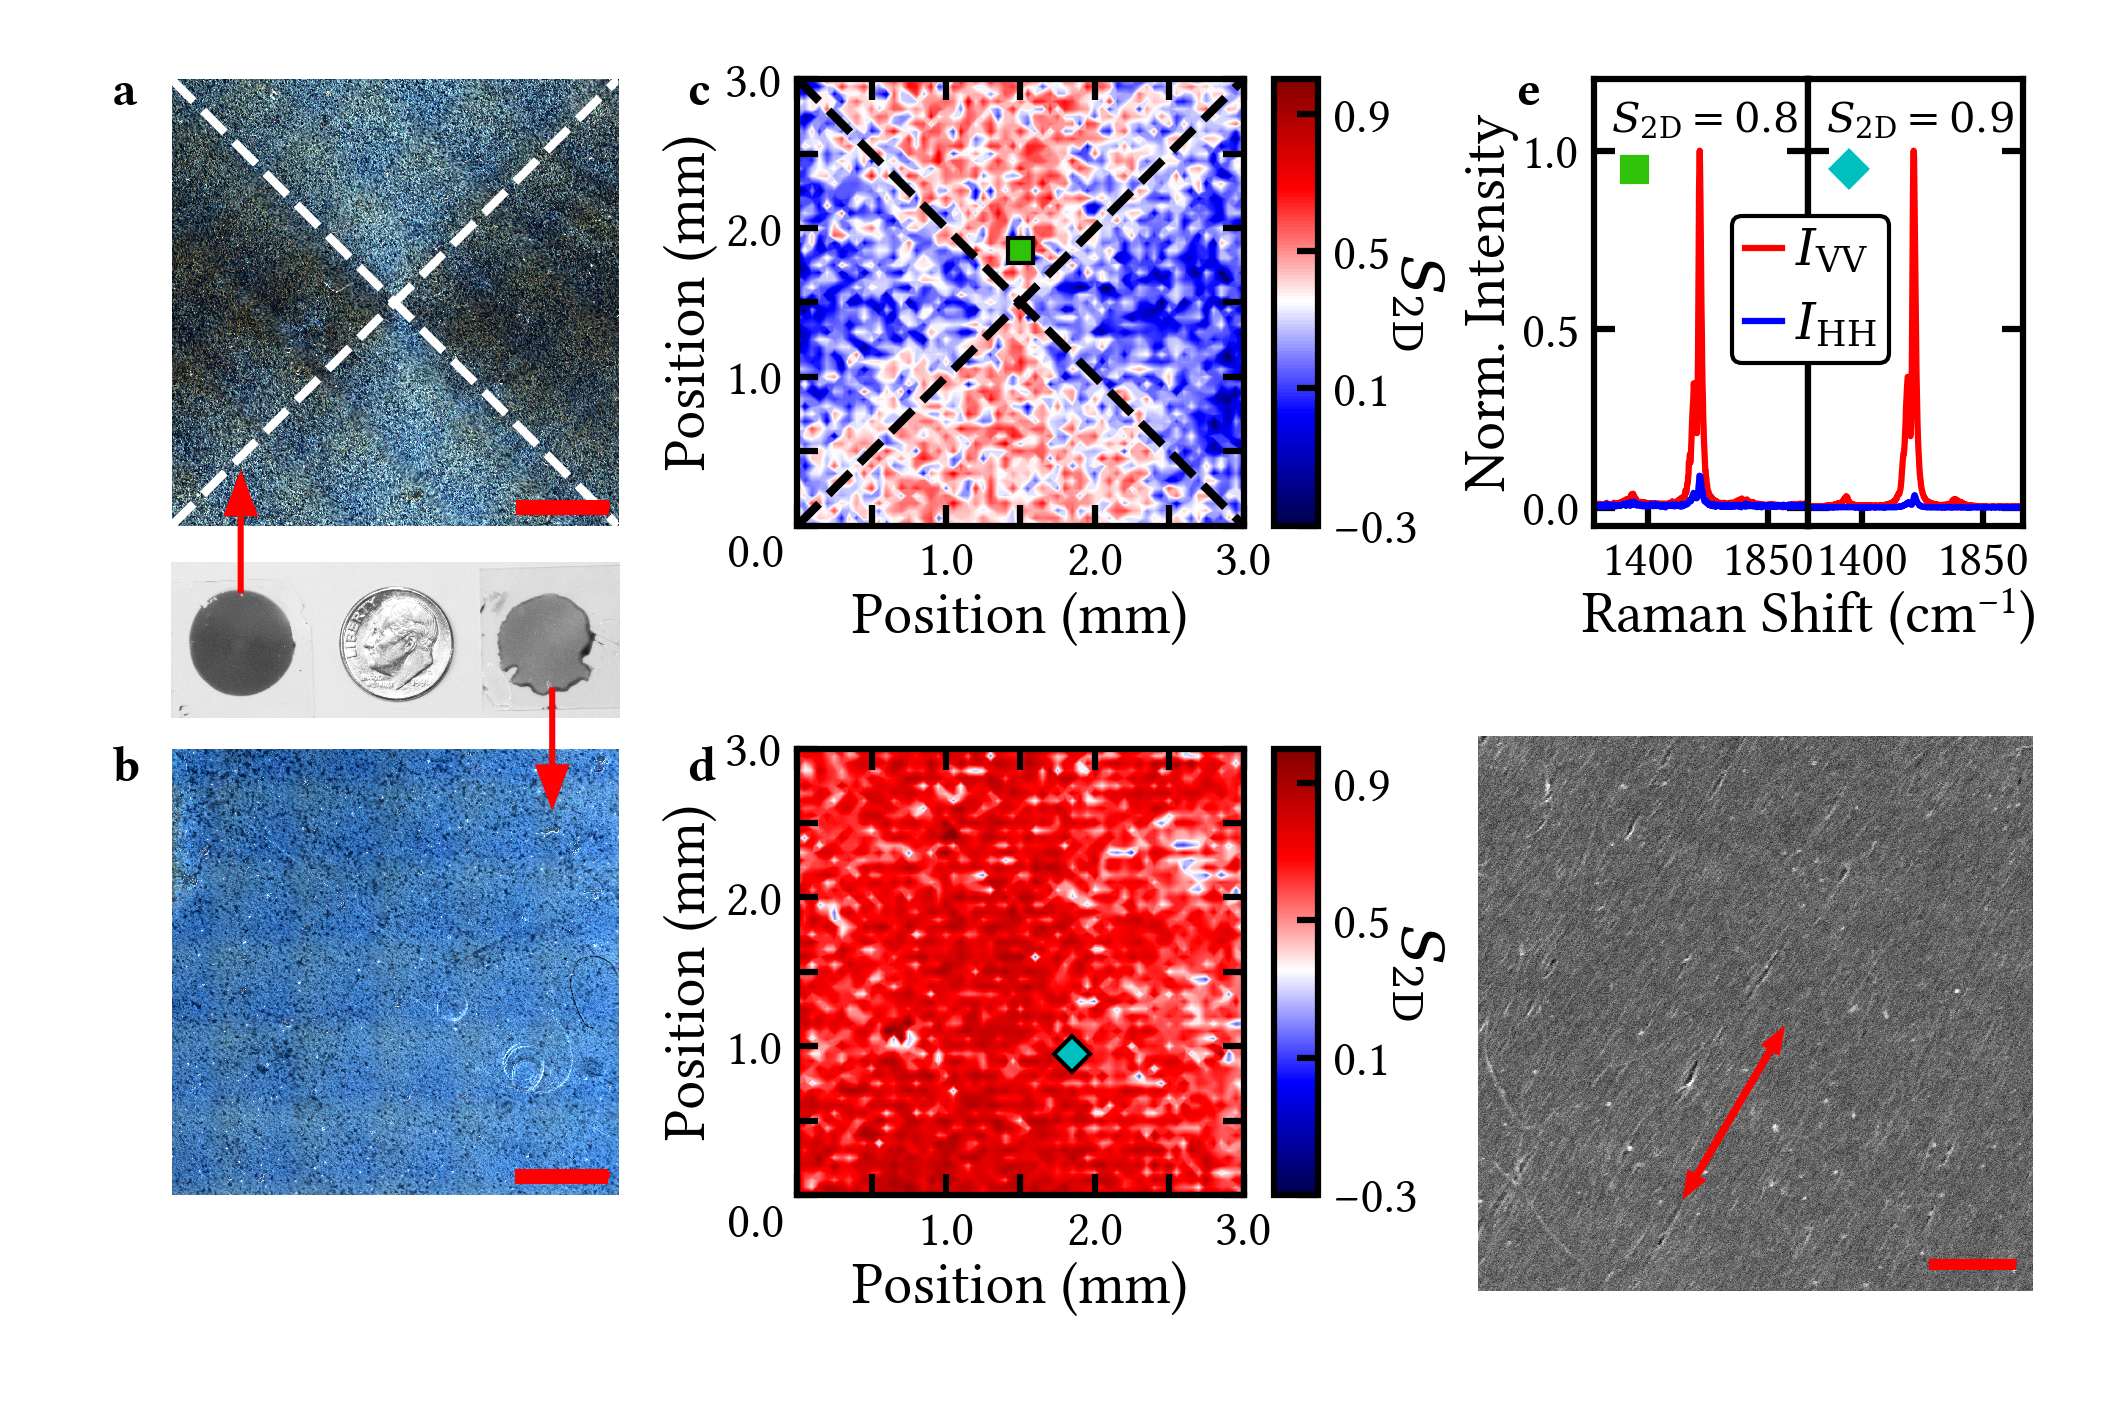
Along with flow rate control, we also detect and address a previously unreported effect in SWCNT films created by the meniscus of the SWCNT dispersion during filtration. Specifically, our use of spatially-resolved polarized optical techniques, such as birefringence and polarized Raman scattering mapping, reveals the presence of a radial SWCNT alignment on the front surface of our films (i.e., the side that faces upward during filtration). This type of alignment (at least in three dimensions) is known as a spherulite and is commonly observed in films of 1D crystals when the solution meniscus combs (or drags) across the film surface, which produces a force director that radially polarizes the crystals (Figure 3c). As Figures 3a and d clearly indicate, we observe this radial alignment on the surface of our SWCNT films due to meniscus combing during the final stages of our filtration; we refer to this feature as a 2D spherulite. To remove this meniscus-created radial orientation, we increased the hydrophobicity of our filtration glassware using a silanation procedure (see Figure S6 and the associated text in the Supplementary Information for details). This technique greatly flattens the meniscus and prevents it from dragging across the SWCNT cake at the end of filtration (Figure 3c). Figures 3b and e show the results of flat-meniscus filtration. In stark contrast to the traditional SWCNT alignment method, the nanotubes on both sides of the film are well ordered (see Figures S7 and S8 for Raman maps of both front and back film surfaces). Importantly, this double-sided alignment extends across large distances, which demonstrates global SWCNT nematic ordering.
Interestingly, depending on the thickness of the film, the skin depth of the optical probe, and whether the probe measures reflection or transmission, the use of polarized optical spectroscopy may not unambiguously detect the presence of a 2D spherulite. This point is strengthened when one remembers that after the film is transferred from the membrane to a substrate, the front film surface during filtration is now the back film surface for optical measurements, which may not always be as well measured as the front surface. Figures 3f and S7c capture the non-obvious signature of the 2D spherulite behavior: although is clearly increased when the 2D spherulite is removed through silanating the glassware, the effect on the measured nematicity is not huge. Only through the careful spatial mapping of both SWCNT film surfaces does the radial polarization, and thus lack of global ordering, appear. The high degree of alignment across the non-spherulite film is additionally supported through direct imaging techniques like scanning electron microscopy (Figure 3g), which clearly indicates excellent SWCNT alignment.
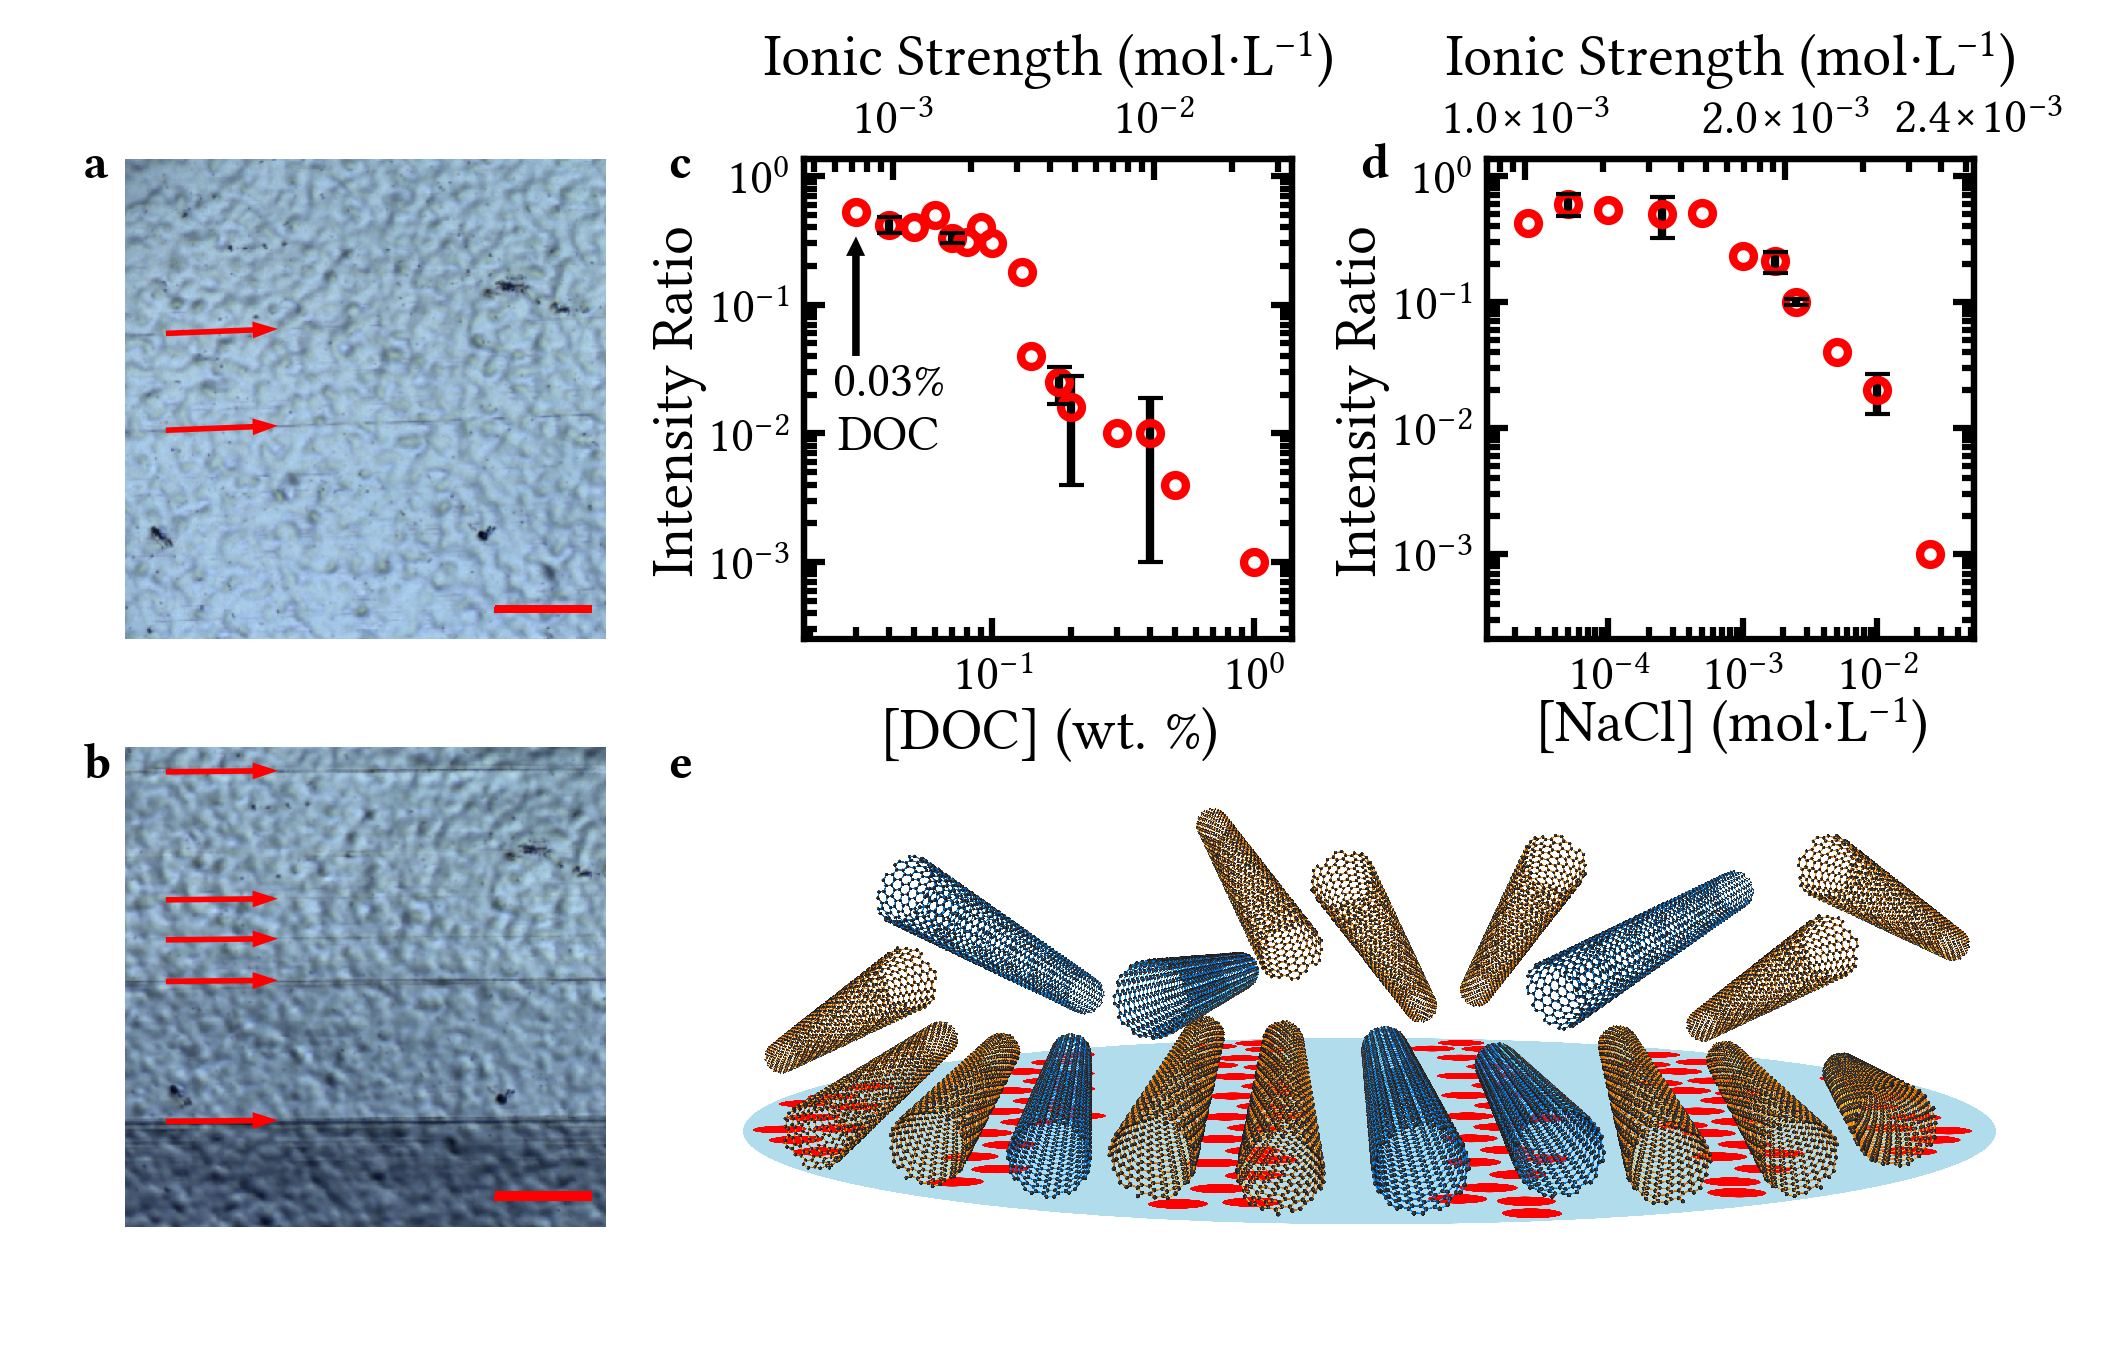
We also investigated the SWCNT alignment mechanism using our automated filtration system with the previously described improvements to the alignment protocol. Figure 4a shows grooves in the filter membrane created during the manufacturing process. Although these grooves are not uniformly spaced or appropriately sized for the nanotubes we are using, they still raise an important question about whether or not they play a role in nanotube alignment. To help address what part, if any, these channels play in nanotube alignment, we augment the grooving by sweeping an ethanol-wetted wipe across the top surface of the filter membrane along the initial groove direction (Figure 4b) prior to filtration. As shown in Figure S9, the ethanol-wiped filter membrane increases the SWCNT film alignment considerably going from a of 0.26 to 0.52. To distinguish between whether the increased membrane grooving or electrostatic charging (or both) are primarily responsible for the enhanced SWCNT nematicity, we swept a filter membrane with a wipe wetted with water and another with ethanol (Figure S9) and showed that increased from 0.27 for the SWCNT film made from water-wiped membrane to 0.42 with the ethanol-wiped membrane. This enhancement strongly suggests that ordered charging, instead of mechanical grooving, is responsible for increased SWCNT alignment. We note that a similar increase in SWCNT alignment was observed in self-assembled SWCNT nanowires when the glass substrates were directionally wiped with ethanol 42.
Along with charging the membrane, inter-SWCNT electrostatic interactions are the other major factor determining . As shown previously 44, the DOC concentration of the SWCNT solution strongly impacts the achievable (Figure 4c), because the Debye interaction length between SWCNTs decreases with increasing DOC coverage of the nanotube. The measured scaling with DOC concentration strongly guided our decision to use solutions with 0.030 wt.% DOC concentration, which is over an order of magnitude below the critical micelle concentration 49, 50. Further experiments using NaCl to tune the ionic strength confirm that as the tube-tube electrostatic interactions decrease due to increased screening, the SWCNT nematicity plummets (Figure 4d).
The strong role played by directional tribocharging and inter-tube electrostatics suggest that linear arrays of charges are accumulating on the membrane, as depicted in Figure 4e. Although mechanical membranes grooves may play a minor role in nanotube alignment, the large size of the grooves, lack of groove uniformity, and their relative irregularity all suggest that they are not directly responsible for SWCNT alignment. Instead, we propose that the wiped filter membranes acquire some small net charge that is linearly arranged, which in combination with tube-tube interactions, creates alignment along a common axis. Given the estimated net charge magnitude on the filter membrane, it is unsurprising that this charge-directed alignment is quite easy to destroy, as seen by small changes in the ionic strength of the SWCNT solution. Directional charging has been observed in a host of situations by numerous researchers, including efforts to pattern surface charges 51, 52 and to align particles via electrostatic puddling 53. Further work on how to enhance and control charge arraying on filter membranes is ongoing.
In summary, we have created an automated, parallelized SWCNT filtration system that can create simultaneous and reproducible SWCNT films with a high degree of true global alignment. We find that holding the filtration flow rate constant using our pressure-controlled system enhances the nematic order of our films. In addition, we both measure and remove 2D spherulite formation on the front-surface of the SWCNT films by flattening the meniscus using silanated glassware. We propose that directional charging on the filter membrane and inter-SWCNT electrostatic interactions are the two driving forces behind the alignment of nanotubes using this filtration technique. Our innovations on the SWCNT filtration method, as well as the results described here, pave a clear path for both research- and industrial-scale implementation of highly aligned SWCNT films from aqueous solutions.
The authors thank Dr. Joseph R. Murphy for his input on the machine-vision implementation and AFM data processing, and Dr. John Ackerman for his help with the glassware silanation. TAS acknowledges funding from the W. M. Keck Foundation, and JSW and WDR acknowledge funding from the School of Energy Resources at the Univ. of WY.
Supplemental information
S1 Preparation of single-wall carbon nanotube (SWCNT)
dispersions
Alkane-filled SWCNT dispersions were generated in the manner of Campo et al. 34. Briefly, electric arc-synthesized SWCNTs (Carbon Solutions, Riverside CA, P2 grade, lot# 02-A011) were incubated in neat n-heptane (EMD Millipore) for 12 hours, which filled the entire nanotube population with the alkane. After incubation, the \ceC7H16@SWCNT powder was filtered against a membrane (VVLP, 0.1 m, Millipore) and allowed to fully dry at room temperature.
The \ceC7H16@SWCNT soot was dispersed in multiple 40 mL aliquots via tip sonication (45 minute, 0.9 W/mL), in each case with the vial in an ice-water bath at a nominal concentration of 1 mg/mL of SWCNTs in 20 g/L sodium deoxycholate (DOC, Sigma BioXtra) in water solution. Initial purification on the combined aliquots was performed via centrifugation in a J2-21 high-speed centrifuge (JA-20 rotor, 1885 rad/s (18 kRPM), 2 hours), after which the resulting supernatant was collected. This sonicated-centrifuged dispersion was subsequently layered (8.2 mL) above a dense race layer (28 mL) comprised of 10 wt./v% iodixanol (Sigma, sold as Optiprep) and 10 g/L DOC for rate-zonal purification (VTi 50 rotor, 5236 rad/s (50 kRPM), 2 h 45 minute, 20∘C) in a Beckman L80-XP ultracentrifuge collecting the main band in the center of the tube after centrifugation. Stirred ultrafiltration cells (Millipore) were used to both reduce the iodixanol concentration to 1 g/mL and to concentrate the SWCNT dispersion to 1 mg/mL in 10 g/L DOC solution as determined by absorbance spectroscopy using an extinction coefficient of 2.1 A mg/mL mm at 850 nm.
S2 Details of the filtration system
The filtration assembly consisted of three main components: the borosilicate funnel (15 mL), the stainless steel (SS) mesh frit (25 mm), and the borosilicate glass frit support. The assembly also used a spring-loaded clamp for securing the funnel in place, a silicone stopper, and two PTFE gaskets, one of which is used under the SS frit, and the other placed on top of the wetted, hydrophilic membrane.
Once the filtration system is assembled and connected to a Büchner flask for vacuum filtration, a vacuum source is attached and a 28.8 kPa pressure is applied. The source vacuum is then regulated through the use of a needle valve and proportioning solenoid valve (PSV), which acts as a controllable leak. The PSV (normally closed) runs on a 16 V-source voltage, which is controlled using a separate 5 V-modulated controller via a computer-controlled digital-to-analog converter. The PSV and a digital pressure gauge are used to control the pressure of the system. Through the use of stopcock valves, we are then able to implement parallel assemblies that can be turned on or off as desired.
Various pore sizes of wetted, hydrophilic polyvinylpyrrolidone (PVP)-coated membranes 44 are then used for carrying out the experiments described in the main text. 4 mL of a SWCNT dispersion is carefully pipetted into the assembly funnel, so as to not mechanically disturb the individualization of SWCNTs 54. The desired pressure(s) to be applied for controlled flow rate are then loaded into the software program, and the program is started. The region of interest in the camera image of the filtration assembly is selected such that the triggering event will occur when the remaining volume is near 0.7 mL. When the trigger event occurs, the pressure is increased such that the flow rate falls between 10 mL/h to 15 mL/h 44; this accelerated pressure is indicated with stars in Figure 2d of the main text and Figures S4a and b.
To implement machine-vision detection of the meniscus, a few modifications were made to the assembly to allow the software to easily and readily identify edges and discontinuities. These changes to the system included: masking the back of the filtration funnel with white vinyl tape, masking the frit support with blue vinyl tape, and placing the assembly in front of a black backdrop. The blue, white, and black colors create contrast, which clearly defines the edges for detection and tracking. The white tape masking the back of the funnel was chosen to provide contrast between different SWCNT dispersions and the funnel itself, the blue tape defines the bottom edge of the funnel, and the black backdrop defines the outline of the funnel. These differences are seen in Figure 1b of the main text.
S3 Polarization-sensitive optical characterization
For optical characterization a number of different polarized methods were used including: linear dichroism, spatially-resolved Raman spectroscopy, and birefringence microscopy.
S3.1 Polarized absorbance
In the case of polarized absorption, we utilize the anisotropic absorbance of SWCNTs to quantify . Since the absorption coefficient of a excitonic transition, , is fully realized only when the incident optical field is parallel to the SWCNT, we can define two absorption coefficients, and , corresponding to the two physical extremes of the incident field parallel and perpendicular, respectively, to the SWCNT axis. In the main text, we used 2D reduced linear dichroism, , to estimate the two-dimensional nematic order parameter, . Following Katsutani et al.55, we define as:
| (2) |
where
| (3) |
S3.2 Spatially-resolved polarized Raman spectroscopy
In measuring spatially-resolved polarized Raman spectroscopy, a five-axis stage is used: three of the axes are controlled via linear actuators, while the other two axes are used to adjust pitch and yaw to correct for sample tilt. For spatial mapping, we take points in 50 m steps over a 3 mm 3 mm area. A Mitutoyo, long-working distance, 50x objective with an estimated spot size of 1 m is used to focus and collect Raman scattering from a 532 nm continuous-wave excitation source. Spectra were resolved on a 750 nm blazed, 1200 grooves/mm grating using a 320 mm Isoplane spectrometer and a LN2-cooled Si CCD (all from Princeton Instruments).
To determine using polarized Raman spectroscopy, we use the following equation: 56
| (4) |
Here, , , are taken to be the integrated intensity of the G band, and is the dichroic ratio , while VV, VH, and HH define the orientation of the incident and analyzed polarization with respect to the SWCNT alignment axis, respectively. The orientations are either parallel, parallel (VV), parallel, perpendicular (VH), or perpendicular, perpendicular (HH).
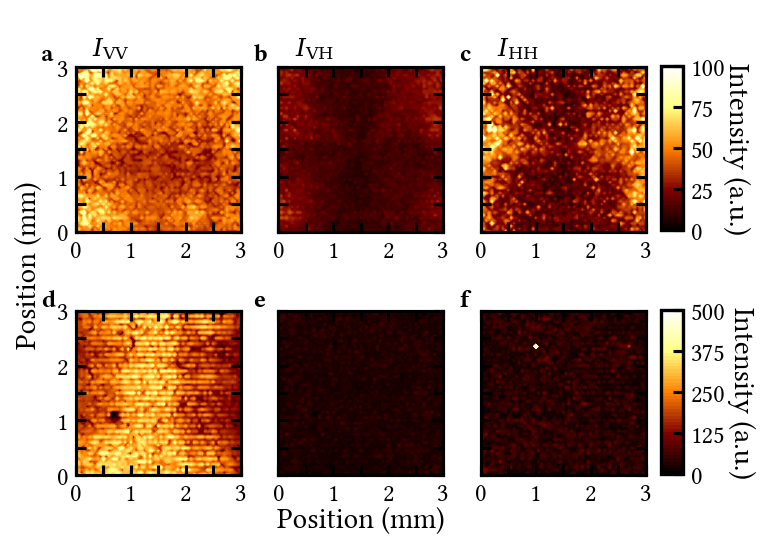
When carrying out this measurement, the stage is moved to an initial starting point, (0,0), where a polarized absorption measurement is taken. This measurement consists of rotating a half-wave plate (HWP), thus changing the orientation of the incident linear polarization to determine the SWCNT alignment axis, as well as to measure . The two angles of the HWP that yield and are then used as the positions that define the incident polarization orientations for scanning over the sample. Before starting the 2D scan over the sample, the incident power is measured at the sample for both angular positions and is then held constant for the duration of the measurement. Results from this method can be seen in Figure S1 where the individual 2D maps (, , and ) show the integrated intensity of the G-band for the calculation of for Figures 3d and e in the main text. Interestingly, the radial polarization causing the formation of the 2D spherulite can be distinguished in the map of the SWCNT film.
S3.3 Polarized microscopy and the birefringence intensity ratio
The final characterization technique that we used was birefringence microscopy. This method provides a very fast and simple characterization technique that can be used to accurately estimate . The images acquired via this technique are shown in Figure S2. These collected images (without contrast enhancement) are then converted to a gray scale image where pixel values range from 0 to 1. Using these gray scale images, an average pixel intensity is then determined for the image from which a ratio, , can be calculated:
| (5) |
where corresponds to the average pixel intensity of the image collected from the HV case, and corresponds to the average pixel intensity of the image collected from a 45 degree rotation of the sample.
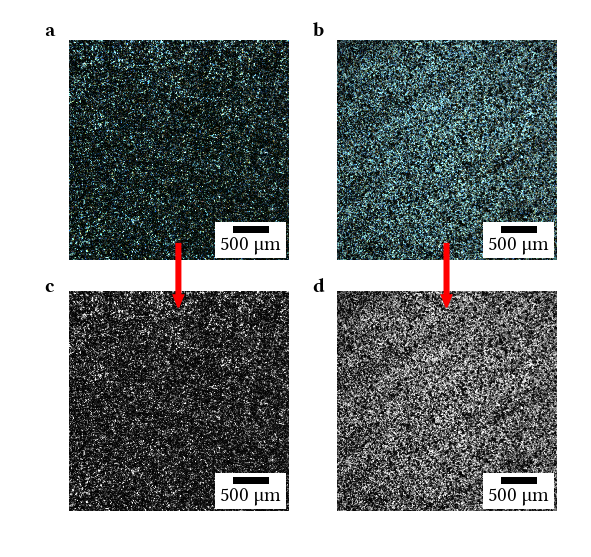
Using this intensity ratio, we are able to quickly make an estimation regarding the overall alignment of the film in both reflection and transmission. The real strength of this method lies in the ability to do this without having to transfer the film to a substrate, i.e., while it is still on the membrane. For the set of images shown in the figure, was determined to be , indicating that in this region of the film there is a relatively high degree of alignment. For films that to not exhibit any alignment, values are found to be well below pointing to the accuracy of this method.
S4 Flow rate control
As shown in the main text, creating a constant flow rate increases SWCNT alignment using small diameter membranes. Since different SWCNTs will pack differently into the film, and one of the main strengths of this method is that dispersions can be chirally separated prior to filtration, being able to control the flow rate without having to monitor drip rates allows for quick tuning of the flow rate to achieve high, global degrees of alignment.
To control the flow rate we first determine the resistance to filtration caused by the membrane, . To do this we start with Equation 1 in the main text:57
| (6) |
where is the permeation flux, is the viscosity of the permeate (SWCNT solution), is specific cake resistance, is slurry concentration, is filtrate volume per unit area, and is the sum of applied pressure, , and the head pressure, , which is equal to , where , , and are the density, acceleration due to gravity, and the height of the meniscus, respectively. The cake resistance, , is used as a substitution in this equation such that .
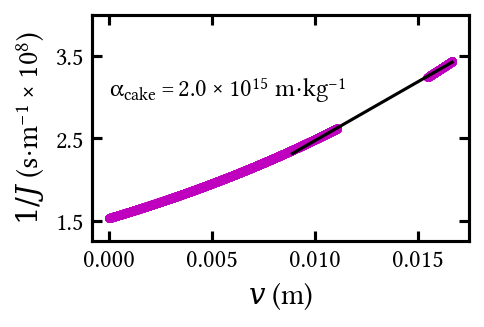
To determine (Figure 2b of the main text), we ran 4 mL of water through our filtration system at a constant pressure and room temperature. For this condition, Equation 6 then becomes
| (7) |
since no cake is being formed in this process . Data is collected by tracking the height of the meniscus, as a function of time, which is used for determining the volume and , where is the filter area (2.18 cm2).
This process is repeated for a number of different values and then plotted, as shown in Figure 2b of the main text. From this data, we are able to extract the value of for both the 80 nm and 200 nm pore size membranes.
To determine the specific cake resistance, , a similar process is carried out. However, instead of using water, we use a SWCNT dispersion with a DOC concentration of 0.03 wt.%, a SWCNT concentration of 8 g/mL (estimated via optical density), and a constant applied pressure at room temperature. Due to the fact that we are at such low surfactant and SWCNT concentrations, we assume that the viscosity is very near that of water (8.9 Pas) at room temperature.
In this case, the collected data is plotted as the reciprocal of the permeation flux as a function of permeate volume per unit area, as shown in Figure S3. From Equation 6, the slope of the best fit line is directly proportional to . The fit is taken in the most linear region, near the end of the data set, since in the beginning of the filtration process there is little to no cake formed on the membrane. Therefore, the cake filtration regime does not occur until nearly the end of the filtration process57.
To the best of our knowledge, this value for is the first report of specific cake resistance for SWCNTs. Since no values for SWCNTs are available, we use specific cake resistances from multi-wall carbon nanotubes (MWCNTs) as a means of comparison. Interestingly, is an order of magnitude larger than 58, a difference we attribute to the high density packing of SWCNTs compared to MWCNTs afforded by the smaller SWCNT diameters. The increased packing results in a low cake porosity57 and thus a higher value. Although this work is still ongoing, we have already observed that there is a significant change in between rate zonal- and semiconductor-sorted SWCNTs, which we attribute as before to differences in average diameter.
Given the values found for and , a desired as a function of time is then fed into the model where the necessary to achieve a constant is calculated. Experimental results from this method can be seen in Figures S4a and b, where the model produces the desired flow rates of 1.2 mLh-1 and 3 mLh-1, respectively.
S5 Transfer of SWCNT films to a substrate
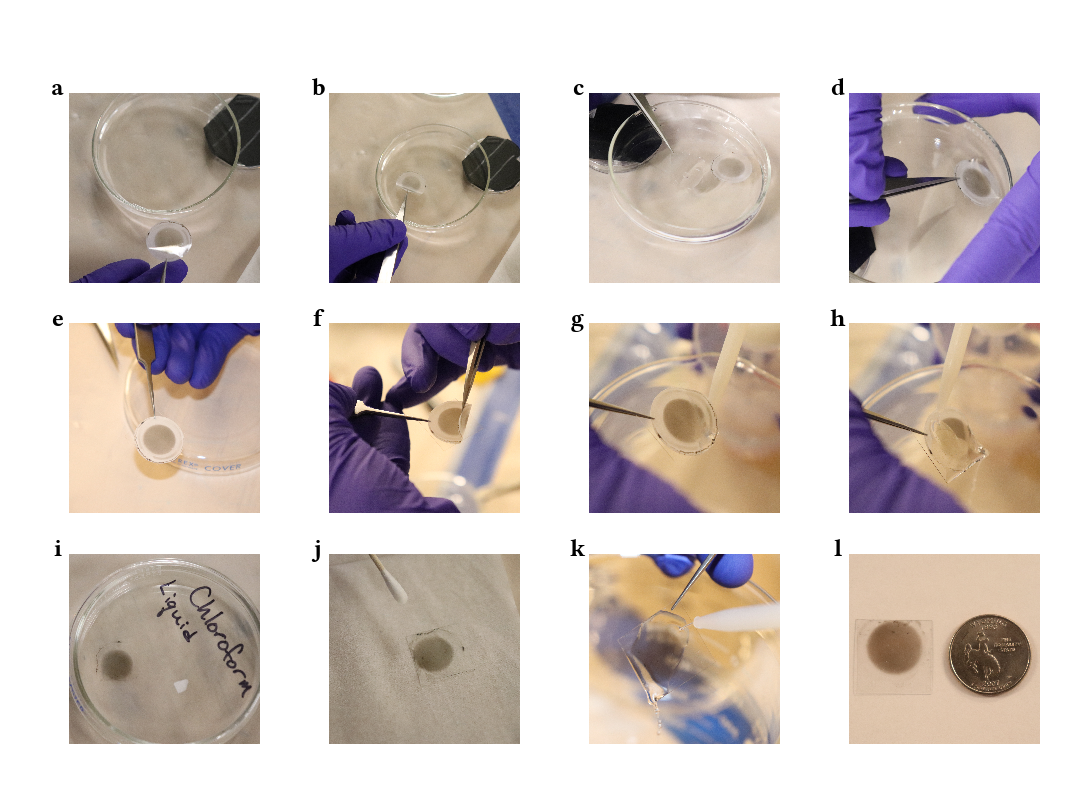
In order to make transmission optical measurements, we needed to transfer the film from the nanoporous membrane to an optically-transparent substrate. Once the film has been dried with the accelerated flow rate, the film is allowed to finish drying in air until the residual liquid has evaporated, a process that typically takes a few hours (see Figure S5a). The film is then placed film side down on the surface of water in a Petri dish and allowed to float (Figure S5b). Depending on the measurement, a glass cover slip is used as the substrate and submerged in the water and placed under the film on the surface (Figure S5c). Prior to submersion, the cover slip is first rinsed in ethanol and then in filtered water. The film is floated onto the surface of the substrate (Figure S5d) and removed. Excess water is shaken off the cover slip, and the film and cover slip are allowed to dry completely in air until the membrane has adhered itself to the glass surface. This step can take anywhere from two to eight hours; in general, it is left overnight to dry. A photo of the dry film can be seen in Figure S5e.
A corner of the membrane is then slightly lifted, enough to get a wash bottle tip under the membrane. A wash bottle tip with chloroform is then placed underneath the lifted corner and chloroform is lightly sprayed under the film (Figure S5g). This step permanently adheres the film to the glass surface. Chloroform is then sprayed over the top of the membrane until the majority of the membrane has dissolved (Figure S5h). The film and substrate are then submerged in a liquid chloroform bath and soaked for 10 minutes and removed (Figure S5i). The sample is removed, and a cotton swab wetted with 4 wt.% DOC is used to remove the excess SWCNT from around the film. A final chloroform spray (Figure S5k) is used to remove the remaining traces of the membrane. The film is lightly rinsed with acetone to check for residual membrane and then finally rinsed with water and blow dried with dry air. A transferred film created with this process is shown in Figure S5l. We note that sometimes residue (clumps) remain on the back of the substrate, which can be removed with a DOC-wetted cotton swab.
We find that using this reproducible method for transferring SWCNT films allows for the film to remain intact. From other methods that have been attempted, it is very difficult to keep the film entirely adhered to the substrate in a reproducible manner. While a risk still remains that the film detaches in places causing rips or holes in the films, we find that partial detachment is greatly reduced with our transfer method.
Other film transfer methods were also tested before we settled on the aforementioned procedure. For instance, when we submerged the films in either n-methylpyrrolidone (NMP) or chloroform, especially using glass substrates, we found that pockets of gas formed at the interface of the film and substrate. After the membrane had been significantly removed, these pockets rupture leaving large gaps in the films, making a majority of the area unusable for further experiments. Another group has reported using a combination of NMP vapor and heated NMP which may produce an equally robust transfer method 59. However, when we tried a process involving a similar combination of chloroform vapor and room temperature chloroform, we found the process to be unreliable.
The main difference we found between the use of NMP and chloroform was the rate at which the membrane dissolves. In chloroform, the reaction is very fast, while in NMP (at room temperature), it is much slower. It was also noted that using non-preserved chloroform can be catastrophic to the success of film transfer. The reaction seems slightly slowed by the ethanol preservative found in most commercially-available chloroform, and this slowed rate seems to be beneficial in preserving the film during the transfer process.
S6 Silane treatment of glassware
In the main text, we discussed the implications of meniscus combing on the surface of the SWCNT film, which was shown to prevent global SWCNT alignment. We found that this happened in a number of different ways. Depending on the surfactant concentration, as well as the final filtration speed, concentric rings would form, seemingly following the meniscus. As the meniscus contacts the SWCNT film, a circle forms on the surface of the film where the liquid in the meniscus has already been pulled through the membrane and film leaving a visible, nearly dry area when taking a top-down perspective. As filtering continues, this dry circular area grows in a radial manner, pulling the top layer of the SWCNT film with it. This pinning of the meniscus to the SWCNT film is what we believe leads to the 2D spherulite formation.
Many attempts at preventing meniscus combing were made including: increasing and decreasing the accelerated final flow rate, adjusting the initial temperature of the SWCNT dispersion (to either increase or decrease the viscosity of the dispersion), and changing the surfactant concentration (to again increase or decrease the viscosity of the dispersion). We found that none of these methods produced adequate results and that either concentric rings formed in the film or a radial polarization of SWCNTs emerged in the upper film layer.
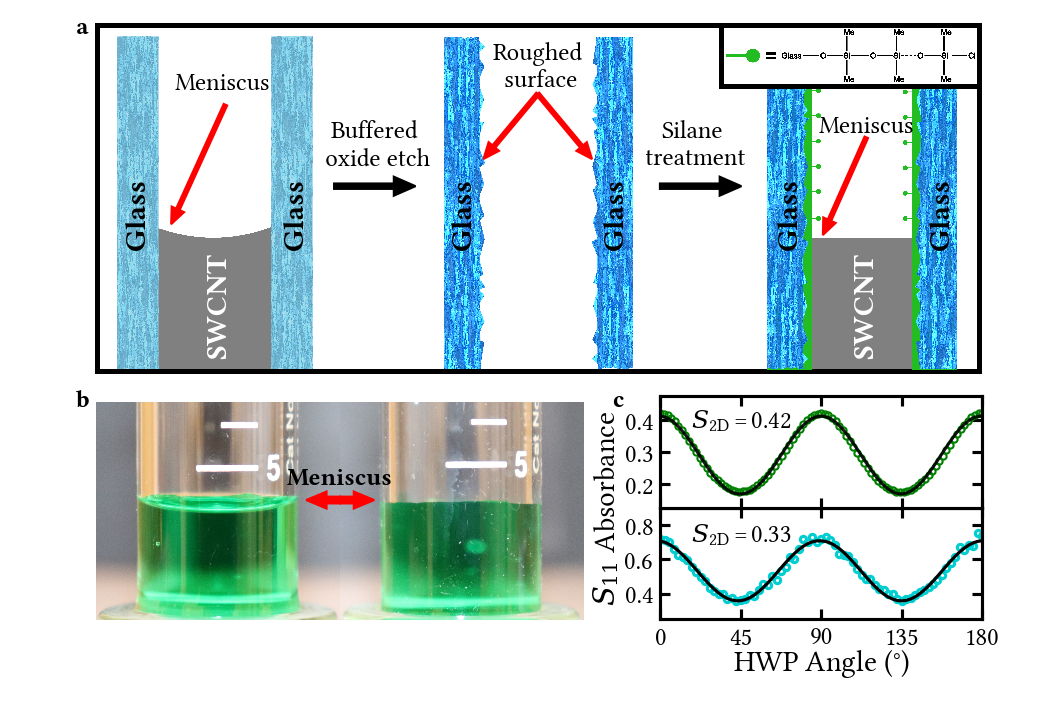
To eliminate this problem directly, we removed the concave meniscus all together from the glassware funnel. Meniscus flattening was done via the use of a silane treatment of the funnel. This methodology effectively coated the surface of the funnel with a short polymer of dimethylsiloxane and produced a super-hydrophobic surface inside the assembly funnel. In Figure S6a, we show a step-by-step schematic of the process, followed by pictures of the meniscus before and after the silane treatment (Figure S6b).
The step-by-step procedure for silane treatment is as follows:60
Step I: Clean the glass surface. We used an organic solvent (acetone) and \ceH2O to wash the glass surface. After rinsing, dry air was used to mitigate any evaporative residue caused by the acetone. The funnel was then rinsed thoroughly with nano-pure \ceH2O and again blow dried with dry air.
Step II: Chemically etch the glass surface. For etching, a buffered oxide etchant was used (10:1 ammonium diflouride) at room temperature. A plastic beaker was placed on a stir plate with magnetic stir bar and the funnel was submerged for three minutes and removed, followed by an extensive water rinse. This step roughens the glass surface at the micron level increasing the total surface area for a more effective silane treatment.
Step III: Glass steam treatment. A steam treatment was then used to incorporate more \ceH2O into the glass. This process was performed using a hot plate, bell jar, and beaker of \ceH2O. The beaker, along with the funnel, are placed on the hot plate and covered with the bell jar, while the beaker is in direct contact with the hot plate and the funnel is placed on an insulating block. Heat is applied to boil the water and create a steam bath inside the jar. 500 mL of \ceH2O was used and heated until all the water had evaporated. Since the \ceH2O molecules in the glass are one of the primary reactants in the process, we found this step to be helpful in obtaining a long-lasting silane treatment. Once the water has completely evaporated, we allowed the funnel to completely cool back to room temperature before beginning the next step.
Step IV: Silane reaction. In a fume hood, the glass funnel is placed inside a vacuum desiccator along with a cleaned petri dish with 3 mL of 5 wt./v% dimethyldichlorosilane in heptane (\ceC2H6Cl2Si) solution. The desiccator is then connected to a vacuum pump, and a vacuum is applied until the silane solution boils. The chamber is sealed, the vacuum pump is removed, and the reaction is allowed to take place overnight.
Step V: Glassware final cleaning. After the reaction has had an ample amount of time to take place, the desiccator seal is broken and left open for a few minutes while remaining silane vapors evacuate the chamber. Upon removing the funnel, it is rinsed in \ceH2O to remove any reactive chlorosilane ends of the polymer 60. The funnel is then cleaned with methanol and the process is complete.
The difference in the meniscus is quite striking. As seen in Figure S6b, the image of the meniscus in the funnel prior to silanation, and the meniscus in the same funnel taken after the silane treatment has been completed. The volume in both images is equivalent (4 mL). Food coloring was added to H2O to provide contrast in the images.
S7 Spatially-resolved Raman mapping of the SWCNT films
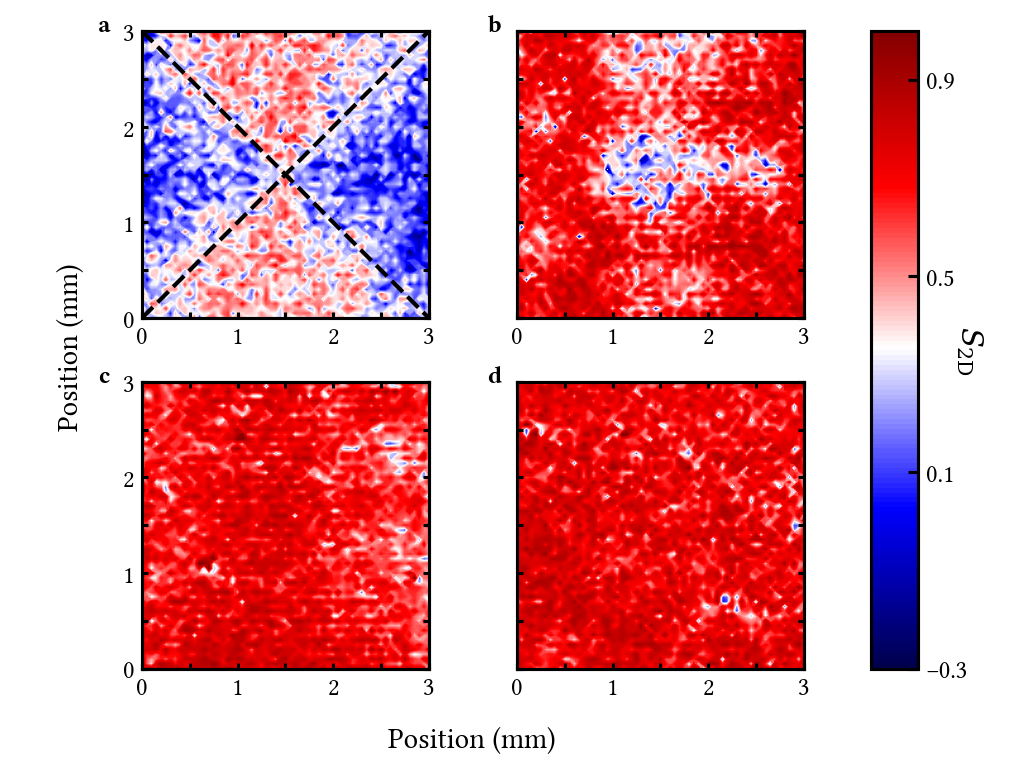
As discussed in the main text, meniscus combing in non-silanated glassware affects the top side of the aligned SWCNT film. Because of the film transfer process, this radial SWCNT alignment ends up on the back side of the SWCNT film when placed on a spectroscopically-appropriate substrate. Here, we show that the radial alignment of the SWCNTs created by meniscus pinning does not extend to the other side of the film. In fact, as shown in Figure S7, 2D spherulite formation is only observed on the side of the film that was in contact with the meniscus. Critically, in the silanated case, the SWCNT alignment extends to both sides of the film, which supports our claim of global alignment.
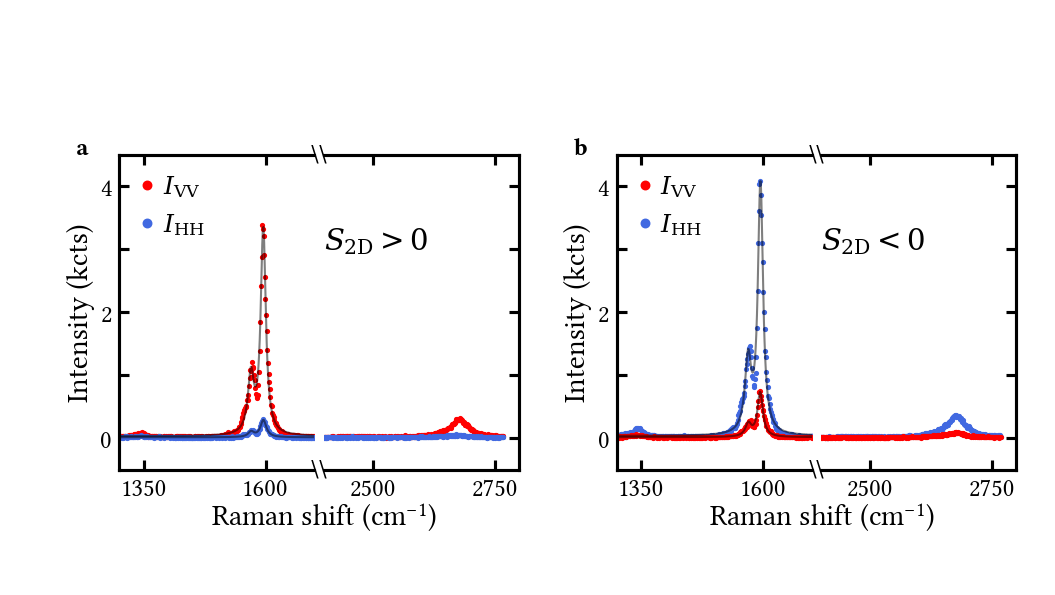
In Figure S8, individual spectra are extracted from the 2D mapping data shown in Figure S7a from both the red and blue regions. These spectra clearly demonstrate that the overall nematicity is not constant. In fact, in the blue regions, the nematicity is nearly perpendicular to that of the nematicity of the red sections, further showing the importance of using large-area optical techniques for determining global alignment.
S8 Membrane pretreatment
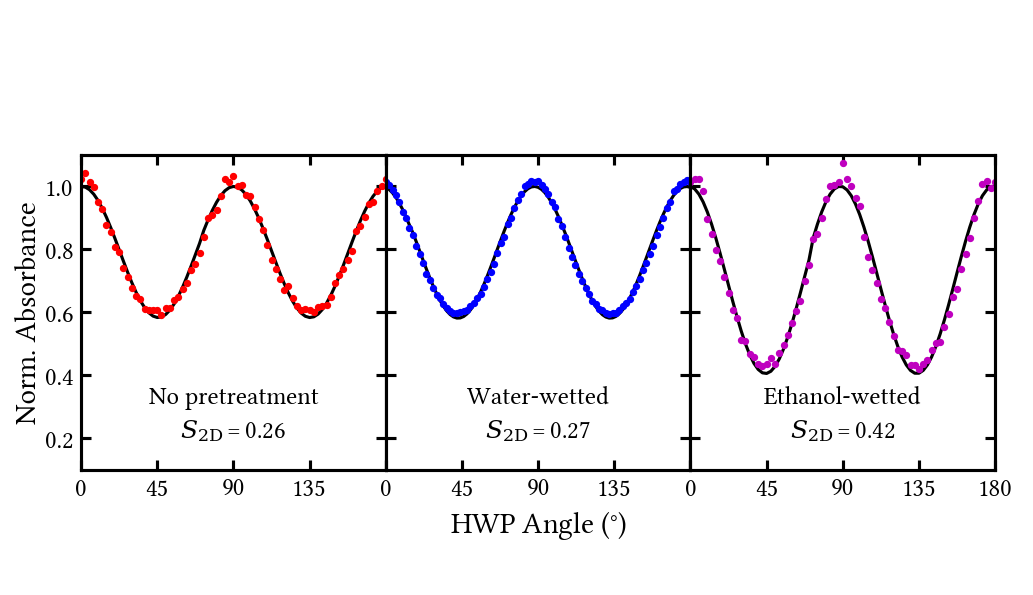
As can be seen in Figures 4a and b, the PVP-coated nanoporous membranes used for filtration possess a naturally-occurring grooved pattern. It was first thought that these grooves may be contributing to the alignment, providing mechanical trenches in which the SWCNTs could fall into and provide the initial aligned layer. However, these trenches are significantly larger than the SWCNTs, suggesting the mechanical effect of these grooves is much smaller than electrostatic forces. To determine if this grooving had an effect on SWNCT alignment, we swept both a water- and ethanol-wetted wipe across the membrane surface along the direction parallel to the production-made grooves shown in Figure 4a. As seen in Figure S9, despite the same mechanical action, it is only when the ethanol-wetted wipe is used that any increase in is achieved. This observation strongly suggests that preferential electrostatic charging, instead of mechanical grooving, is responsible for SWCNT alignment using this filtration method.
References
- Voit 1995 Voit, J. One-dimensional Fermi liquids. Rep. Prog. Phys. 1995, 58, 977
- Bockrath et al. 1999 Bockrath, M.; Cobden, D. H.; Lu, J.; Rinzler, A. G.; Smalley, R. E.; Balents, L.; McEuen, P. L. Luttinger-liquid behavior in carbon nanotubes. Nature 1999, 397, 598–601
- Shi et al. 2015 Shi, Z.; Hong, X.; Bechtel, H. A.; Zeng, B.; Martin, M. C.; Watanabe, K.; Taniguchi, T.; Shen, Y.-R.; Wang, F. Observation of a Luttinger-liquid plasmon in metallic single-walled carbon nanotubes. Nature Photonics 2015, 9, 515
- Fidkowski and Kitaev 2010 Fidkowski, L.; Kitaev, A. Effects of interactions on the topological classification of free fermion systems. Phys. Rev. B 2010, 81, 134509
- Fidkowski and Kitaev 2011 Fidkowski, L.; Kitaev, A. Topological phases of fermions in one dimension. Phys. Rev. B 2011, 83, 075103
- Deshpande and Bockrath 2008 Deshpande, V. V.; Bockrath, M. The one-dimensional Wigner crystal in carbon nanotubes. Nature Phys. 2008, 4, 314
- Gao et al. 2018 Gao, W.; Li, X.; Bamba, M.; Kono, J. Continuous transition between weak and ultrastrong coupling through exceptional points in carbon nanotube microcavity exciton-polaritons. Nature Photonics 2018, 12, 362
- Ho et al. 2018 Ho, P.-H.; Farmer, D. B.; Tulevski, G. S.; Han, S.-J.; Bishop, D. M.; Gignac, L. M.; Bucchignano, J.; Avouris, P.; Falk, A. L. Intrinsically ultrastrong plasmon-exciton interactions in crystallized films of carbon nanotubes. Proc. Natl. Acad. Sci. USA 2018, 115, 12662
- Torres et al. 2004 Torres, J.; Coquillat, D.; Legros, R.; Lascaray, J. P.; Teppe, F.; Scalbert, D.; Peyrade, D.; Chen, Y.; Briot, O.; d’Yerville, M. L. V.; Centeno, E.; Cassagne, D.; Albert, J. P. Giant second-harmonic generation in a one-dimensional GaN photonic crystal. Phys. Rev. B 2004, 69, 085105
- Ajiki and Ando 1994 Ajiki, H.; Ando, T. Aharonov-Bohm effect in carbon nanotubes. Physica B: Condensed Matter 1994, 201, 349
- Zaric et al. 2004 Zaric, S.; Ostojic, G. N.; Kono, J.; Shaver, J.; Moore, V. C.; Strano, M. S.; Hauge, R. H.; Smalley, R. E.; Wei, X. Optical signatures of the Aharonov-Bohm phase in single-walled carbon nanotubes. Science 2004, 304, 1129
- Yanagi et al. 2018 Yanagi, K.; Okada, R.; Ichinose, Y.; Yomogida, Y.; Katsutani, F.; Gao, W.; Kono, J. Intersubband plasmons in the quantum limit in gated and aligned carbon nanotubes. Nature Comm. 2018, 9, 1121
- Autés et al. 2016 Autés, G. et al. A novel quasi-one-dimensional topological insulator in bismuth iodide -Bi4I4. Nature Mater. 2016, 15, 154
- Yao et al. 2000 Yao, Z.; Kane, C. L.; Dekker, C. High-Field Electrical Transport in Single-Wall Carbon Nanotubes. Phys. Rev. Lett. 2000, 84, 2941–2944
- Huang et al. 2015 Huang, J.-W.; Pan, C.; Tran, S.; Cheng, B.; Watanabe, K.; Taniguchi, T.; Lau, C. N.; Bockrath, M. Superior current carrying capacity of boron nitride encapsulated carbon nanotubes with zero-dimensional contacts. Nano Lett. 2015, 15, 6836
- Harnack et al. 2003 Harnack, O.; Pacholski, C.; Weller, H.; Yasuda, A.; Wessels, J. M. Rectifying behavior of electrically aligned ZnO nanorods. Nano Lett. 2003, 3, 1097
- Ren et al. 2009 Ren, L.; Pint, C. L.; Booshehri, L. G.; Rice, W. D.; Wang, X.; Hilton, D. J.; Takeya, K.; Kawayama, I.; Tonouchi, M.; Hauge, R. H.; Kono, J. Carbon Nanotube Terahertz Polarizer. Nano Lett. 2009, 9, 2610
- He et al. 2014 He, X.; Fujimura, N.; Lloyd, J. M.; Erickson, K. J.; Talin, A. A.; Zhang, Q.; Gao, W.; Jiang, Q.; Kawanoa, Y.; Hauge, R. H.; Léonard, F.; Kono, J. Carbon nanotube terahertz detector. Nano Lett. 2014, 14, 3953
- Cubukcu et al. 2009 Cubukcu, E.; Degirmenci, F.; Kocabas, C.; Zimmler, M. A.; Rogers, J. A.; Capasso, F. Aligned carbon nanotubes as polarization-sensitive, molecular near-field detectors. Proc. Natl. Acad. Sci. USA 2009, 106, 2495
- Wei et al. 2018 Wei, W.; Wang, Y.; Ji, J.; Zuo, S.; Li, W.; Bai, F.; Fan, H. Fabrication of large-area arrays of vertically aligned gold nanorods. Nano Lett. 2018, 18, 4467
- Chen et al. 2011 Chen, P.; Fu, Y.; Aminirad, R.; Wang, C.; Zhang, J.; Wang, K.; Galatsis, K.; Zhou, C. Fully printed separated carbon nanotube thin film transistor circuits and its application in organic light emitting diode control. Nano Lett. 2011, 11, 5301
- Green et al. 2019 Green, M. E.; Bas, D. A.; Yao, H.-Y.; Gengler, J. J.; Headrick, R. J.; Back, T. C.; Urbas, A. M.; Pasquali, M.; Kono, J.; Her, T.-H. Bright and Ultrafast Photoelectron Emission from Aligned Single- Wall Carbon Nanotubes through Multiphoton Exciton Resonance. Nano Lett. 2019, 19, 158
- Zhang et al. 2018 Zhang, Q.; Liu, C.; Liu, X.; Liu, J.; Cui, Z.; Zhang, Y.; Yang, L.; Zhao, Y.; Xu, T. T.; Chen, Y.; Wei, J.; Mao, Z.; Li, D. Thermal transport in quasi-1D van der Waals crystal Ta2Pd3Se8 nanowires: size and length dependence. ACS Nano 2018, 12, 2634
- Nanot et al. 2013 Nanot, S.; Thompson, N. A.; Kim, J.-H.; Wang, X.; Rice, W. D.; Hároz, E. H.; Ganesan, Y.; Pint, C. L.; Kono, J. In Springer Handbook of Nanomaterials; Vajtai, R., Ed.; Springer-Verlag: Berlin Heidelberg, 2013; Chapter Single-Walled Carbon Nanotubes
- Zheng 2017 Zheng, M. Sorting carbon nanotubes. Top. Curr. Chem. 2017, 375, 13
- Bati et al. 2018 Bati, A. S. R.; Yu, L.; Batmunkh, M.; Shapter, J. G. Synthesis, purification, properties and characterization of sorted single-walled carbon nanotubes. Nanoscale 2018, 10, 22087
- Janas 2018 Janas, D. Towards monochiral carbon nanotubes: a review of progress in the sorting of single-walled carbon nanotubes. Mater. Chem. Front. 2018, 2, 36
- Fagan 2019 Fagan, J. Aqueous two-polymer phase extraction of single-wall carbon nanotubes using surfactants. Nanoscale Adv. 2019,
- Khripin et al. 2013 Khripin, C. Y.; Tu, X.; Heddleston, J. M.; Silvera-Batista, C.; Walker, A. R. H.; Fagan, J.; Zheng, M. High-resolution length fractionation of surfactant-dispersed carbon nanotubes. Anal. Chem 2013, 85, 1382
- Takenobu et al. 2003 Takenobu, T.; Takano, T.; Shiraishi, M.; Murakami, Y.; Ata, M.; Kataura, H.; Achiba, Y.; Iwasa, Y. Stable and controlled amphoteric doping by encapsulation of organic molecules inside carbon nanotubes. Nature Mater. 2003, 2, 683
- Cambré and Wenseleers 2011 Cambré, S.; Wenseleers, W. Separation and diameter sorting of empty (end-capped) and water-filled (open) carbon nanotubes by density gradient ultracentrifugation. Angew. Chem. Intl. Ed. 2011, 50, 2764
- Fagan et al. 2011 Fagan, J. A.; Huh, J. Y.; Simpson, J. R.; Blackburn, J. L.; Holt, J. M.; Larsen, B. A.; Walker, A. R. H. Separation of empty and water-filled single-wall carbon nanotubes. ACS Nano 2011, 5, 3943
- Cambré et al. 2015 Cambré, S.; Campo, J.; Beirnaert, C.; Verlackt, C.; Cool, P.; Wenseleers, W. Asymmetric dyes align inside carbon nanotubes to yield a large nonlinear optical response. Nature Nanotech. 2015, 10, 248
- Campo et al. 2016 Campo, J.; Piao, Y.; Lam, S.; Stafford, C. M.; Streit, J. K.; Simpson, J. R.; Walker, A. R. H.; Fagan, J. A. Enhancing single-wall carbon nanotube properties through controlled endohedral filling. Nanoscale Horizon 2016, 1, 317
- Ao et al. 2016 Ao, G.; Streit, J. K.; Fagan, J. A.; Zheng, M. Differentiating left- and right-handed carbon nanotubes by DNA. J. Am. Chem. Soc. 2016, 138, 16677
- Wei et al. 2016 Wei, X.; Tanaka, T.; Yomogida, Y.; Sato, N.; Saito, R.; Kataura, H. Experimental determination of excitonic band structures of single-walled carbon nanotubes using circular dichroism spectra. Nature Comm. 2016, 7, 12899
- Hata et al. 2004 Hata, K.; Futaba, D. N.; Mizuno, K.; Namai, T.; Yumura, M.; Iijima, S. Water-assisted highly efficient synthesis of impurity-free single-walled carbon nanotubes. Science 2004, 306, 1362
- Murakami et al. 2004 Murakami, Y.; Chiashi, S.; Miyauchi, Y.; Hu, M. H.; Ogura, M.; Okubo, T.; Maruyama, S. Growth of vertically aligned single-walled carbon nanotube films on quartz substrates and their optical anisotropy. Chem. Phys. Lett. 2004, 385, 298
- Jin et al. 1998 Jin, L.; Bower, C.; Zhou, O. Alignment of carbon nanotubes in a polymer matrix by mechanical stretching. Appl. Phys. Lett. 1998, 73, 1197
- LeMieux et al. 2008 LeMieux, M. C.; Roberts, M.; Barman, S.; Jin, Y. W.; Kim, J. M.; Bao, Z. Self-sorted, aligned nanotube networks for thin-film transistors. Science 2008, 321, 101
- Walters et al. 2001 Walters, D. A.; Casavant, M. J.; Qin, X. C.; Huffman, C. B.; Boul, P. J.; Ericson, L. M.; Hároz, E. H.; O’Connell, M. J.; Smith, K.; Colbert, D. T.; Smalley, R. E. In-plane-aligned membranes of carbon nanotubes. Chem. Phys. Lett. 2001, 338, 14
- Hobbie et al. 2009 Hobbie, E. K.; Fagan, J. A.; Becker, M. L.; Hudson, S. D.; Fakhri, N.; Pasquali, M. Self-assembly of ordered nanowires in biological suspensions of single-wall carbon nanotubes. ACS Nano 2009, 3, 189
- Che et al. 2012 Che, Y.; Wang, C.; Liu, J.; Liu, B.; Lin, X.; Parker, J.; Beasley, C.; Wong, H.-S. P.; Zhou, C. Selective synthesis and device applications of semiconducting single-walled carbon nanotubes using isopropyl alcohol as feedstock. ACS Nano 2012, 6, 7454
- He et al. 2016 He, X.; Gao, W.; Xie, L.; Li, B.; Zhang, Q.; Lei, S.; Robinson, J. M.; Hároz, E. H.; Doorn, S. K.; Vajtai, R.; Ajayan, P. M.; Adams, W. W.; Hauge, R. H.; Kono, J. Wafer-Scale Monodomain Films of Spontaneously Aligned Single-Walled Carbon Nanotubes. Nature Nanotech. 2016, 11, 633
- Gao and Kono 2019 Gao, W.; Kono, J. Science and applications of wafer-scale crystalline carbon nanotube films prepared through controlled vacuum filtration. R. Soc. open sci. 2019, 6, 181605
- 46 Certain equipment, instruments or materials are identified in this paper in order to adequately specify the experimental details. Such identification does not imply recommendation by the National Institute of Standards and Technology (NIST) nor does it imply the materials are necessarily the best available for the purpose.
- Wang et al. 2018 Wang, X.; Gao, W.; Li, X.; Zhang, Q.; Nanot, S.; Hároz, E. H.; Kono, J.; Rice, W. D. Magnetotransport in type-enriched single-wall carbon nanotube networks. Phys. Rev. Mater. 2018, 2, 116001
- Chiu et al. 2017 Chiu, K.-C.; Falk, A. L.; Ho, P.-H.; Farmer, D. B.; Tulevski, G.; Lee, Y.-H.; Avouris, P.; Han, S.-J. Strong and broadly tunable plasmon resonances in thick films of aligned carbon nanotubes. Nano Lett. 2017, 17, 5641
- Esposito et al. 1987 Esposito, G.; Giglio, E.; Pavel, N. V.; Zanobi, A. Size and shape of sodium deoxycholate micellar aggregates. J. Phys. Chem. 1987, 91, 356
- D’Alagni et al. 1997 D’Alagni, M.; D’Archivio, A. A.; Galantini, L.; Giglio, E. Structural study of the micellar aggregates of sodium chenodeoxycholate and sodium deoxycholate. Langmuir 1997, 13, 5811
- Burgo et al. 2012 Burgo, T. A. L.; Ducati, T. R. D.; Francisco, K. R.; Clinckspoor, K. J.; Galembeck, F.; Galembeck, S. E. Triboelectricity: Macroscopic charge patterns formed by self-arraying ions on polymer surfaces. Langmuir 2012, 28, 7407
- Zhu et al. 2013 Zhu, G.; Chen, J.; Liu, Y.; Bai, P.; Zhou, Y. S.; Jing, Q.; Pan, C.; Wang, Z. L. Linear-grating triboelectric generator based on sliding electrification. Nano Lett. 2013, 13, 2282
- Grzybowski et al. 2003 Grzybowski, B. A.; Winkleman, A.; Wiles, J. A.; Brumer, Y.; Whitesides, G. M. Electrostatic self-assembly of macroscopic crystals using contact electrification. Nature Mater. 2003, 2, 241
- Fernandes et al. 2017 Fernandes, R. M. F.; Buzaglo, M.; Regev, O.; Furó, I.; Marques, E. F. Mechanical agitation induces counterintuitive aggregation of pre-dispersed carbon nanotubes. J. Colloid Interface Sci. 2017, 493, 398
- Katsutani et al. 2019 Katsutani, F.; Gao, W.; Li, X.; Ichinose, Y.; Yomogida, Y.; Yanagi, K.; Kono, J. Direct observation of cross-polarized excitons in aligned single-chirality single-wall carbon nanotubes. Phys. Rev. B 2019, 99, 035426
- Zamora-Ledezma et al. 2008 Zamora-Ledezma, C.; Blanc, C.; Maugey, M.; Zakri, C.; Poulin, P.; Anglaret, E. Anisotropic thin films of single-wall carbon nanotubes from aligned lyotropic nematic suspensions. Nano Lett. 2008, 8, 4103
- Mulder 1996 Mulder, M. Basic Principles of Membrane Technology; Kluwer Academic Publishers, 1996; Vol. 2nd ed.
- Zhang et al. 2014 Zhang, J.; Jiang, D.; Peng, H.-X. A pressurized filtration technique for fabricating carbon nanotube buckypaper. Microporous and Mesoporous Materials 2014, 184, 127
- Chen et al. 2019 Chen, M.; Li, W.; Kumar, A.; Li, G.; Itkis, M. E.; Wong, B. M.; Bekyarova, E. Covalent atomic bridges enable unidirectional enhancement of electronic transport in aligned carbon nanotubes. ACS Appl. Mater. and Interfaces 2019, 11, 19315
- Seed 2000 Seed, B. Silanizing glassware. Current Protocols in Cell Biology 2000, 8, A.3E.1