Temporal and Angular Variations of 3D Core-Collapse Supernova Emissions and their Physical Correlations
Abstract
We provide the time series and angular distributions of the neutrino and gravitational-wave emissions of eleven state-of-the-art three-dimensional non-rotating core-collapse supernova models and explore correlations between these signatures and the real-time dynamics of the shock and the proto-neutron-star core. The neutrino emissions are roughly isotropic on average, with instantaneous excursions about the mean inferred luminosity of as much as 20%. The deviation from isotropy is least for the “"-type neutrinos and the lowest-mass progenitors. Instantaneous temporal luminosity variations along a given direction for exploding models average 24%, but can be as high as 10%. For non-exploding models, they can achieve 25%. The temporal variations in the neutrino emissions correlate with the temporal and angular variations in the mass accretion rate. We witness the LESA phenomenon in all our models and find that the vector direction of the LESA dipole and that of the inner Ye distribution are highly correlated. For our entire set of 3D models, we find strong connections between the cumulative neutrino energy losses, the radius of the proto-neutron star, and the -mode frequency of the gravitational wave emissions. When physically normalized, the progenitor-to-progenitor variation in any of these quantities is no more than 10%. Moreover, the reduced -mode frequency is independent of time after bounce to better than 10%. Therefore, simultaneous measurement of gravitational waves and neutrinos from a given supernova event can be used synergistically to extract real physical quantities of the supernova core.
keywords:
stars - supernovae - general1 Introduction
Recent supernova code developments (e.g., Skinner et al. 2019) running on a new generation of supercomputers have ushered in an era of unparalleled 3D simulations of core-collapse supernovae (CCSNe). For instance, our group is now able to produce over ten three-dimensional supernovae simulations in under a year, rivaling even the most comprehensive efforts in two-dimensions just a few years ago. With such a sample size, one can begin to perform preliminary statistics of explosion characteristics and outcomes.
The advent of such computational capability has been paralleled by novel astronomical detector capabilities. Recent discoveries of gravitational waves from astrophysical sources (Abbott et al. 2016) and existing and upcoming neutrino detectors (SuperKamiokande (Abe et al. 2016), HyperKamiokande (Abe et al. 2011; Hyper-Kamiokande Proto-Collaboration et al. 2018), DUNE (Migenda 2018; Ankowski et al. 2016), JUNO (Lu et al. 2015), IceCube (Abbasi et al. 2011; Köpke & IceCube Collaboration 2011) motivate new efforts to scrutizine direct signatures of proto-neutron star formation and supernova explosion. Neutrino detection of a galactic supernova will provide insight into both the dynamics of explosion and the physics of matter at nuclear densities (Müller 2019). In addition, Suwa et al. (2019) emphasize that, depending upon the neutron star mass, galactic supernova neutrinos can be observed for 30100 seconds. Simultaneous observation of gravitational waves (GWs) will constrain PNS convection and /-mode oscillation (Morozova et al. 2018; Hayama et al. 2018; Radice et al. 2019) as well as neutrino-driven convection and possibly the standing accretion shock instability (SASI) (Tamborra et al. 2013, 2014a; Kuroda et al. 2017; Walk et al. 2019). CCSN gravitational waves are detectable for galactic events via the LIGO/Virgo network, and even further with future third-generation detectors (Srivastava et al. 2019; Powell & Müller 2019).
Many groups are now capable of high-fidelity 3D simulations (Vartanyan et al. 2019; Radice et al. 2019; Burrows et al. 2019; Nagakura et al. 2019a; O’Connor & Couch 2018b; Müller et al. 2017; Summa et al. 2018; Glas et al. 2019; Takiwaki et al. 2016; Yoshida et al. 2019; Nagakura et al. 2019b; Roberts et al. 2016; Ott et al. 2018). Our code Fornax is unique in its inclusion of detailed microphysics (including inelastic scattering), fast explicit transport with an implicit local solver (without the ray-by-ray approximation and with velocity dependence), respectable angular and radial resolution (Nagakura et al. 2019a), and static mesh refinement to obviate severe Courant limitations in the core and on the axis. The result is a code sporting the necessary realism that is fiveten times faster than previous 3D codes.
Using results from Fornax, we present in this paper the first study of variability and correlation to include a sample of almost a dozen state-of-the-art core-collapse supernovae simulations done with sophisticated neutrino physics and transport. The objective of this paper is to correlate CCSNe observables with physical quantities in the core to provide a basis for using neutrino and gravitational measurements to constrain the physical phenomena in the opaque CCSNe core. Earlier such work on correlations (Totani et al. 1998; Raffelt 2005; Brandt et al. 2011; Tamborra et al. 2013; Nakamura et al. 2016; Wallace et al. 2016; Kuroda et al. 2016; Kuroda et al. 2017; Seadrow et al. 2018; Hayama et al. 2018; Walk et al. 2019) focused on far fewer models with either a sub-optimal suite of included physics or at lower dimensionality. We study the neutrino and gravitational wave signatures and temporal and spatial variations, as well as correlations with the CCSN progenitor, for a comprehensive suite of 11 progenitors spanning 960 M⊙ evolved in 3D. These models, or a subset, were explored in three earlier works: Vartanyan et al. (2019), where we investigated the explosion of a 16-M⊙ in 3D; Burrows et al. (2019), where we studied the evolution of the 9-13-M⊙ progenitors from this suite; in Radice et al. (2019), where we analyzed the gravitational wave signal of progenitors in this suite, and in Nagakura et al. (2019a), where we looked at the dependence of angular resolution on explosion outcome for the 19-M⊙ progenitor. We save for an upcoming paper a broader study of the explosion characteristics and phenomenology of this large 3D model suite (Burrows et. al, in preparation). The so-called diagnostic explosion energies for most of our models have yet to asymptote to their final values. The exception is the 9-M⊙ model, which early achieved a value just above 1050 ergs (0.1 Bethe). The diagnostic energies of all the other models at run termination are larger (in the range of 1050 to a few 1050 ergs) and still increasing, with that for the 25-M⊙ model increasing at the end of its run at a rate of 1 Bethe per second.
We organize the paper as follows: In §2, we outline the physical and numerical setup of our simulation. In §3, we explore the temporal and spatial variations of neutrinos. We investigate the time series of neutrino emissions accessible to future neutrino detectors, and identify the associated physical processes driving the time variability. In §4, we repeat the process for gravitational waves. In §5, we comment on where and when the SASI might emerge. In §6, we explore the possible presence of the LESA (Tamborra et al., 2014b) in our 3D simulations. In §7, we look at correlations between observable gravitational and neutrino signals and the physics of CCSNe, such as neutron star convection, shock radius growth, and accretion rate. In §8, we conclude with summary comments and conclusions.
2 Numerical Setup
Fornax is a multi-dimensional, multi-group radiation hydrodynamics code originally constructed to study core-collapse supernovae. Its design, capabilities, and a variety of core tests are detailed in Skinner et al. (2019). In 2D and 3D, Fornax employs a dendritic grid which deresolves in angle at small radii to avoid restrictive CFL timestep limitations, while at the same time preserving cell size and aspect ratios. Our method of deresolving near the polar axis for 3D simulations allows us partially to overcome axial artifacts seen conventionally in 3D simulations in spherical coordinates (Lentz et al. 2015; Müller et al. 2017). Fornax solves the comoving-frame velocity-dependent transport equations to order O(). The hydrodynamics uses a directionally-unsplit Godunov-type finite-volume scheme and computes fluxes at cell interfaces using an HLLC Riemann solver. For all the 3D simulation highlighted in this paper, we employ a spherical grid in r, , and of resolution 678128256 (608128256 for the 16-M⊙ model). The radial grid extends out to 20,000 kilometers (10,000 for the 16-M⊙ model) and is spaced evenly with km for radii interior to 20 km and logarithmically for radii exterior to 50 km, with a smooth transition in between. The angular grid resolution varies smoothly from 1.9∘ at the poles to 1.3∘ at the equator, and has 1.4∘ uniformly. For this project, following Marek et al. (2006) we used a monopole approximation for relativistic gravity and employed the SFHo equation of state (Steiner et al. 2013), which is consistent with all currently known nuclear constraints (Tews et al. 2017).
We solve for radiation transfer using the M1 closure scheme for the second and third moments of the radiation fields (Vaytet et al. 2011) and follow three species of neutrinos: electron-type (), anti-electron-type (), and “"-type (, , , and neutrino species collectively). We use 12 energy groups spaced logarithmically between 1 and 300 MeV for the electron neutrinos and to 100 MeV for the anti-electron- and “"-neutrinos. Our choice of energy binning for the different species reflects that, at the high densities in the inner core, electron neutrino transport dominates energy transport and the Fermi level of degenerate electron neutrinos is high enough to require the energy grouping extend to high enough values for them (in our calculations 300 MeV). Electron neutrino degeneracy in the core suppresses electron anti-neutrino densities there severely and so their energy grouping need extend to only 100 MeV, allow a more highly-resolved energy grid. Since the heavy-neutrinos are not degenerate and are subdominant energy carriers in the core, we employed the same narrower and more highly-resolved energy range.
Fornax includes a detailed suite of microphysical reactions. For neutrino-nucleon scattering (neutral-current) and absorption (charged current), we use the formalism of Burrows et al. (2006). For inelasticity in neutrino-nucleon and neutrino-electron scattering, we follow Burrows & Thompson (2004). Weak magnetism and recoil corrections are included in both scattering absorption reactions as multiplicative terms. Pauli exclusion is included via the stimulated emission term in (Burrows et al., 2006). We include the many-body correction (see also Burrows et al. 2018) to neutrino-nucleon scattering following Horowitz et al. (2017), which fits to high densities following Burrows & Sawyer (1998). For electron-positron pair annihilation and bremsstrahlung, which dominate heavy neutrino production, we follow Thompson et al. (2000). For electron capture on nuclei, significant during the infall phase, we use the rates provided by Juodagalvis et al. (2010). The cross sections for the flavor-changing reactions (e.g., + + ; see, for instance Buras et al. 2003) are small compared to neutrino/nucleon absorption and scattering processes and are not included in the current implementation of Fornax. However, (Kotake et al. 2018) have recently suggested that they might play a role in enhancing the contraction of the PNS and, thereby, slightly increasing the important neutrino heating rate in the gain region.
We study 11 progenitors in 3D in this paper, covering 9-, 10-, 11-, 12-, 13-, 14-, 15-, 16-, 19-, 25-, and 60-M⊙ models. All models in this paper are initially collapsed in 1D through 10 ms after bounce, and then mapped to three dimensions. For all progenitors except the 16- and 25-M⊙ models, we use Sukhbold et al. (2016). We use Woosley & Heger (2007) for the 16-M⊙ progenitor, the same studied in Vartanyan et al. (2019). For the 25-M⊙ progenitor, we use Sukhbold et al. (2018). After mapping to 3D, we impose velocity perturbations following Müller & Janka (2015) within 200 1000 km with a maximum speed of 100 km s-1 and harmonic quantum numbers of = 10, = 1, and = 4 (radial), as defined in Müller & Janka (2015), for all models except the 16-M⊙ progenitor, which is perturbed in three spatially distinct regions (50 85 km, 90 250 km, and 260 500 km), with a maximum speed of 500 km s-1 and harmonic quantum numbers of = 2, = 1, and = 5 (radial). The details of the imposed perturbations are unlikely to make any qualitative difference in our conclusions.
In Fig. 1, we plot the density profiles as a function of mass for the progenitors studied here. We highlight the accretion of the silicon-oxygen (Si/O) interface, often corresponding to a drop by several in density, with a colored diamond. Density profiles historically have been parametrized by compactness (O’Connor & Ott 2013), defined at a given mass (typically 1.75 M⊙) and radius. However, we note the wide diversity of locations for the Si/O interfaces in this progenitor suite, from interior masses of 1.3 to 1.9 M⊙. Accretion of this interface often coincides with explosion time, and its presence and significance would require a multi-dimensional parametrization of progenitor profiles.
In Fig. 2, we illustrate the evolution of the mean shock radii for all our 3D models. All progenitors except for the 13-, 14-, and 15- M⊙ models explode, where we see an island of non-explosion (Burrows et al. 2019) and a weaker Si/O interface. Previously, the 15-M⊙ has either failed to explode in 2D simulations (Vartanyan et al. 2018; O’Connor & Couch 2018a) or has exploded late (Summa et al. 2016). We emphasize that the 13-, 14-, and 15-M⊙ progenitors are definitely less explodable. However, those of our models that do not explode may do so with different physics or initial structure, such as an initially rotating progenitor, or at higher resolution (Nagakura et al. 2019a).
For specificity, we define explosion time as when the mean shock radius surpasses 150 km and undergoes an inflection point. Explosion sets in primarily between 100200 ms after bounce except for the the 25-M⊙ progenitor, which explodes near 275 ms after bounce, due to delayed accretion of the Si/O interface that is initially located further out. This model is unique in that we see shock revival at 275 ms, then a period of slow growth until 400 ms, after which the mean shock radius accelerates outwards. The explosion times we witness roughly correspond with the times of accretion of the Si/O interfaces (seen in Fig. 1), with a deeper steep Si/O interface predicting an earlier explosion time (Fryer 1999; Murphy & Burrows 2008). More recent simulations have identified the importance of accretion of the Si/O interface in prompting earlier explosion in both 2D (Radice et al. 2017; Suwa et al. 2016; Vartanyan et al. 2018) and 3D simulations (Hanke et al. 2013; Ott et al. 2018; Summa et al. 2018; Vartanyan et al. 2019; Burrows et al. 2019).
3 Temporal and Directional Variation of Neutrino Emission
We now explore the neutrino emission in time and angle. In Fig. 3, we plot the accretion rates at 500 km as a function of time after bounce out to 700 ms for our suite of 3D models. In Fig. 4 and 5, we plot the solid-angle-averaged neutrino luminosities and mean energies, respectively, at 500 km as a function of time after bounce for all eleven models. The neutrinos and anti-neutrinos are bundled into “heavy"-neutrinos in the plots. The heavy neutrinos have slightly higher mean energies (5%) than the electron anti- neutrinos, which in turn have slightly higher neutrino energies (15%) than the electron-neutrinos. The average neutrino luminosities are not in equipartition between species, nor do they exhibit a strict hierarchy by species. Furthermore, the summed electron-neutrino and anti-electron-neutrino luminosity is roughly equal to the total heavy-neutrino luminosity. (Raffelt 2005; Totani et al. 1998).
The models that fail to explode have a longer sustained accretion history and yield at late times, after 300 ms, higher accretion rates, mean neutrino energies, and neutrino luminosities, with observable consequences for neutrino detectors (Seadrow et al. 2018). The neutrino luminosities and mean energies flatten out at late times with the cessation of accretion. We note that the 9-M⊙ progenitor carried out to more than one second postbounce is an outlier, with the accretion rate plummeting at 225 ms. The 60-M⊙ progenitor loses most of its mass to winds early on, and behaves effectively like a lower mass progenitor. As will be discussed later, the low-mass 9-M⊙ progenitor explodes more spherically (Burrows et al. 2019) than the more massive models studied, and for all intents and purposes, the 9-M⊙ progenitor evolution is complete. We see a weak correlation between progenitor mass, accretion rates, and neutrino luminosities. The 25-M⊙ progenitor is a clear example of this, with neutrino luminosities roughly 25% higher than for the 19- progenitor. The 60-M⊙ progenitor is an outlier, with lower luminosities and accretion rates than the 19- and 25-M⊙ progenitors. 111We note that in general the mean neutrino luminosity in 2D evinces greater temporal variation than in 3D. The sharp drop in the accretion rate (Fig. 3) and corresponding sharp drop by as much as 30% in the electron-neutrino and anti-neutrino luminosities (Fig. 4), driven by changes in mass accretion rate, correspond to the accretion of the Si/O interface. The heavy neutrino luminosity is more sensitive to PNS convection (Radice et al. 2017) and shows a more muted drop.
The 13-, 14-, and 15-M⊙ progenitors lack a sharp Si/O interface (Fig. 1), and fail to explode. The 9-M⊙ progenitor also lacks a sharp interface, but explodes by virtue of its steep density profile and low gravitational binding energy. We emphasize that compactness does not correlate with explodability, as models with both higher and lower compactness than the 13-, 14-, and 15-M⊙ progenitors do explode, consistent with conclusions from earlier work in 2D (Vartanyan et al. 2018; Radice et al. 2017) and 3D (Vartanyan et al. 2019; Burrows et al. 2019). Compactness is just one measure of profile shallowness, which is a multi-dimensional quantity for which useful fits do not yet exist. Compactness does roughly correlate with peak neutrino luminosity (see Fig. 4) consistent with earlier studies (Horiuchi et al. 2017) and with mean accretion rate (see Fig. 3) for all the exploding models. In Fig. 6, we plot compactness at 1.75 M⊙ against total neutrino luminosity measured at the post-breakout bump. We see that the non-exploding models are outliers and have a slightly smaller neutrino luminosity for a given compactness, and do at late times not strictly follow the trend of higher compactness with higher neutrino luminosity.
To explore the angle dependence of the neutrino luminosity, we decompose the lab-frame luminosity up to its monopole, dipole, and quadrupole moments, filtering out spurious higher-order terms that are not handled well with the M1 closure scheme at large radii and low optical depth. We obtain for the luminosity:
| (1) |
and where the terms on the right-hand-side corresponding to the monopole, dipole, and quadrupole terms, respectively, for each neutrino species i {, , }. is the radial flux outwards at a given radius, here taken to be 250 km.
In Fig. 7, we plot the luminosity decomposition in angle for the 19-M⊙ progenitor for the and neutrino species as a function of time after bounce, truncated at the quadrupole term. In the top panel, we plot the monopole, dipole, and quadrupole terms for each species, summed in quadrature over azimuthal moments , and in the bottom two panels we plot the dipole and quadrupole terms for each moment . The dipole and quadrupole terms are never greater than several percent of the monopole term, and the heavy-neutrinos have the smallest deviations from spherical asymmetry. We see the dipole undergo a small number phases of growth until 200 ms, where turbulence becomes significant and we see a steep rise in the luminosity dipole. For all our models, the dipole component of the neutrino luminosity for all species is never more than 5-6% of the angle-averaged luminosity. We note that angle asymmetries in the luminosity are much smaller than asymmetries in the shock radius.
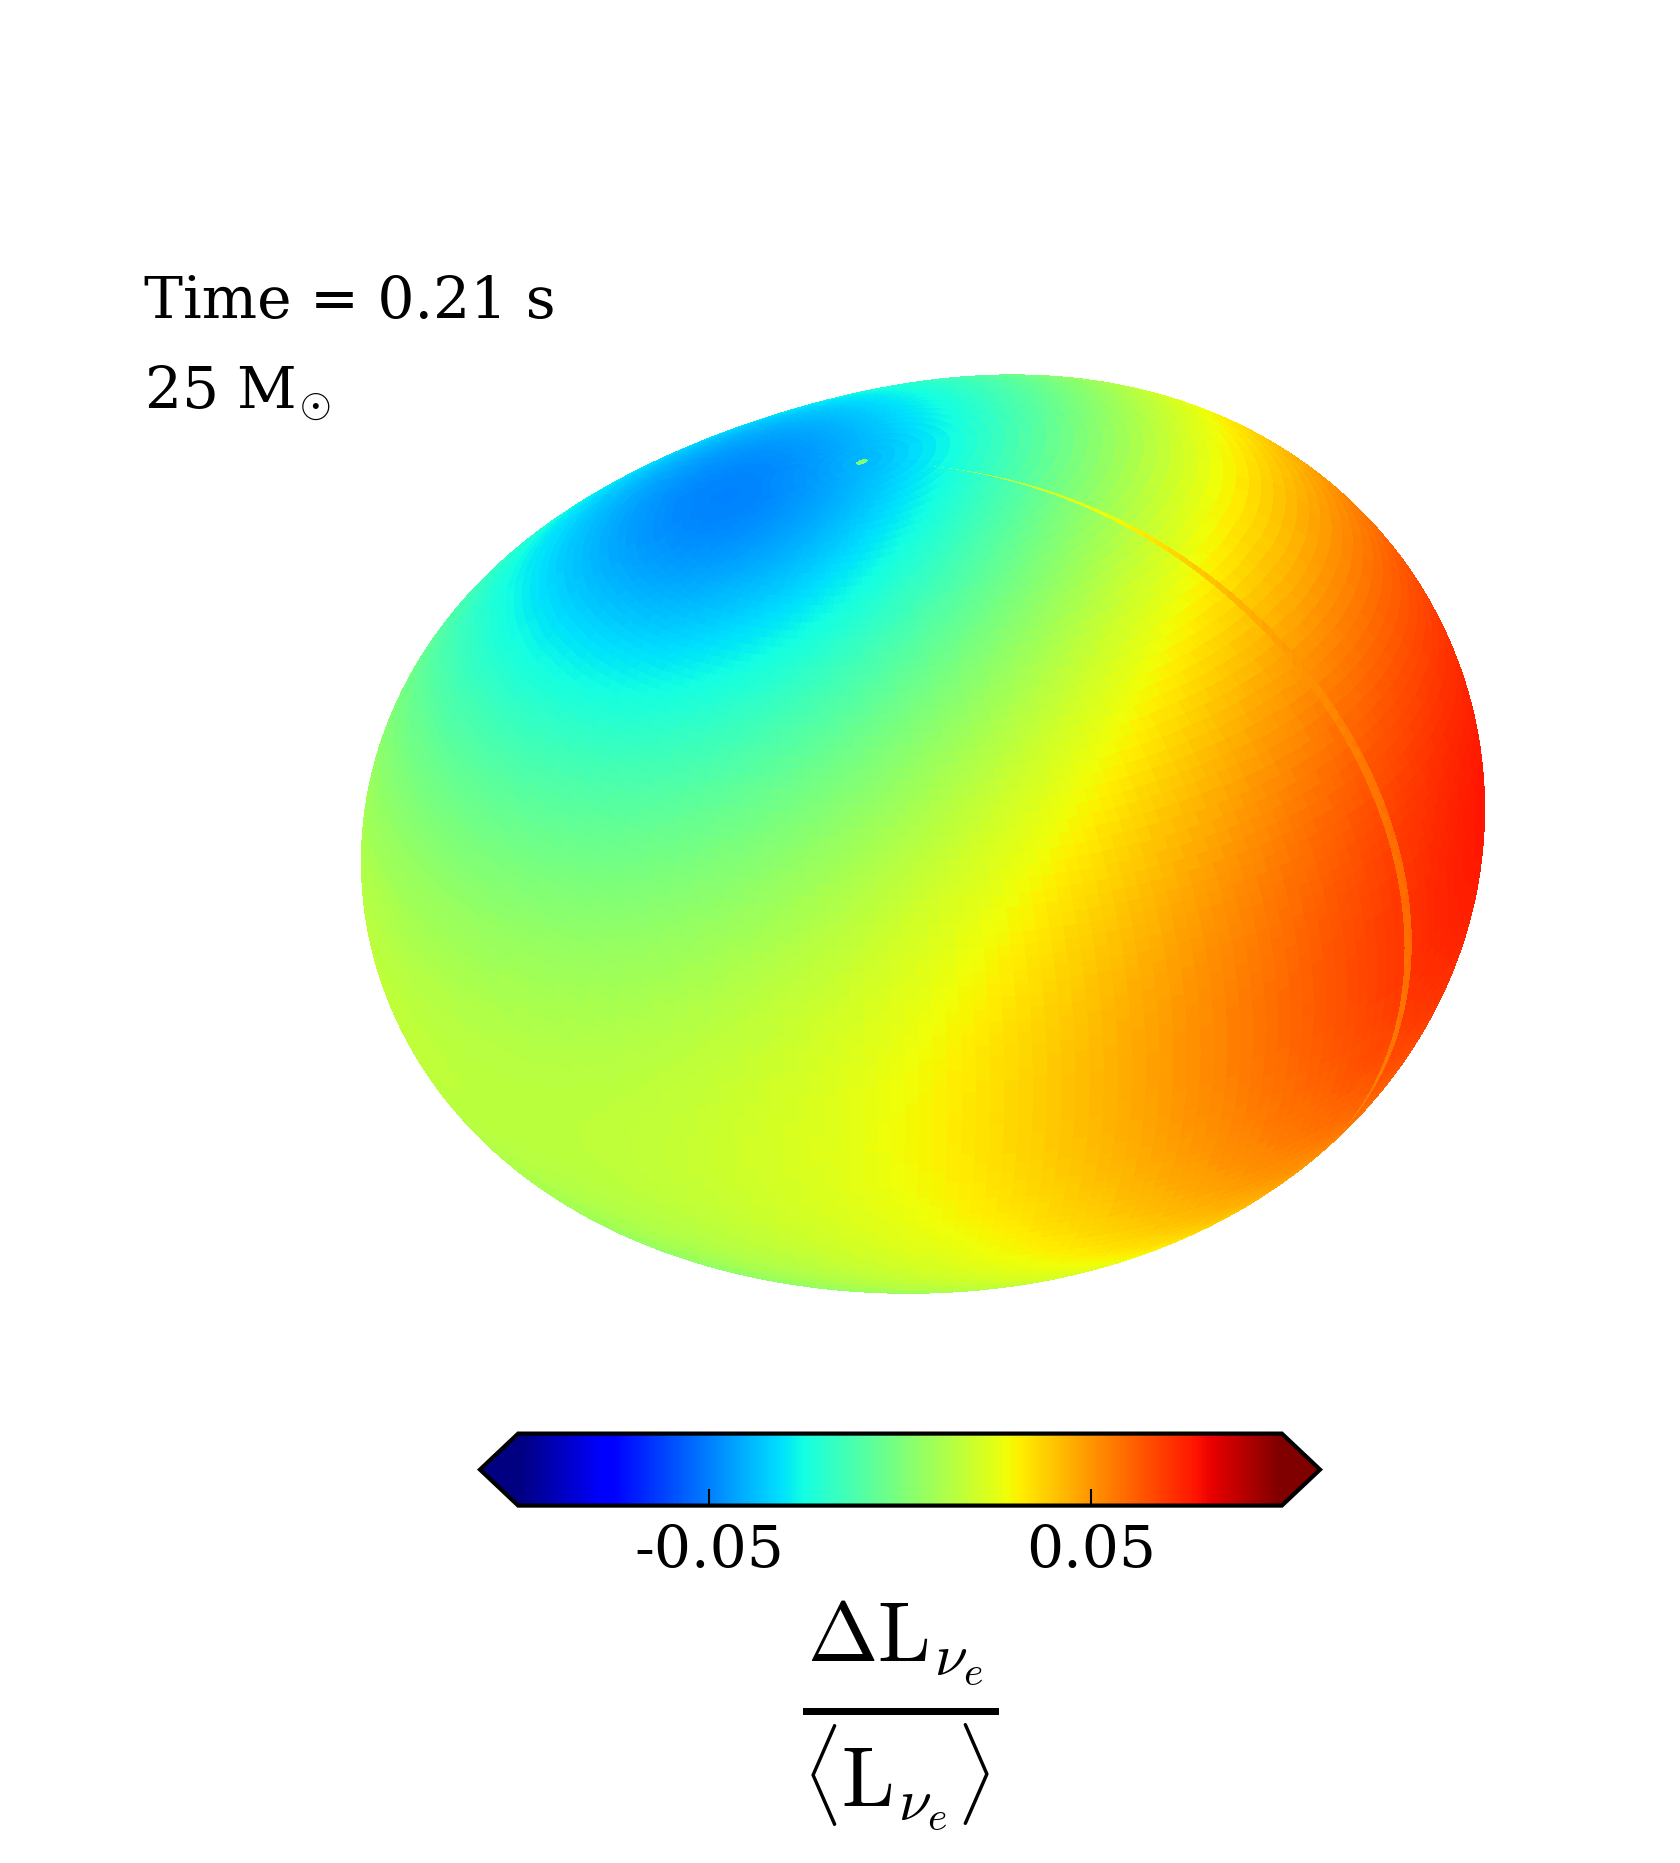
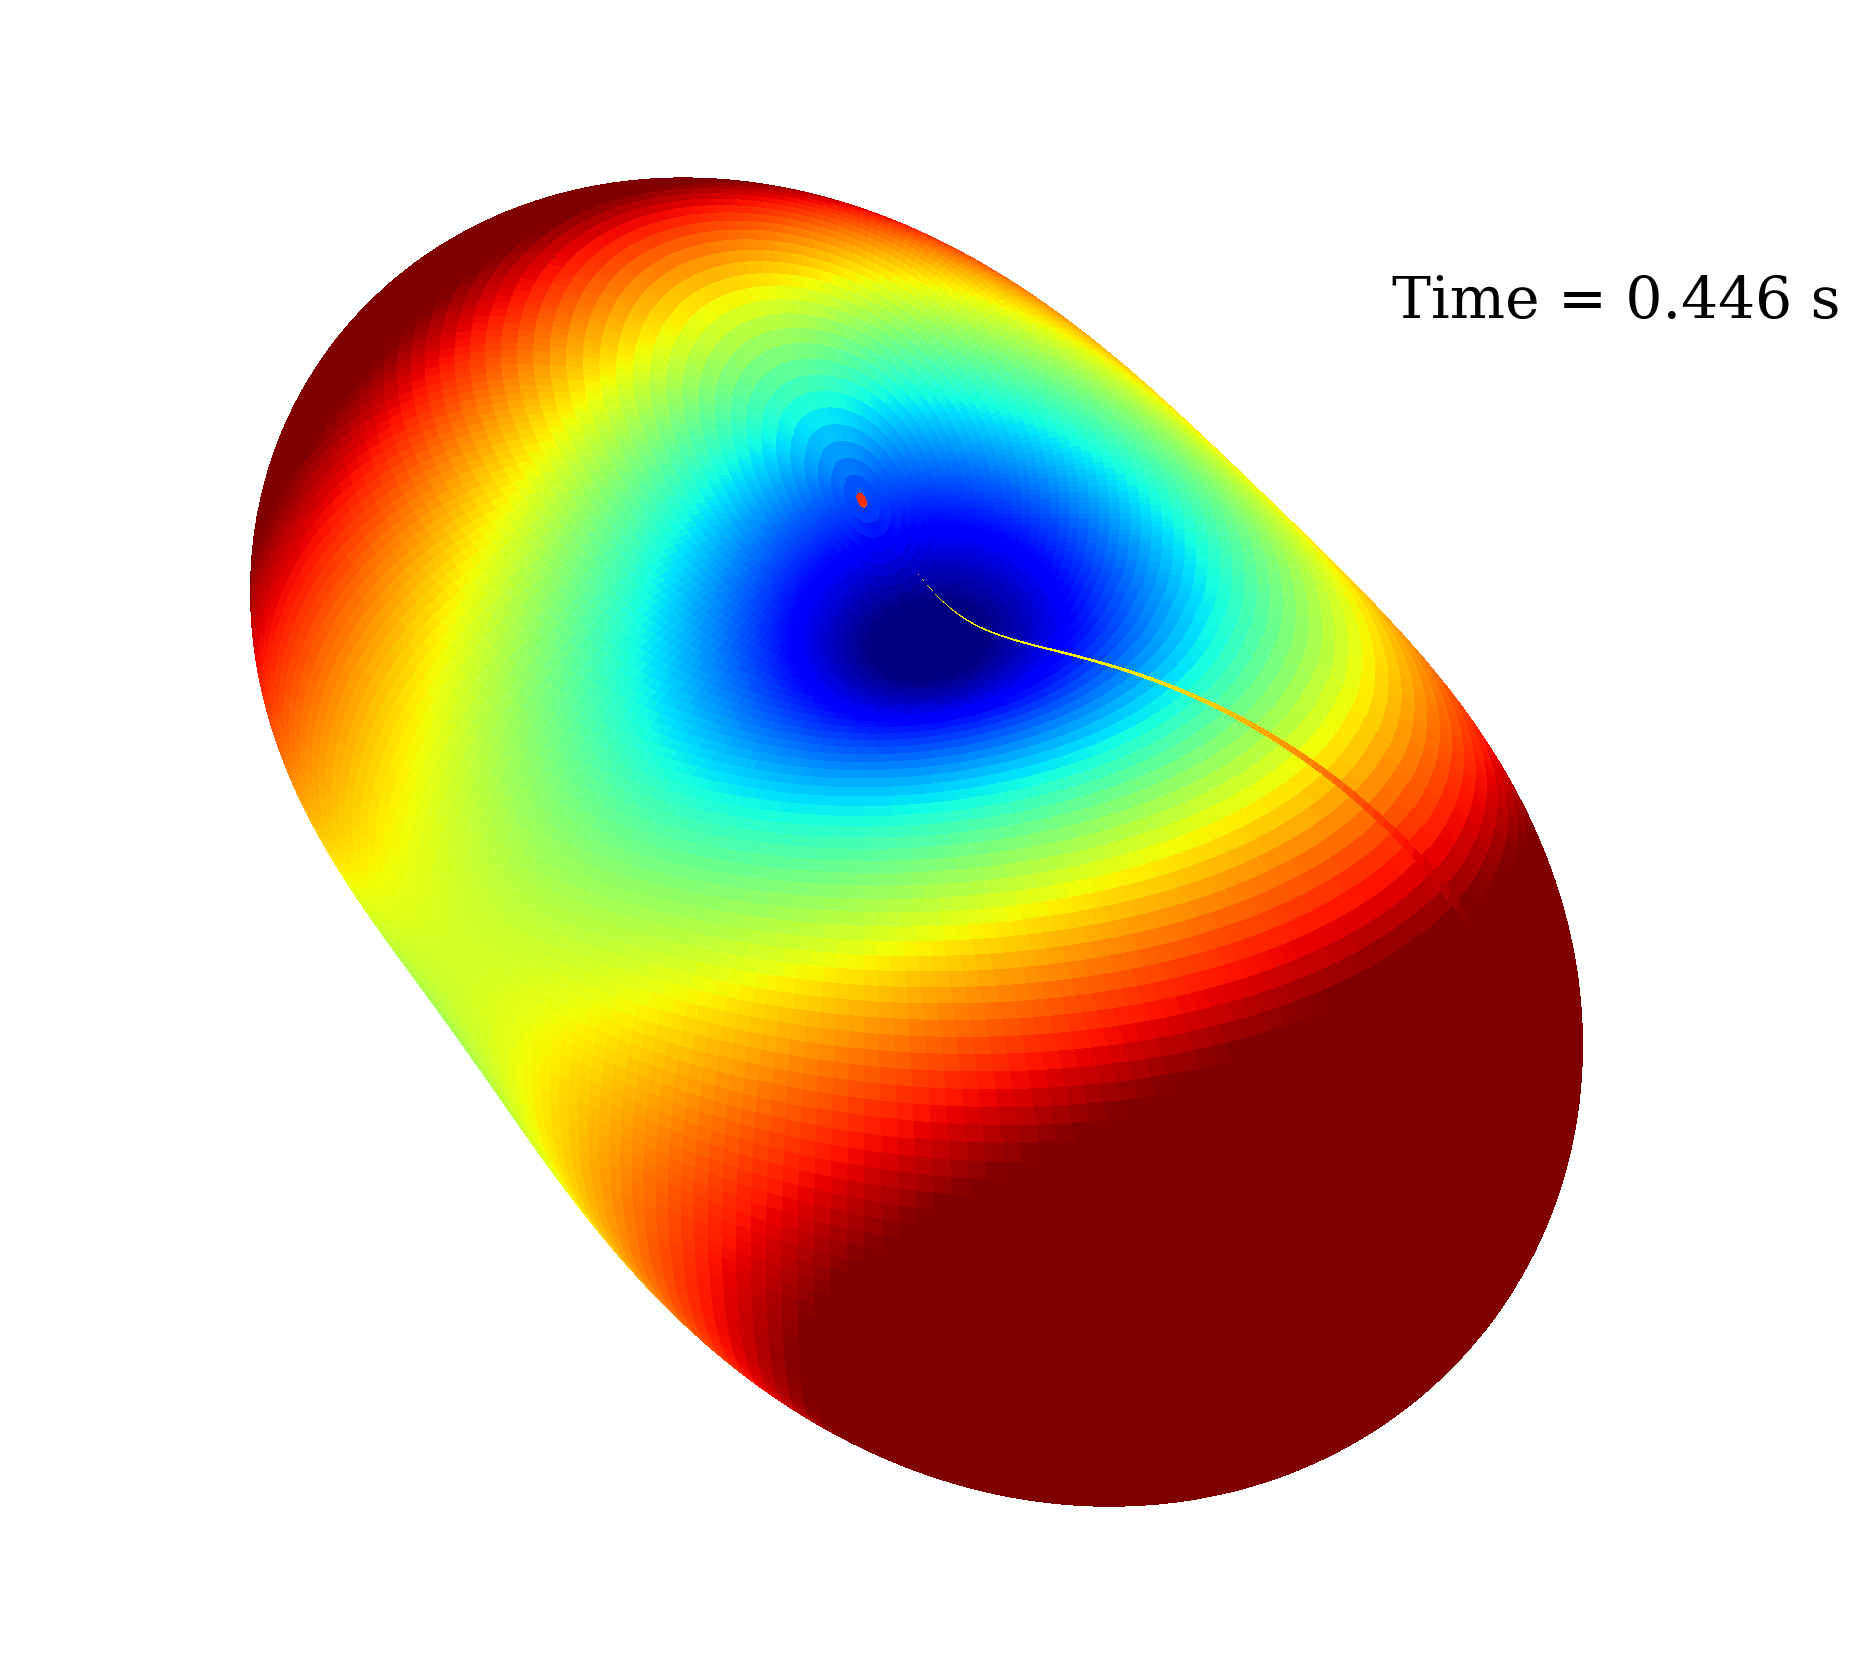
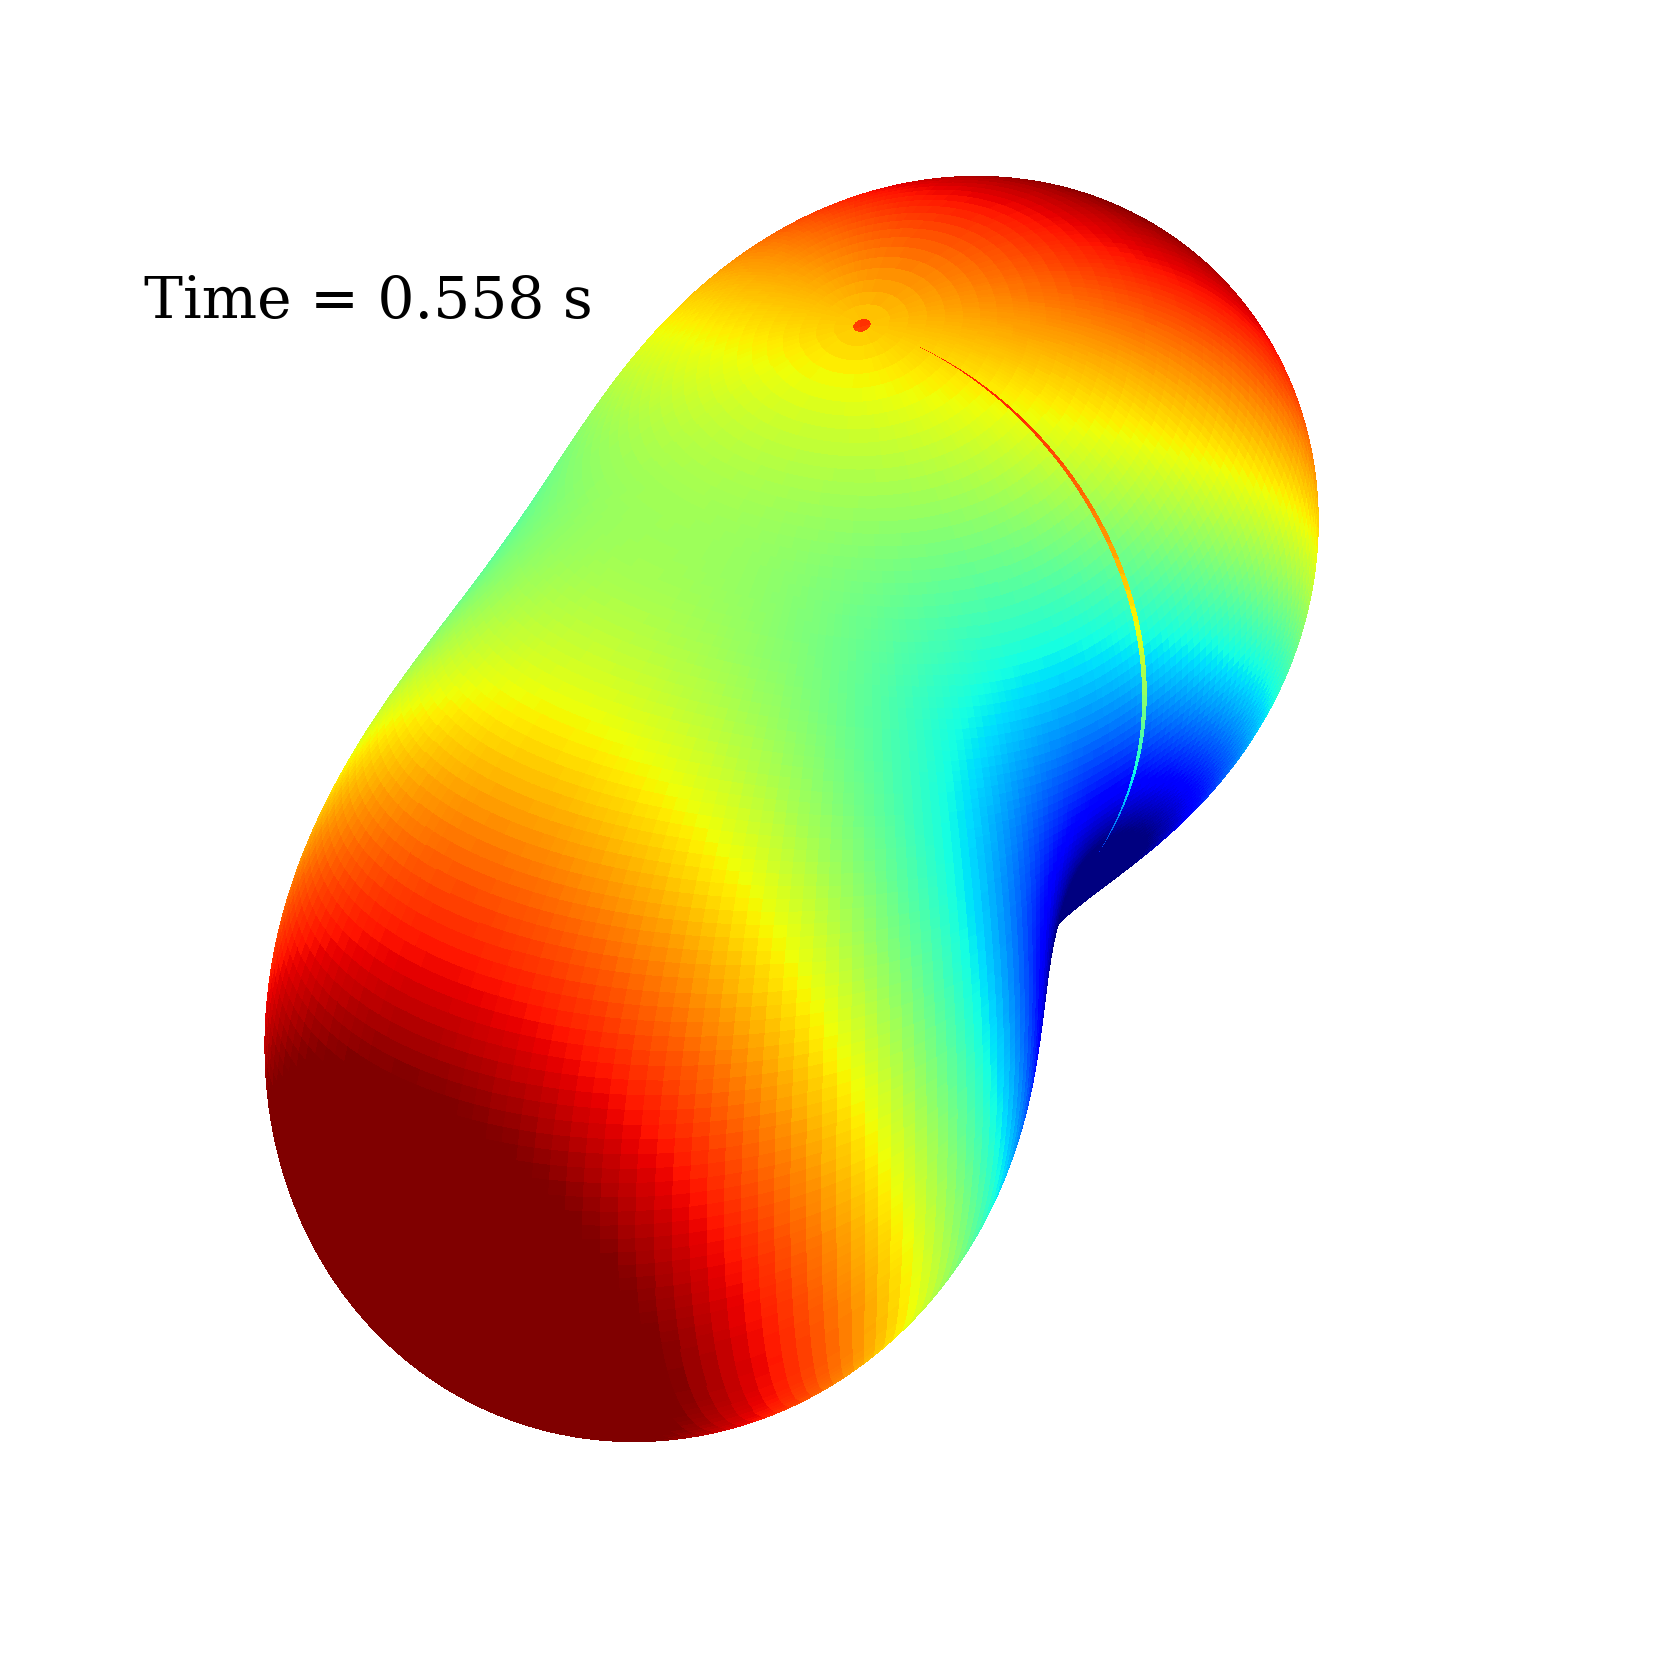
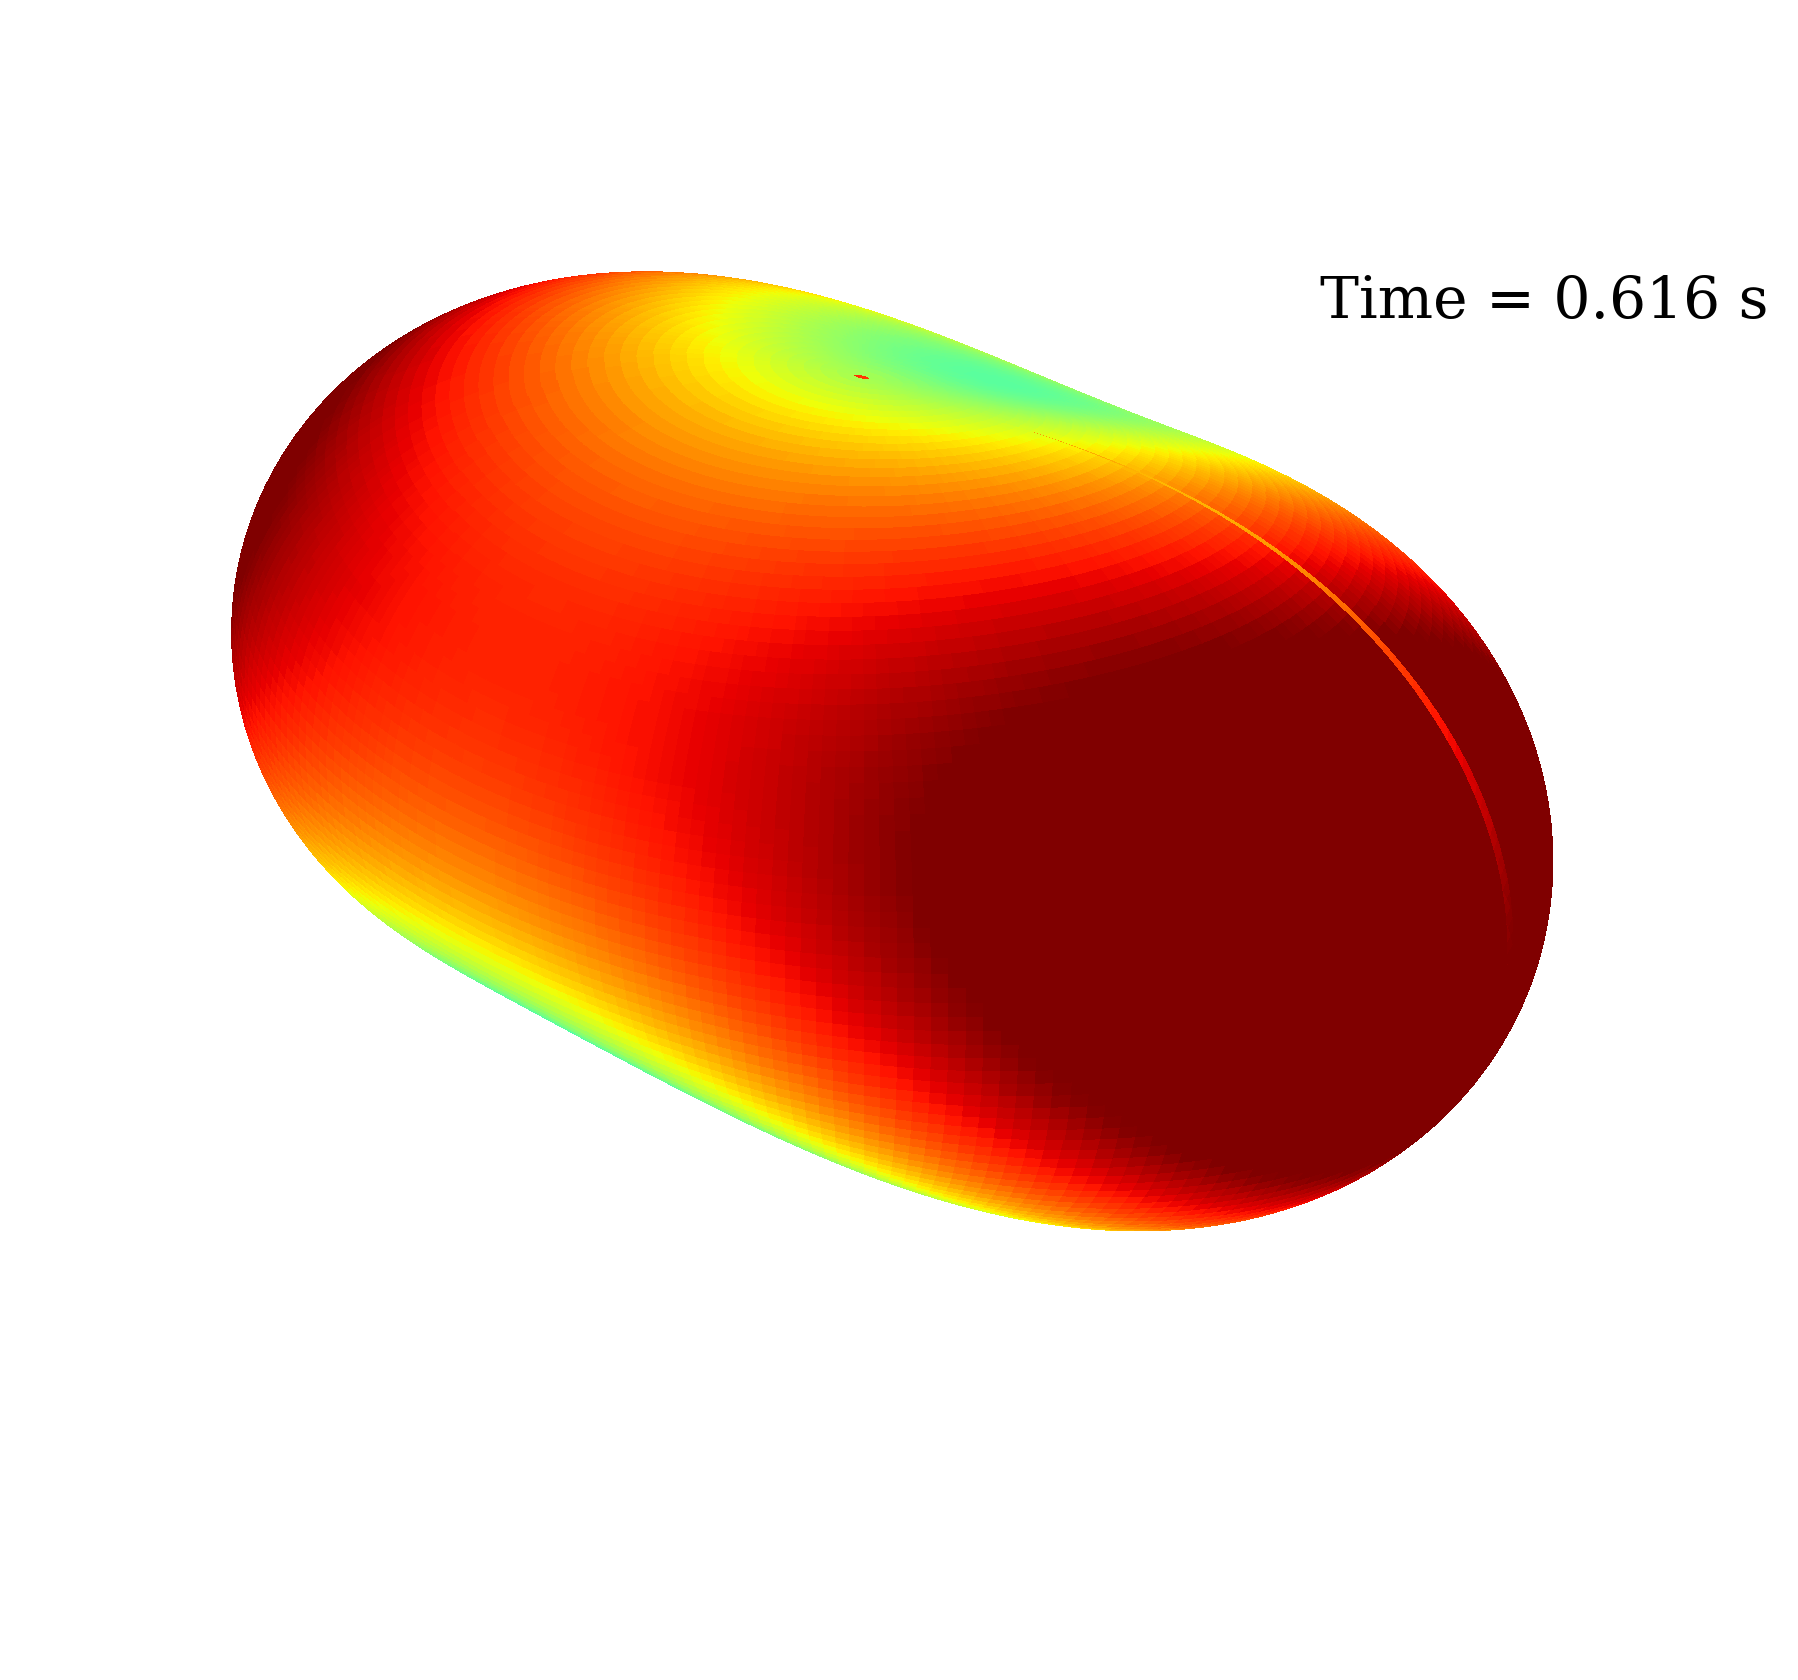
In Fig. 8, we plot in 3D the fractional variation in the electron-neutrino luminosity as a function of viewing direction and at various times for the 25-M⊙ progenitor. In the top of each panel, we color-code and contour the fractional variation, with color and contour redundant with each other. Cool-colored dimples indicate lower-than-average neutrino luminosities, and warm-colored protrusions indicate higher-than-average luminosities. The narrow stripe is the vestigial axis artifact. We see large-scale structure of the neutrino luminosity, with typical variations over viewing direction that increase with time to 5%10%.
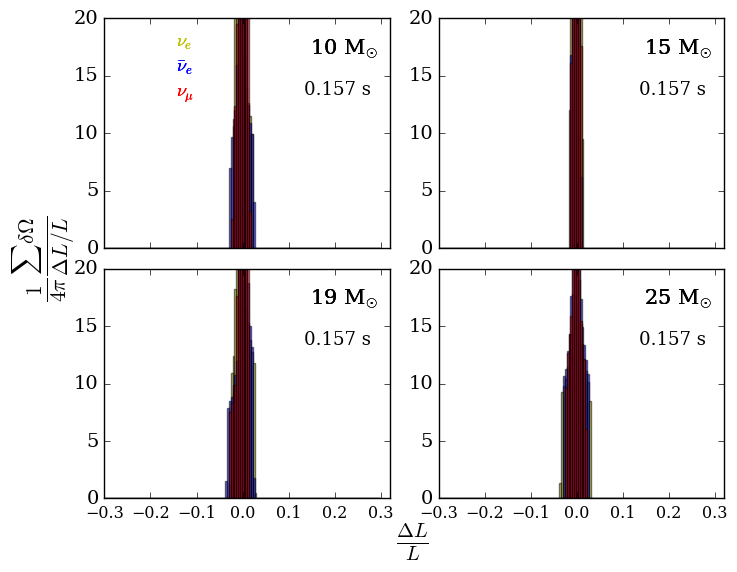
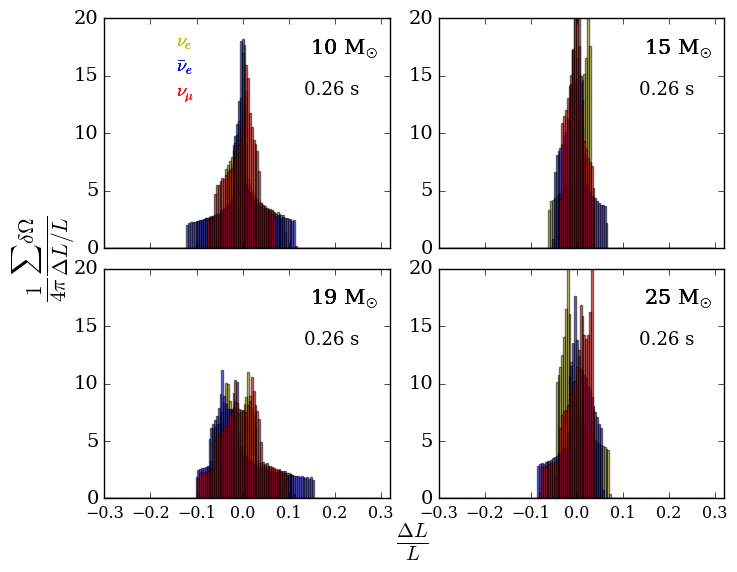
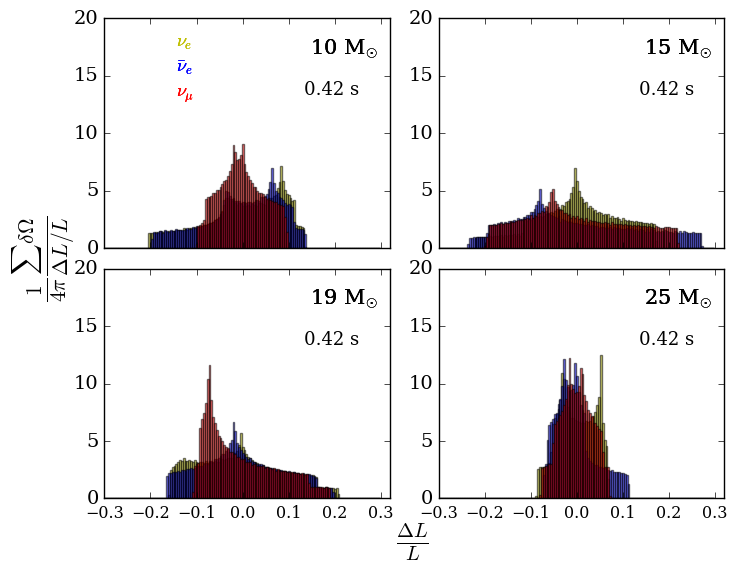
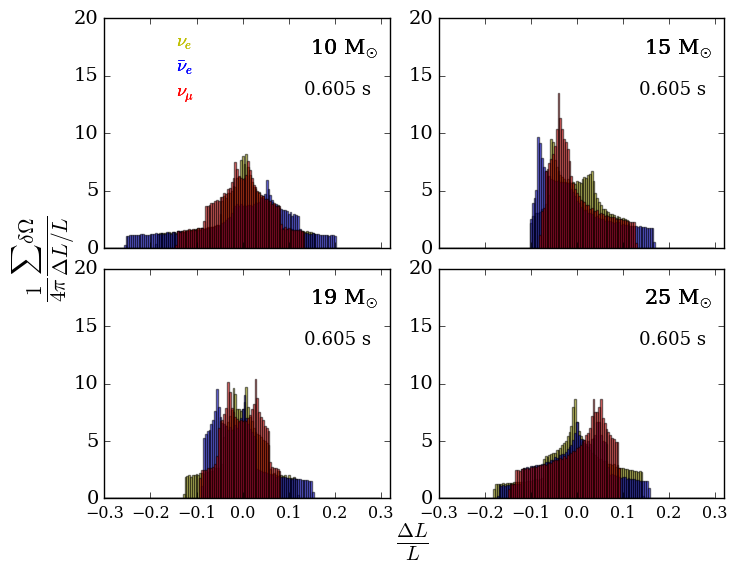
In Fig. 9, we plot histograms of the fractional emitting area at 250 km of the deviation from the mean neutrino luminosity for the three different species for several different progenitors. All models begin with isotropic neutrino emission and then evolve towards larger variations by viewing angle. Instantaneous neutrino emission can vary by as much as 40% over this sphere. We note that heavy-neutrinos typically show less angular variation in luminosity. The 15-M⊙ progenitor, which does not explode, is consistently more isotropic in neutrino emission, even at later times.
We plot the corresponding solid-angle averaged RMS neutrino luminosity about its mean in Fig. 10 for the 19-M⊙ progenitor. We see a hierarchy in fractional RMS neutrino luminosity by species; electron anti-neutrinos show the most variation, and heavy-neutrinos the least. The RMS variation increases with time; however, even at late times, the RMS variation is just 8%. Immediately after breakout, the variations are much smaller, roughly 1%. We see remarkable correlation between the different neutrino species in their RMS variation. This trend holds for all eleven models included in this study.
Given the small angular variation by direction in neutrino luminosities early on, future neutrino detections will not depend much on viewing angle after breakout and can be used to differentiate between core density structure and compactness (Fig. 4). Even up to 200300 ms, variation by viewing angle will be dwarfed by the intrinsic differences in the luminosity by progenitor. Furthermore, observation of the and neutrino luminosity can identify the presence and time of Si/O accretion.
3.1 Neutrino Time Series
Here, we explore the time variability along an arbitrarily chosen viewing direction of the neutrino luminosity for the various species. We arbitrarily choose a viewing direction along in the spherical coordinate system of our simulated supernova. In the left panel of Fig. 11, we plot the neutrino luminosity of the different species as a function of time after bounce along this viewing direction (to be compared with Fig. 4, where we plot the angle-averaged neutrino luminosities). To probe the temporal variation, we subtract out the luminosity running average along the same viewing direction, using a window of 30 ms. We see a rough trend with progenitor mass of the neutrino temporal variations, with the 9-M⊙ progenitor having less than 1% variations from the mean with time. The non-exploding models, 13-, 14-, and 15-M⊙, show the greatest variation of all the models after 200 ms, with the development of the SASI manifesting as high-amplitude, high-frequency variations in the luminosity. These models show average temporal variation of 8%, with variations as high as 25%. By contrast, the exploding models show average temporal variation over 24%, with the 16-, 19-, 25-M⊙ progenitors exhibiting variations as high as 10%.
Generally, the and neutrino luminosities show the greatest temporal (and spatial) variation, while the -neutrino luminosity exhibits the least temporal and spatial variation. In the right panel of Fig. 11, we plot the Fourier transform of the neutrino luminosity along the same viewing direction, subtracting out the running average along this same direction. The high-frequency components are associated with few millisecond timescale PNS convection. The peaks in the heavier progenitors, around 10 Hz, indicate large-scale explosion asymmetries. Note the 100 Hz peak in the non-exploding models, indicative of SASI, is absent in the exploding models.
4 Temporal and Directional Variations of Gravitational Wave Emissions
In this section, we explore the spatial and temporal variations of the gravitational wave signatures of our suite of progenitors. We provide gravitational wave data for all models except the 16-M⊙, for which we did not calculate the gravitational quadrupole moments. We follow Oohara et al. (1997) and Andresen et al. (2017), with the gravitational strain polarizations defined as
| (2a) | ||||
| (2b) | ||||
and the quadrupole moments defined as
| (3a) | ||||
| (3b) | ||||
| (3c) | ||||
In Fig. 12, we plot the gravitational wave strain times a distance (D) as viewed along the x-axis in the coordinate system of the supernova for the 10 models (neglecting the 16-M⊙ model) and including both linear polarizations h+ and h×. The strong prompt signal in h+ (and absent in h×) in all models for the chosen viewing angle corresponds to the onset of prompt convection and indicates the symmetry of the imposed perturbations. The strain ramps up within the first 200 ms, and subsequent to the prompt convection phase, both polarizations roughly follow each other in evolution. We see ‘packets’ in the strain lasting 50 ms corresponding to episodic accretion. Furthermore, in contrast with Pajkos et al. 2019, we find that the gravitational wave strain at core bounce, and throughout, generally increases with progenitor mass. We identify for all exploding models a direct correlation between the progenitor accretion rate and the magnitude of the gravitational strain, as concluded in Radice et al. (2019). The 9-, 10-, and 11-M⊙ models have the lowest accretion rates, and correspondingly, the smallest strains, while the 19-, 25-, and 60-M⊙ progenitors have the highest accretion rates and, correspondingly, the largest strains. For the 9-M⊙, in particular, early cessation of the GW signal corresponds to the early cessation of accretion. This emphasizes the importance of carrying out simulations longer in 3D to understand their late-time behavior, through the end of the accretion phase, and the implications for observable signatures.
We note that the non-exploding 13-, 14-, 15-M⊙ models have a weaker strain at later times despite sustained accretion. Furthermore, the gravitational strain for these non-exploding models grows for 200 ms, then is ‘pinched’ and decreases until 400 ms postbounce (when the spiral SASI develops), where it shows renewed growth.
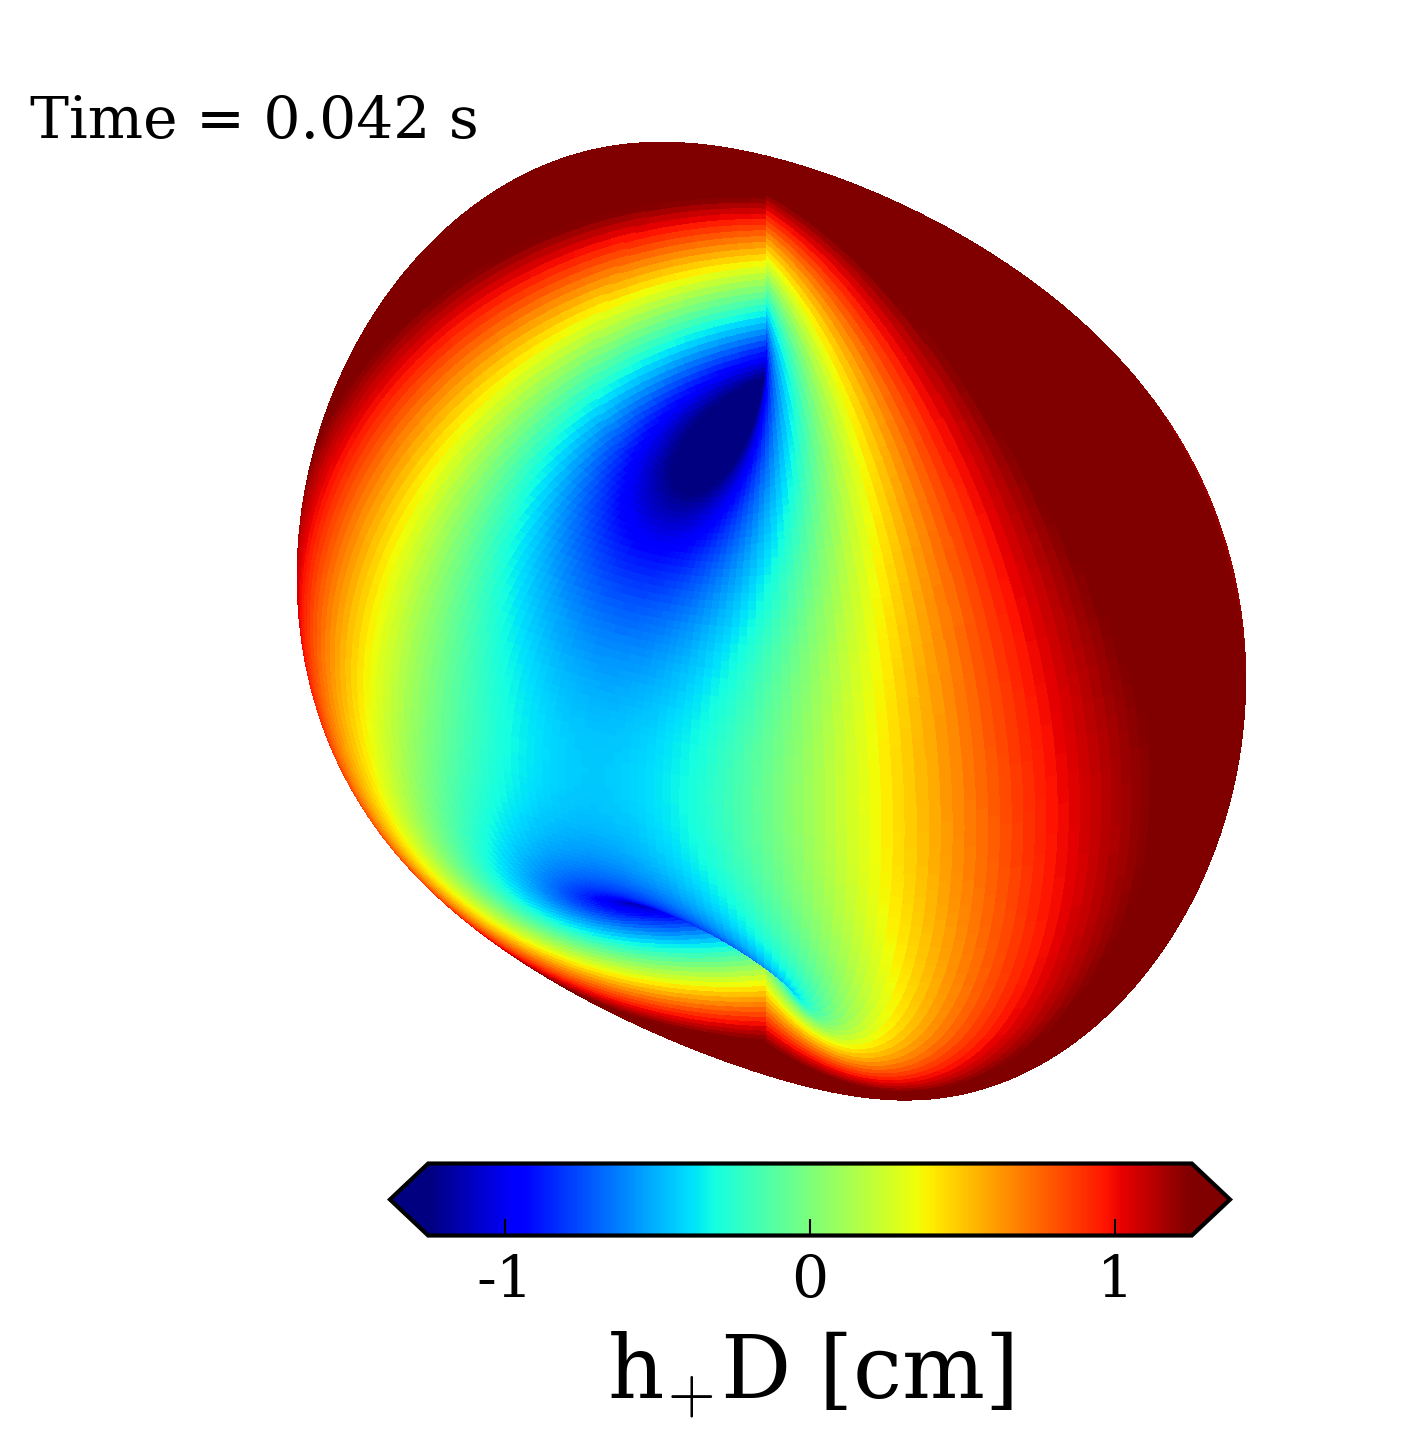
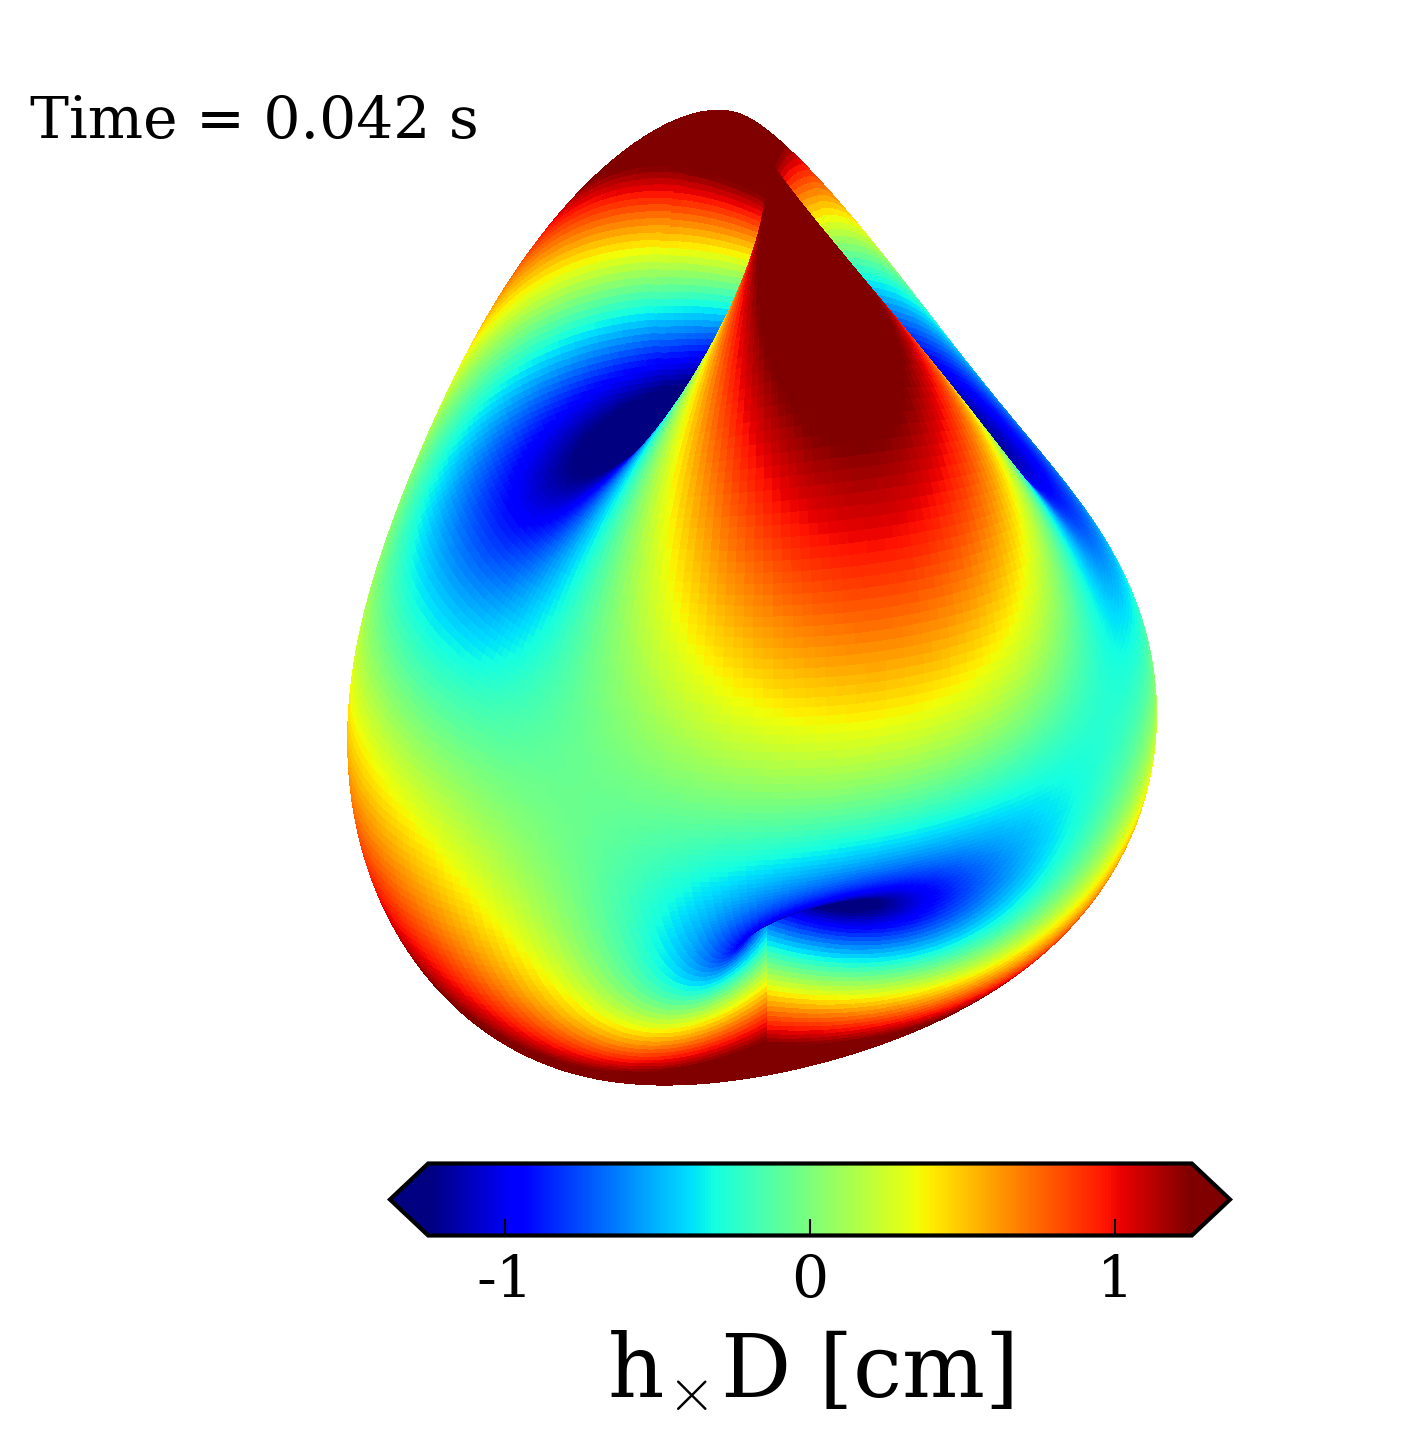
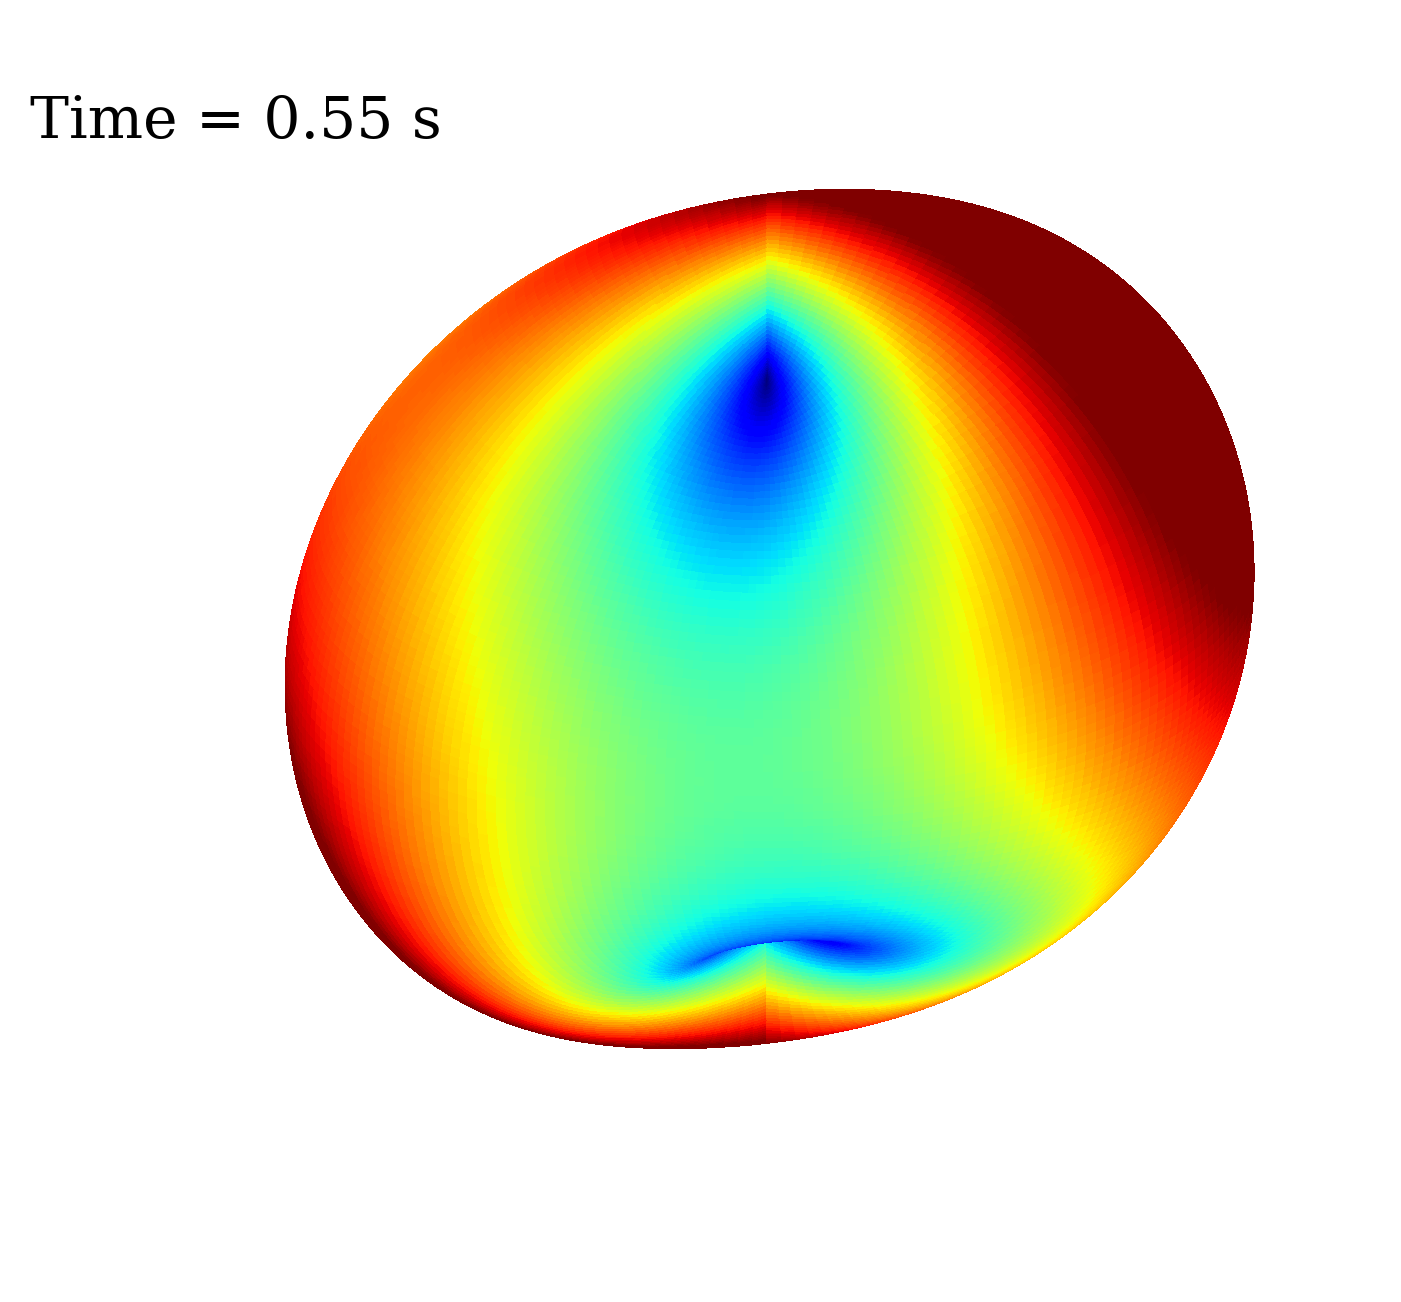
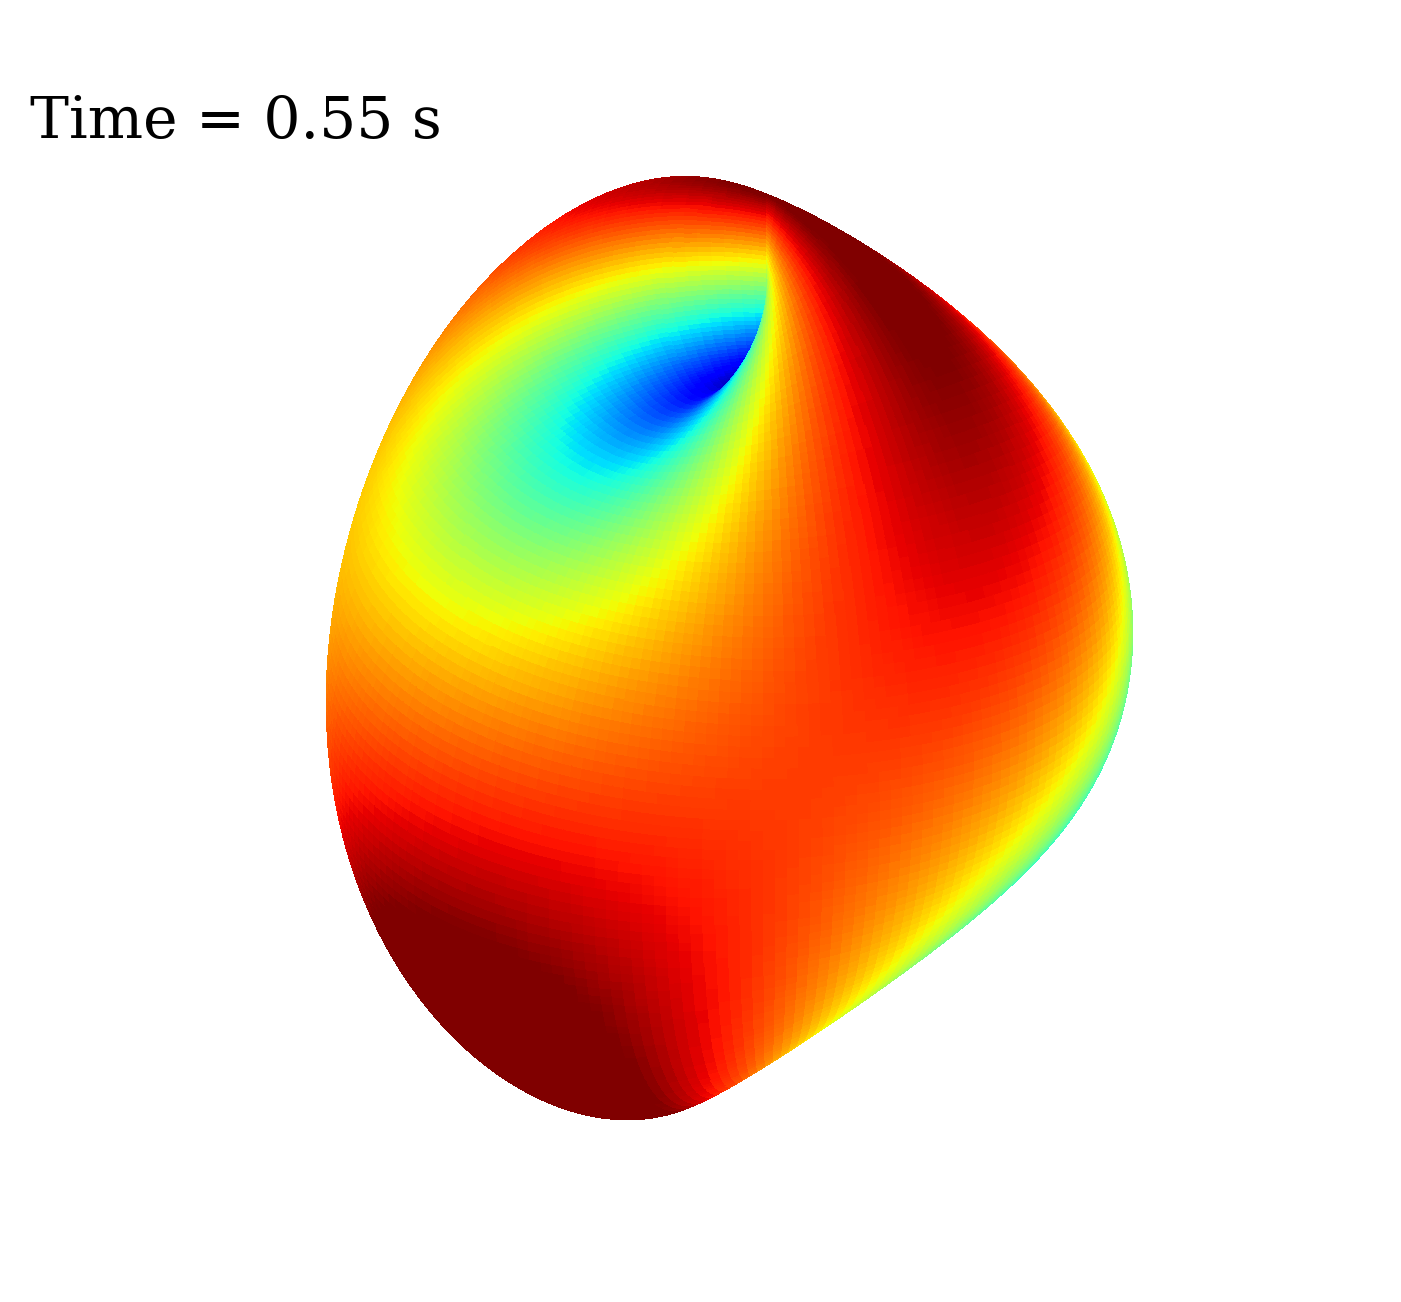
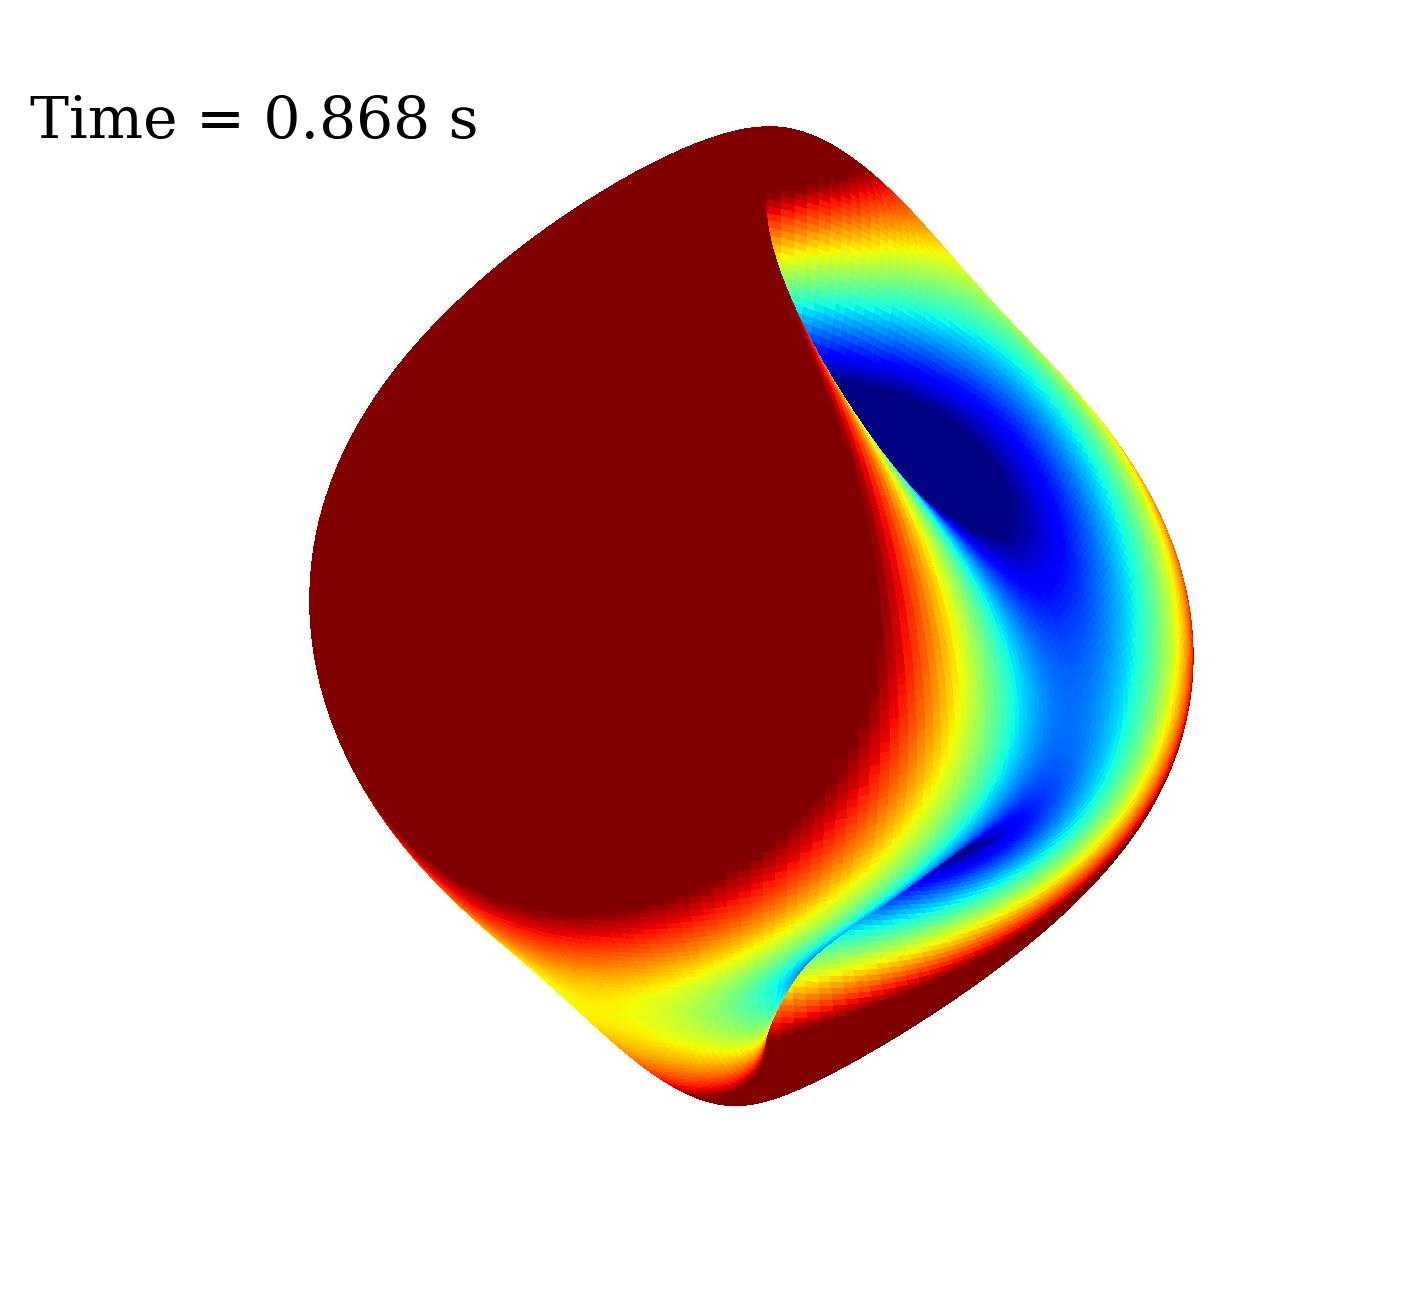
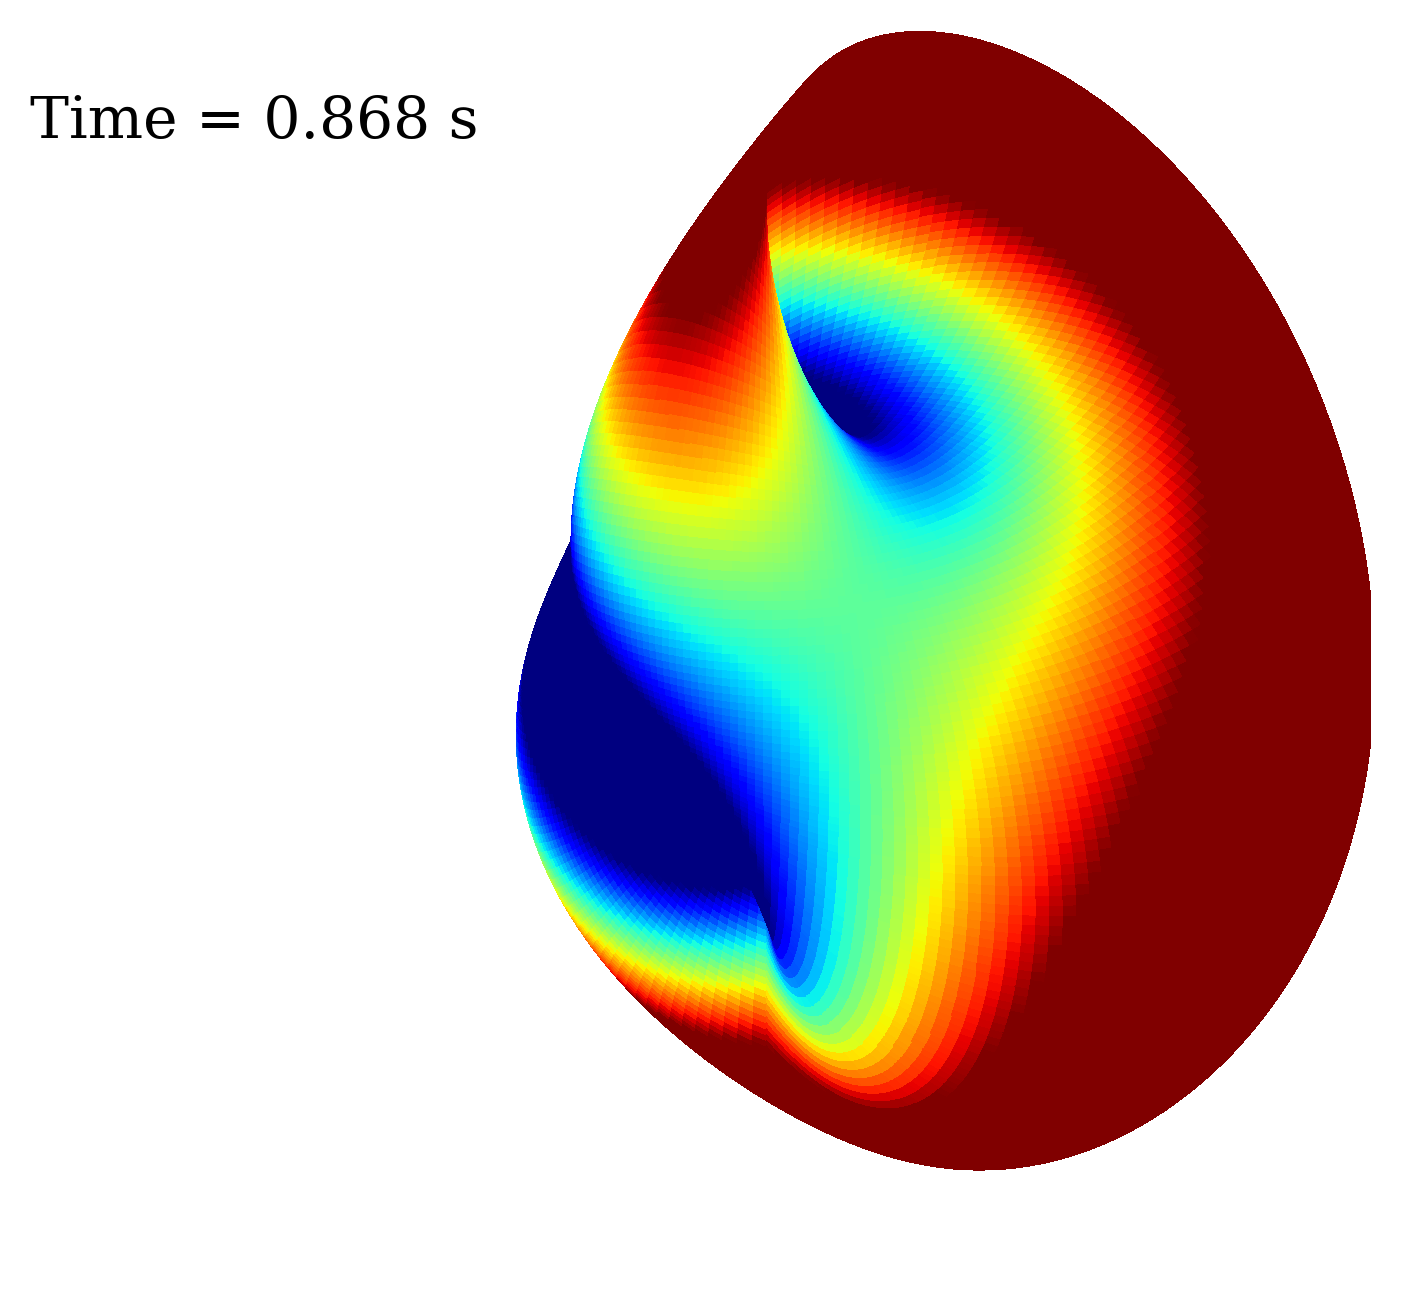
In Fig. 13, we plot the spatial distribution of the gravitational strains h+ D and h× D, as dimples on a sphere of radius 5 cm, with the color and magnitude of the dimple corresponding redundantly to the strain. Hot colors and convex surfaces correspond to positive strain; cool colors and concave surfaces correspond to negative strain. The strain varies on sub-millisecond timescales with a dominant, large-scale quadrupolar morphology that differs between the different polarizations.
5 SASI
In this section, we provide an aside on the SASI. The standing accretion shock instability (SASI; Foglizzo 2002; Blondin et al. 2003; Blondin & Shaw 2007; Foglizzo et al. 2012), is a vortical-acoustic hydrodynamic instability in the post-shocked region manifested (when it appears) by non-radial oscillating motion. To identify the SASI, we search for a low-frequency (100 250 Hz) gravitational wave signature lasting several hundred milliseconds (Kuroda et al. 2016; Andresen et al. 2019). We confirm the presence of the SASI by looking for a stately shock dipole in Fourier space at similar frequencies. We find evidence for the SASI in four of the models considered: the 13-,14-, and 15-M⊙ progenitors (which do not explode), and the 25-M⊙ progenitor (which explodes later, around 275 ms). All three of the non-exploding models also show an spiral SASI mode (Blondin 2005) developing 400 ms postbounce, after the early SASI phase, when the stalled shock radius has receded. The spiral SASI is a three-dimensional feature observed in earlier simulations (Kuroda et al. 2016; Summa et al. 2018; Andresen et al. 2019) and cannot be seen in axisymmetric two-dimensional simulations.
Earlier 2D, axisymmetric simulations (Scheck et al. 2008; Marek & Janka 2009; Hanke et al. 2012; Summa et al. 2016) have suggested that the SASI enhances neutrino energy deposition to promote explosion. However, comparisons with ray-by-ray and multi-dimensional neutrino transport (Skinner et al. 2016; Dolence et al. 2015; Glas et al. 2018) indicated that axisymmetric 2D simulations artifically enhance axial sloshing associated with the SASI to promote explosion.
We emphasize that the development of a SASI in 3D as well as 2D is mainly restricted to failed explosions, with a smaller shock radius favorable to a faster growth rate via the advective-acoustic cycle (Foglizzo 2002). This is congruent with earlier work (Vartanyan et al. 2019) claiming that the SASI frequently appears in the context of delayed or failed explosions and more compact shock structures.
In Fig. 14, we portray gravitational-wave spectrograms of the four models (13-, 14-, 15-, and 25-M⊙) that exhibit some form of the SASI. Prior to 100 ms, we see the development of a low-frequency (less than 100 Hz) component associated with prompt convection. The fundamental mode (-mode) frequency increases with time to 1 kHz by 500 ms postbounce (Morozova et al. 2018). Up to 250 ms after bounce, we see the telltale 100 Hz gravitational wave signature for these four models indicating the development of the the SASI. These models either fail to explode, or explode late. After 400 ms, we see the development of a spiral SASI indicated by a gravitational wave signature of less than 200 Hz in the 13-, 14-, and 15-M⊙ progenitors, all of which fail to explode. The low-energy, low-frequency component after 300 ms in the 25-M⊙ progenitor does not correspond to the SASI, but is due to the long-term global motions, such as expansion mass asymmetries. This signature is present only in the exploding models. The 25-M⊙ progenitor explodes and shows no spiral SASI. The SASI signal is weaker than the fundamental mode frequency for all models considered.
In Fig. 15 we plot the Fourier transform of the luminosity for the 13- (failed explosion) and 19-M⊙ (successful explosion) progenitors along multiple, arbitrarily chosen, lines-of-sight, indicated by the different colors, for all neutrino species. Note the strong peak at 100 Hz in all neutrino species for the non-exploding 13-M⊙ progenitor at 100 Hz, indicative of the SASI. In the exploding 19-M⊙ (right panel), we see a clear peak at 10 Hz, indicative of large-scale explosion asymmetries, and the 100 Hz SASI signal is absent.
Summa et al. (2018) find dynamic shock expansion due to kinetic energy deposition in the SASI spiral arm, driving their models to explosion. In our (non-rotating models), we do not witness shock revival for the three failed models where the spiral SASI does develop. Therefore, when the SASI appears in our non-rotating models, it is usually in the context of receding shocks and failed explosions. The turbulence seen is always predominantly a consequence of neutrino-driven convection, and exploding models rarely show any signs of the SASI, at least for our non-rotating model set.
6 LESA
The lepton-number emission self-sustained asymmetry (LESA) was proposed by Tamborra et al. (2014b) as a neutrino-hydrodynamical instability resulting in emission asymmetry, with possible implications for nucleosynthesis (Fujimoto & Nagakura 2019). In later work, Vartanyan et al. (2018); O’Connor & Couch (2018b) identified the LESA by examining the dipole component of the spherical harmonic decomposition of the net lepton number flux (F F) for a single simulation in 3D of the 16-M⊙ progenitor (Woosley & Heger 2007). Walk et al. (2018) found that, for rotating models, the LESA instability is suppressed associated with weaker PNS convection and Walk et al. (2018), Glas et al. (2018), and Walk et al. (2019) have studied possible connections between neutrino emissions, neutrino oscillations, and the LESA.
We now extend our exploration of the possible presence of the LESA to 11 progenitors evolved in 3D. In Fig. 16, we depict the monopole and dipole components of the lepton asymmetry as a function of time after bounce at 500 km. Here, we follow O’Connor & Couch (2018a) and plot the dipole magnitude,
| (4) |
using the normalization scheme of Burrows et al. (2012).
For all of our models irrespective of explosion outcome we see the development of the LESA, and illustrate the monopole and dipole components of this asymmetry in Fig. 16, consistent with recent 3D simulations (O’Connor & Couch 2018a; Glas et al. 2018). Note the strong periodicity in the non-exploding models (13-, 14-, 15-M⊙) after 400 ms, as the spiral SASI develops. We do not find strong evidence that the LESA correlates with either the behavior of the shock surface or the accretion rate; rather, as we note in § 7, it is the neutrino luminosity itself that correlates with the shock radius and accretion rate temporal oscillations, in agreement with Dolence et al. (2015).
In Fig. 17, we plot the and components of the orientation of the LESA dipole axis, and of the radius-weighted dipole axis of the electron fraction distribution at 25 km, following the prescription of O’Connor & Couch (2018b). For all eleven models, we see remarkable correlation between the orientation of the LESA dipole axis and the dipole axis of the electron-fraction distribution in the convective PNS. We see that the Ye dipole precedes that of the LESA by 2 ms, which can be explained by the light travel time from the PNS to 500 km, where we measure the LESA. These results build on recent evidence (O’Connor & Couch 2018b; Glas et al. 2018) to suggest that hemispheric differences in PNS convection drive the LESA dipole.
7 Neutrino and Gravitational Wave Emission Correlations
In this section, we explore correlations of the potentially observable neutrino and gravitational wave signatures with the inner dynamics of the supernova. In Fig. 18, we plot the normalized (by the monopole) dipole components of the accretion rate (blue, at 100 km), shock surface (black), LESA (brown), and neutrino luminosities (solid-red for electron-neutrinos, dashed-red for electron anti-neutrinos, and green for heavy-neutrinos, at 500 km). We use the approach outlined in Burrows et al. (2012) to decompose the shock surface R into spherical harmonic components with coefficients:
| (5) |
normalized such that (the average shock radius). , , and correspond to the average Cartesian coordinates of the shock surface dipole , , and , respectively. The orthonormal harmonic basis functions are given by
| (6) |
where
| (7) |
are the associated Legendre polynomials, and and are the spherical coordinate angles. We define the norm,
| (8) |
We see a hierarchy, with the normalized accretion rate dipole being largest, and that for the neutrino luminosity smallest. Non-exploding models have smaller accretion rate dipoles. We see that and neutrino luminosities have comparable normalized dipoles, with the dipole slightly larger, and the neutrino luminosity having the smallest dipole. This may attest to the different neutrinosphere radii for the different neutrino species, though the temporal variations of their luminosities track each other. We see remarkable similarity between the oscillations in the luminosity dipole and shock surface dipole, with the former lagging by 510 ms at early times, prior to explosion, due to advection of accreta from the stalled shock to the neutrinosphere. The shock radius dipole has longer period variations, of 10 ms and greater, and settles earliest after explosion, asymptoting to a roughly constant value in those models whose explosion energies have also begun to asymptote (Radice et al. 2019). The shock surface lies interior to 500 km at the early times plotted here, out to 300 ms. The 25-M⊙ progenitor shows the clearest correlation between accretion and luminosity; its later explosion is powered by a higher sustained accretion rate and consequent neutrino luminosity.
To correlate the time variation of the shock radii, the accretion rate, and the neutrino luminosities, we investigated their Fourier frequency content. Prior to explosion, we generally see large amplitude variation for these physical quantities on short timescales of 5 ms. After explosion, the dipole of the shock radii, neutrino luminosities, and accretion rates transition to small amplitude, long-period variations. In the accretion rate and neutrino luminosities, we see fast temporal variation with timescales of 5 ms, within a broader, quasi-periodic envelope with a typical width of 40 ms but as high as 100 ms, corresponding to large-scale anisotropies of the shock motion modulating the accretion rate. The 9-M⊙ progenitor, whose explosion proceeds relatively isotropically and whose accretion phase ends early, lacks such a feature. Additionally, for the first 400 ms, of for example, the 25-M⊙ progenitor’s evolution, we see variation on 30 ms timescales, corresponding to advection of material from the (initially) slowing growing shock.
For the non-exploding models, the shock radius, accretion rate, and neutrino luminosity all sustain persistent, short-timescale variations even at late times, 500 ms postbounce. Furthermore, we see in non-exploding models a transition to shorter timescales and higher frequencies (see Fig. 19 and following) after 400 ms, coincident with the development of the spiral SASI thereabouts. This is most visible in the 14-M⊙ model, for which we see periodic 10-ms variations after 400ms in the shock surface, accretion rate, and neutrino luminosity dipoles (for all species). After the spiral SASI develops, we also see large drops by two orders of magnitude in the dipole of the accretion rate over 80 ms timescales. Concurrently, and for the non-exploding models alone, we see the development of periodic -ms oscillations of the LESA dipole, which we associate with the spiral motion of the SASI, perhaps due to modulation of infalling accretion. The LESA dipole shows little to no temporal variation for the exploding models. While the 25-M⊙ progenitor does show early SASI activity, it explodes without a spiral SASI developing. We reiterate that 10 ms periodicity of the neutrino luminosity several hundred milliseconds after bounce is an indicator of spiral SASI activity.
We follow the formalism of Kuroda et al. (2017) to calculate the time-dependent angle-integrated correlation between two physical quantities, A and A,
| (9) |
In Fig. 19, we plot angle-averaged correlations as a function of time after bounce between the shock radius and neutrino luminosity, shock radius and accretion rate, and accretion rate and neutrino luminosity for various progenitors. In the top panel, we show the correlation with the neutrino luminosities of different neutrino species for the 19-M⊙ progenitor. We note the dependence of the heavy-neutrino luminosity on the accretion rate. We see correlation between the luminosity and accretion rate, and shock radius and accretion rate, and weaker anti-correlation both between the luminosity and shock radius, for all models exploding and non-exploding alike. However, after 300 ms, the non-exploding models show no persistent correlation, but rather show variation around zero on 10-ms timescales, illustrating SASI activity.
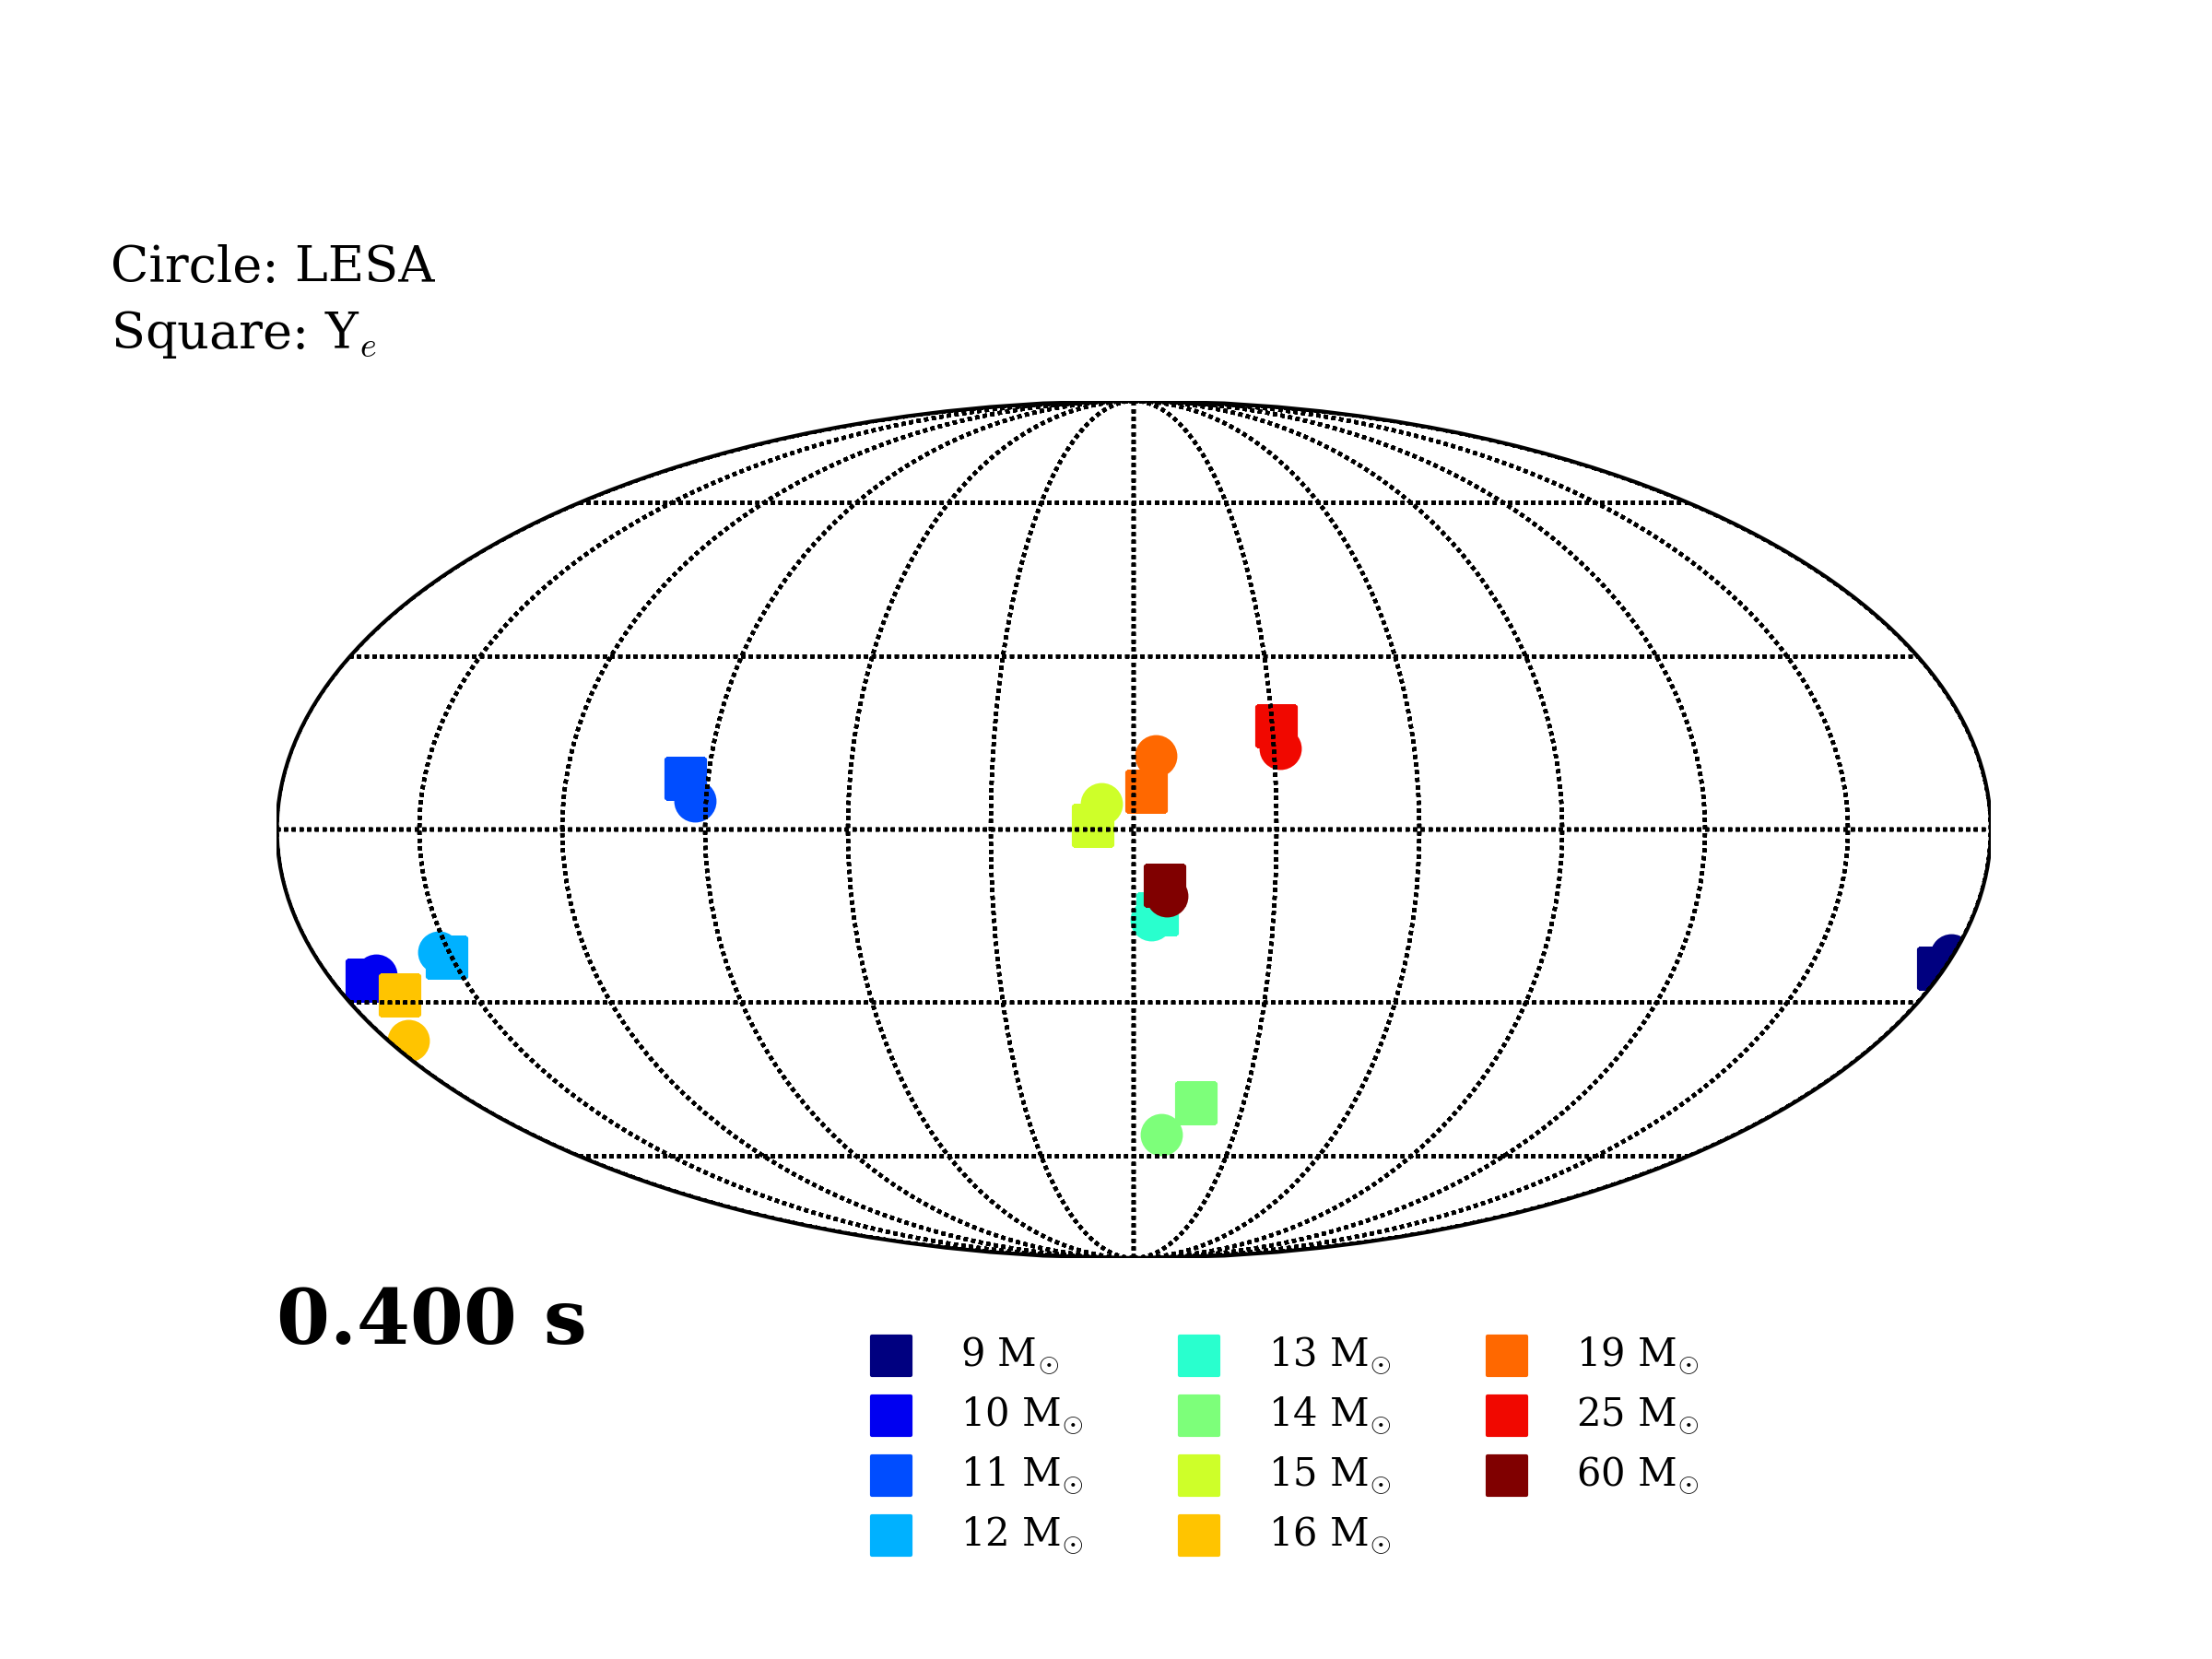
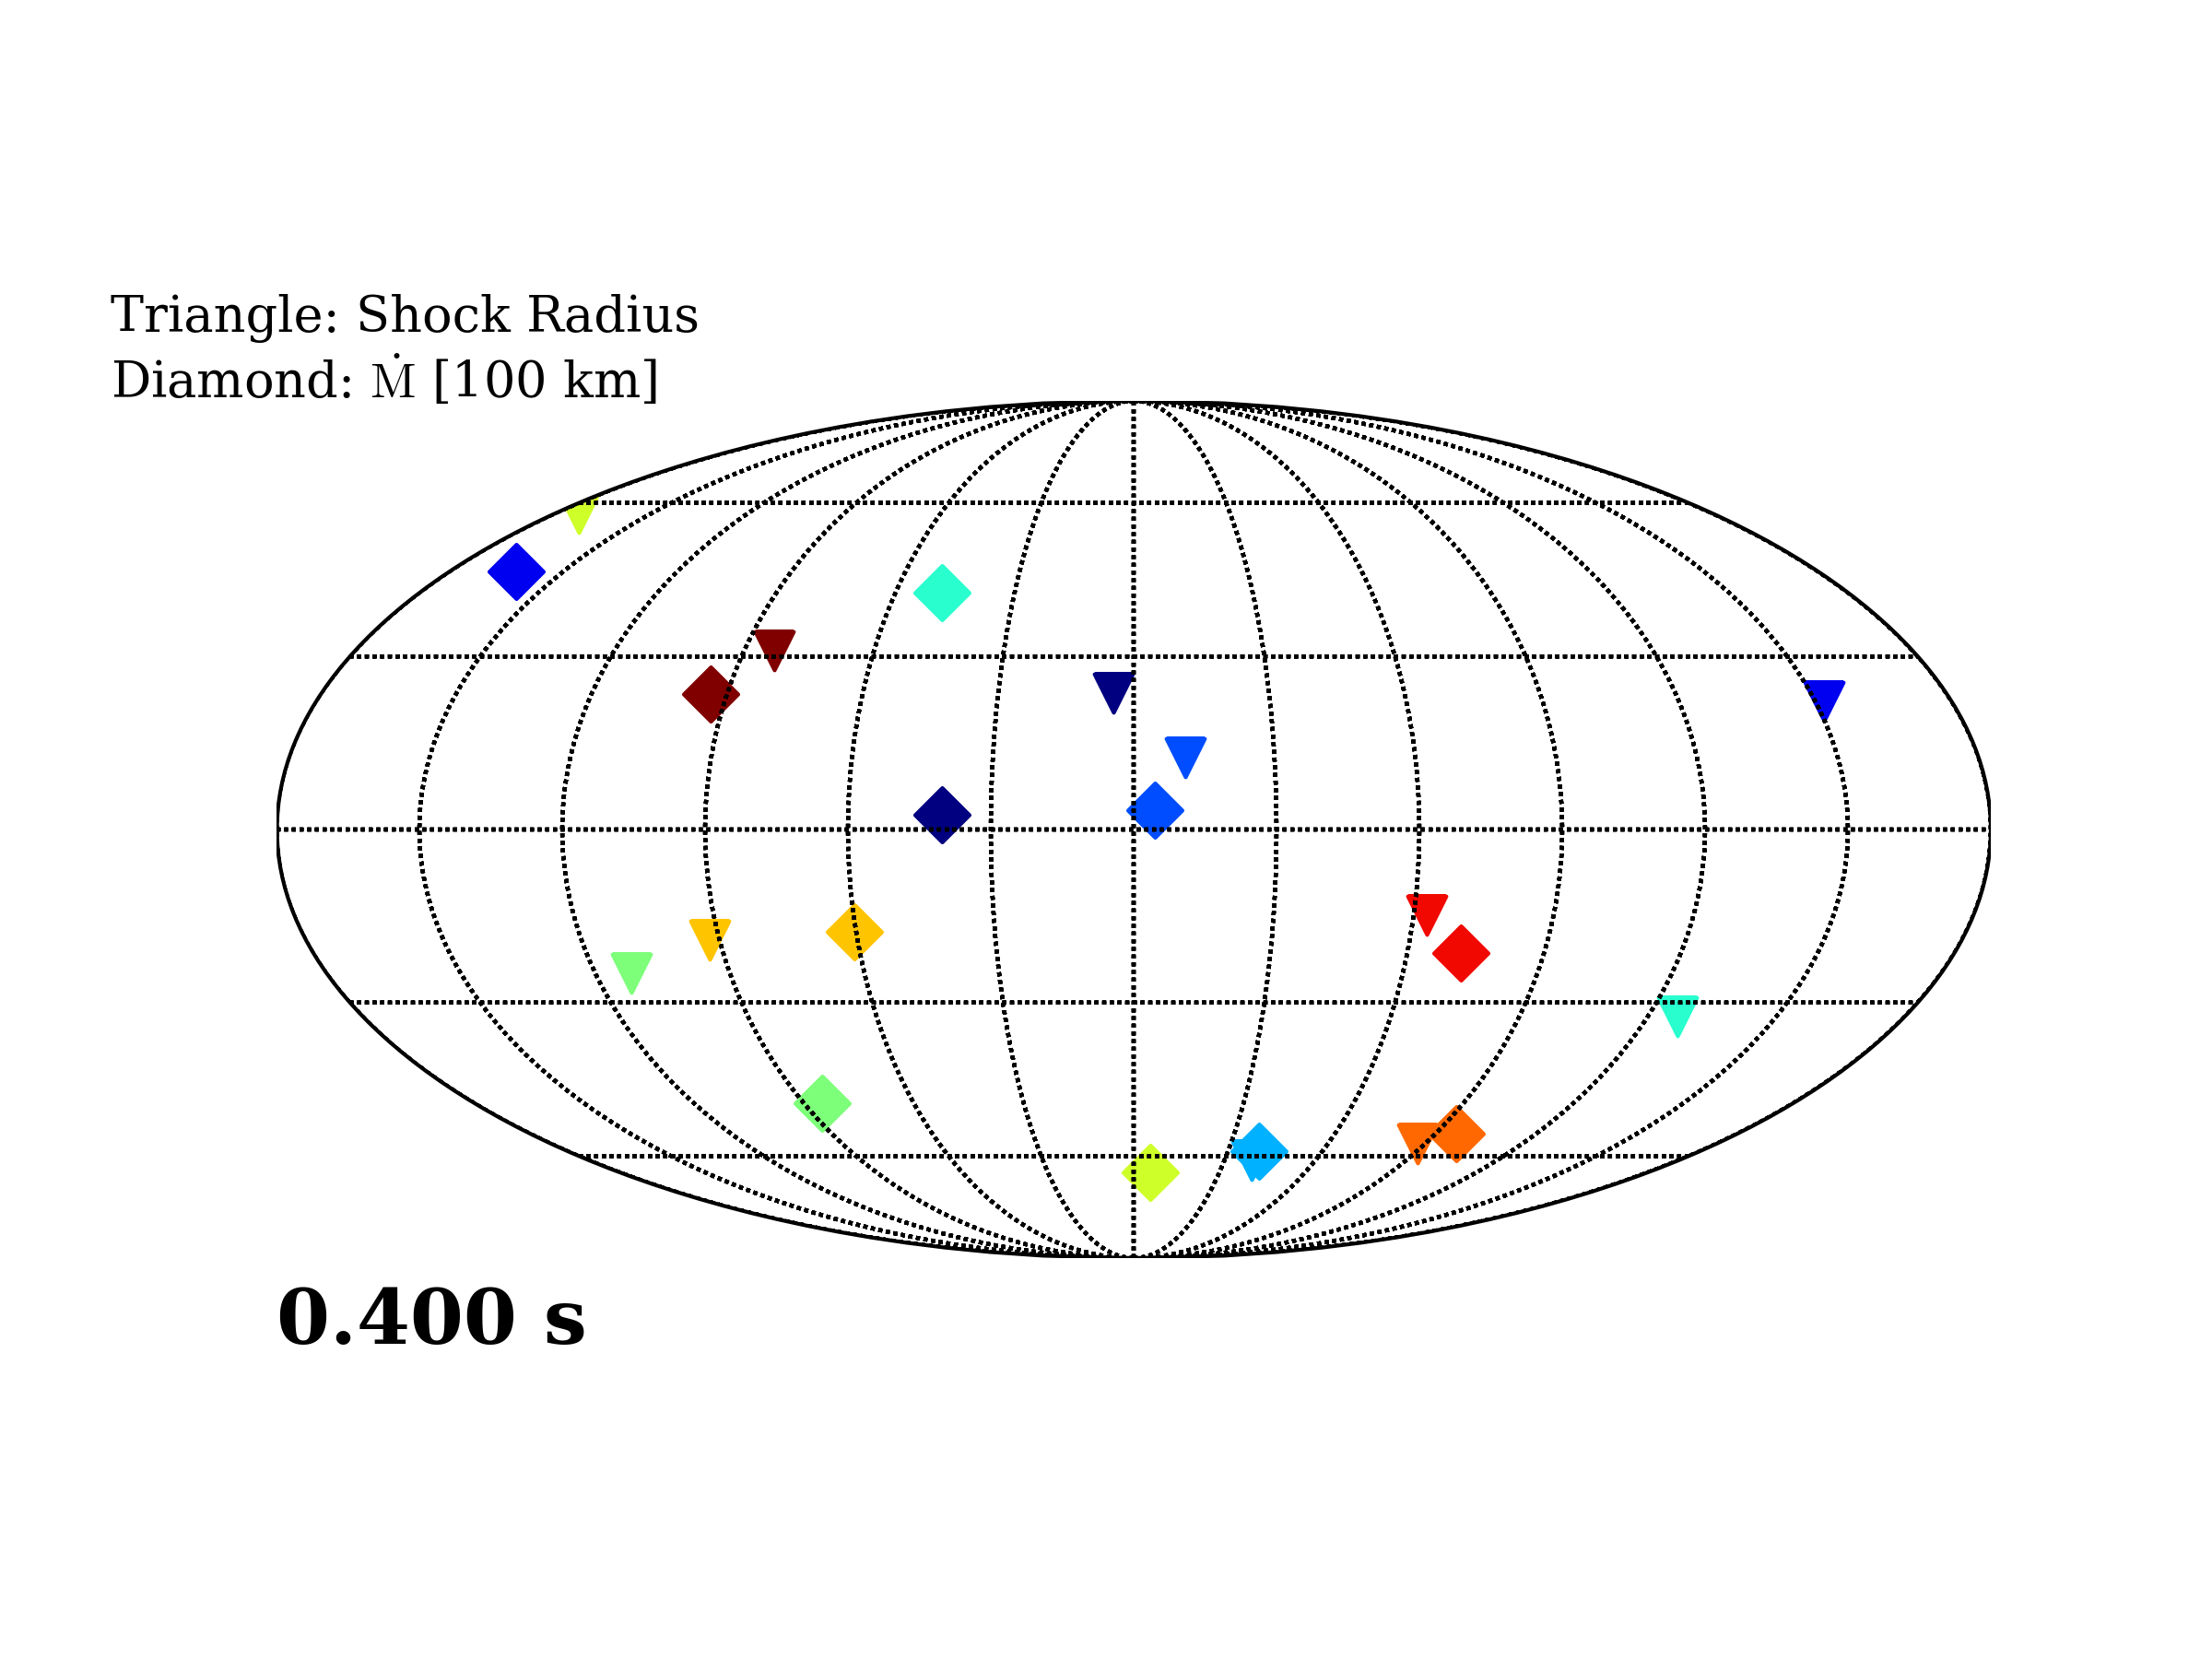
In Fig. 20, we visualize the above angle correlations by plotting a Mollweide projection of the dipole directions of the LESA at 500 km (square), Ye (circle) in the convective PNS at 25 km, and the shock radius (triangle), as well as of the accretion rate anti-dipole direction at 100 km (diamond) at a snapshot 536 milliseconds after bounce for all progenitor models studied in this paper. The LESA dipole closely traces the Ye dipole when the LESA is active. For the non-exploding models, we see precession of the LESA dipole direction around the Ye dipole direction as the spiral SASI develops. In the bottom panel, we plot the antipode of the accretion rate to illustrate its strong anti-correlation in direction with the shock radius.
In Fig. 21, we plot the PNS radius, integrated energy lost by neutrinos, and the fundamental mode frequency of the emitted gravitational waves as a function of time. Increasing neutrino energy losses cause the core to shrink and the fundamental mode frequency to increase. Both the fundamental mode frequency and the PNS radii show less than 10% scatter with progenitor mass. The total energy lost is normalized by the Newtonian binding energy of the PNS to reduce scatter. Four hundred milliseconds after bounce, the PNS’s have typical radii of 38 km and -mode gravitational wave frequencies of 800 Hz. To illustrate the correlation between the PNS radii and -mode frequency, we find a least-squared fit to the mean behavior,
| (10) |
where the best-fit power lies between 0.25 and 0.31, or conversely, we can invert to find that the fundamental mode frequency scales as the PNS radius to the 3 to 4 power, to a multiplicative constant and additive offset. We emphasize that this scaling is for illustrative purposes, to indicate the PNS-probing power of future supernovae GW detections, and can certainly be improved upon.
The -mode gravitational waves depend approximately upon the average density of the PNS (Müller et al. 2013; Sotani et al. 2019; Torres-Forné et al. 2019). In Fig. 22, we plot the gravitational wave fundamental mode frequency normalized by the PNS dynamical time, depending on the PNS mass and radius alone. The result is largely progenitor-independent (roughly 0.35 divided by the dynamical time), with only 10% variation by progenitor mass, suggesting that observations of gravitational wave frequencies from a galactic event will constrain the PNS mass and radius. Independent measurement of the PNS gravitational mass will further constrain the PNS radius, providing insight into the PNS mass-radius relation and nuclear equation of state.
8 Conclusions
We have provided in this paper the time series and angular distributions of the neutrino and gravitational-wave emissions of eleven state-of-the-art 3D non-rotating models of core-collapse supernovae and explored possible correlations between these signatures and the real-time dynamics of the shock and the proto-neutron-star core.222The neutrino and gravitational wava data are available from the authors upon request. This is the largest set of high-fidelity 3D simulations yet performed and reveals the global characteristics and general systematics for a wide range of available progenitor structures. Identifications of the predicted temporal fluctuations in these emissions in detectors on Earth can be used to constrain core and explosion dynamics in real time before, during, and after the supernova explosion is underway. We find that the neutrino emissions of non-rotating models retain a good degree of isotropy on average, but with instantaneous excursions about the mean inferred luminosity in a given direction of as much as 20%. Dipolar angular RMS variations in the neutrino emissions are generally restricted to 10% of the mean after the non-linear turbulent phase is reached and after the supernova is launched (if it is). Most explosions involve in their first phases simultaneous explosion and accretion, with a wasp-waist structure and unsymmetric-dipolar explosive ejection (Burrows et al., 2019). The deviation from isotropy is least for the “"-type neutrinos. The temporal variations in the neutrino emissions reflect the motions of the standing accretion shock before explosion, which itself correlates with the temporal and angular variations in the mass accretion rate through the shock. In particular, we identify a temporal correlation between the dipole component of the shock surface and the corresponding quantities for the accretion rate and the neutrino emissions. We also find that the vector direction of the dipole of the Ye distribution in the inner region of proto-neutron-star convection and of that of the LESA are highly correlated, particularly after explosion. Furthermore, we witness the LESA phenomenon in all our models, though with distinctive differences in magnitude and temporal evolution.
We find, not unexpectedly, that the time series of the neutrino signatures at a detector bear the stamp of the hydrodynamics of shock motion before explosion and of episodic mass accretion after explosion. Determination of the characteristic timescales of these temporal fluctuations in the neutrino signals can be used to determine the timescales and behavior of shock motion. In particular, if there is a SASI (which we see for only non-exploding models, or over a short time span for models with late explosions), it is reflected in a correponding temporal variation at the SASI frequency in the neutrino signal and at twice the SASI frequency in the gravitational-wave signal. For our non-rotating model set, though the instantaneous values of the different gravitational strain polarizations, h+,×, can be out of phase, on average they are similar in magnitude and frequency content. However, their instantaneous angular variation, both for a given polarization and between polarizations, can be quite large. The relative magnitude of the different polarizations in the initial phase of gravitational radiation, associated with the distinct prompt-convection phase, bears the stamp of the angular character of the initial perturbations. Angular emission patterns and differences between polarizations would be even more pronounced for rapidly-rotating models for which a given preferred direction is set and for which polarization differences in the angular emission pattern won’t average out (Hayama et al., 2018).
For our entire set of 3D models, we find strong connections between the cumulative neutrino energy losses, the radius of the proto-neutron star, and the -mode frequency of the gravitational wave emissions. All these quantities are monotonic with time after bounce and measurement of, for instance, the -mode frequency or the cumulative neutrino energy loss can be used to constrain the others. When physically normalized, the progenitor-to-progenitor variation in any of these reduced quantities is no more than 10%. Moreover, the -mode frequency, times the instantaneous physical dynamical time, is independent of time after bounce to better than 10%. This implies that simultaneous measurement of gravitational waves and neutrinos from a given supernova event can be used together to extract real physical quantities of the core from which the supernova explosion is launched. Hence, and importantly, the neutrino data can aid in the interpretation of the gravitational-wave data, and vice versa. Since both the distance and spectral type of a galactic core-collapse progenitor are likely to be determined quickly, constraining possible core structures and enabling the determination of absolute neutrino and gravitational-wave powers, the additional correlations we highlight here will enhance the potential scientific return from a galactic event.
In this paper, we have mined our recent extensive suite of 3D supernova simulations to explore some of the correlations between core dynamics and its temporal evolution and the dominant neutrino and gravitational-wave signatures upon which this dynamics is stamped. The next step will be to filter our emission predictions through detector pipelines, including in the case of neutrinos the effect of neutrino oscillations (Seadrow et al., 2018). Whether the features we have predicted can be discerned at Earth will depend upon supernova distance and detector characteristics. However, whatever detector configurations exist and are online when the next galactic core-collapse supernova explodes, we hope we have demonstrated with this paper that modern 3D simulations, incorporating the necessary physical realism, can be used profitably and in detail to inform the interpretation of such a marvelous astronomical opportunity, when next it arises.
9 Acknowledgments
The authors are grateful for useful discussions with Sean Couch and Hiroki Nagakura and insights from Josh Dolence and Aaron Skinner. We acknowledge support from the U.S. Department of Energy Office of Science and the Office of Advanced Scientific Computing Research via the Scientific Discovery through Advanced Computing (SciDAC4) program and Grant DE-SC0018297 (subaward 00009650) and support from the U.S. NSF under Grants AST-1714267 and PHY-1144374. The authors also acknowledge generous HPC allocations from the DOE/ASCR INCITE program under Contract DE-AC02-06CH11357; Blue-Waters PRACs under awards OCI-0725070, ACI-1238993, TG-AST170045, and OAC-1809073; and an XSEDE/Stampede2 award (under ACI-1548562). Furthermore, the authors employed computational resources provided by the TIGRESS high performance computer center at Princeton University, which is jointly supported by the Princeton Institute for Computational Science and Engineering (PICSciE) and the Princeton University Office of Information Technology, and acknowledge our continuing allocation at the National Energy Research Scientific Computing Center (NERSC), which is supported by the Office of Science of the US Department of Energy (DOE) under contract DE-AC03-76SF00098. DR cites partial support as a Frank and Peggy Taplin Fellow at the Institute for Advanced Study.








References
- Abbasi et al. (2011) Abbasi R., et al., 2011, A&A, 535, A109
- Abbott et al. (2016) Abbott B. P., et al., 2016, Phys. Rev. Lett., 116, 061102
- Abe et al. (2011) Abe K., et al., 2011, arXiv e-prints, p. arXiv:1109.3262
- Abe et al. (2016) Abe K., et al., 2016, Astroparticle Physics, 81, 39
- Andresen et al. (2017) Andresen H., Müller B., Müller E., Janka H. T., 2017, MNRAS, 468, 2032
- Andresen et al. (2019) Andresen H., Müller E., Janka H. T., Summa A., Gill K., Zanolin M., 2019, MNRAS, 486, 2238
- Ankowski et al. (2016) Ankowski A., et al., 2016, arXiv e-prints, p. arXiv:1608.07853
- Blondin (2005) Blondin J. M., 2005, in Mezzacappa A., ed., Journal of Physics Conference Series Vol. 16, Journal of Physics Conference Series. pp 370–379, doi:10.1088/1742-6596/16/1/051
- Blondin & Shaw (2007) Blondin J. M., Shaw S., 2007, ApJ, 656, 366
- Blondin et al. (2003) Blondin J. M., Mezzacappa A., DeMarino C., 2003, ApJ, 584, 971
- Brandt et al. (2011) Brandt T. D., Burrows A., Ott C. D., Livne E., 2011, ApJ, 728, 8
- Buras et al. (2003) Buras R., Janka H.-T., Keil M. T., Raffelt G. G., Rampp M., 2003, ApJ, 587, 320
- Burrows & Sawyer (1998) Burrows A., Sawyer R. F., 1998, Phys. Rev. C, 58, 554
- Burrows & Thompson (2004) Burrows A., Thompson T. A., 2004, in Fryer C. L., ed., Astrophysics and Space Science Library Vol. 302, Astrophysics and Space Science Library. pp 133–174, doi:10.1007/978-0-306-48599-2_5
- Burrows et al. (2006) Burrows A., Reddy S., Thompson T. A., 2006, Nuclear Physics A, 777, 356
- Burrows et al. (2012) Burrows A., Dolence J. C., Murphy J. W., 2012, ApJ, 759, 5
- Burrows et al. (2018) Burrows A., Vartanyan D., Dolence J. C., Skinner M. A., Radice D., 2018, Space Science Reviews, 214, 33
- Burrows et al. (2019) Burrows A., Radice D., Vartanyan D., 2019, MNRAS, 485, 3153
- Dolence et al. (2015) Dolence J. C., Burrows A., Zhang W., 2015, ApJ, 800, 10
- Foglizzo (2002) Foglizzo T., 2002, A&A, 392, 353
- Foglizzo et al. (2012) Foglizzo T., Masset F., Guilet J., Durand G., 2012, Physical Review Letters, 108, 051103
- Fryer (1999) Fryer C. L., 1999, ApJ, 522, 413
- Fujimoto & Nagakura (2019) Fujimoto S.-i., Nagakura H., 2019, arXiv e-prints, p. arXiv:1906.09553
- Glas et al. (2018) Glas R., Janka H. T., Melson T., Stockinger G., Just O., 2018, arXiv e-prints, p. arXiv:1809.10150
- Glas et al. (2019) Glas R., Just O., Janka H. T., Obergaulinger M., 2019, ApJ, 873, 45
- Hanke et al. (2012) Hanke F., Marek A., Müller B., Janka H.-T., 2012, ApJ, 755, 138
- Hanke et al. (2013) Hanke F., Müller B., Wongwathanarat A., Marek A., Janka H.-T., 2013, ApJ, 770, 66
- Hayama et al. (2018) Hayama K., Kuroda T., Kotake K., Takiwaki T., 2018, MNRAS, 477, L96
- Horiuchi et al. (2017) Horiuchi S., Nakamura K., Takiwaki T., Kotake K., 2017, Journal of Physics G Nuclear Physics, 44, 114001
- Horowitz et al. (2017) Horowitz C. J., Caballero O. L., Lin Z., O’Connor E., Schwenk A., 2017, Phys. Rev. C, 95, 025801
- Hyper-Kamiokande Proto-Collaboration et al. (2018) Hyper-Kamiokande Proto-Collaboration et al., 2018, arXiv e-prints, p. arXiv:1805.04163
- Juodagalvis et al. (2010) Juodagalvis A., Langanke K., Hix W. R., Martínez-Pinedo G., Sampaio J. M., 2010, Nuclear Physics A, 848, 454
- Köpke & IceCube Collaboration (2011) Köpke L., IceCube Collaboration 2011, in Journal of Physics Conference Series. p. 012029 (arXiv:1106.6225), doi:10.1088/1742-6596/309/1/012029
- Kotake et al. (2018) Kotake K., Takiwaki T., Fischer T., Nakamura K., Martínez-Pinedo G., 2018, ApJ, 853, 170
- Kuroda et al. (2016) Kuroda T., Kotake K., Takiwaki T., 2016, ApJ, 829, L14
- Kuroda et al. (2017) Kuroda T., Kotake K., Hayama K., Takiwaki T., 2017, ApJ, 851, 62
- Lentz et al. (2015) Lentz E. J., et al., 2015, ApJ, 807, L31
- Lu et al. (2015) Lu J.-S., Cao J., Li Y.-F., Zhou S., 2015, Journal of Cosmology and Astro-Particle Physics, 2015, 044
- Marek & Janka (2009) Marek A., Janka H.-T., 2009, ApJ, 694, 664
- Marek et al. (2006) Marek A., Dimmelmeier H., Janka H.-T., Müller E., Buras R., 2006, A&A, 445, 273
- Migenda (2018) Migenda J., 2018, arXiv e-prints, p. arXiv:1804.01877
- Morozova et al. (2018) Morozova V., Radice D., Burrows A., Vartanyan D., 2018, ApJ, 861, 10
- Müller (2019) Müller B., 2019, arXiv e-prints, p. arXiv:1904.11067
- Müller & Janka (2015) Müller B., Janka H.-T., 2015, MNRAS, 448, 2141
- Müller et al. (2013) Müller B., Janka H.-T., Marek A., 2013, The Astrophysical Journal, 766, 43
- Müller et al. (2017) Müller B., Melson T., Heger A., Janka H.-T., 2017, MNRAS, 472, 491
- Murphy & Burrows (2008) Murphy J. W., Burrows A., 2008, ApJ, 688, 1159
- Nagakura et al. (2019a) Nagakura H., Burrows A., Radice D., Vartanyan D., 2019a, arXiv e-prints, p. arXiv:1905.03786
- Nagakura et al. (2019b) Nagakura H., Sumiyoshi K., Yamada S., 2019b, arXiv e-prints, p. arXiv:1906.10143
- Nakamura et al. (2016) Nakamura K., Horiuchi S., Tanaka M., Hayama K., Takiwaki T., Kotake K., 2016, Monthly Notices of the Royal Astronomical Society, 461, 3296
- O’Connor & Couch (2018a) O’Connor E. P., Couch S. M., 2018a, ApJ, 854, 63
- O’Connor & Couch (2018b) O’Connor E. P., Couch S. M., 2018b, ApJ, 865, 81
- O’Connor & Ott (2013) O’Connor E., Ott C. D., 2013, ApJ, 762, 126
- Oohara et al. (1997) Oohara K.-i., Nakamura T., Shibata M., 1997, Progress of Theoretical Physics Supplement, 128, 183
- Ott et al. (2018) Ott C. D., Roberts L. F., da Silva Schneider A., Fedrow J. M., Haas R., Schnetter E., 2018, ApJ, 855, L3
- Pajkos et al. (2019) Pajkos M. A., Couch S. M., Pan K.-C., O’Connor E. P., 2019, ApJ, 878, 13
- Powell & Müller (2019) Powell J., Müller B., 2019, MNRAS, 487, 1178
- Radice et al. (2017) Radice D., Burrows A., Vartanyan D., Skinner M. A., Dolence J. C., 2017, ApJ, 850, 43
- Radice et al. (2019) Radice D., Morozova V., Burrows A., Vartanyan D., Nagakura H., 2019, ApJ, 876, L9
- Raffelt (2005) Raffelt G. G., 2005, Physica Scripta, T121, 102
- Roberts et al. (2016) Roberts L. F., Ott C. D., Haas R., O’Connor E. P., Diener P., Schnetter E., 2016, ApJ, 831, 98
- Scheck et al. (2008) Scheck L., Janka, H.-Th. Foglizzo, T. Kifonidis, K. 2008, A&A, 477, 931
- Seadrow et al. (2018) Seadrow S., Burrows A., Vartanyan D., Radice D., Skinner M. A., 2018, MNRAS, 480, 4710
- Skinner et al. (2016) Skinner M. A., Burrows A., Dolence J. C., 2016, ApJ, 831, 81
- Skinner et al. (2019) Skinner M. A., Dolence J. C., Burrows A., Radice D., Vartanyan D., 2019, ApJS, 241, 7
- Sotani et al. (2019) Sotani H., Kuroda T., Takiwaki T., Kotake K., 2019, arXiv e-prints, p. arXiv:1906.04354
- Srivastava et al. (2019) Srivastava V., Ballmer S., Brown D. A., Afle C., Burrows A., Radice D., Vartanyan D., 2019, arXiv e-prints, p. arXiv:1906.00084
- Steiner et al. (2013) Steiner A. W., Hempel M., Fischer T., 2013, ApJ, 774, 17
- Sukhbold et al. (2016) Sukhbold T., Ertl T., Woosley S. E., Brown J. M., Janka H.-T., 2016, ApJ, 821, 38
- Sukhbold et al. (2018) Sukhbold T., Woosley S. E., Heger A., 2018, ApJ, 860, 93
- Summa et al. (2016) Summa A., Hanke F., Janka H.-T., Melson T., Marek A., Müller B., 2016, ApJ, 825, 6
- Summa et al. (2018) Summa A., Janka H.-T., Melson T., Marek A., 2018, ApJ, 852, 28
- Suwa et al. (2016) Suwa Y., Yamada S., Takiwaki T., Kotake K., 2016, ApJ, 816, 43
- Suwa et al. (2019) Suwa Y., Sumiyoshi K., Nakazato K., Takahira Y., Koshio Y., Mori M., Wendell R. A., 2019, arXiv e-prints, p. arXiv:1904.09996
- Takiwaki et al. (2016) Takiwaki T., Kotake K., Suwa Y., 2016, MNRAS, 461, L112
- Tamborra et al. (2013) Tamborra I., Hanke F., Müller B., Janka H.-T., Raffelt G., 2013, Phys. Rev. Lett., 111, 121104
- Tamborra et al. (2014a) Tamborra I., Raffelt G., Hanke F., Janka H.-T., Müller B., 2014a, Phys. Rev. D, 90, 045032
- Tamborra et al. (2014b) Tamborra I., Hanke F., Janka H.-T., Müller B., Raffelt G. G., Marek A., 2014b, ApJ, 792, 96
- Tews et al. (2017) Tews I., Lattimer J. M., Ohnishi A., Kolomeitsev E. E., 2017, ApJ, 848, 105
- Thompson et al. (2000) Thompson T. A., Burrows A., Horvath J. E., 2000, Phys. Rev. C, 62, 035802
- Torres-Forné et al. (2019) Torres-Forné A., Cerdá-Durán P., Obergaulinger M., Müller B., Font J. A., 2019, arXiv e-prints, p. arXiv:1902.10048
- Totani et al. (1998) Totani T., Sato K., Dalhed H. E., Wilson J. R., 1998, ApJ, 496, 216
- Vartanyan et al. (2018) Vartanyan D., Burrows A., Radice D., Skinner M. A., Dolence J., 2018, MNRAS, 477, 3091
- Vartanyan et al. (2019) Vartanyan D., Burrows A., Radice D., Skinner M. A., Dolence J., 2019, MNRAS, 482, 351
- Vaytet et al. (2011) Vaytet N. M. H., Audit E., Dubroca B., Delahaye F., 2011, J. Quant. Spectrosc. Radiative Transfer, 112, 1323
- Walk et al. (2018) Walk L., Tamborra I., Janka H.-T., Summa A., 2018, Phys. Rev. D, 98, 123001
- Walk et al. (2019) Walk L., Tamborra I., Janka H.-T., Summa A., 2019, arXiv e-prints, p. arXiv:1901.06235
- Wallace et al. (2016) Wallace J., Burrows A., Dolence J. C., 2016, ApJ, 817, 182
- Woosley & Heger (2007) Woosley S. E., Heger A., 2007, Phys. Rep., 442, 269
- Yoshida et al. (2019) Yoshida T., Takiwaki T., Kotake K., Takahashi K., Nakamura K., Umeda H., 2019, arXiv e-prints, p. arXiv:1903.07811