CHORUS. III. Photometric and Spectroscopic Properties of
Ly Blobs at
Abstract
We report the Subaru Hyper Suprime-Cam (HSC) discovery of two Ly blobs (LABs), dubbed z70-1 and z49-1 at and respectively, that are Ly emitters with a bright () and spatially-extended Ly emission, and present the photometric and spectroscopic properties of a total of seven LABs; the two new LABs and five previously-known LABs at . The z70-1 LAB shows the extended Ly emission with a scale length of kpc, about three times larger than the UV continuum emission, making z70-1 the most distant LAB identified to date. All of the 7 LABs, except z49-1, exhibit no AGN signatures such as X-ray emission, Nv1240 emission, or Ly line broadening, while z49-1 has a strong Civ1548 emission line indicating an AGN on the basis of the UV-line ratio diagnostics. We carefully model the point-spread functions of the HSC images, and conduct two-component exponential profile fitting to the extended Ly emission of the LABs. The Ly scale lengths of the core (star-forming region) and the halo components are kpc and kpc, respectively. The average of the LABs falls on the extrapolation of the -Ly luminosity relation of the Ly halos around VLT/MUSE star-forming galaxies at the similar redshifts, suggesting that typical LABs at are not special objects, but star-forming galaxies at the bright end.
1 Introduction
Ly emitters (LAEs) are important objects to study the formation and evolution of star-forming galaxies at high redshifts where the redshifted Ly emission becomes observable with ground-based telescopes (e.g. Ouchi et al. 2003, 2008). Previous narrowband imaging surveys have identified LAEs with very luminous Ly emission (log ) and a large isophotal area ( kpc2) at . These luminous and spatially extended LAEs are often referred to as Ly blobs (LABs; e.g. Keel et al. 1999; Steidel et al. 2000; Francis et al. 2001; Matsuda et al. 2004). One well-known example of LABs is LAB1 (Steidel et al. 2000) at , while the most distant ones are Himiko (Ouchi et al., 2009) and CR7 (Sobral et al., 2015) at 6.6. LABs are important objects to study massive galaxies and their circumgalactic medium (CGM) in the early universe. Although LABs have been analyzed individually by many studies, the relation between LABs at different epochs of (e.g. LAB1) and (e.g. Himiko and CR7) is still unclear.
Diffuse Ly nebulae called Ly halos (LAHs) are a common feature around LAEs with at , and have been identified individually (e.g. Rauch et al. 2008; Wisotzki et al. 2016; Leclercq et al. 2017) or statistically by stacking analysis (e.g. Hayashino et al. 2004; Steidel et al. 2011; Matsuda et al. 2012; Feldmeier et al. 2013; Momose et al. 2014, 2016; Wisotzki et al. 2018). The typical isophotal area of LAHs is smaller than that of LABs at the similar redshift. However, it should be noted that the isophotal area measurement depends on both surface brightness detection limits and radial profiles. At the same detection limit, faint LAHs show smaller isophotal areas than bright ones if the radial profile shapes are the same. Similarly, because the Ly luminosities of LAHs are fainter than those of LABs by an order of magnitude, LAHs should have smaller isophotal areas than LABs if identical radial profile shapes are assumed. Nevertheless, it is still unclear whether LAHs and LABs have similar shapes of Ly radial profiles.
Konno et al. (2016) and Sobral et al. (2018) suggest that active galactic nuclei (AGNs) exist in LAEs brighter than a luminosity limit of log at . Because most LABs exceed this luminosity limit, it is expected that LABs have AGN activities. Previously, AGNs have been identified in some LABs (e.g. LAB2 in Steidel et al. 2000; Basu-Zych & Scharf 2004), while no evidence of AGNs is found in the other LABs (e.g. LAB1; Geach et al. 2007; Matsuda et al. 2007). Statistically, Geach et al. (2009) investigate 29 LABs at and find that of the LABs contain AGNs. To explain these observational results, there are two possibilities. One possibility is that all LABs intrinsically have AGNs, and that some AGNs are obscured or too faint to be identified. Another possibility is that there exist two kinds of LABs with and without AGNs.
Related to the possible AGN activities in LABs, the extended Ly emission can be explained by several scenarios listed below.
-
1.
Fluorescence. There exists some neutral hydrogen gas in the CGM around a galaxy that is heated by an AGN or star formation. The neutral hydrogen gas is photoionized by the radiation from the galaxy center or UV background. Ly photons are then emitted during the recombination process (e.g. Mas-Ribas & Dijkstra 2016).
- 2.
-
3.
Gravitational cooling radiation. Some inflow streams exist around a galaxy, and accrete onto the galaxy center. Ly photons are emitted by collisional excitation of neutral hydrogen in the streams. In this radiation process, the streams release their gravitational potential energy (e.g. Dekel et al. 2009).
- 4.
-
5.
Satellite galaxies. A central galaxy is surrounded by multiple satellite galaxies that emit Ly photons during star formation. In this scenario, a galaxy may exhibit both extended Ly emission and extended UV continuum (e.g. Mas-Ribas et al. 2017).
Because the different possible scenarios are expected to cause different shapes of Ly radial profiles, various studies have tried to pinpoint the origin of extended Ly emission by comparing Ly radial profiles from models with those from observations (e.g. Lake et al. 2015; Mas-Ribas & Dijkstra 2016; Mas-Ribas et al. 2017). However, these studies target LAEs with fainter Ly luminosities (log ) than those of LABs. These models may not well explain the physical origin of the luminous and extended Ly emission of LABs.
In this paper, we present the identification of 2 new LABs at and 7.0. Including 5 LABs at and 6.6 identified by previous studies, we investigate the photometric and spectroscopic properties of a total of 7 LABs. We perform profile fitting to model the diffuse Ly emission around LABs, and compare our best-fit models of LABs with those of LAHs in the literature. We investigate AGN activities in LABs with X-ray data and UV-line ratio diagnostics, and discuss the possible physical orgins of the extended Ly emission around LABs.
This paper is organized as follows. In Section 2, we describe the observations, data, and identification of 2 new LABs. In Section 3, we present the spectroscopic analysis of LABs. Our results are shown in Section 4, and the discussions are presented in Section 5. We summarize our findings in Section 6. Throughout this paper, we use AB magnitudes (Oke & Gunn, 1983) and physical distances unless we indicate otherwise. A CGM cosmology with , , and is adopted.
2 Observations, Data, and LAB Identification
In this paper, we study a total of 7 LABs that include 2 new LABs from our observations and 5 LABs from previous studies. We use photometric and spectroscopic data either from our observations or in the literature.
2.1 New LABs Identified by CHORUS Survey
2.1.1 Imaging Observations and Data Reduction
We carried out narrowband imaging observations with Subaru/Hyper Suprime-Cam (HSC; Miyazaki et al. 2018; Komiyama et al. 2018; Kawanomoto et al. 2018; Furusawa et al. 2018) in the course of project Cosmic HydrOgen Reionization Unveiled with Subaru (CHORUS; PI: A. K. Inoue). We used two narrowbands of NB718 ( Å, FWHM=110 Å) and NB973 ( Å, FWHM=100 Å). The central wavelengths of NB718 and NB973 filters were chosen to detect redshifted Ly emission at and , respectively. The NB718 data were taken on February 25, March 23, and March 25, 2017, while the NB973 observations were conducted on January 26 and 28, 2017. The NB718 observations covered the COSMOS field, and the NB973 observations were carried out in the SXDS and COSMOS fields. The effective survey areas were 1.64 and 1.50 deg2 in the COSMOS and SXDS fields, respectively. The typical seeing sizes during observations were .
We reduce the NB718 and NB973 images with the HSC pipeline (Bosch et al. 2018) that uses codes from the Large Synoptic Survey Telescope (LSST) pipeline (Ivezić et al., 2008; Axelrod et al., 2010; Jurić et al., 2015). The astrometry and photometry are calibrated with the imaging data from the Panoramic Survey Telescope and Rapid Response System 1 (Pan-STARRS1; Schlafly et al. 2012; Tonry et al. 2012; Magnier et al. 2013) survey. We do not use exposures with seeing sizes larger than during the reduction because these exposures were taken under bad weather conditions. The total integration times of the reduced NB718 and NB973 images are 6.3 hours and 14.7 hours, respectively. The typical limiting magnitudes in a -diameter aperture are 26.2 in NB718 data and 24.9 in NB973 data.
During the reduction, in addition to the NB718 and NB973 images we also use the ultra-deep layer data of broadbands (, , , , and ) from the Subaru Strategic Program (SSP) survey (PI: S. Miyazaki; Aihara et al. 2018) for source detection and forced photometry. Details of the source detection and forced photometry are described in Bosch et al. (2018). We do not use areas contaminated either by halos of bright stars (Coupon et al. 2018) or low signal-to-noise ratio pixels such as field edges. The catalogs produced in this procedure are referred to as source catalogs in the following sections.
2.1.2 Photometric Samples of LAEs at and 7.0
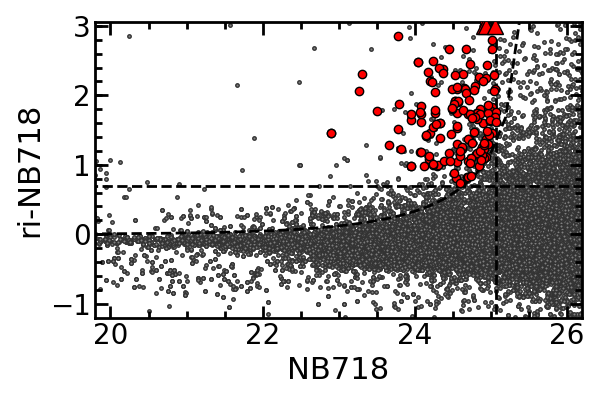
To select LAEs at , we use source catalogs of NB718, , , and filters. We apply the following color criteria,
| (1) |
where the superscription ”ap” indicates the aperture magnitude in a diameter, and no superscription corresponds to the total magnitude. The total magnitude is measured by the CModel photometry described in Bosch et al. (2018). The , , and subscriptions stand for 2 sigma, 3 sigma, and 5 sigma detection limits, respectively. In Equation 1, is calculated by the linear combination of the fluxies in band and band , following . The error of the color is given by , where and are the errors in and , respectively. These criteria allow us to choose LAEs with rest-frame Ly equivalent widths (EW0) greater than 10Å.
In total, 727 objects meet the color criteria. We then visually inspect these objects and exclude 586 spurious sources such as satellite trails. Finally we obtain 141 LAE candidates at . Figure 1 shows the color-magnitude diagram of our LAE candidates at .
The selection of LAEs at is presented in Itoh et al. (2018). Briefly, Itoh et al. (2018) select LAEs with NB973 and broadbands (,,,, and ) following the criteria:
| (2) |
where the meanings of superscriptions and subscriptions are the same as Equation 1.
Finally, there are 34 LAE candidates at after we conduct the color selection and visual inspection.
2.1.3 Identification of Two LABs
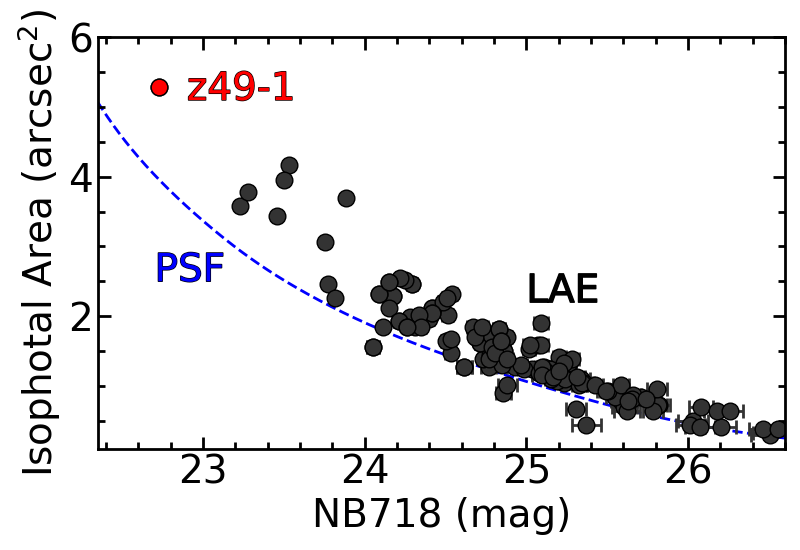
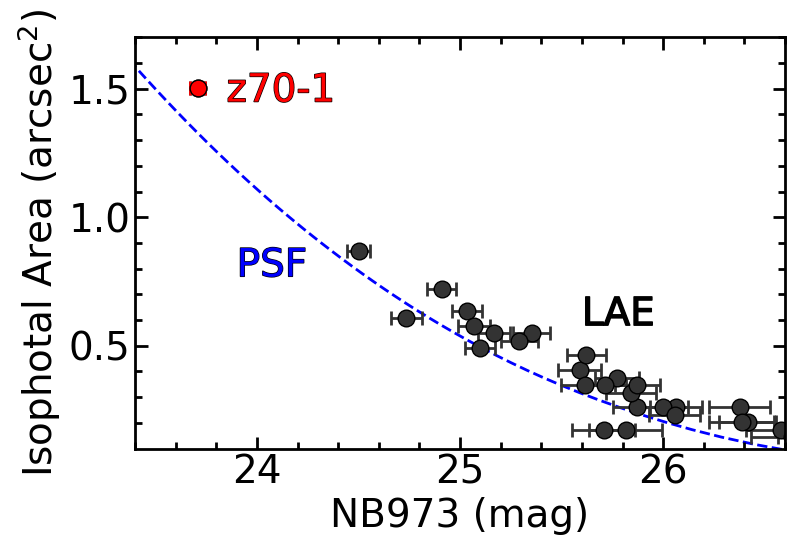
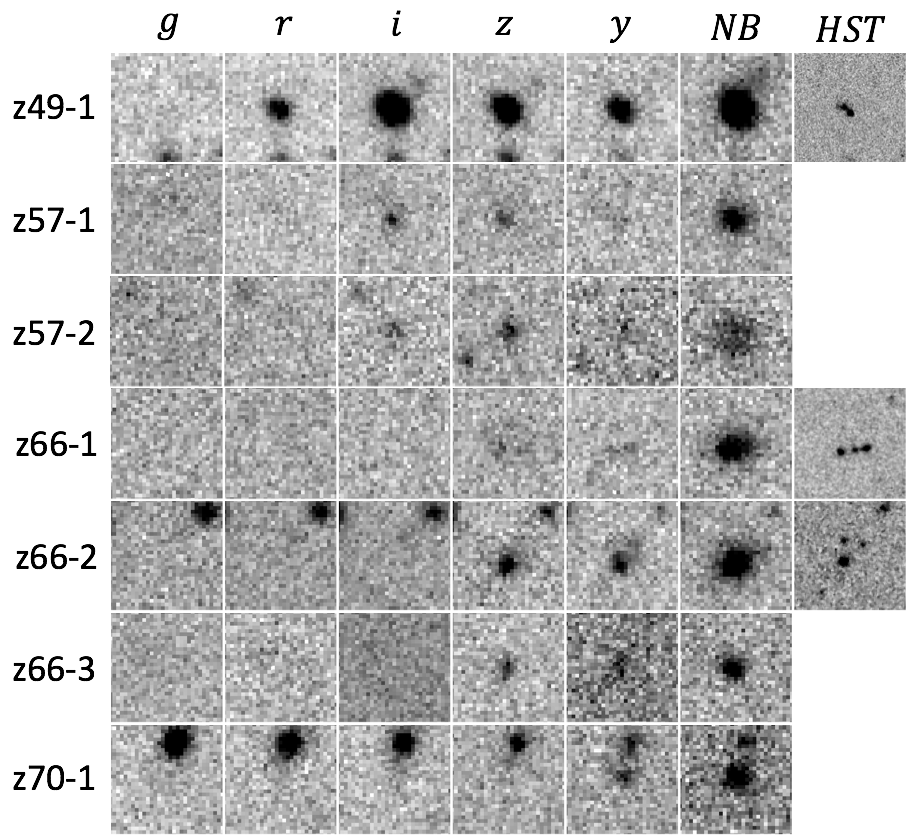
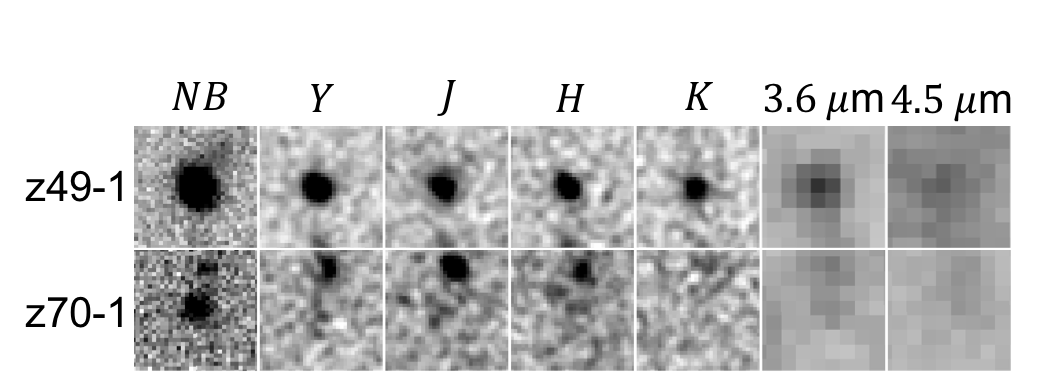
Figure 2 shows isophotal areas as a function of total narrowband magnitude for our LAE candidates at and 7.0. The isophotal area is defined as the area with a surface brightness above the 2 detection limit. We estimate the isophotal area-magnitude relations of point sources using the point spread functions (PSFs) in NB718 and NB973 images. Clearly, at and there are two very bright and large LABs that are named as z49-1 (R.A., decl. [J2000]) and z70-1 (R.A., decl. [J2000]), respectively. The objects of z49-1 and z70-1 show large isophotal areas (157.5 and 42.2 physical kpc2) and bright Ly luminosities ( and erg s-1) that are distinguished from the other LAE candidates at each redshift. Snapshots of z49-1 and z70-1 are presented in Figure 3. The images of z49-1 and z70-1 from UltraVista (, , , and bands) and Spitzer/IRAC (3.6 m and 4.5 m bands) are shown in Figure 4, and will be analyzed in Section 4.
2.1.4 Spectroscopic Observations
We carried out spectroscopic observations for z49-1 with Magellan/LDSS3 on May 28, 2017. The object of z49-1 was observed with an on-source exposure time of 1800s. The observations were conducted in the long-slit mode with a slit width of . We used the OG590 filter with the VPH-Red grism () to cover the expected Ly emission line at z=.
Spectroscopic observations for z70-1 were performed with Keck/DEIMOS (Faber et al., 2003) on Jan 6, 2019. The total on-source exposure time was 3.7 hours. However, we only used the data in the last 1.7 hours because the data in the first 2 hours were taken under bad weather conditions. The slit width was during the observations in the multi-object spectroscopy (MOS) mode. The OG550 filter and the 830G grating ( at 9700 Å) were chosen to cover the wavelength where the Ly emission line at z= was expected.
2.2 LABs Identified in Previous Studies
From previous studies we use 5 LABs including z57-1 and z57-2 (HSC J161927+551144 and HSC J161403+535701 in Shibuya et al. 2018) at z=5.7, z66-1 (Himiko in Ouchi et al. 2009), z66-2 (CR7 in Sobral et al. 2015), and z66-3 (HSC J100334+024546 in Shibuya et al. 2018) at . The imaging data are available from the SSP survey and shown in Figure 3. The spectra of z66-1, z66-2, and z66-3 are taken by Ouchi et al. (2009), Sobral et al. (2015), and Shibuya et al. (2018), respectively.
We carried out spectroscopic follow-up observations for z57-1 and z57-2 with Subaru/FOCAS on July 17, 2018. We chose a slit width of in the MOS mode. The O58 filter and VPH900 grism () were used to cover the expected Ly emission line at . Finally, we obtained data with an on-source exposure time of 1200s for each target.
2.3 Summary of Our LAB Samples
Our final LAB samples include z49-1, z57-1, z57-2, z66-1, z66-2, z66-3 and z70-1 that are referred to as the 7 LABs in the following sections. From the snapshots of the 7 LABs in Figure 3, we can see that apparently all of the 7 LABs are more extended in the narrowband images (NB718, NB816, NB921, and NB973) than the corresponding offband images (, , , and ). Photometric properties of the 7 LABs are summarized in Table LABEL:tab:1. Details of spectroscopic observations of the 7 LABs are presented in Table 2. The spectroscopic data will be shown and discussed in the next section.
| ID | Object name | Redshift | log | EW0 | |||
|---|---|---|---|---|---|---|---|
| (1) | (2) | (3) | (Å) | (4) | |||
| z49-1 | - | 4.9 | 22.66 | 23.89 | 43.54 | 47.5 | 5.68 |
| z57-1 | HSC J161927+551144a | 5.7 | 22.88 | 24.86 | 43.6 | 71.4 | 1.57 |
| z57-2 | HSC J161403+535701a | 5.7 | 23.53 | 25.32 | 43.2 | 20.6 | 4.14 |
| z66-1 | Himikob | 6.6 | 23.55 | 25.00 | 43.40 | 78 | 2.09 |
| z66-2 | CR7c | 6.6 | 23.24 | 24.92 | 43.93 | 211 | 0.62 |
| z66-3 | HSC J100334+024546a | 6.6 | 23.61 | 24.97 | 43.50 | 61.1 | 4.28 |
| z70-1 | - | 7.0 | 23.40 | 25.09 | 43.41 | 73 | 3.65 |
| ID | Instrument | Filter | Grism/grating | Exp. time (s) | Slit width () | |
|---|---|---|---|---|---|---|
| z49-1 | Magellan/LDSS3 | OG590 | VPH-Red | 1,800 | 2.0 | 4.888 |
| z57-1 | Subaru/FOCAS | O58 | VPH900 | 1,200 | 0.8 | 5.709 |
| z57-2 | Subaru/FOCAS | O58 | VPH900 | 1,200 | 0.8 | 5.733 |
| z66-1a | Keck/DEIMOS | GG495 | 830G | 10,800 | 1.0 | 6.595 |
| z66-2b | VLT/X-SHOOTER | - | - | 8,100 | 0.9 | 6.604 |
| z66-3c | Subaru/FOCAS | O58 | VPH900 | 6,000 | 0.8 | 6.575 |
| z70-1 | Keck/DEIMOS | OG550 | 830G | 6,000 | 1.0 | 6.965 |
3 Spectroscopic Analysis
The spectrum of z70-1 is shown in Figure 5. Because the emission line at 9686 is partly overlapped by nearby sky lines, the line shape may be affected by the sky residual after sky subtraction. This emission line cannot be explained by an Oii doublet, because the two peaks of an Oii doublet at this wavelength would have a separation of that is broader than the line observed. We find no other emission lines between 6000 and 10000 that indicate a foreground source. We conclude that z70-1 is not likely a low- object but a LAB at .
Figure 6 presents the spectra of z49-1, z57-1, z57-2, z66-1, z66-2, and z66-3. The spectrum of z49-1 shows an emission line whose line center is at 7160 Å. The line center is measured by fitting a gaussian function to the emission line. Additionally, on the spectrum we find another emission line whose line-center is at 9131 Å, as presented in Figure 7. These two emission lines can only be explained by an object emitting Ly and Civ lines simultaneously at . The emission line at 7160 Å is asymmetric and has a red wing that is consistent with a high- Ly emission line. The object of z49-1 is confirmed as a LAB at . The Ly and Civ fluxes of z49-1 measured from the spectrum are and erg s-1 cm-2, respectively.
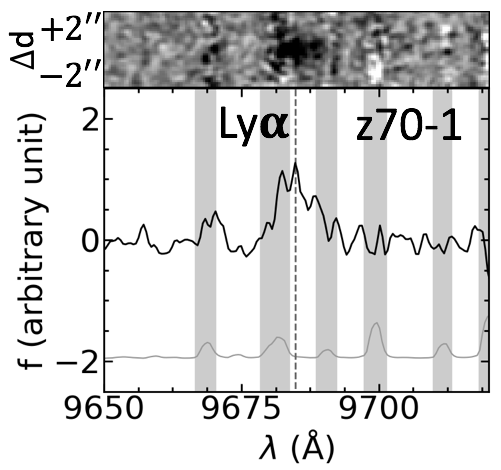

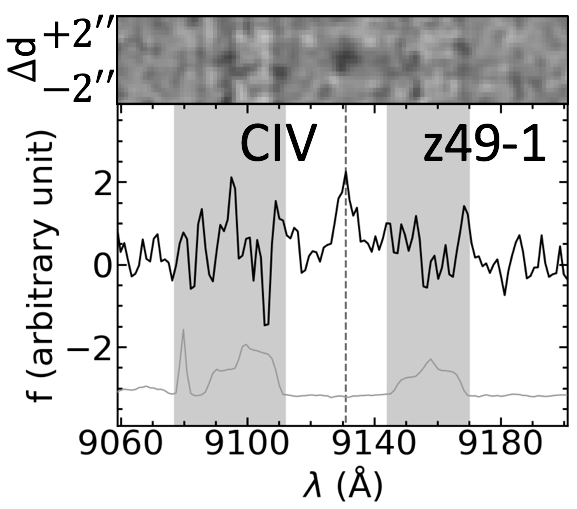
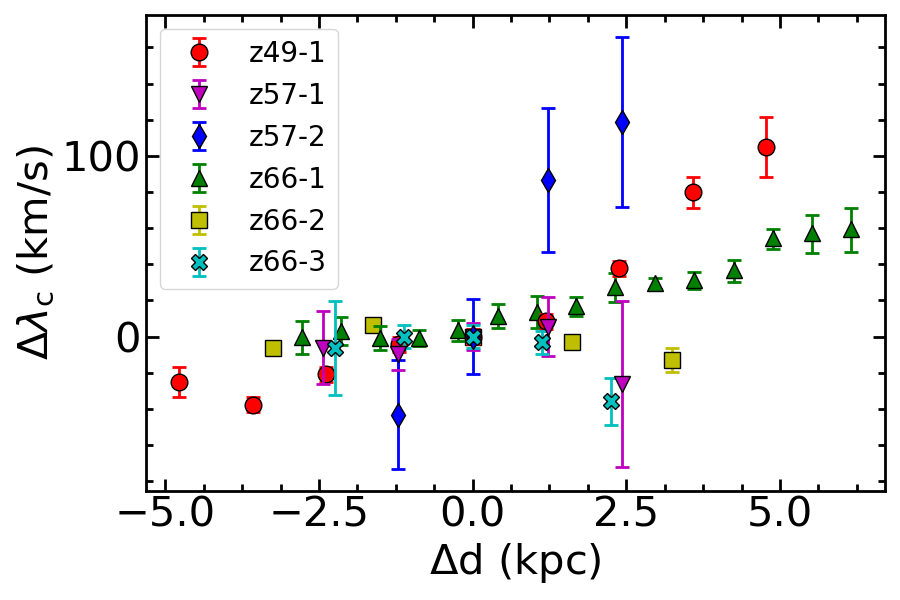
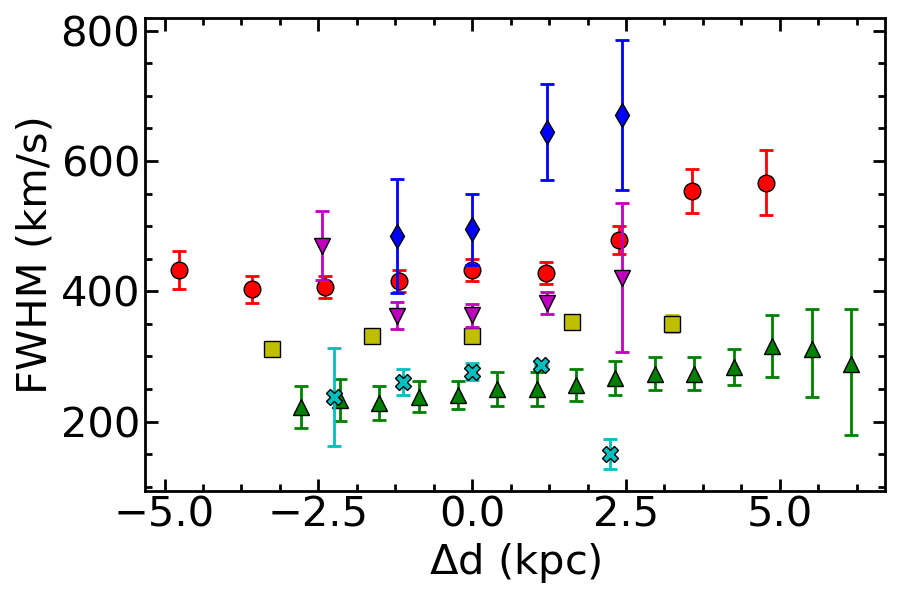
Figure 8 shows the line-center offset and FWHM of the Ly emission line as a function of positional offset . The is the distance between the position of a measurement and a Ly source center. By definition, the Ly-source center is located at . The positive direction of is from the blueshifted side to the redshifted side. The is calculated following . Because the Ly emission line of z70-1 is affected by nearby sky lines as we discussed earlier, we do not include z70-1 in this analysis. In Figure 8, the has a positive correlation with although the correlation for z66-2 is weak. The correlation between and indicates velocity gradients in the the Ly emission lines of our LABs. We notice that the FWHM also positively correlates with . Clearly z49-1 and z57-2 have larger velocity gradients and FWHMs than the other LABs.
4 Results
4.1 Ly Surface Brightness Profiles
To make Ly images of the 7 LABs, we first match the PSFs of narrowband and offband images, and then subtract the offband images from corresponding narrowband images. We use a PSF matching method similar to the one discussed in Aniano et al. (2011). The PSF matching procedure is briefly described below.
First we extract the PSFs of narrowband and offband images by stacking 200-300 bright and unsaturated () point sources in each filter. These PSFs are referred to as initial PSFs. We choose the PSF with the largest FWHM among intial PSFs as the target PSF. Then we calculate convolution kernels that are used to convolve the initial PSFs to the target PSF by
| (3) |
where K, FT, FT-1, PSFi, and PSFt stand for the convolution kernel, Fourier transform, inverse Fourier transform, initial PSF, and target PSF, respectively. Finally we convolve the narrowband and offband images of the 7 LABs with the corresponding kernels to obtain PSF-matched images. The PSFs before and after matching are shown in Figure 9.
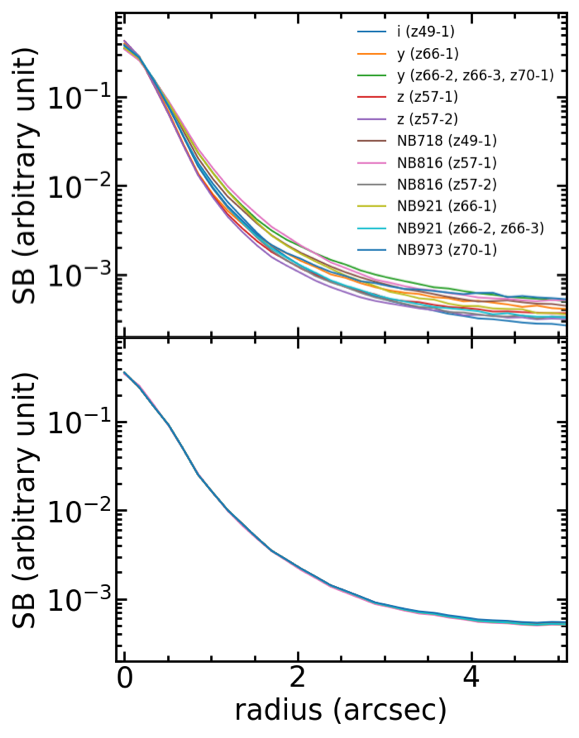
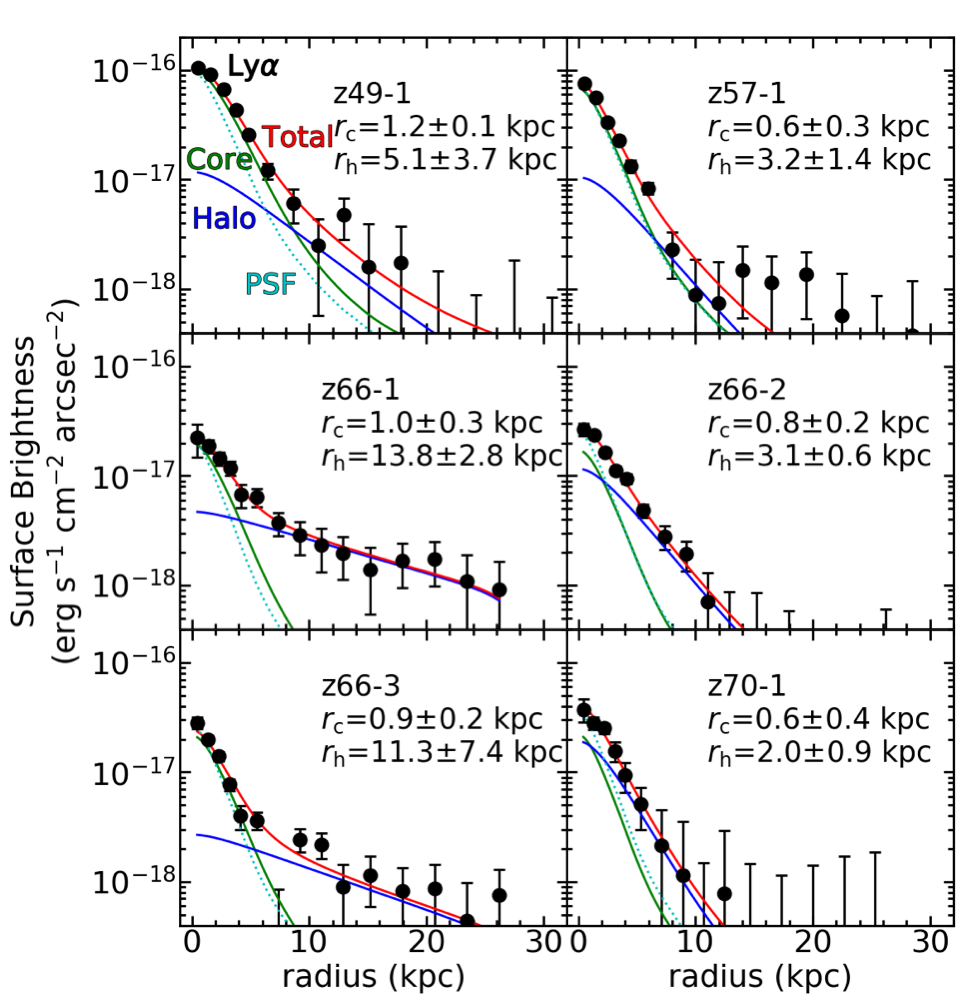
Figure 10 shows Ly surface brightness profiles of the 7 LABs. To measure the scale lengths of the 7 LABs, we perform a two-component (core and halo) fitting that is similar to the one adopted by Leclercq et al. (2017). Specifically, we decompose the surface brightness profiles into core and halo components, following:
| (4) |
where and are the scale lengths of core and halo components, respectively. The “” sign stands for convolution. The , , and are free parameters. The continuum profile is extracted from the offband images, while the Ly profile is measured in the Ly images. We first fit with two free parameters and to measure . Then we use this value to fit with three free parameters , , and to measure . The errors of and are considered in the fitting.
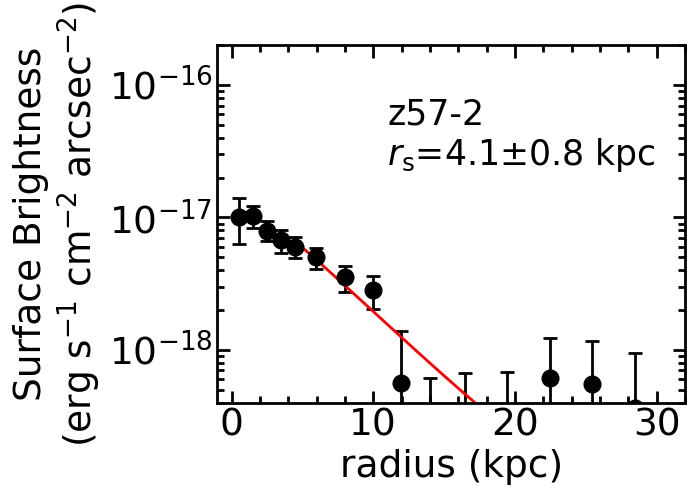
Figure 10 shows the best-fit Ly surface brightness profiles of our LABs. Because there is an offset between the positions of the Ly and continuum centers of z57-2, we cannot perform the two-component fitting that requires the Ly and continuum centers to be the same. Instead we use a one-component exponential function to fit the Ly profile of z57-2 in the halo region ( kpc), following
| (5) |
where the meanings of the , PSF, and “” sign are the same as Equation 4. The is a free parameter. The fitting result of z57-2 is shown in Figure 11.
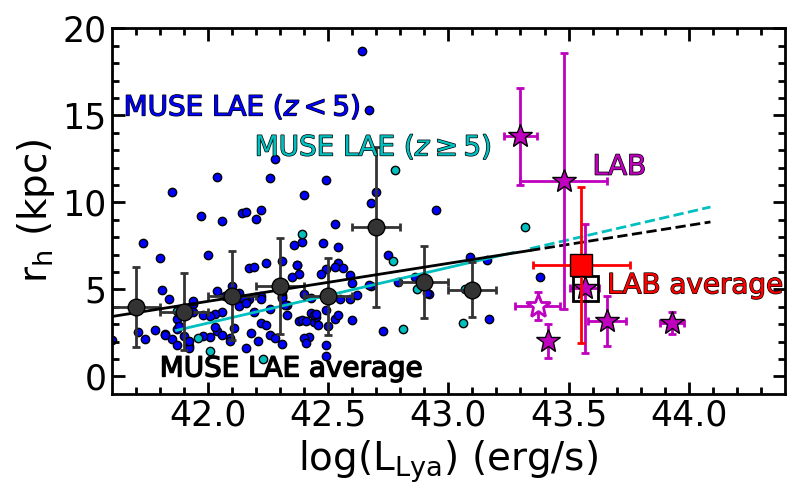
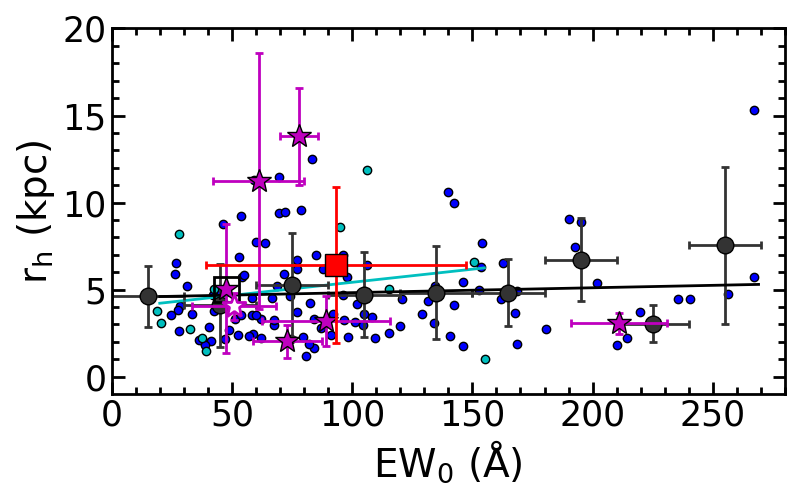
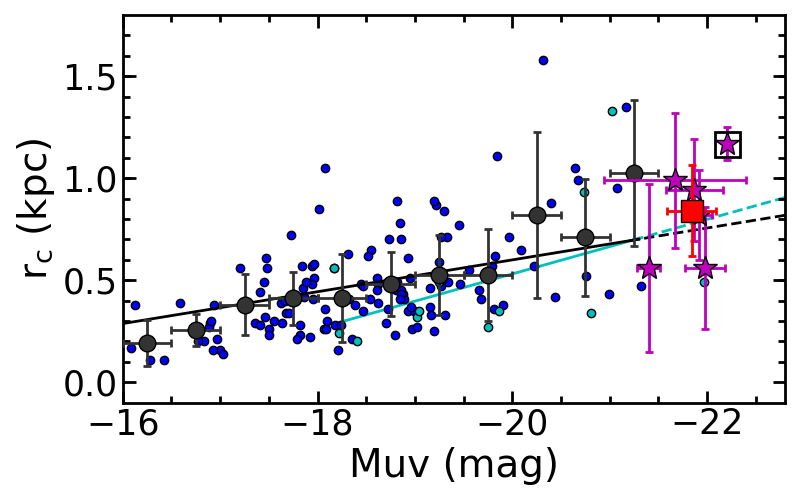
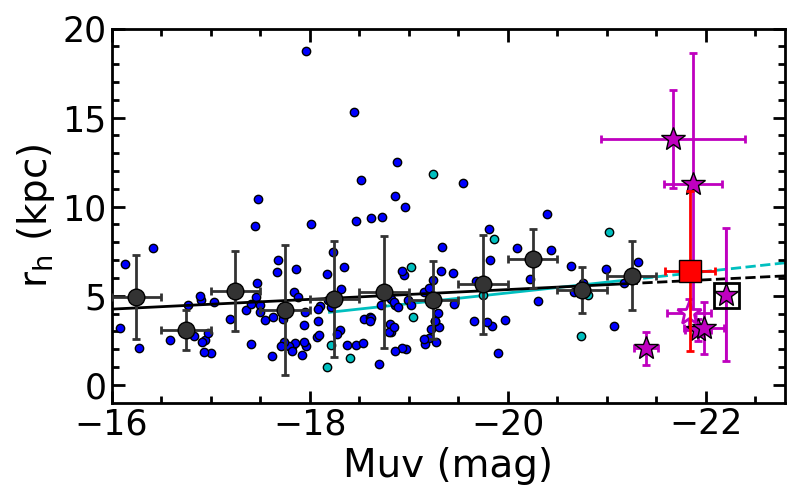
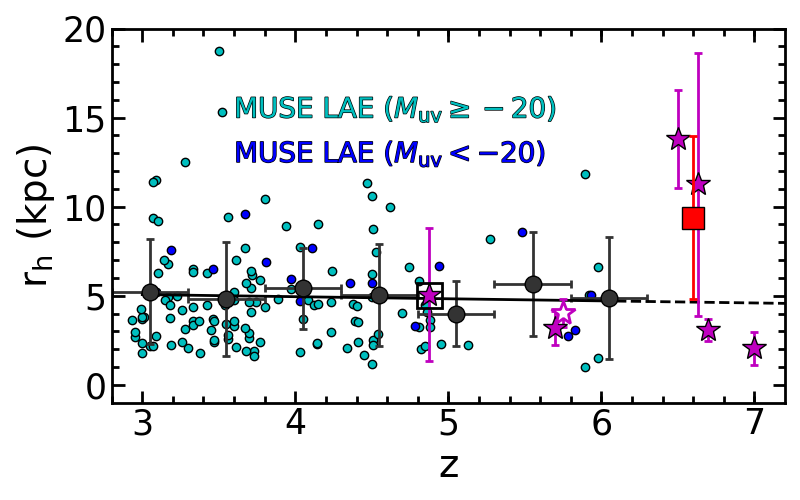
We compare the best-fit values as a function of Ly luminosities , Ly rest-frame equivalent widths EW0, continuum magnitudes , and redshifts of the 7 LABs with those of LAEs from Leclercq et al. (2017), as shown in Figures 12, 13, and 14. When calculating the LAB average value, we do not use the best-fit of z57-2 from the one-component exponential function fitting. In Figures 12 and 13, our LABs are consistent with the extrapolations of correlations between and galaxy properties including , EW0, and of the MUSE LAEs at . This suggests that our LABs and MUSE LAEs have similar connections between the diffuse Ly emission and properties of the host galaxies, and that typical LABs at are not special objects, but star-forming galaxies at the bright end. We also find that our LABs are consistent with the positive correlation between the as a function of of MUSE LAEs, which is expected from the size evolution discussed in Shibuya et al. (2015) and Shibuya et al. (2019).
Leclercq et al. (2017) find no significant evolution of the of MUSE LAEs at . Consistently, we notice that in Figure 14 the of our LABs does not evolve significantly between =4.9 and 7.0. Moreover, our LABs fall on the extrapolations of correlations between and galaxy properties of the MUSE LAEs at in Figures 12, 13, and 14.
4.2 Large Scale Structure around LABs
To investigate the large scale structure around our LABs, we calculate the LAE overdensity at , 5.7, 6.6, and 7.0 in the same manner as in Harikane et al. (2019). The is defined as
| (6) |
where and are the number and average number of LAEs in a cylinder, respectively. The radius of the cylinder is 10 comoving Mpc (cMpc). This radius is the typical size of protoclusters whose masses grow to at in Chiang et al. (2013). The length of the cylinder is cMpc, consistent with the redshift range of LAEs selected by narrowbands. Figure 15 shows the overdensity maps of LAEs at , 5.7, 6.6, and 7.0. The of each LAB is presented in Table LABEL:tab:1. Kikuta et al. (2019) show that most of their LABs reside in overdensed regions at . Consistently, we find that all the 7 LABs except z66-2 are located in overdensed regions.
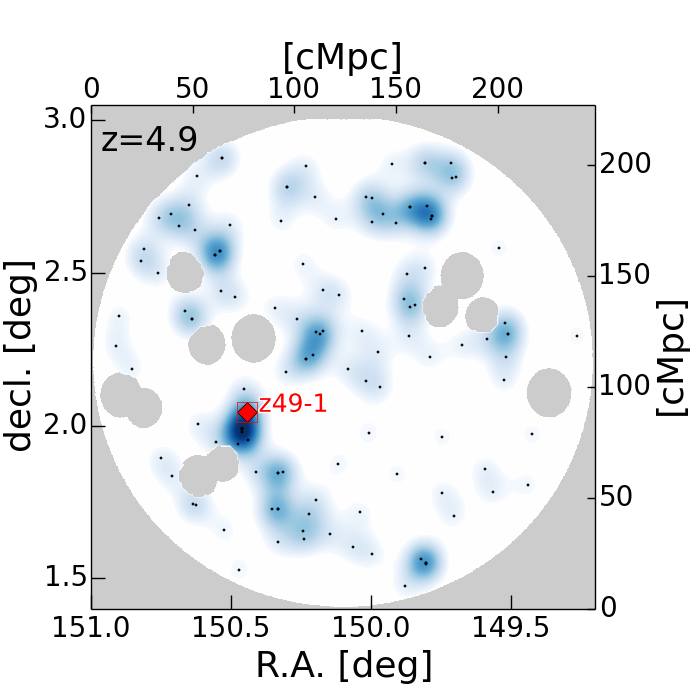
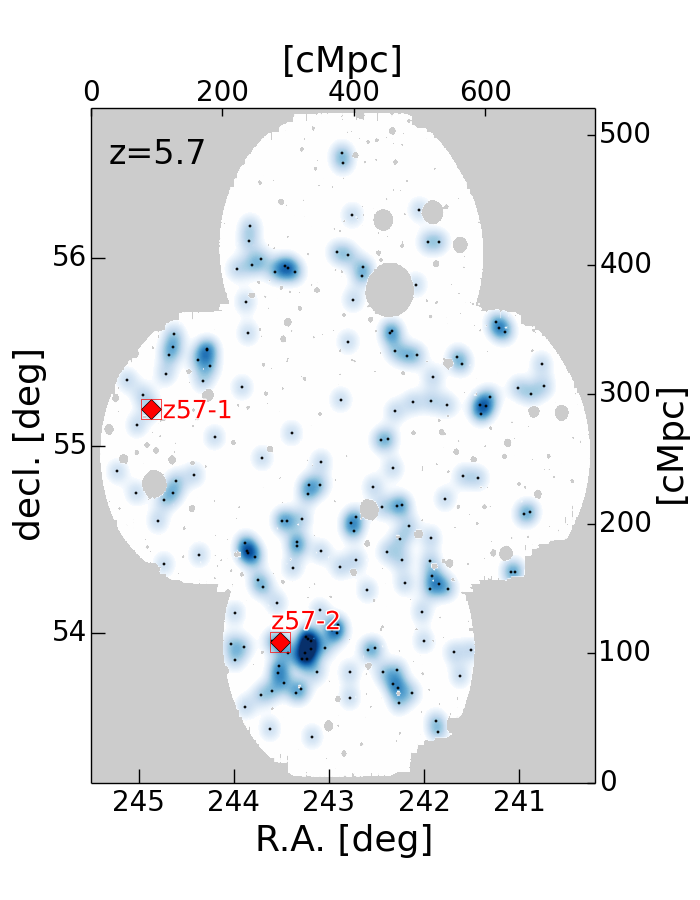
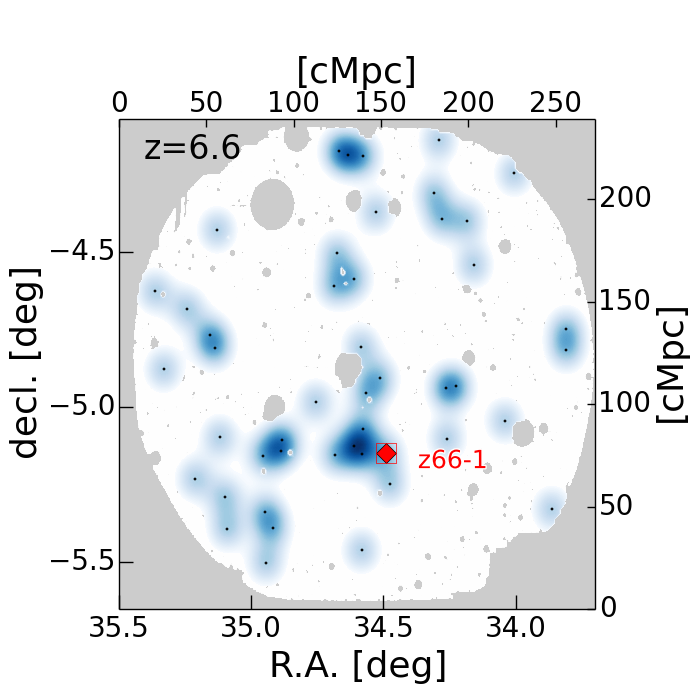
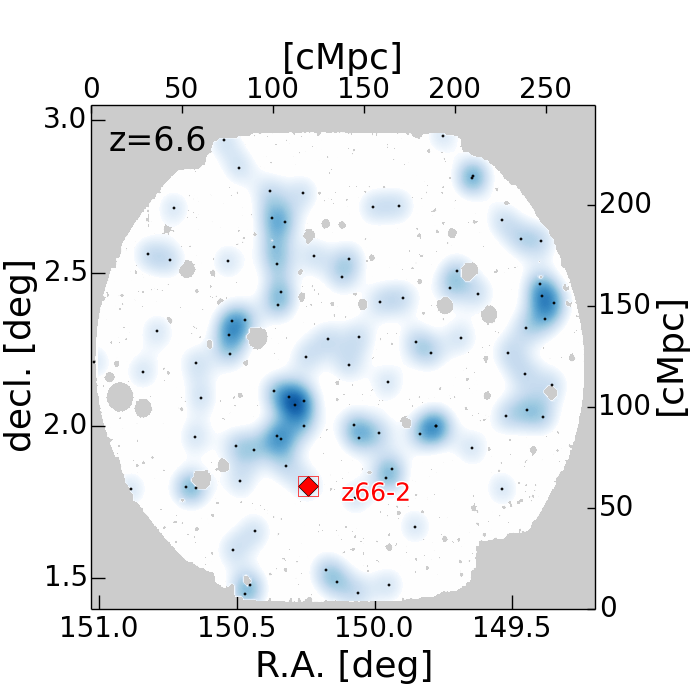
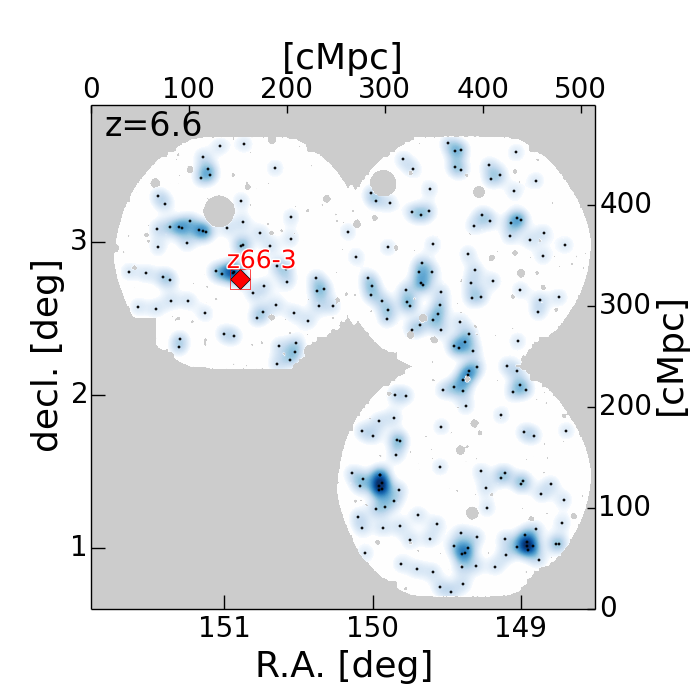
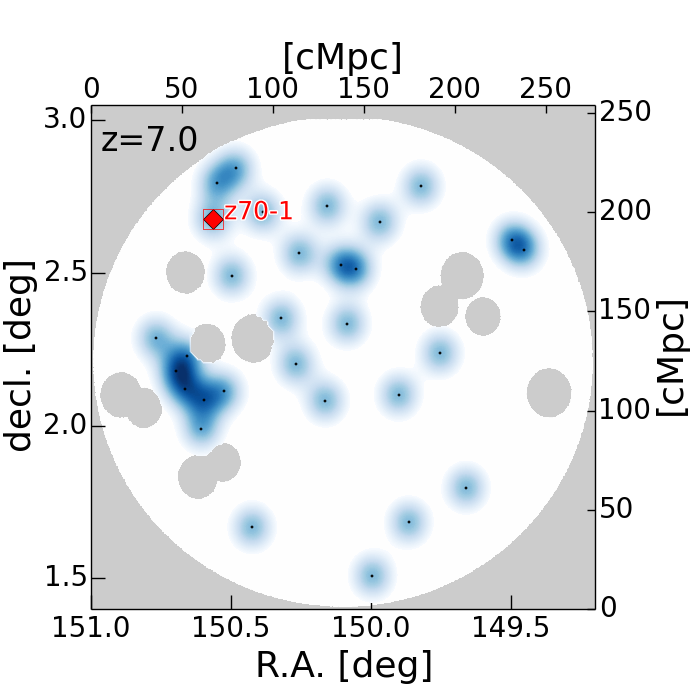
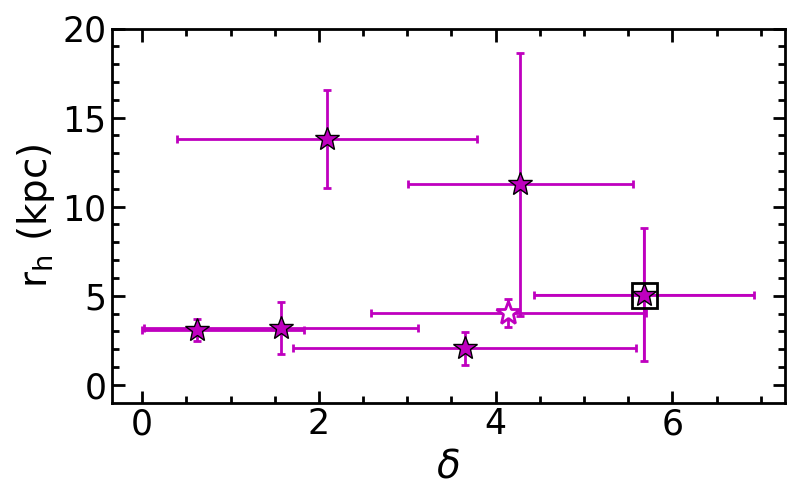
Figure 16 shows the as a function of of our LABs. To test the correlation between the and , we calculate the Spearman’s rank correlation coefficient to be 0.43 with a -value of 0.34. We do not consider the errors of and when calculating the and -value. Although Matsuda et al. (2012) find a positive correlation between the halo scale length and LAE overdensity of LAEs at , our correlation test suggests that there is no significant correlation between the and of our LABs at -7.0.
4.3 AGN Activity
Because the bright Ly luminosities ( erg s-1) of the 7 LABs make them possible hosts of AGNs, we investigate the AGN activities in LABs with X-ray and spectroscopic data. None of the 7 LABs have X-ray counterparts in images and catalogs of XMM/Newton and Chandra in the literature (Scoville et al., 2007; Hasinger et al., 2007; Civano et al., 2016; Marchesi et al., 2016). The spectra of the 7 LABs do not show Nv emission indicative of AGNs.
Shibuya et al. (2018) investigate 21 bright LAEs that are not broad-line AGNs at , and find that the LAEs have Ly line widths of km s-1. Consistently, z57-1, z66-1, z66-2, z66-3, and z70-1 also show Ly line widths of km s-1 in Figure 8, suggesting that z57-1, z66-1, z66-2, z66-3, and z70-1 are not broad-line AGNs. On the other hand, the Ly line widths of z49-1 and z57-2 are systematically larger than 400 km s-1. Because z49-1 has a very clear continuum center that z57-2 does not show in Figure 3, it is possible that a hidden AGN is the origin of the relatively large Ly line width of z49-1. The large Ly line width of z57-2 is not likely caused by an AGN, but by mergers or dense neutral hydrogen gas in the Hi region.
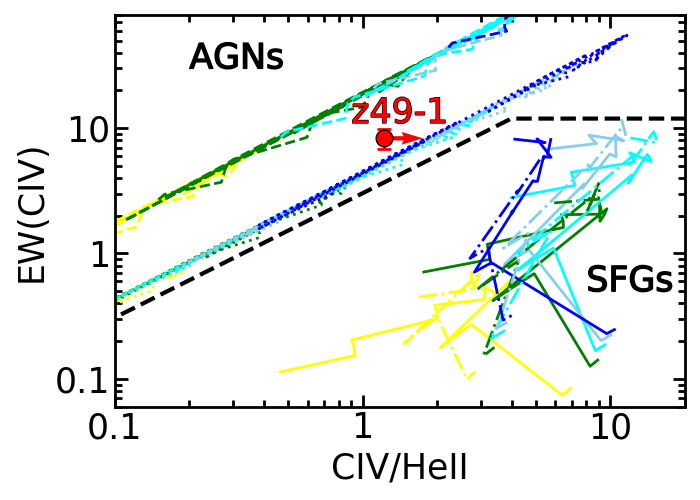
In Section 3, we show that z49-1 has a Civ emission line with a line width of km/s. The rest-frame equivalent width of the Civ emission is Å. The spectrum shows no Heii emission above the 2 detection limit. We use the 2 detection limit as an upper limit of the Heii flux, and find that the lower limit of the Civ to Heii ratio is . We compare the Civ reset-frame equivalent width and Civ to Heii ratio with the AGN and star-forming galaxy (SFG) models in Nakajima et al. (2018), and find that the z49-1 is consistent with both the AGN and low-metallicity SFG models (Figure 17). This result indicates that z49-1 is a candidate of a high- AGN, although the possibility of a low-metallicity SFG cannot be ruled out.
As we discussed in Section 1, AGNs have been identified in all of the LAEs with bright Ly luminosities (log ) at in Konno et al. (2016) and Sobral et al. (2018). Similary, Overzier et al. (2013) show that at least 63% of LABs at are associated with luminous AGNs. On the other hand, no AGN has been confirmed to exist in LABs at including our LABs. This may suggest that typical LABs at are less likely to be powered by luminous AGNs than LABs at .
4.4 Stellar Population
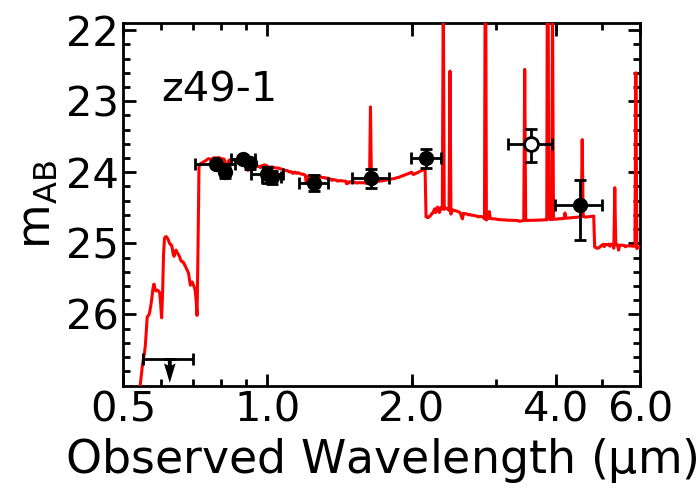
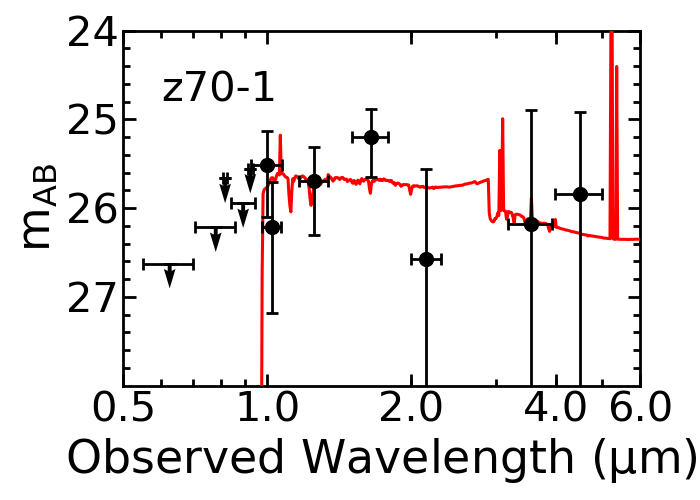
We perform SED fitting on z49-1 and z70-1 using total magnitudes measured in Subaru HSC (, , , , , NB816, and NB921), UltraVista (, , , and ), and Spitzer/IRAC (3.6 m and 4.5 m bands) images. In our SED fitting, we consider the contributions from both nebular and stellar populations. The nebular spectra (emission lines and continua) are calculated basically following Schaerer & de Barros (2009). We use the stellar population synthesis model GALAXEV (Bruzual & Charlot, 2003) with Salpeter’s initial mass function (Salpeter, 1955) to obtain stellar SEDs. A constant star formation history is assumed. Details of our SED fitting method are discribed in Ono et al. (2010). Because the 3.6m band is contaminated by H emission at , we do not use the photometry of the 3.6m band in our SED fitting of z49-1. The best-fit SEDs of z49-1 and z70-1 are shown in Figure 18. The properties of the best-fit SEDs are summarized in Table 3.
4.5 H Emission of z49-1
The 3.6 m image of z49-1 in Figure 4 shows a clear color excess that is caused by the redshifted H. Comparing with the best-fit SED obtained in Section 4.4, we measure the observed 3.6 m excess that corresponds to a H luminosity of erg s-1. Assuming the case-B recombination and no dust extinction suggested by the best-fit SED, we estimate the expected Ly luminosity to be erg s-1. The Ly escape fraction is the observed Ly luminosity divided by the expected Ly luminosity, /=0.110.04.
5 Discussion
5.1 Identification of the Most Distant LAB at
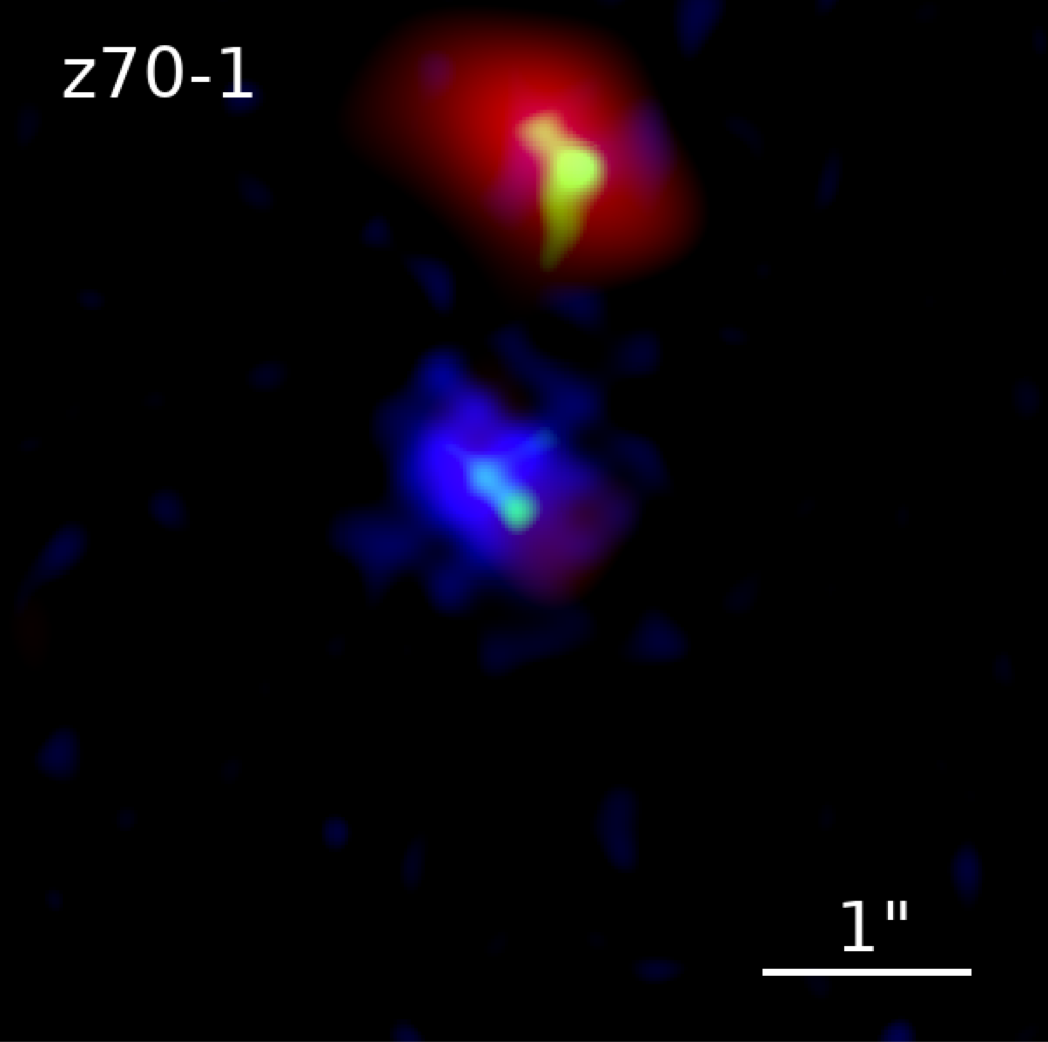
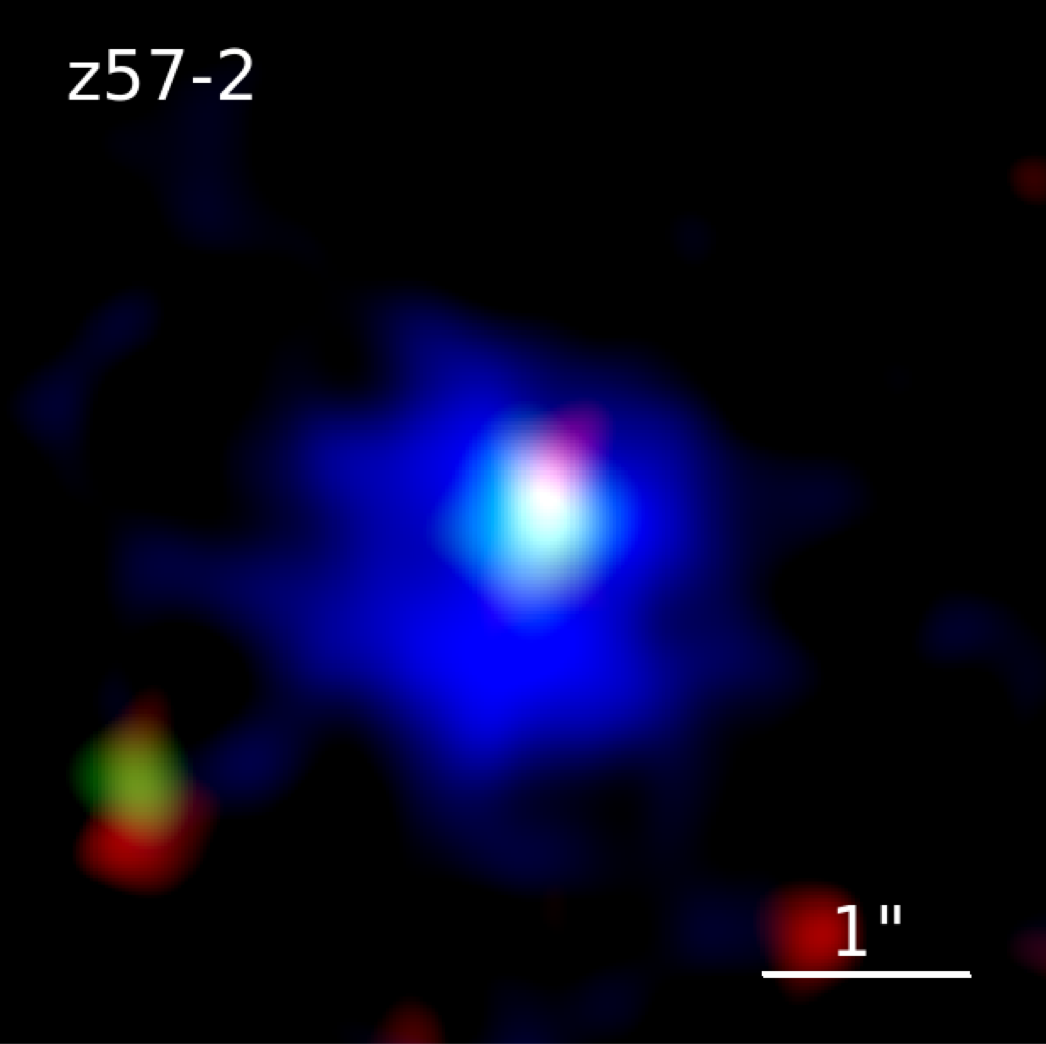
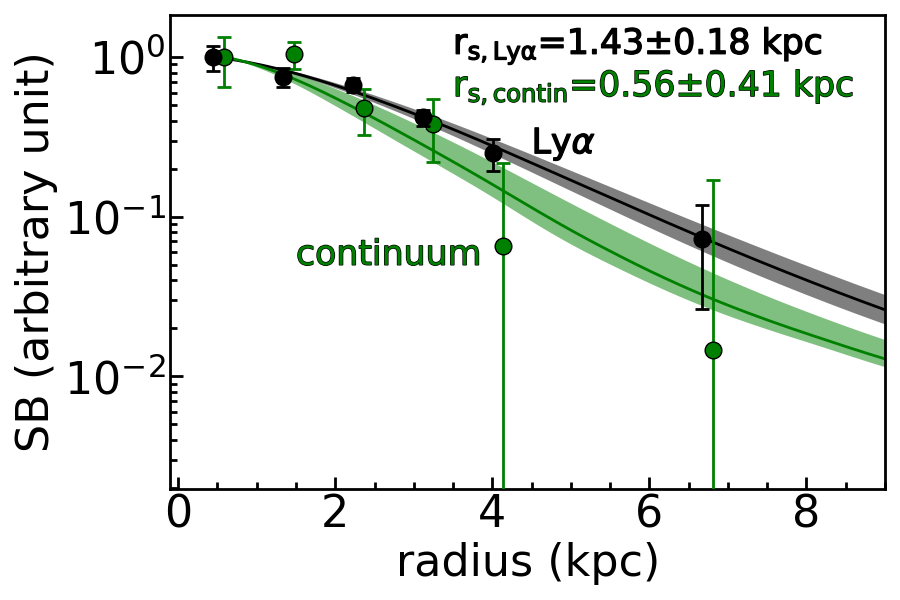
In this study, we have identified the most distant LAB found to date, z70-1 at . The composite pseudocolor image of z70-1 is presented in Figure 19 left. Figure 20 shows the Ly and continuum profiles of z70-1. To test whether the Ly profile of z70-1 is more extended than the continuum profile, we fit the exponential function shown in Equation 5 to the Ly and continuum profiles. In the fitting, the errors of the profiles are considered. The best-fit scale lengths of the Ly and continuum profiles are and kpc, respectively. We estimate the statistical significance of the difference between the scale lengths of Ly and continuum profiles assuming a normal distribution. We find that the Ly and continuum profiles are different at the 87% confidence level. This suggests that the Ly emission of z70-1 is more extended than the continuum. Taken together with the identification of the Ly emission line on the spectrum, and the bright Ly luminosity of z70-1, our result suggests that z70-1 is a real LAB at .
5.2 An Extremely Diffuse LAB at
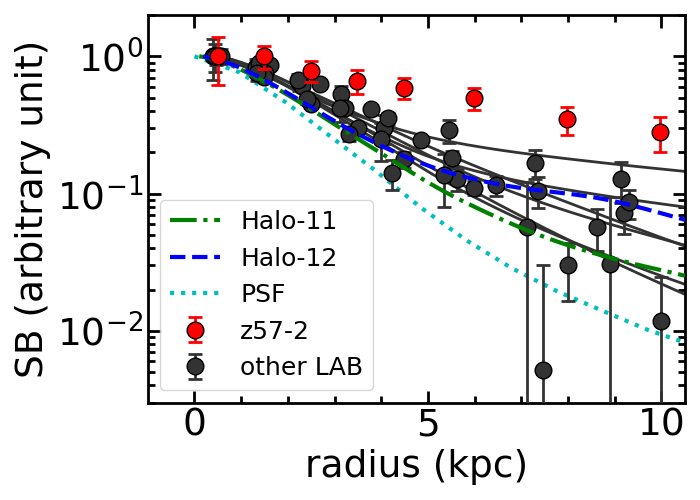
The NB816 image of z57-2 in Figure 3 suggests that z57-2 has very diffuse Ly emission presenting no clear center, which is apparently different from the other 6 LABs. The composite pseudocolor image of z57-2 is shown in Figure 19 right. Figure 21 displays the Ly surface brightness profile of z57-2, together with the other 6 LABs and 2 model galaxies of Halo-11 and Halo-12 (Yajima et al. 2017; Arata et al. 2018) at . Cosmological hydrodynamic and radiative transfer simulations produce Halo-11 and Halo-12 that have halo masses of and , respectively. As suggested by Behroozi et al. (2013), the halo masses of Halo-11 and Halo-12 correspond to stellar masses of and at , respectively, which are consistent with the stellar masses of our LABs estimated by the SED fitting (Section 4.4). In Figure 21, it is clear that z57-2 has a more diffuse Ly profile than the other 6 LABs. Moreover, model galaxies of Halo-11 and Halo-12 cannot explain the extremely diffuse Ly profile of z57-2.
The spectrum in Figure 6 shows that z57-2 has a Ly emission line with a FWHM of km/s that is broader than those of the other 6 LABs. It should be also noted that the Ly line of z57-2 shows multiple peaks. These features may be caused by dynamical systems, such as multiple components or mergers. Another possibility is that z57-2 has a nearly static cloud of thick Hi gas that resonantly scatters Ly photons produced at the center of this system. The static cloud should have varying Hi column densities that cause the positional dependence of the Ly line center and line width found in Figure 8.
5.3 Physical Origin of the diffuse Ly emission of LABs
Previous studies have suggested several physical origins of the diffuse Ly emission around a galaxy, including scenarios of photoionization, Ly resonant scattering, cooling radiation, outflows, and satellite galaxies. We discuss these scenarios separately below.
Mas-Ribas & Dijkstra (2016) suggest that fluorescence can generate Ly photons that account for diffuse Ly emission around LAEs at . As for LABs, fluorescence is very likely to happen because of the large abundance of ionizing photons expected from the bright . Geach et al. (2009) and Overzier et al. (2013) argue that fluorescence alone can explain the luminous and diffuse Ly emission of LABs hosting AGNs. Because our LABs have bright and possible AGN activities, fluorescence may be the origin of the diffuse Ly emission.
In the scenario of Ly resonant scattering, the Ly photons are emitted by star formation in the galaxy center. Although our LABs have very high Ly luminosities, the Ly equivalent widths are , consistent with the Ly equivalent width from dust-free star formation estimated in Charlot & Fall (1993). This consistency suggests that the diffuse Ly emission can be explained by resonantly scattered Ly photons generated in the star-forming galaxy center.
Gravitational cooling radiation may also play an important role in generating an extended Ly emission. Using Ly radiative transfer models of LAEs with a mean stellar mass of at , Lake et al. (2015) show that cooling radiation can contribute 40-55% of the total Ly luminosity within a virial radius of 56 kpc. On the other hand, if cooling radiation is the major origin of the diffuse Ly emission, the Ly equivalent width would likely be greater than 240 that is the maximum equivalent width predicted by stellar models (Charlot & Fall, 1993). Although the Ly equivalent widths of our LABs are smaller than 240 , it should be noted that the Ly escape fractions of our LABs might be low. For example, z49-1 has a Ly escape fraction of 0.11 as we discussed in Section 4.4. Because the low Ly equivalent widths of our LABs may be caused by low Ly escape fractions, we cannot rule out the possibility that cooling radiation is the origin of the diffuse Ly emission.
Using an analytical model and a high-resolution hydrodynamic simulation, respectively, Taniguchi & Shioya (2000) and Mori et al. (2004) suggest that outflows driven by multiple supernova explosions are able to produce extended Ly emission with a Ly luminosity of erg s-1. This Ly luminosity is consistent with those of our LABs. On the other hand, our LABs may have starbursts driven by possible mergers as suggested by the multiple UV components in Figure 3. Multiple supernova explosions are likely to happen in starbursts, and drive outflows that produce the luminous and diffuse Ly emission of our LABs.
In Figure 3, the HST images of z49-1, z66-1, and z66-2 clearly show multiple UV continuum components. It is likely that having multiple UV continuum components is a common feature of high- LABs. The multiple components may correspond to multiple star forming clumps in one galaxy, mergers, or satellite galaxies. It is possible that satellite galaxies are responsible for the large continuum size of LABs. On the other hand, if the satellite galaxies are the major contributors to the diffuse Ly emission, one would expect that the Ly and continuum profiles have the similar shape even if the satellite galaxies are not resolved. In Figure 10, it should be noted that the core component has the same shape as the continuum profile, and that the Ly profile cannot be explained by the single core component. However, the difference between the Ly and continuum profiles can be caused by satellite galaxies with high Ly equivalent widths, such as the faint LAEs at found in Maseda et al. (2018). It is possible that satellite galaxies with high Ly equivalent widths are the origin of the diffuse Ly emission around LABs.
In conclusion, all of the 5 scenarios of fluorescence, resonant scattering, gravitational cooling radiation, outflows, and satellite galaxies may contribute to the diffuse Ly emission around LABs.
6 Summary
In this study, we investigate the photometric and spectroscopic properties of seven LABs; two LABs at (z49-1) and (z70-1) identified by us, and five previously-known LABs at (z57-1, z57-2, z66-1, z66-2, and z66-3). Our results are summarized below.
-
1.
We find that z70-1 has extended Ly emission with a scale length of kpc that is about three times larger than the UV continuum. The object of z70-1 is the most distant LAB identified to date.
-
2.
We show that z57-2 has Ly emission that is much more diffuse than the other 6 LABs. The origin of the extremely diffuse Ly emission of z57-2 is unclear, and cannot be explained by cosmological hydrodynamic and radiative transfer simulations.
-
3.
We measure the core and halo scale lengths of the Ly profiles of our LABs, and show that our LABs are consistent with the extrapolation of the relations between scale lengths and galaxy properties (, EW0, and MUV) of MUSE LAEs from Leclercq et al. (2017). This suggests that our LABs and MUSE LAEs have similar connections between the diffuse Ly emission and properties of the host galaxies, and that typical LABs at are not special objects, but star-forming galaxies at the bright end.
-
4.
We investigate the large scale structure around our LABs by measuring the LAE overdensity. We find that all the 7 LABs except z66-2 are located in overdensed regions. Our LABs show no significant correlation between the halo scale length and LAE overdensity.
-
5.
The 7 LABs except z49-1 exhibit no AGN signatures such as X-ray emission, Nv1240, or Ly line broadening. The object of z49-1 has a strong Civ1548 emission line that suggests an AGN. We compare the Civ equivalent width and Civ/Heii ratio of z49-1 with the AGN and SFG models in Nakajima et al. (2018), and find that z49-1 is an AGN candidate although the possibility of a young and low-metallicity SFG cannot be eliminated.
-
6.
We find that all the Ly emission lines of the 7 LABs show velocity gradients on the spectra. The Ly velocity gradients and line widths of z49-1 and z57-2 are larger than those of the other 5 LABs, which may be caused by an AGN (not likely for z57-2), mergers, or dense neutral hydrogen gas in the Hi region.
-
7.
We discuss the physical origin of the diffuse Ly emission around our LABs. Fluorescence, resonant scattering, gravitational cooling radiation, outflows, and satellite galaxies can contribute to the diffuse Ly emission.
The Hyper Suprime-Cam (HSC) collaboration includes the astronomical communities of Japan and Taiwan, and Princeton University. The HSC instrumentation and software were developed by the National Astronomical Observatory of Japan (NAOJ), the Kavli Institute for the Physics and Mathematics of the Universe (Kavli IPMU), the University of Tokyo, the High Energy Accelerator Research Organization (KEK), the Academia Sinica Institute for Astronomy and Astrophysics in Taiwan (ASIAA), and Princeton University. Funding was contributed by the FIRST program from Japanese Cabinet Office, the Ministry of Education, Culture, Sports, Science and Technology (MEXT), the Japan Society for the Promotion of Science (JSPS), Japan Science and Technology Agency (JST), the Toray Science Foundation, NAOJ, Kavli IPMU, KEK, ASIAA, and Princeton University.
This paper makes use of software developed for the Large Synoptic Survey Telescope. We thank the LSST Project for making their code available as free software at http://dm.lsst.org
The Pan-STARRS1 Surveys (PS1) have been made possible through contributions of the Institute for Astronomy, the University of Hawaii, the Pan-STARRS Project Office, the Max-Planck Society and its participating institutes, the Max Planck Institute for Astronomy, Heidelberg and the Max Planck Institute for Extraterrestrial Physics, Garching, The Johns Hopkins University, Durham University, the University of Edinburgh, Queen’s University Belfast, the Harvard-Smithsonian Center for Astrophysics, the Las Cumbres Observatory Global Telescope Network Incorporated, the National Central University of Taiwan, the Space Telescope Science Institute, the National Aeronautics and Space Administration under Grant No. NNX08AR22G issued through the Planetary Science Division of the NASA Science Mission Directorate, the National Science Foundation under Grant No. AST-1238877, the University of Maryland, and Eotvos Lorand University (ELTE) and the Los Alamos National Laboratory.
Based in part on data collected at the Subaru Telescope and retrieved from the HSC data archive system, which is operated by Subaru Telescope and Astronomy Data Center at National Astronomical Observatory of Japan.
The NB718 and NB816 filters were supported by Ehime University (PI: Y. Taniguchi). The NB921 and NB973 filters were supported by KAKENHI (23244025) Grant-in-Aid for Scientific Research (A) through the Japan Society for the Promotion of Science (PI: M. Ouchi).
Some of the data presented herein were obtained at the W. M. Keck Observatory, which is operated as a scientific partnership among the California Institute of Technology, the University of California and the National Aeronautics and Space Administration. The Observatory was made possible by the generous financial support of the W. M. Keck Foundation.
The authors wish to recognize and acknowledge the very significant cultural role and reverence that the summit of Maunakea has always had within the indigenous Hawaiian community. We are most fortunate to have the opportunity to conduct observations from this mountain.
This paper includes data gathered with the 6.5 meter Magellan Telescopes located at Las Campanas Observatory, Chile.
This work is supported by World Premier International Research Center Initiative (WPI Initiative), MEXT, Japan, and KAKENHI (15H02064, 17H01110, and 17H01114) Grant-in-Aid for Scientific Research (A) through Japan Society for the Promotion of Science.
References
- Aihara et al. (2018) Aihara, H., Arimoto, N., Armstrong, R., et al. 2018, PASJ, 70, S4
- Aniano et al. (2011) Aniano, G., Draine, B. T., Gordon, K. D., & Sandstrom, K. 2011, PASP, 123, 1218
- Arata et al. (2018) Arata, S., Yajima, H., Nagamine, K., Li, Y., & Khochfar, S. 2018, arXiv:1810.07621
- Axelrod et al. (2010) Axelrod, T., Kantor, J., Lupton, R. H., & Pierfederici, F. 2010, Proc. SPIE, 7740, 774015
- Basu-Zych & Scharf (2004) Basu-Zych, A., & Scharf, C. 2004, ApJ, 615, L85
- Behroozi et al. (2013) Behroozi, P. S., Wechsler, R. H., & Conroy, C. 2013, ApJ, 770, 57
- Bosch et al. (2018) Bosch, J., Armstrong, R., Bickerton, S., et al. 2018, PASJ, 70, S5
- Bruzual & Charlot (2003) Bruzual, G., & Charlot, S. 2003, MNRAS, 344, 1000
- Charlot & Fall (1993) Charlot, S., & Fall, S. M. 1993, ApJ, 415, 580
- Chiang et al. (2013) Chiang, Y.-K., Overzier, R., & Gebhardt, K. 2013, ApJ, 779, 127
- Civano et al. (2016) Civano, F., Marchesi, S., Comastri, A., et al. 2016, ApJ, 819, 62
- Coupon et al. (2018) Coupon, J., Czakon, N., Bosch, J., et al. 2018, PASJ, 70, S7
- Dekel et al. (2009) Dekel, A., Sari, R., & Ceverino, D. 2009, ApJ, 703, 785
- Faber et al. (2003) Faber, S. M., Phillips, A. C., Kibrick, R. I., et al. 2003, Proc. SPIE, 4841, 1657
- Feldmeier et al. (2013) Feldmeier, J. J., Hagen, A., Ciardullo, R., et al. 2013, ApJ, 776, 75
- Francis et al. (2001) Francis, P. J., Williger, G. M., Collins, N. R., et al. 2001, ApJ, 554, 1001
- Furusawa et al. (2018) Furusawa, H., Koike, M., Takata, T., et al. 2018, PASJ, 70, S3
- Geach et al. (2007) Geach, J. E., Smail, I., Chapman, S. C., et al. 2007, ApJ, 655, L9
- Geach et al. (2009) Geach, J. E., Alexander, D. M., Lehmer, B. D., et al. 2009, ApJ, 700, 1
- Harikane et al. (2019) Harikane, Y., Ouchi, M., Ono, Y., et al. 2019, arXiv:1902.09555
- Hasinger et al. (2007) Hasinger, G., Cappelluti, N., Brunner, H., et al. 2007, ApJS, 172, 29
- Hayashino et al. (2004) Hayashino, T., Matsuda, Y., Tamura, H., et al. 2004, AJ, 128, 2073
- Itoh et al. (2018) Itoh, R., Ouchi, M., Zhang, H., et al. 2018, ApJ, 867, 46
- Ivezić et al. (2008) Ivezić, Ž., Kahn, S. M., Tyson, J. A., et al. 2008, arXiv:0805.2366
- Jurić et al. (2015) Jurić, M., Kantor, J., Lim, K.-T., et al. 2015, arXiv:1512.07914
- Kawanomoto et al. (2018) Kawanomoto, S., Uraguchi, F., Komiyama, Y., et al. 2018, PASJ, 70, 66
- Keel et al. (1999) Keel, W. C., Cohen, S. H., Windhorst, R. A., & Waddington, I. 1999, AJ, 118, 2547
- Kikuta et al. (2019) Kikuta, S., Matsuda, Y., Cen, R., et al. 2019, arXiv:1904.07747
- Komiyama et al. (2018) Komiyama, Y., Obuchi, Y., Nakaya, H., et al. 2018, PASJ, 70, S2
- Konno et al. (2016) Konno, A., Ouchi, M., Nakajima, K., et al. 2016, ApJ, 823, 20
- Lake et al. (2015) Lake, E., Zheng, Z., Cen, R., et al. 2015, ApJ, 806, 46
- Leclercq et al. (2017) Leclercq, F., Bacon, R., Wisotzki, L., et al. 2017, A&A, 608, A8
- Magnier et al. (2013) Magnier, E. A., Schlafly, E., Finkbeiner, D., et al. 2013, The Astrophysical Journal Supplement Series, 205, 20
- Marchesi et al. (2016) Marchesi, S., Civano, F., Elvis, M., et al. 2016, ApJ, 817, 34
- Maseda et al. (2018) Maseda, M. V., Bacon, R., Franx, M., et al. 2018, ApJ, 865, L1
- Mas-Ribas & Dijkstra (2016) Mas-Ribas, L., & Dijkstra, M. 2016, ApJ, 822, 84
- Mas-Ribas et al. (2017) Mas-Ribas, L., Dijkstra, M., Hennawi, J. F., et al. 2017, ApJ, 841, 19
- Matsuda et al. (2004) Matsuda, Y., Yamada, T., Hayashino, T., et al. 2004, AJ, 128, 569
- Matsuda et al. (2007) Matsuda, Y., Iono, D., Ohta, K., et al. 2007, ApJ, 667, 667
- Matsuda et al. (2012) Matsuda, Y., Yamada, T., Hayashino, T., et al. 2012, MNRAS, 425, 878
- Miyazaki et al. (2018) Miyazaki, S., Komiyama, Y., Kawanomoto, S., et al. 2018, PASJ, 70, S1
- Momose et al. (2014) Momose, R., Ouchi, M., Nakajima, K., et al. 2014, MNRAS, 442, 110
- Momose et al. (2016) Momose, R., Ouchi, M., Nakajima, K., et al. 2016, MNRAS, 457, 2318
- Mori et al. (2004) Mori, M., Umemura, M., & Ferrara, A. 2004, ApJ, 613, L97
- Nakajima et al. (2018) Nakajima, K., Schaerer, D., Le Fèvre, O., et al. 2018, A&A, 612, A94
- Oke & Gunn (1983) Oke, J. B., & Gunn, J. E. 1983, ApJ, 266, 713
- Ono et al. (2010) Ono, Y., Ouchi, M., Shimasaku, K., et al. 2010, ApJ, 724, 1524
- Ouchi et al. (2003) Ouchi, M., Shimasaku, K., Furusawa, H., et al. 2003, ApJ, 582, 60
- Ouchi et al. (2008) Ouchi, M., Shimasaku, K., Akiyama, M., et al. 2008, ApJS, 176, 301
- Ouchi et al. (2009) Ouchi, M., Ono, Y., Egami, E., et al. 2009, ApJ, 696, 1164
- Ouchi et al. (2013) Ouchi, M., Ellis, R., Ono, Y., et al. 2013, ApJ, 778, 102
- Overzier et al. (2013) Overzier, R. A., Nesvadba, N. P. H., Dijkstra, M., et al. 2013, ApJ, 771, 89
- Rauch et al. (2008) Rauch, M., Haehnelt, M., Bunker, A., et al. 2008, ApJ, 681, 856
- Salpeter (1955) Salpeter, E. E. 1955, ApJ, 121, 161
- Schaerer & de Barros (2009) Schaerer, D., & de Barros, S. 2009, A&A, 502, 423
- Schlafly et al. (2012) Schlafly, E. F., Finkbeiner, D. P., Jurić, M., et al. 2012, ApJ, 756, 158
- Scoville et al. (2007) Scoville, N., Aussel, H., Brusa, M., et al. 2007, ApJS, 172, 1
- Shibuya et al. (2015) Shibuya, T., Ouchi, M., & Harikane, Y. 2015, ApJS, 219, 15
- Shibuya et al. (2018) Shibuya, T., Ouchi, M., Konno, A., et al. 2018, PASJ, 70, S14
- Shibuya et al. (2018) Shibuya, T., Ouchi, M., Harikane, Y., et al. 2018, PASJ, 70, S15
- Shibuya et al. (2019) Shibuya, T., Ouchi, M., Harikane, Y., & Nakajima, K. 2019, ApJ, 871, 164
- Sobral et al. (2015) Sobral, D., Matthee, J., Darvish, B., et al. 2015, ApJ, 808, 139
- Sobral et al. (2018) Sobral, D., Matthee, J., Darvish, B., et al. 2018, MNRAS, 477, 2817
- Steidel et al. (2000) Steidel, C. C., Adelberger, K. L., Shapley, A. E., et al. 2000, ApJ, 532, 170
- Steidel et al. (2011) Steidel, C. C., Bogosavljević, M., Shapley, A. E., et al. 2011, ApJ, 736, 160
- Taniguchi & Shioya (2000) Taniguchi, Y., & Shioya, Y. 2000, ApJ, 532, L13
- Tonry et al. (2012) Tonry, J. L., Stubbs, C. W., Lykke, K. R., et al. 2012, ApJ, 750, 99
- Wisotzki et al. (2016) Wisotzki, L., Bacon, R., Blaizot, J., et al. 2016, A&A, 587, A98
- Wisotzki et al. (2018) Wisotzki, L., Bacon, R., Brinchmann, J., et al. 2018, Nature, 562, 229
- Yajima et al. (2017) Yajima, H., Nagamine, K., Zhu, Q., Khochfar, S., & Dalla Vecchia, C. 2017, ApJ, 846, 30