Improving Head Pose Estimation with a Combined Loss
and Bounding Box Margin Adjustment
Abstract
We address a problem of estimating pose of a person’s head from its RGB image. The employment of CNNs for the problem has contributed to significant improvement in accuracy in recent works. However, we show that the following two methods, despite their simplicity, can attain further improvement: (i) proper adjustment of the margin of bounding box of a detected face, and (ii) choice of loss functions. We show that the integration of these two methods achieve the new state-of-the-art on standard benchmark datasets for in-the-wild head pose estimation. The Tensorflow implementation of our work is available at https://github.com/MingzhenShao/HeadPose
I INTRODUCTION
This paper considers a head pose estimation problem, which is to infer orientation of a person’s head relative to the camera view from its single RGB image. Although early works can provide only a rough estimate of the head pose [4, 14, 18, 19, 7, 21], recent methods that use an RGB-D image [21, 5, 20, 8] or an RGB image [23, 9, 16, 15, 11] can estimate head pose with degree-level accuracy. The former methods are generally superior to the latter in terms of accuracy. However, RGB-D cameras are more costly than RGB cameras and usually require active sensing, which can be inaccurate in outdoor scenes, hence limiting their applicability. Therefore, methods that only use an RGB image have the potential for wider and more diverse applications.
There are two types of approaches to the problem of head pose estimation from an RGB image. One is to first detect multiple landmarks (key-points) of a face from the input image, then establish correspondences between them and the landmarks of a 3D generic head model, and finally estimate the relative pose of the face using the perspective-n-point (PnP) algorithm based on the established correspondence [23, 9]. This approach is constrained by the (in)accuracy of the landmark detection, and the difference between input faces and generic head models. The other approach is to use CNNs to directly predict the relative head pose from an input image, which is more attractive as there is no such explicit constraint on estimation accuracy.
Several studies have been conducted on this approach so far, which have gained considerable amount of improvement in accuracy [16, 15, 11]. However, we point out that there is still room for improvement in the current state-of-the-art. To be specific, there are two ingredients that bring about improvements. One is using margins around a bounding box of a detected face, and the other is choice of loss functions.
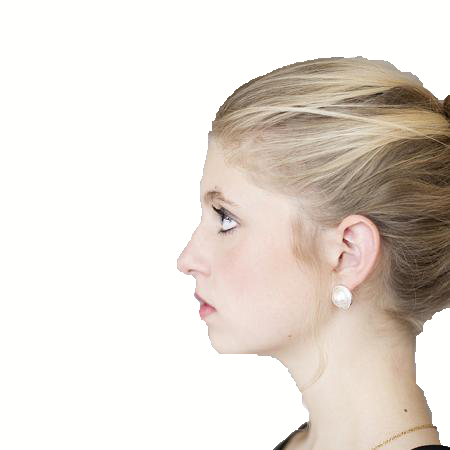
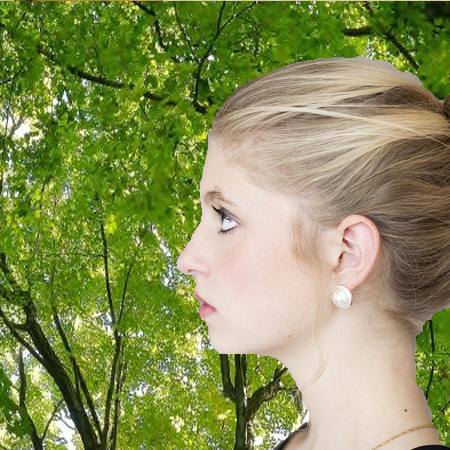
We have discovered in our experiments that bounding box margin has a large impact on the final accuracy of head pose estimation. In other words, head pose estimation is vulnerable to changes in the background scene around the target face, as shown in Fig.1, although this may not be so surprising; the methods are appearance-based after all. However, we show that proper adjustment of the bounding box margin mitigates this vulnerability. Furthermore, we have explored the space of loss functions for face pose estimation, having found a better choice that contributes to further improvement. The reason why these ingredients are overlooked in previous studies may be because the head pose estimation task was treated as an auxiliary task (or by-product) of other main tasks, such as face alignment, face recognition and detection; this may make it hard to think about bounding box margins and different loss functions.
The contributions of this paper are summarized as follows.
-
•
It is empirically analyzed how the size of the bounding box margin affects the final pose estimation.
-
•
A new combined loss is proposed, and we confirmed in the experiments that our proposed loss is superior to the normal MSE loss which is widely employed in previous studies.
-
•
The combination of the above two has achieved the state-of-the-art performance on the public benchmark dataset AFLW2000 and BIWI.
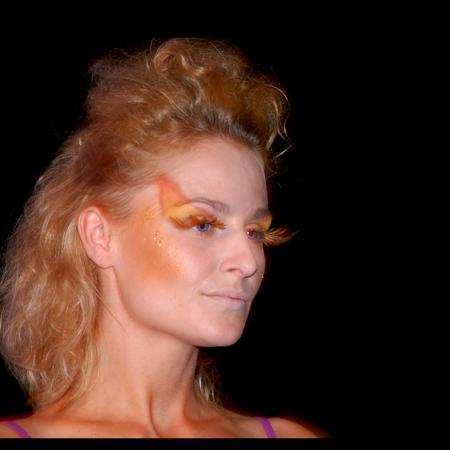
Roll:18.71
Pitch:-11.02
Yaw:-48.37
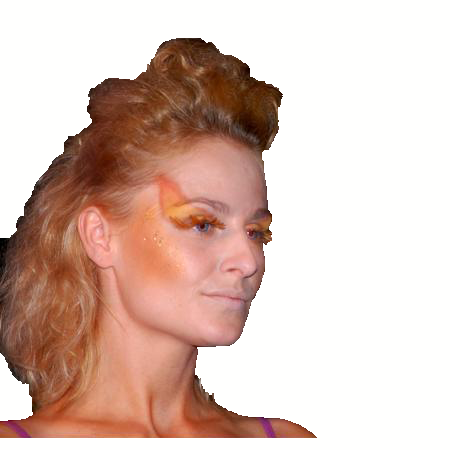
Roll:22.80
Pitch:-7.75
Yaw:-48.73
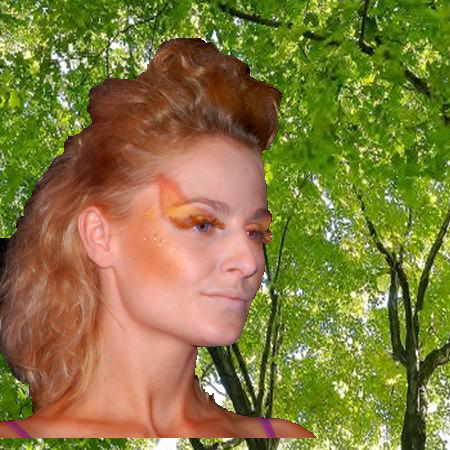
Roll:23.83
Pitch:-9.03
Yaw:-50.73
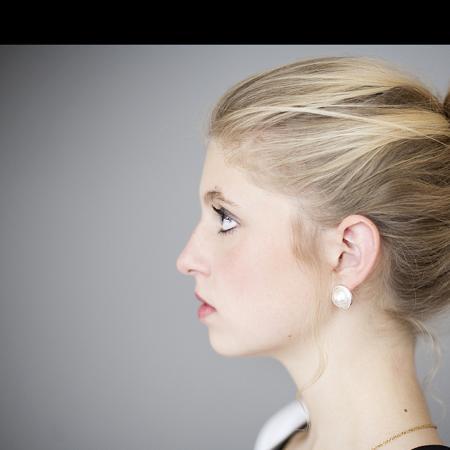
Roll:3.56
Pitch:2.57
Yaw:70.43
Roll:10.07
Pitch:6.13
Yaw:78.26
Roll:6.48
Pitch:2.34
Yaw:73.17

II PROPOSED METHOD
Our proposal consists of two methods as stated above, i.e., adjustment of the margin of a bounding box of a face that is inputted to our CNN and a new loss for training it along with a novel output layer. We first explain the latter and then the former in what follows.

II-A Losses and Network Design
Our CNN receives a three-channel (RGB) image of a person’s head as an input, and outputs the pitch, roll, and yaw angles of the head; see Fig. 3. Employing a ResNet50 [6] pretrained on the ImageNet dataset for the backbone of our CNN, we place three blocks of layers on top of its last average pooling layer. Each block outputs a prediction of one of the roll, yaw, and pitch angles.
In previous studies, the problem of head pose estimation is usually posed as regression, in which each rotation angle is predicted. The sum of squared difference between the true and predicted rotation angles is used for a regression loss to be minimized in training. In this study, we propose to use a classification loss in addition to the regression loss. To be specific, we split a set of degrees of angles which take value in the interval [-90°:90°] into 181 classes uniformly; each class corresponds to one-degree range. Then, our CNN predicts an angle with its discrete class and a continuous number for each of roll, yaw, and pitch angles, as shown in Fig. 3. Each of the three head blocks receives the same output (2048 floating point numbers) from the average pooling layer of the ResNet50, and outputs a predicted angle in a continuous number as well as the scores of the 181 angle classes. For the former, we use a fully-connected layer that maps the output obtained from the backbone ResNet50 to a single continuous number. For the latter, we use a fully-connected layer that maps the same backbone output followed by a softmax function to obtain 181 class scores.
To train the CNN, we use a combined loss function for each angle in the following way. The regression loss is the mean squared error computed over the training samples () by
| (1) |
where is the true angle and is the predicted angle for the -th sample. For the classification loss , we employ the temperature scaling to make class scores distribute wider by
| (2) |
where is the -th column of the last fully connected layer and is the input to it for the -th sample; is the true class for the -th sample; is the temperature scaling parameter, which is set to throughout our experiments. We then add the two losses to compute the final loss function used in training by
| (3) |
where is the weight balancing the two losses. We set to be 2 throughout our experiments.
The design of our CNN and the loss functions explained above is based on our conjecture that the additional employment of the classification loss will guide the CNN to attain better global optimum.
II-B Adjustment of Bounding Box Margin
Given an input image , we apply a face detector to it to obtain a square bounding box of a face. We denote the coordinates of the detected bounding box by (top-left to bottom-right corners), where is the size of the square bounding box. Given this bounding box, we crop the image with additional margins, which will be inputted to our CNN. We denote the coordinates of the crop box with additional margins by , where is a control parameter.
For the face detector, we can use any method having sufficient accuracy. In the following experiments, we used the method of Chen et al. [2]. We also tested Microsoft Face API111https://azure.microsoft.com/en-us/services/cognitive-services/face/ and confirmed that it provided very similar results.
III EXPERIMENTAL RESULTS
We conducted several experiments to test the proposed approach.
III-A Datasets
Several different datasets have been developed so far for head pose estimation. As it is difficult to precisely measure (or manually annotate) the 3D pose of a head, most of them generate the “ground truth” head poses by fitting a mean 3D face with the POSIT algorithm. Although this approach provides accurate results for small angle head poses, it can only provide sub-optimal results for large angle head poses, because the accuracy of landmarks detection will deteriorate for them. We confirmed this tendency in our preliminary experiments. Thus, instead of these datasets developed for head pose estimation, we choose 300W-LP [22] as a training dataset,which contains 61,255 images of faces having large poses, which are synthetically generated from the 300W [3] dataset in such a way that depth of each face is first predicted and then its profile views are generated with 3D rotation.
We choose AFLW2000 [22] for a test dataset, which contains 2,000 identities of the AFLW dataset that have been re-annotated with sixty-eight 3D landmarks using a 3D model. It covers head poses with large variations, different illumination and occlusion conditions, and thus it can be used as a prime target for evaluation of head pose estimators. We also test our method on some datasets captured by RGB-D cameras like BIWI [5] and SASE [13]. The BIWI dataset which captured in a laboratory setting contains 24 videos with 15,678 frames, generated from RGB-D videos captured by a Kinect device for different subjects and head poses. A 3D model is fitted to the RGB-D videos to track and obtain the ground truth head poses. The range of the head pose angle is for yaw, for pitch and for roll. SASE use the same method but applie Kinect 2 camera which offers a higher quality of depth information.
III-B Training Setting
We first apply the face detector to all the training and testing images to get the bounding box of each face. We crop the bounding box with margin specified by as above, and resize it to , which fits to the input size of our CNN. Using batch size 64, we train our CNN for 100 epochs on the 300W-LP dataset using stochastic gradient descent (SGD) optimizer with the learning rate of and momentum parameter of .
III-C Comparison with State-of-the-Art Methods
We first show comparison of our method with the state-of-the-art methods on AFLW2000 and BIWI datasets. For the AFLW2000 dataset, we remove 36 images that have angles larger than , because we only consider the head pose which takes values in .
| Yaw | Pitch | Roll | MAE | |
| HopeNet(=2) [17] | ||||
| 3DDFA [22] | ||||
| FAN [1] | ||||
| Dlib [10] | ||||
| Two-Stage [12] | ||||
| Ours ( = 0.5) | 5.073 | 6.369 | 4.992 | 5.478 |
Table I shows results of our approach and the state-of-the-art methods on the AFLW2000 dataset. It is seen that the proposed method achieves the best accuracy for all yaw, pitch and roll angles by a large margin as compared with others. The two-stage methods (i.e., those that detect and use landmarks) tend to yield large errors due to failure of landmark detection. The direct methods including ours predict angles directly from image intensities and tend to provide better performance. Table II shows results on the BIWI dataset. Although it yields slightly less accurate estimate for the roll angle estimation, the proposed method outperforms others by a large margin in the mean absolute error (MAE).
III-D Effects of Bounding Box Margins
We show that the choice of the margin parameter has a significant impact on accuracy in the proposed method. We evaluated the performance of our method by varying in the interval from (the original bounding box) to . To be specific, we train the proposed CNN on the 300W-LP dataset for 100 epochs and test it on the AFLW2000 dataset. As shown in Table III, the accuracy attains the best around the intermediate values between and . Based on this observation, we can state that provides the best result.
| Yaw | Pitch | Roll | MAE | |
|---|---|---|---|---|
| Combined loss () | ||||
| Combined loss () | ||||
| Combined loss () | 4.727 | |||
| Combined loss () | ||||
| Combined loss () | 4.749 | 6.191 | 5.234 | |
| Combined loss () | ||||
| Combined loss () |
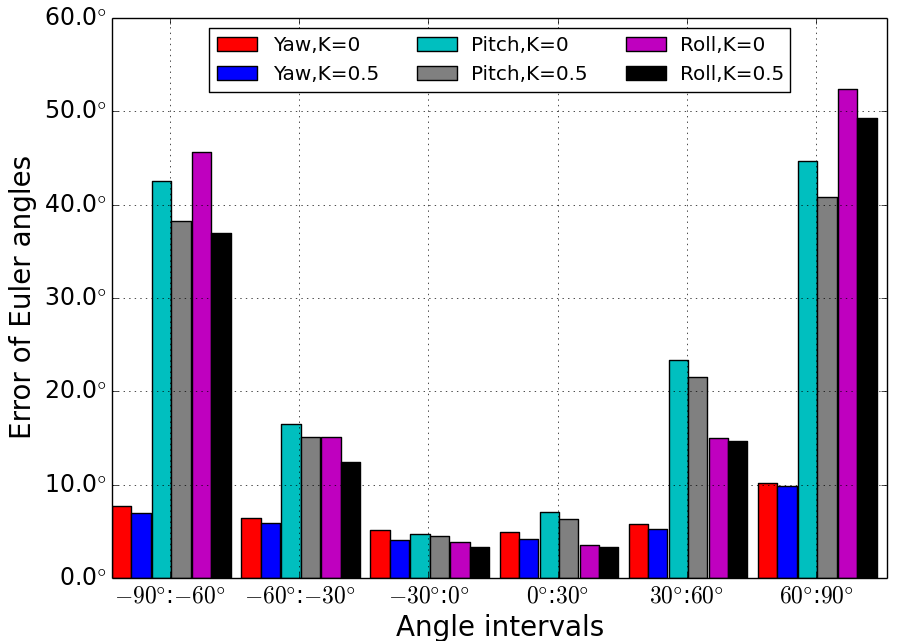
Fig. 4 shows detailed behaviour of the proposed method for different angle values with two values ( and ). It is observed that the yaw angle is accurate for a wide range of angles, whereas the pitch and roll angles tend to be inaccurate for larger (absolute) angles. It is then observed that the use of the bounding box margin () improves accuracy for all three angles over all angle values. The improvement tends to be larger for the cases where we have large errors, i.e., large pitch and roll angles.
III-E Comparison with a Standard Regression Loss
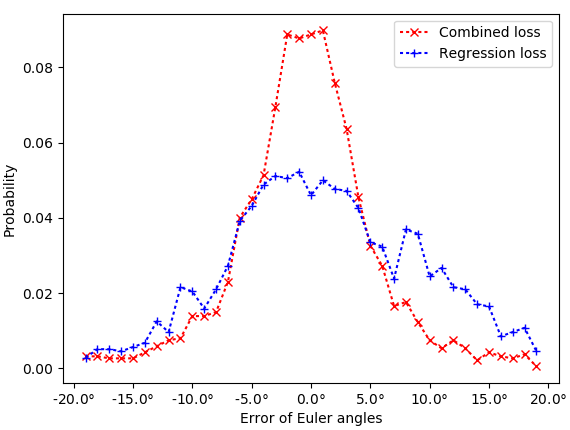
We also conducted an ablation test with respect to the proposed combined loss. Specifically, we compare the performance of the proposed method with and without using the classification loss; the proposed loss combined without using the classification loss is identical to the standard regression loss ( loss) used in [16, 15, 11]. Thus, we train our CNN with and without using the classification loss for several values on the 300W-LP dataset for 100 epochs, and then test it on the AFLW2000 dataset. The results given in Table IV show that for all values, the combined loss provides better accuracy than using just the regression loss. We conjecture that this is because of the fact that the classification loss provides a stronger constraint especially in the range of small errors, contributing more robust back-propagation of gradient compared to using the regression loss alone. Taking yaw angle as an example, we demonstrate the distribution of the estimation error for the combined loss and the standard regression loss in Fig. 5. It is observed that more samples distribute near by using combined loss which shows that the network trained with combined loss is more robust than the network trained with regression loss.
| Yaw | Pitch | Roll | MAE | |
|---|---|---|---|---|
| Combined loss () | 5.950 | |||
| Regression loss () | ||||
| Combined loss () | 5.562 | |||
| Regression loss () | ||||
| Combined loss () | 5.234 | |||
| Regression loss () |
IV CONCLUSION
In this paper, we have proposed two methods for improving head pose estimation with a CNN that directly predicts the yaw, pitch and roll angles from a single RGB image. We show that the bounding box margin has impact on estimation accuracy, and also show a new combined loss function of a standard regression loss and a classification loss. We show through experiments that these two contribute to improve the state-of-the-art on several public benchmark datasets.
Acknowledgments
This work was partly supported by JSPS KAKENHI Grant Number JP15H05919 and JST CREST Grant Number JPMJCR14D1.
References
- [1] A. Bulat and G. Tzimiropoulos. How far are we from solving the 2d & 3d face alignment problem? (and a dataset of 230, 000 3d facial landmarks). CoRR, abs/1703.07332, 2017.
- [2] D. Chen, S. Ren, Y. Wei, X. Cao, and J. Sun. Joint cascade face detection and alignment. In Computer Vision – ECCV 2014, pages 109–122, Cham, 2014. Springer International Publishing.
- [3] C.Sagonas, G.Tzimiropoulos, S.Zafeiriou, and M.Pantic. 300 faces in-the-wild challenge: The first facial landmark localization challenge. In Proceedings of IEEE International Conference on Computer Vision (ICCV-W), 2013.
- [4] E.Murphy-Chutorian and M.M.Trivedi. Head pose estimation in computer vision: A survey. IEEE Transactions on Pattern Analysis and Machine Intelligence, 31(4):607–626, April 2009.
- [5] G. Fanelli, M. Dantone, J. Gall, A. Fossati, and L. V. Gool. Random forests for real time 3d face analysis. Int. J. Comput. Vision, 101(3):437–458, February 2013.
- [6] K. He, X. Zhang, S. Ren, and J. Sun. Deep residual learning for image recognition. arXiv preprint arXiv:1512.03385, 2015.
- [7] J. Huang, X. Shao, and H. Wechsler. Face pose discrimination using support vector machines (svm). In Proceedings. Fourteenth International Conference on Pattern Recognition (Cat. No.98EX170), volume 1, pages 154–156 vol.1, Aug 1998.
- [8] Y. Huang, L. Pan, Y. Zheng, and M. Xie. Mixture of deep regression networks for head pose estimation. In 2018 25th IEEE International Conference on Image Processing (ICIP), pages 4093–4097, Oct 2018.
- [9] A. Jourabloo and X. Liu. Large-pose face alignment via cnn-based dense 3d model fitting. In The IEEE Conference on Computer Vision and Pattern Recognition (CVPR), June 2016.
- [10] V. Kazemi and J. Sullivan. One millisecond face alignment with an ensemble of regression trees. 2014 IEEE Conference on Computer Vision and Pattern Recognition, pages 1867–1874, 2014.
- [11] A. Kumar, A. Alavi, and R. Chellappa. KEPLER: keypoint and pose estimation of unconstrained faces by learning efficient H-CNN regressors. CoRR, abs/1702.05085, 2017.
- [12] J. Lv, X. Shao, J. Xing, C. Cheng, and X. Zhou. A deep regression architecture with two-stage re-initialization for high performance facial landmark detection. In 2017 IEEE Conference on Computer Vision and Pattern Recognition (CVPR), pages 3691–3700, July 2017.
- [13] I. Lüsi, S. Escalera, and G. Anbarjafari. Sase: Rgb-depth database for human head pose estimation. pages 325–336, 11 2016.
- [14] J. Ng and S. Gong. Composite support vector machines for detection of faces across views and pose estimation. Image and Vision Computing, 20(5):359–368, 2002.
- [15] R. Ranjan, V. M. Patel, and R. Chellappa. Hyperface: A deep multi-task learning framework for face detection, landmark localization, pose estimation, and gender recognition. CoRR, abs/1603.01249, 2016.
- [16] R. Ranjan, S. Sankaranarayanan, C. D. Castillo, and R. Chellappa. An all-in-one convolutional neural network for face analysis. CoRR, abs/1611.00851, 2016.
- [17] N. Ruiz, E. Chong, and J. M. Rehg. Fine-grained head pose estimation without keypoints. CoRR, abs/1710.00925, 2017.
- [18] J. Sherrah, S. Gong, and E. jon Ong. Understanding pose discrimination in similarity space. In 10 th British Machine Vison Conference, pages 523–532. BMVA Press, 1999.
- [19] J. Sherrah, S. Gong, and E. Ong. Face distributions in similarity space under varying head pose. Image and Vision Computing, 19(12):807 – 819, 2001.
- [20] M. Venturelli, G. Borghi, R. Vezzani, and R. Cucchiara. From depth data to head pose estimation: a siamese approach. CoRR, abs/1703.03624, 2017.
- [21] Z. Zhang, Y. Hu, M. Liu, and T. Huang. Head pose estimation in seminar room using multi view face detectors. In Multimodal Technologies for Perception of Humans, pages 299–304, Berlin, Heidelberg, 2007. Springer Berlin Heidelberg.
- [22] X. Zhu, Z. Lei, X. Liu, H. Shi, and S. Z. Li. Face alignment across large poses: A 3d solution. CoRR, abs/1511.07212, 2015.
- [23] X. Zhu and D. Ramanan. Face detection, pose estimation, and landmark localization in the wild. In 2012 IEEE Conference on Computer Vision and Pattern Recognition, pages 2879–2886, June 2012.