Automating chaos experiments in production
Abstract
Distributed systems often face transient errors and localized component degradation and failure. Verifying that the overall system remains healthy in the face of such failures is challenging. At Netflix, we have built a platform for automatically generating and executing chaos experiments, which check how well the production system can handle component failures and slowdowns. This paper describes the platform and our experiences operating it.
Index Terms:
chaos engineering, fault injection, distributed systems, experimentationI Introduction
Consider a service delivered to users over the Internet. All such services are implemented as distributed systems. The smallest such service would involve two machines (a single client and server), while the larger ones, such as Netflix, are composed of thousands of servers.
Large-scale distributed systems contain many failure modes, as there are many opportunities for individual component failures and unexpected interactions among components[1]. To ensure that a system remains available to users, engineers build resiliency into the system through strategies such as timeouts, retries, and fallbacks [2].
Ideally, a distributed system will degrade gracefully if an individual component runs into trouble. In general, it is difficult to know whether engineering resiliency mechanisms will actually work to keep the overall system healthy if some part of the system goes bad.
Chaos engineering [3, 4] is an emerging approach in industry to evaluate the resiliency of a distributed system by running experiments against the system, in production. These experiments can identify weaknesses that could lead to outages if left unchecked.
At Netflix, we have developed a platform to automate the generation and execution of chaos experiments. These experiments run directly against our production environment. The authors are all members of the Resilience Engineering team, which is a centralized team that develops chaos engineering tools. In this paper, we discuss the design of our system and our experiences operating it. This platform was built in about three years by a team whose size varied between one and four software engineers.
II Context: Netflix
II-A Overview
Netflix is a service that enables customers to stream television shows and movies over the Internet, on a variety of different types of devices, such as smart TVs, set-top boxes, smartphones, tablets, laptops, and game consoles.
One of the most important key performance indicators for Netflix is availability. In our context, we consider the system to be available if users are successfully able to stream video on their devices. We usually express service availability as a percentage of users who are successfully able to stream video, over some interval of time. For example: 99.99% availability (“four nines”) means, roughly, that 99.99% of the time, when a user tried to start watching a video, they were successful.
While Netflix does not have the same availability requirements as, say, a telecommunications company, availability is still important for the business: if customers experience service interruptions, they are more likely to cancel their subscriptions.
II-B Microservice architecture
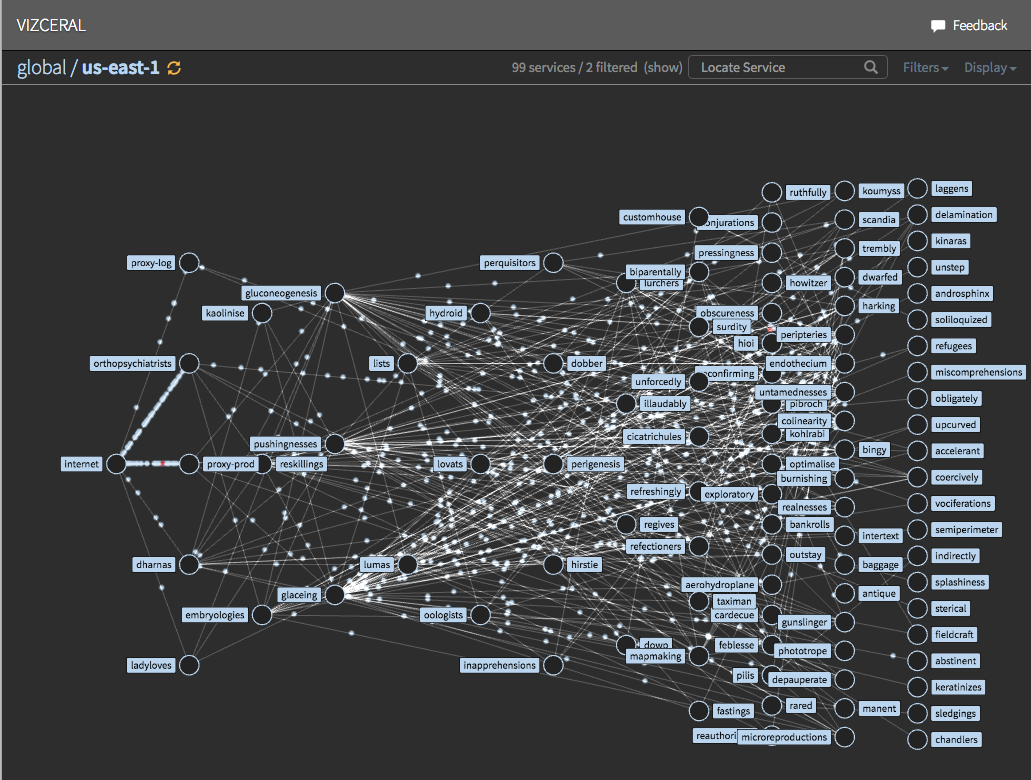
From the perspective of the end-user, Netflix is a single service. Internally, Netflix is implemented using a microservice architecture [5]: a collection of services111For the remainder of this paper, we use the term service to refer to a microservice. that communicate with each other via remote procedure call (RPC). Fig. 1 shows a Vizceral[6] visualization of a microservice architecture, where each node represents a cluster of servers that make up a single service, and requests, referred to collectively as traffic, flow through the system from left to right.
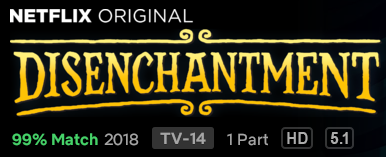
Many features that Netflix exposes to users are localized to specific services. For example, Netflix allows users to search for a specific title: this functionality is implemented by the search service. Fig. 2, which shows a screen shot of part of the Netflix user interface, demonstrates how the user interface is assembled from the output of different microservices. There is one service that is responsible for presenting the match score, another one for showing metadata about the video stream (HD, 5.1), and another one that will process the results if a user clicks the ”Rate this title” option and give the title a thumbs up or thumbs down.
Netflix uses a microservice architecture to improve velocity: services are owned by different teams, and each team can deploy a service independently, without needing to coordinate with other teams. A microservice architecture can also increase availability by reducing the size of fault domains: if one service gets into a bad state, it doesn’t necessarily put the overall system into a bad state. For example, if the service that processes user rating fails, the overall system should handle that failure gracefully and the user should not even notice that this service has failed.
II-C Resilience through timeouts, retries, and fallbacks
The Netflix control plane operates in an unforgiving environment: one of constant change within a public cloud. In this type of environment, there are many potential sources of failure, stemming from the infrastructure itself (e.g., degraded hardware, transient networking problem) or, more often, because of some change deployed by Netflix engineers that did not have the intended effect.
Three of the strategies that Netflix employs to achieve resilience are timeouts, retries, and fallbacks. All RPCs are configured with timeouts. An RPC might time out for a number of reasons, including problems with the particular server being called (e.g., server is overloaded) or problems with the networking infrastructure.
Many failures are either transient or isolated to a specific server, which means that a retry to a different server can often resolve the situation. However, not all problems are transient: if a bad code push results in a downstream service being in a bad state (e.g., returning errors for all requests), then a retry will not resolve the situation. In these cases, we rely on fallbacks, which is a sensible default response. For example, if we cannot suggest a row of viewables that are personalized for an individual user, we can fall back by serving a row of viewables that are not personalized (e.g., what is currently popular on Netflix). Fallbacks enable the system to degrade gracefully when encountering localized failures.
Many Netflix services use the Java-based Hystrix[7] library to implement fallbacks and the circuit breaker pattern[2]. The Hystrix library has the notion of commands. A Hystrix command is a wrapper around logic that can potentially fail. A common Hystrix use case is to wrap a call for an RPC client. The Hystrix command can be configured to support timeouts, and fallbacks to handle errors. Hystrix commands are multithreaded: by default, a Hystrix command is associated with a threadpool with ten threads.
One of the challenges with timeouts and fallbacks is that these behaviors are not exercised as frequently as the happy path, which means we have less confidence they will work as expected. This is one of the key motivations for the development of the Chaos Automation Platform.
III ChAP
III-A Overview
We have developed a system called the Chaos Automation Platform (ChAP)[8] for running chaos engineering experiments within the Netflix microservice architecture.
Most ChAP experiments focus on evaluating whether the overall system would remain healthy if one of the services degraded. Two failure modes we focus on are a service becoming slower (increase in response latency) or a service failing outright (returning errors). The service-level view of failure is useful because many different types of faults can be modeled as a service slowing down or returning errors. In particular, many bad code pushes (deployment of code with defects) can be modeled as a service that returns errors, and many forms of resource exhaustion (e.g., CPU, threads, memory, network bandwidth) can be modeled as a service slowing down.
ChAP is effectively an orchestration system that interacts with a number of internal Netflix services in order to carry out experiments. ChAP leverages a fault222 In this paper, we sometimes use fault and failure interchangeably, which is consistent with the Chaos Engineering industry community usage. injection system developed inside of Netflix called FIT[9], which does fault injection at the application level. FIT takes advantage of the fact that applications deployed inside of the Netflix control plane use a common set of Java libraries. These libraries have hooks in them that enable us to inject faults at runtime.
Fault injection is typically done by annotating incoming requests with metadata that indicate that a call should be failed. This metadata is passed along as requests propagate through the system.
FIT supports two types of fault injection:
-
•
failure - throw an exception instead of executing the call
-
•
latency - add latency before executing the call
III-B Motivating example: failing the bookmarks service
To understand what ChAP does, we’ll walk through an example experiment. There is a service, which we’ll call bookmarks, which is responsible for keeping track of where a user when they previously watched a video. For example, if you previously watched 45 minutes of the romantic comedy “Set it up”, quit the Netflix app, and then returned to watch, the bookmarks service is responsible for identifying the location in the video to continue watching from.
The bookmarks service adds value for users, but it is not essential to the functioning of the overall system. If the bookmarks service failed, then we would still expect that users would be able to use the service and watch videos: they simply wouldn’t be able to continue from the last place where they watched.
Our hypothesis is that users should still be able to stream video when the bookmarks service fails. We can test this hypothesis by running an experiment where we intentionally cause the bookmarks service to fail for a sample of the user population, and verify that this sample of users are still able to stream videos successfully.
Although ChAP supports both server-side and client-side RPC fault injection, in our experiments we generally inject faults into the RPC clients: the service that is the subject of the experiment is the caller upstream of the service that we intend to fail. In this example, the API service[11] is the upstream that calls the bookmarks service.
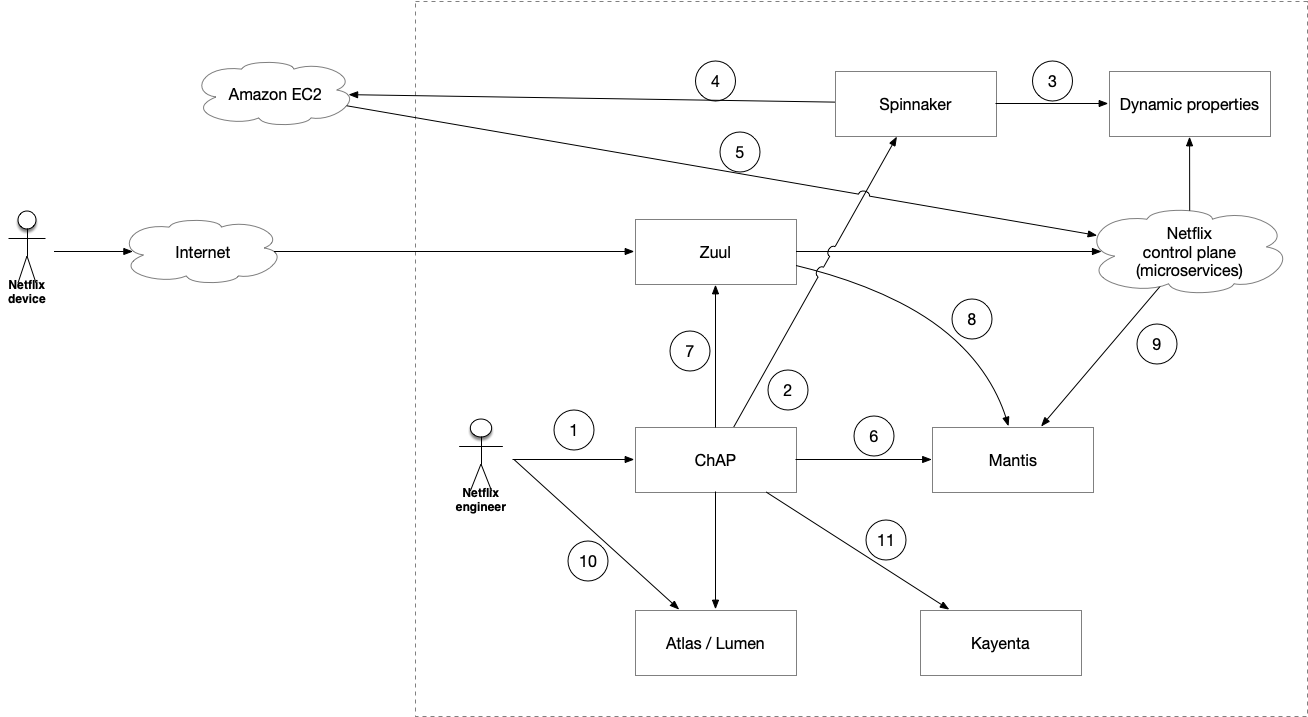
For this example, we’ll assume that the API cluster contains 180 servers. We also assume that the experiment will impact 1% of users. This means that we will select randomly select 1% of active users to be in the experiment (treatment) group. We will also randomly select 1% of users to be in the control group. Fig. 3 depicts some of the internal Netflix services that ChAP must orchestrate to run an experiment. A ChAP experiment in progress is depicted in Fig. 6.
III-C Define the experiment
The user, a Netflix engineer, creates an experiment using the ChAP UI ①. In this case, the experiment is: fail RPCs to the bookmark service and verify the system in general and the API service in particular remain healthy.
The user specifies:
-
•
Failure scenario: fail calls to the bookmark service
-
•
Service to observe: API
III-D Create the baseline and canary clusters
ChAP first calls out to Spinnaker[12] ②. Spinnaker is Netflix’s continuous delivery system. Spinnaker serves as an interface for two important services: Amazon EC2 and Netflix’s internal dynamic properties system.
Netflix engineers use Spinnaker’s web-based user interface (UI) to define deployment pipelines for deploying their services onto Amazon EC2. Netflix engineers also use Spinnaker’s UI as an interface into Netflix’s internal dynamic properties system. Netflix services support dynamic configuration: configuration properties can be changed at runtime through Spinnaker.
ChAP uses Spinnaker to make requests against Amazon EC2 ④ to provision two smaller copies of the API cluster inside of the Netflix control plane ⑤ . These clusters are referred to as the “baseline” and “canary” clusters. Traffic from users in the control group will be routed to the baseline cluster, and traffic from users in the experiment group will be routed to the canary cluster. We borrow the baseline/canary terminology from canary deployments[13]. Spinnaker is also used to copy any dynamic configuration settings from the original cluster to the baseline and canary ③. The dynamic configuration settings are copied before creating the new clusters so that the settings are in place before the new instances boot.
We size the baseline and canary clusters to be 1% of the size of the original cluster, in this example that corresponds to two servers per cluster.
Netflix services use routing identifiers called VIPs (virtual IPs)[2]. VIPs are strings which behave similarly to DNS hostnames. Servers advertise VIPs to Eureka[14], the service discovery service. RPC clients query Eureka to translate a VIP into a list of IP addresses. The baseline and canary clusters are each configured to advertise a VIP that is different from the original cluster. For example, if the servers in the original API cluster advertise the VIP api, then the baseline cluster would be assigned the VIP api-chap-baseline and the canary cluster would be assigned the VIP api-chap-canary. Because the RPC clients upstream of API are only configured to call out to the api VIP, the baseline and canary clusters do not receive any traffic when they first come up.
III-E Start low-latency monitoring job
As will be discussed in more detail in Section III-G, ChAP relies on the Atlas[15] telemetry system as a source for many of the dashboard graphs as well as the final analysis of the experimental results.
However, the most recent data we can reliably query from Atlas is typically five minutes old. If an experiment has revealed a significant vulnerability and customers are being severely impacted, we wish to detect this as soon as possible so we can abort the experiment.
In order to obtain lower latency telemetry data on critical business metrics that indicate whether customers are being impacted, we rely on an internal stream processing system called Mantis[16].
Mantis is a platform that allows Netflix engineers to define jobs that consume events that are generated by different microservices. ChAP starts a Mantis[16] job ⑥ which keeps a count of the number of successful and failed video start play and download events, for users in both the baseline and canary groups. The Mantis job sends this data back to ChAP once a second. The latency of this data is on the order of seconds rather than minutes.
III-F Sample from users, configure routing and fault injection
ChAP publishes an event through an internal data publishing and subscription (pub/sub) service to indicate that the experiment should begin.
The event contains the following information:
| Data | Example |
|---|---|
| Experiment size | 1% of users |
| Failure to inject | fail calls to the bookmarks service |
| VIP of original cluster | api |
| VIP of baseline cluster | api-baseline |
| VIP of canary cluster | api-canary |
Zuul[17] is the front door to the Netflix control plane. It is a reverse-proxy service that receives all inbound requests from Netflix devices and routes the traffic into the control plane. Zuul also supports the notion of filters, which are functions that can be added to Zuul in order to perform processing on incoming requests. The Resilience Engineering team owns a Zuul filter which provides the functionality required for doing ChAP experiments, as described below:
The ChAP Zuul filter receives the event published by ChAP ⑦ and randomly assigns 1% of users to the baseline group, and 1% of users to the canary group.
If an end-user is selected to be part of the baseline group, then all requests associated with that user will be annotated with a header with the following routing rule: api api-baseline.
Any RPC client that is configured to make calls to the api VIP will instead make the call to api-baseline VIP. This will ensure that the users in the baseline group have their traffic routed to the api-baseline cluster.
If an end-user is selected to be part of the canary group, then all requests associated with that user will be annotated with a header with the following routing rule: api api-canary
In addition, all requests will be annotated with a header with the following fault injection rule: fail calls to the bookmark service. Any RPC client configured to call the bookmarks service will instead return an error.
Zuul emits a Mantis event for each request. When a request involves an end-user that has been selected to be a member of the baseline or canary group, this event is consumed by the ChAP Mantis job ⑧, which keeps track of which end-users are in the baseline and canary groups.
Other services in the Netflix control plane emit events that are associated with “start play” events (successes, errors). These events are also consumed by the ChAP Mantis job: if a relevant event is associated with a user in a baseline or canary group, then the relevant metric counter is incremented.
III-G Display dashboard
Once the experiment starts, the user is presented with a dashboard which plots relevant metrics ⑩. Netflix relies on two internal system for generating operational dashboards: Atlas and Lumen.
Atlas[15] is a telemetry platform for collecting and graphing time-series data in order to provide operational insight. Netflix engineers often interact with Atlas using a user interface called AtlasUI that allows users to generate graphs using either a graphical user interface or through a custom query language called Atlas Stack Language.
AtlasUI is useful for ad hoc generation of individual graphs, but engineers typically want to view a collection of previously specified graphs on a single page. Lumen[18] is a platform that allows Netflix engineers to generate dashboards based on graphs generated by the Atlas back-end.
ChAP uses Lumen dashboards for displaying metrics data. This data is used to determine whether or not the injected faults had a negative impact on system health.
There are two main classes of metrics we use to determine whether the injected fault has had a negative impact on system health:
-
•
key performance indicators (KPIs) for the users in the canary group versus the baseline group
-
•
health metrics for the canary cluster versus the baseline cluster
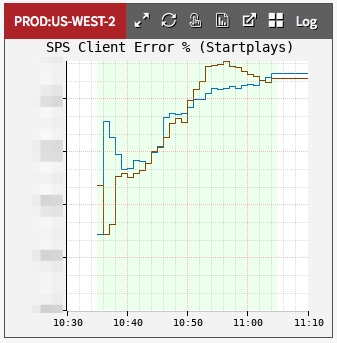
The key performance indicators we are concerned with are around the ability of users to be able to stream video. In particular, we track a count of stream-starts per second (SPS), which is a count of the number of successful video stream starts. We collect SPS counts from both the server side and the device side, and we also track SPS errors, as shown in Fig. 4. Note that because error counts are generally much lower than success counts, it is much more likely that the error counts differ between the two groups due to random variation.
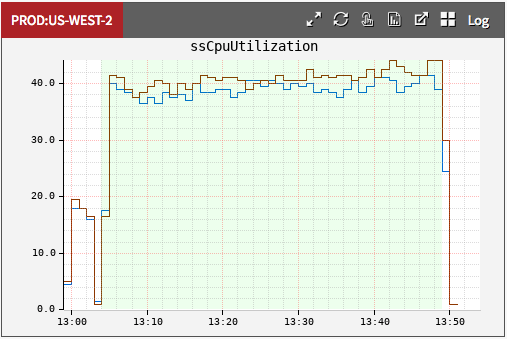
We also compare health metrics between the baseline and canary deployments. We examine metrics such as request rate, latency, error rate, and CPU utilization. One example, CPU utilization, is shown in in Fig. 5.
III-H Monitor ongoing experiment
ChAP monitors the experiment as it runs to verify that there is no significant negative impact to customers. See Section IV for more details.
III-I Cleanup
Once the experiment has completed, ChAP unpublishes the experiment event to stop Zuul from re-routing traffic and injecting faults. ChAP makes calls against Spinnaker to tear down the baseline and canary clusters.
III-J Analyze the results
Finally, ChAP calls out to Kayenta[19] ⑪, Netflix’s automated canary analysis system. Netflix engineers often use canary deployments to verify that new code being pushed to production has not introduced a regression. Kayenta performs a statistical analysis of metrics collected from a canary cluster and compares it to a baseline cluster, in order to determine whether there has been a statistically significant impact on any metrics of interest.
ChAP leverages Kayenta to perform an automated analysis of the relevant metrics for a chaos engineering experiment. While Kayenta was originally designed for evaluating the health of canary deployments, we found it to be an excellent match for analyzing the results of ChAP experiments.

IV Safety mechanisms
Because ChAP experiments involve fault injection, every experiment carries risk that it could lead to an incident. To mitigate this risk, we have built in a number of safety mechanisms that limit the blast radius of an experiment.
Business hours. ChAP experiments only run during business hours: weekdays from 9AM to 5PM. This ensures that if something does go wrong, then engineers are likely to be at work and can respond more quickly than if there was an issue after hours.
Automatic stop. If ChAP detects excessive customer impact during an experiment, then it will stop the experiment early. This customer impact test is a cruder test than the non-parametric statistical tests used by Kayenta, but it limits the harm in the case where an experiment might have significant impact on affected users.
Total traffic. The set of all concurrently executing ChAP experiments cannot impact more than 5% of the total traffic, in any one of the three geographical regions that Netflix servers run in.
Failover. The Netflix control plane is deployed in three different Amazon geographical regions. If there is a problem with one of the regions, Netflix engineers can evacuate traffic from the troubled region and redirect it to the other two regions, a process we refer to as failover[20]. ChAP does not permit experiments to run during a failover as a safety mechanism, since a failover can violate assumptions that ChAP makes about the number of requests that are flowing through a region.
V Monocle
In designing ChAP, we considered two models of usage:
-
•
a self-serve model where engineers define and run their own experiments.
-
•
a fully automated model where a centralized team defines and runs experiments.
We initially adopted a self-serve model, where users were responsible for defining their own experiments. ChAP integrated with the Spinnaker deployment system so that users could add ChAP experiments to their deployment pipelines, but users were responsible for setting this up themselves. Later, we transitioned to a hybrid approach where we would automatically generate and run experiments, as well as support users in running self-serve experiments.
We developed an additional service called Monocle that has two functions, introspecting services and generating experiments.
VI Service introspection
Monocle introspects Netflix services to collect information about its dependencies. Here, a dependency refers to either a configured RPC client or a Hystrix command.
Monocle integrates data from multiple sources: the telemetry system (Atlas[15]), the tracing system (based on Dapper[21]) and by querying running servers directly for configuration information such as timeout values.
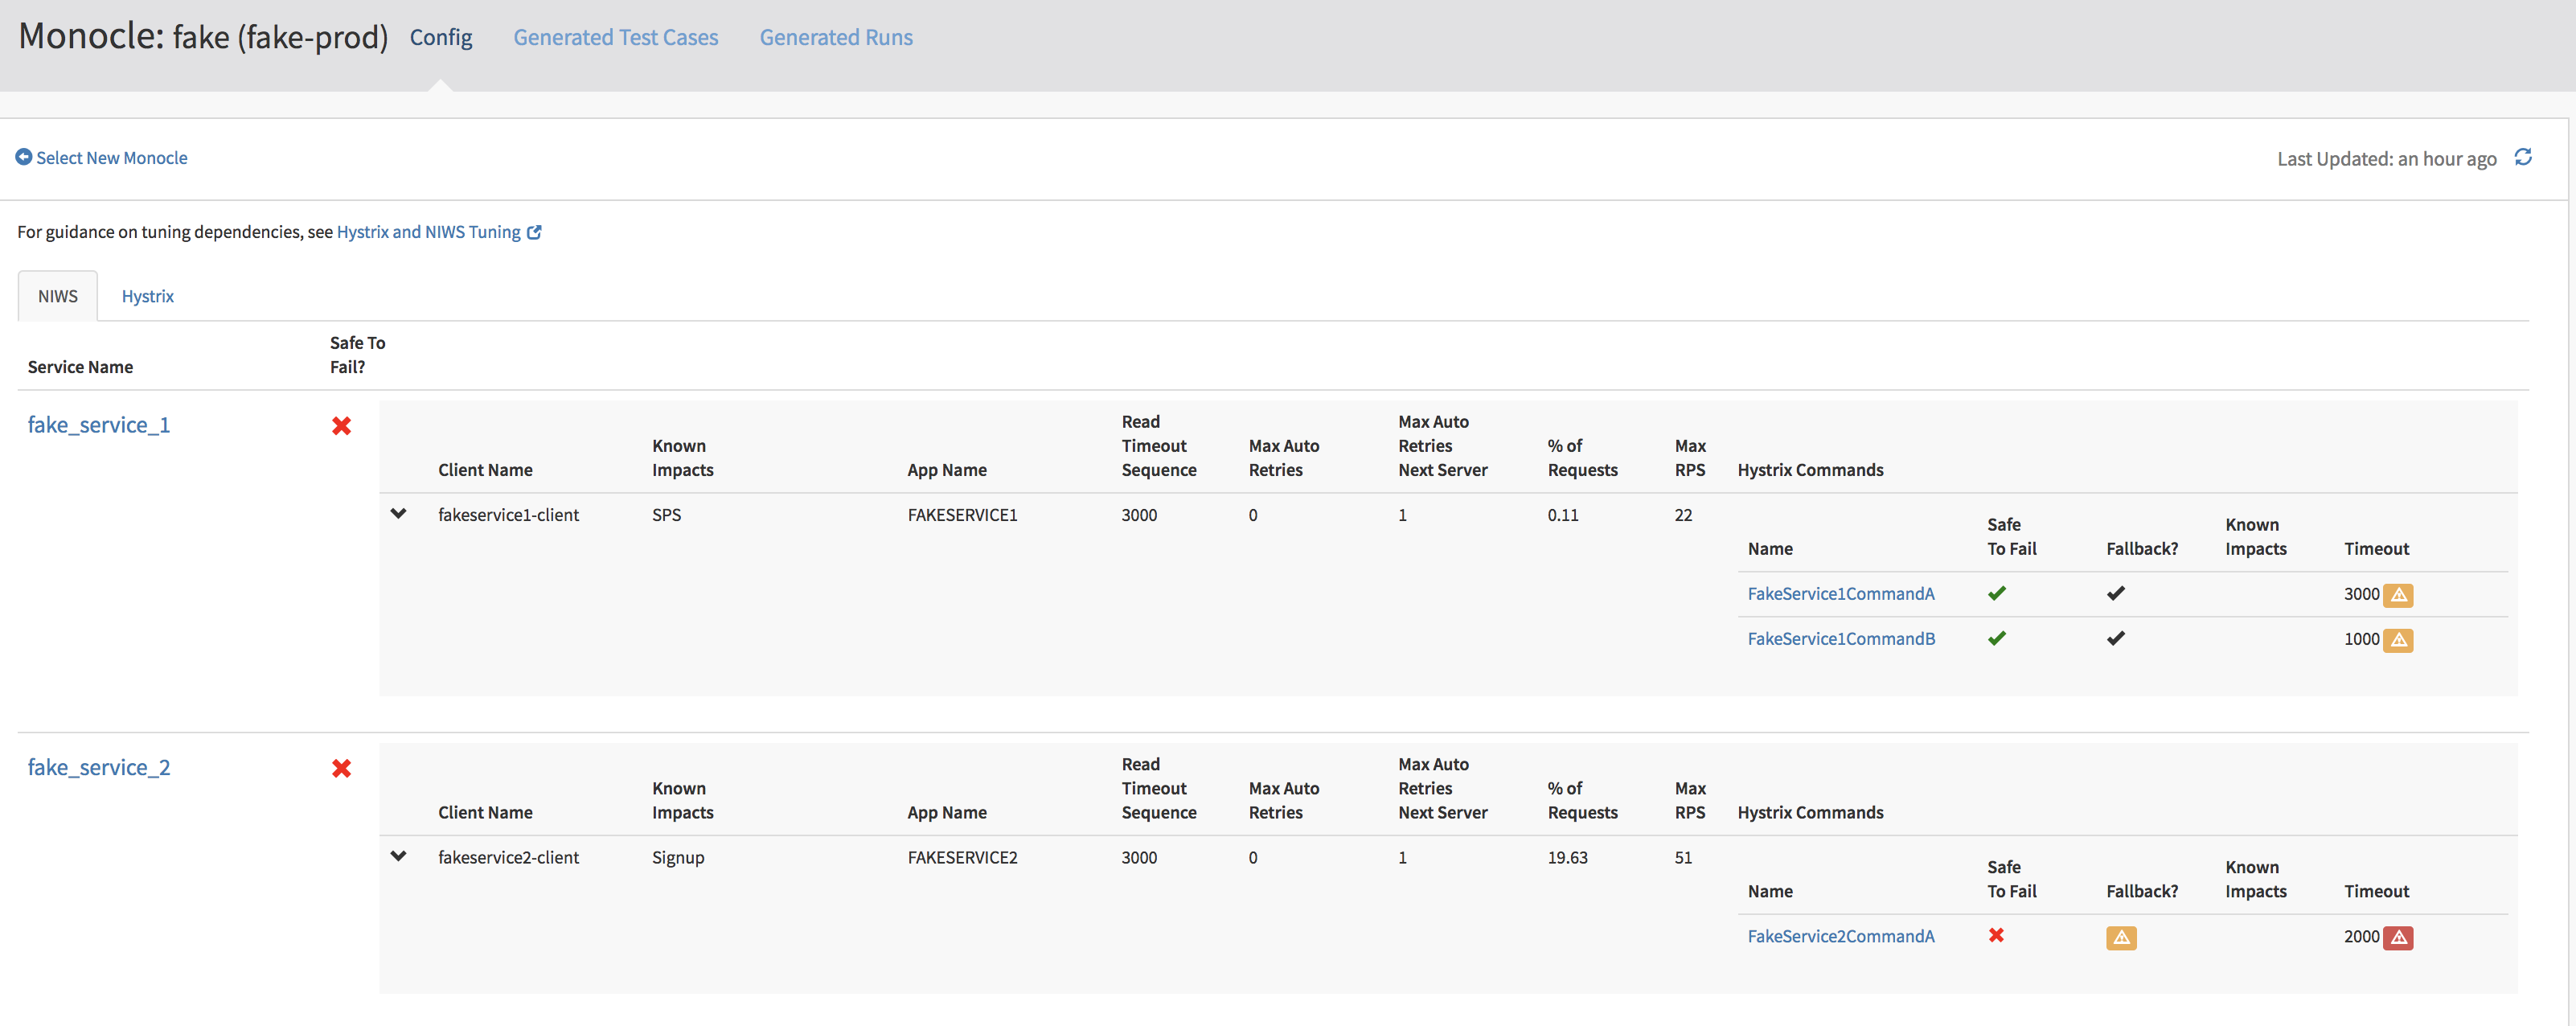
Monocle provides a UI which summarizes information about dependencies. For each Hystrix command, Monocle displays:
-
•
The percentage of inbound requests that trigger an invocation of the Hystrix command.
-
•
Whether it is believed to be safe to fail
-
•
Whether it is configured with a fallback
-
•
Configured timeouts
-
•
Observed latencies over the past two weeks (mean, P90, P99, P99.5)333P90 stands for “90th percentile”
-
•
Thread pool size
-
•
Observed number of active threads over the past two weeks
-
•
Which RPC clients it wraps, if any
-
•
Any known impacts associated with the Hystrix command
The Monocle UI provides a tabular view from Monocle of a list of Hystrix commands
We use heuristics such as the presence of a configured fallback and telemetry data that shows that the fallback has succeeded when executed. When accessing this view, users have the ability to toggle back-and-forth between viewing all of the Hystrix commands for a cluster or viewing all the RPC dependencies for a cluster.
Yellow and red attention icons show tooltips when moused over, and provide additional details around warnings and vulnerabilities. For example, mousing over red tooltip reveals the following message:
Warning: Hystrix Command Timeout is Misaligned with RPC client.
Timeout (1000 ms) is less than the max computed timeout of the wrapped RPC client (4000 ms). This means that Hystrix will give up waiting on RPC. This may be OK for non-critical calls, but you should review the config settings to confirm the desired behavior.
For each RPC Client, Monocle shows:
-
•
Timeout and retry configurations
-
•
The percentage of inbound requests that trigger an RPC call
-
•
Maximum observed invocation rate (requests per second) over the past two weeks
-
•
Which Hystrix commands wrap it, if any, and if they are safe to fail
-
•
Any known impacts associated with the RPC client or the Hystrix commands that wrap it
Fig. 7 shows a tabular view from Monocle of a list of RPC dependencies (note: NIWS Client reference in the figure is Netflix Internal Web Service Framework, referred to as RPC Client throughout the paper [20]). Note how the commands that are not configured with fallbacks are shown as not being safe to fail. We use heuristics such as the presence of a configured fallback and telemetry data that shows that the fallback has succeeded when executed. When accessing this view, users have the ability to toggle back-and-forth between viewing all of the Hystrix commands for a cluster or viewing all the RPC dependencies for a cluster.
VII Experiment generation
Monocle is also responsible for generating experiments automatically. Today, Monocle generates fault injection experiments for dependencies (RPC clients and Hystrix commands). It generates three types:
-
•
Failure
-
•
Latency just below configured timeout (highest timeout - P99 latency over the past 7 days + 5% buffer)
-
•
Latency causing failure (highest configured timeout + 5% buffer)
Monocle uses heuristics to try to identify the experiments with the highest likelihood of finding a vulnerability.
VII-A Criticality score
Monocle assigns a criticality score to each dependency, which is used as input for prioritizing experiments. We are interested in prioritizing experiments on the more critical dependencies sooner and more frequently because these are the ones that we believe will cause the most harm if they behave incorrectly.
Beyond direct experimentation; we have also discussed using scores to generate a list of critical dependencies. That list could be used to identify and prioritize reliability work for our most critical components.
The criticality score is the product of the following four values:
-
1.
dependency priority (RPC client , Hystrix command )
-
2.
maximum percentage of inbound requests that trigger the dependency over the past 7 days as compared to all of the dependencies in the cluster ()
-
3.
retry factor (1 + configured number of retries)
-
4.
number of interactions associated with the dependency (if the dependency is an RPC Client, this would be the number of Hystrix commands, if it is a Hystrix command, this would be the number of RPC Clients)
Hystrix commands are prioritized over RPC clients because Hystrix commands wrap RPC client calls, and we want to verify that the Hystrix fallbacks are working correctly first.
VII-B Prioritization score
Monocle calculates a score for each experiment as a the product of:
-
1.
criticality score (see above)
-
2.
safety score (safe , unsafe )
-
3.
experiment weight444This is a simplification, we actually flip the weights if the score is negative in order to maintain the ordering of the experiments. (failure , latency , latency causing failure )
Monocle assigns a safety score of -1 to any experiment that it deems as unsafe. This includes situations such as:
-
•
Dependency being experimented on has been blacklisted (no experiment types should be created for this dependency)
-
•
Dependency data associated with the experiment has been not been recently collected, and does not have up-to-date information
-
•
Dependency being experimented on contains a critical vulnerability and no experiment types should be created. For example, the dependency is an unwrapped RPC Client (no Hystrix command)
-
•
Dependency has a known impact associated with its failure (added by a user and directly related to a key performance indicator: SPS, downloads per second, login, or signup)
-
•
Experiment being created is a latency experiment, and the dependency is both missing fallbacks and requires timeout tuning
-
•
Experiment being created is a failure experiment and the dependency is not safe to fail due to a missing fallback
Monocle computes scores for all possible experiments and the resulting score represents whether a test is safe to run (i.e., scores 0 are safe). For the current use cases, there is not much need for scores of unsafe experiments except for debugging. This is an implementation detail, and another option would be to pre-process the experiments and identify safety before scoring them.
Monocle then runs the experiments in priority order. Only experiments which have a positive score will be run. When going through the prioritized list, Monocle checks if the experiment should run by ensuring
-
•
The experiment is not already running
-
•
The experiment is not in a failed state (it has previously failed and has not been looked at by a user)
-
•
The experiment has not been run in the last (configured number) of days
VIII Results
To date, experiments generated by Monocle have revealed several cases where timeouts were set incorrectly and fallbacks revealed the service to be more business critical than the owner had intended. Fig. 8 shows an example of an interaction problem that can arise between a Hystrix command’s timeout configuration and its threadpool size. In this experiment, about 900 ms of latency is injected into a Hystrix command to mimic the scenario of a downstream dependency going latent.
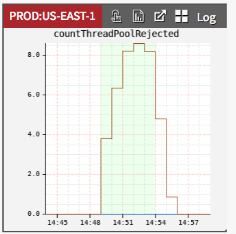
The increase in the countThreadPoolRejected metric indicates that the work could not be scheduled to a thread because all of the threads in the threadpool are blocked, resulting in the Hystrix command serving a fallback. This leads to a short-circuiting behavior where the Hystrix command unconditionally serves fallbacks for a period of time.
The revealed problem is that the timeout is too high relative to the size of the threadpool. In this particular case, the configured timeout was much higher than the 99th percentile latency reported by our telemetry system, and so the solution was to decrease the timeout accordingly.
IX Challenges and lessons learned
IX-A Failure modeling
The existing tooling limits the type of faults that we can inject into the system. In particular, FIT can only cause one type of error per injection point, but there are often multiple ways that a service can fail. For example, we had a situation where we ran an experiment by injecting failure into a particular service. The injected fault behaved as if the service returned an error. The experiment showed that the system could handle this failure gracefully. However, we had an incident where none of the servers associated with that service were registered in our service discovery mechanism.
IX-B Application-based fault injection
Netflix implements fault injection using defined injection points in Java-based platform libraries. These libraries are common to all Netflix applications. Deploying new libraries can take many months, as we have to wait for all of the services to pick them up.
Historically, applications in the Netflix control plane have been Java-based. However, the trend inside of Netflix is to move towards more support for polyglot, most notably JavaScript running on Node.js. This makes an application-based approach challenging because we need to implement new libraries for each supported language.
There are alternative approaches which do fault injection out-of-process, obviating the need for language-specific bindings. Istio[22] is one example of a service mesh based approach to fault injection.
IX-C Even if you build it, they might not come
When ChAP was first made available for internal users, we only had a few teams making regular use of the service. While we strove to make the interface as simple as possible for new users, running an experiment on production traffic is itself a complex task, and there is a limit as to how much we can possibly simplify the interface to support this. We employed a consulting model with internal teams who would make good candidates for potential users, but we did not see widespread usage.
IX-D Challenge of automation
Our alternate approach to the self-serve model, automatically generating the experiments ourselves, presented its own set of challenges. We needed to develop heuristics to determine which types of faults could be injected which were not known to cause customer impact. This was necessarily a smaller space of faults then if we have domain knowledge about the individual services.
In addition, we had to ensure that we had a low false positive rate, otherwise the service teams would lose confidence in the results of the experiments. This meant that if an automatically generated ChAP experiment revealed a potential vulnerability, a member of the Resilience Engineering team had to spend time analyzing the results of the experiment to verify that it did, in fact, reveal a genuine vulnerability. This was generally a time-consuming and tedious process. It is possible to build supplementary tooling to reduce the effort involved in doing the analysis, but that itself requires an additional investment.
IX-E Small sub-populations
Small sub-populations are a challenge to deal with. Netflix software runs a variety of different types of devices, and these devices behave differently. A problem might only manifest on, say, a particular brand of Smart TV. If only a tiny fraction of our userbase watches Netflix on this type of television, then even if these users can’t stream video at all, it’s unlikely to be detected by looking at total SPS success counts. We could potentially oversample from device types that are less common, but this means that we are increasing the blast radius for that device type, which we have been reluctant to do.
IX-F Error counts
Although intuitively error rates seem like a reliable signal for identifying problems with the system, we found them to have some undesirable properties for use as an experimental measure.
Error counts can help with the small sub-population issue, because error counts are generally quite low, so even a smaller sub-population may end up contributing significantly to the error rate. However, this creates the opposite problem: a single device in the baseline or canary group can cause a significant increase in the error count if the device keeps erroring over and over. This means that if an error-prone device happens by chance to be assigned to a baseline or error group, it can generate a spurious error signal.
In particular, for our automatic stop safety mechanism, we had to substantially increase the threshold which we trigger a stop on the error metrics because of how noisy they were.
IX-G Value of visualization
To be able to automatically generate experiments, we needed to build tooling to obtain visibility into the configuration and observed behavior of RPC clients and Hystrix commands. While this information has always been available within Netflix through telemetry or configuration endpoints, it had not previously been aggregated and displayed, which proved useful for surfacing vulnerabilities and interactions even without using this data for automatic experiment generation. For example, by integrating this information into a single view, we were able to identify some cases of inconsistently configured Hystrix and RPC client timeouts without even needing to run a ChAP experiment.
X Conclusion
Our work demonstrates that it is possible to automatically and safely generate and run chaos experiments. These experiments have identified vulnerabilities that could lead to outages if left untreated.
While the original goal for ChAP was to run fault injection experiments, we have discovered that the platform itself can be used for other types of experiments. We are currently extending ChAP to support load testing experiments, similar in spirit to RedLiner[23]. In addition, some self-serve users have begun experimenting with using ChAP for canary deployments[2], because of the additional analysis that ChAP provides.
References
- [1] H. S. Gunawi, M. Hao, T. Leesatapornwongsa, T. Patana-anake, T. Do, J. Adityatama, K. J. Eliazar, A. Laksono, J. F. Lukman, V. Martin, and A. D. Satria, “What bugs live in the cloud? a study of 3000+ issues in cloud systems,” in Proceedings of the ACM Symposium on Cloud Computing (SOCC’14). ACM, 2014.
- [2] M. T. Nygard, Release It! Design and Deploy Production-Ready Software, 2nd ed. Pragmatic Bookshelf, 2018.
- [3] A. Basiri, N. Behnam, R. de Rooij, L. Hochstein, L. Kosewski, J. Reynolds, and C. Rosenthal, “Chaos engineering,” IEEE Software, vol. 33, no. 3, pp. 35–41, May 2016.
- [4] C. Rosenthal, L. Hochstein, A. Blohowiak, N. Jones, and A. Basiri, Chaos Engineering: Building Confidence in System Behavior through experiments. O’Reilly Media, 2017.
- [5] S. Newman, Building microservices. O’Reilly Media, 2015.
- [6] J. Reynolds and C. Rosenthal, “Vizceral open source,” http://techblog.netflix.com/2016/08/vizceral-open-source.html, August 3 2016, Netflix Tech Blog.
- [7] B. Christensen, “Introducing Hystrix for resilience engineering,” http://techblog.netflix.com/2012/11/hystrix.html, November 26 2012, Netflix Tech Blog.
- [8] A. Blohowiak, A. Basiri, L. Hochstein, and C. Rosenthal, “A platform for automating chaos experiments,” in 2016 IEEE International Symposium on Software Reliability Engineering Workshops (ISSREW), Oct 2016, pp. 5–8.
- [9] K. Andrus, N. Gopalani, and B. Schmaus, “FIT : Failure injection testing,” http://techblog.netflix.com/2014/10/fit-failure-injection-testing.html, October 23 2014, Netflix Tech Blog.
- [10] S. Madappa, “Announcing EVCache: Distributed in-memory datastore for cloud,” https://medium.com/netflix-techblog/announcing-evcache-distributed-in-memory-datastore-for-cloud-c26a698c27f7, February 25 2013.
- [11] K. Probst and J. Becker, “Engineering trade-offs and the netflix API re-architecture,” https://medium.com/netflix-techblog/engineering-trade-offs-and-the-netflix-api-re-architecture-64f122b277dd, August 22 2016, Netflix Tech Blog.
- [12] E. Burns, A. Feldman, R. Fletcher, T. Lin, J. Reynolds, C. Sanden, L. Wander, and R. Zienert, Continuous Delivery With Spinnaker. O’Reilly Media, 2018.
- [13] J. Humble and D. Farley, Continuous Delivery: Reliable Software Releases through Build, Test, and Deployment Automation. Addison-Wesley Professional, 2010.
- [14] K. Ranganathan, “Netflix shares cloud load balancing and failover tool: Eureka!” http://techblog.netflix.com/2012/09/eureka.html, September 4 2012, Netflix Tech Blog.
- [15] B. Harrington and R. Rapoport, “Introducing Atlas: Netflix’s primary telemetry platform,” http://techblog.netflix.com/2014/12/introducing-atlas-netflixs-primary.html, December 12 2014, Netflix Tech Blog.
- [16] B. Schmaus, C. Carey, N. Joshi, N. Mahilani, and S. Podila, “Stream-processing with Mantis,” http://techblog.netflix.com/2016/03/stream-processing-with-mantis.html, March 14 2016, Netflix Tech Blog.
- [17] M. Cohen and M. Hawthorne, “Announcing Zuul: Edge service in the cloud,” http://techblog.netflix.com/2013/06/announcing-zuul-edge-service-in-cloud.html, June 12 2013, Netflix Tech Blog.
- [18] T. Willis, “Lumen: Custom, self-service dashboarding for Netflix,” https://medium.com/netflix-techblog/lumen-custom-self-service-dashboarding-for-netflix-8c56b541548c, October 17 2018, Netflix Tech Blog.
- [19] M. Graff and C. Sanden, “Automated canary analysis at netflix with kayenta,” https://medium.com/netflix-techblog/automated-canary-analysis-at-netflix-with-kayenta-3260bc7acc69, April 10 2018, Netflix Tech Blog.
- [20] R. Meshenberg, N. Gopalani, and L. Kosewski, “Active-active for multi-regional resiliency,” http://techblog.netflix.com/2013/12/active-active-for-multi-regional.html, December 2 2015, Netflix Tech Blog.
- [21] B. H. Sigelman, L. A. Barroso, M. Burrows, P. Stephenson, M. Plakal, D. Beaver, S. Jaspan, and C. Shanbhag, “Dapper, a large-scale distributed systems tracing infrastructure,” Google, Inc., Tech. Rep., 2010. [Online]. Available: https://research.google.com/archive/papers/dapper-2010-1.pdf
- [22] C. Posta and B. Sutter, Introducing Istio Service Mesh for Microservices. O’Reilly Media, 2018.
- [23] J. Xia, Z. Zhuang, A. Rao, H. Ramachandra, Y. Feng, and R. Pasumarti, “RedLiner: Measuring service capacity with live production traffic,” in 2017 IEEE International Conference on Web Services (ICWS), June 2017, pp. 628–635.