Wide-field SU(1,1) interferometer
Abstract
An interferometer uses a sequence of two optical parametric amplifiers for achieving sub-shot-noise sensitivity to a phase shift introduced in between. We present the first realization of a wide-field interferometer, where the use of a focusing element enables spatially multimode operation within a broad angle. Over this angle, the interference phase is found to be flat. This property is important for the high sensitivity to the phase front disturbance. Further, dB quadrature squeezing, an essential requirement to the high sensitivity, is experimentally demonstrated for plane-wave modes inside the interferometer. Such an interferometer is useful not only for quantum metrology, but also in remote sensing, enhanced sub-shot-noise imaging, and quantum information processing.
Interferometers have been used for more than a century to measure physical quantities with high accuracy. Recently, the experimental realization of interferometers has raised significant interest due to the loss-tolerant sub-shot-noise sensitivity [1, 2, 3, 4, 5, 6, 7, 8, 9, 10, 11, 12, 13, 14]. The core idea is to use a series of two optical parametric amplifiers (OPAs) to probe phase shifts between them [15, 16]. Possible applications are in remote sensing [11] and in quantum information processing [14], but such a scheme is especially attractive for quantum metrology with optical [2, 7, 9], atom [17, 5] and hybrid [18] interferometers.
The two-mode squeezed state employed in an interferometer is a quantum resource that helps to overcome the limitations encountered in a classical framework. In the optical phase measurement, the achievable sensitivity for an interferometer beats the shot-noise limit, especially in the low photon-number regime [9, 7]. The configuration is tolerant to detection losses, provided that the second OPA has a sufficiently large gain [19, 20, 14]. To satisfy this condition, one can use two nonlinear crystals as OPAs, since unbalancing the OPAs does not highly affect the mode composition, compared to the case of atoms [17, 5] or four-wave mixers [2, 6]. All interferometers realized so far are spatially single-mode and allow high sensitivity in one dimension only.
In this Letter, we report the first demonstration of a spatially multimode interferometer, using high-gain parametric down-conversion (PDC) produced in a nonlinear crystal. This paves the way towards 2D phase profiling in the quantum regime, close to the common idea of an interferometer with a 2D fringe pattern. Furthermore, our configuration opens up the possibility to enhanced quantum imaging [21] and to the detection of a small disturbance in the orbital angular momentum (OAM) [11]. Finally, we report the measurement of quadrature squeezing for plane-wave modes inside the interferometer, as a prerequisite for achieving high sensitivity. We find that for all plane-wave modes, it is approximately the same quadrature that is squeezed.

The principle of our interferometer is based on two nonlinear crystals with a focusing element in between, as shown in Fig. 1 (a). The PDC radiation produced in the first crystal in the degenerate type-I regime (shown with a red filled cone) is amplified or de-amplified in the second crystal (shown as a brighter cone) depending on the optical phase between the pump, signal and idler fields [19]. To exploit the full multimode structure of the radiation generated in the first crystal, the divergence of the PDC light is corrected with a lens. Provided that the PDC generation region in the first crystal is imaged into the second crystal, the amplification occurs for all angles of emission, intrinsically restricted only by the phase matching conditions. The configuration presented here offers good visibility over broad angles due to the mode matching. In previous experiments without the focusing element, spatial filtering of a single spatial mode around the pump direction was necessary to obtain high visibility and achieve sub-shot-noise phase sensitivity [9].
To avoid the focusing of the pump beam, the paths of the pump and the PDC radiation are split and folded, see Fig. 1 (b). The pump is the third harmonic of a pulsed laser (wavelength nm, repetition rate kHz, pulse duration ps, average power 60 mW). Type-I collinear degenerate PDC is generated in a -barium borate (BBO) crystal. The half-wave plate HWP misaligns the linear polarization of the pump by deg with respect to the optimal (horizontal) direction in order to reduce the parametric gain in the first pass.
Through the dichroic mirror DM2, the PDC radiation is sent to the focusing element, i. e. a spherical mirror M1 with curvature radius mm, and is imaged back onto the crystal. The pump transmitted by DM2 is sent to the quarter-wave plate QWP for polarization control and to the mirror M2 mounted on a piezoelectric actuator PA for phase control. The QWP on a double pass acts as an HWP and, by rotating the pump polarization, controls the parametric gain of the PDC generated in the second pass. Additionally, the pump has a beam size of FWHM in the first pass and, to provide a higher parametric gain, in the second pass. From the nonlinear dependence of the PDC intensity on the pump power, , we measure the gain [22]. We obtain separately the gain from the first pass and from the second pass . The gain unbalancing does not reduce much the interference visibility (see Supplement 1 for details) but it is crucial for the detection of the squeezing, as explained below.
If the path lengths from M1 and M2 to the crystal are such that the pump and PDC radiation pulses overlap on the way back, phase-sensitive amplification/de-amplification occurs depending on the phase shift controlled by the PA. The phase can be locked with the use of an additional beam injected at the unused port of DM2 and a feedback circuit (not shown). The dichroic mirror DM3 reflects the amplified/de-amplified PDC radiation to a charge-coupled device (CCD) camera in the Fourier plane of lens L with a focal length mm. The spectral filtering is achieved with a bandpass filter BF (central wavelength either or nm, bandwidth nm) and a long-pass filter LPF with the edge at nm, directly attached to the CCD.

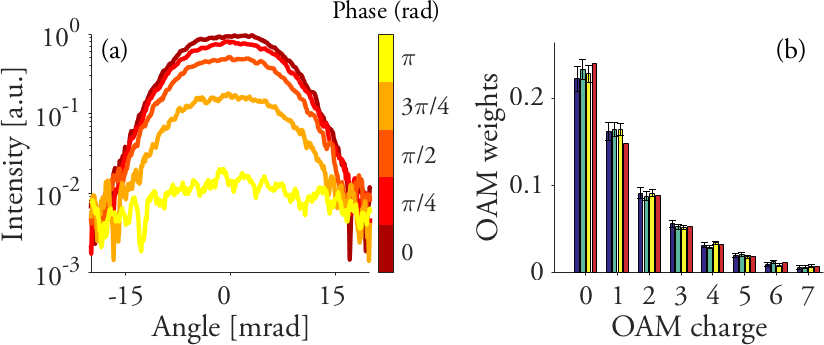
The profile of the single-shot intensity distribution measured at the output is shown in Fig. 2 (a). As the phase is scanned, the amplitude of the characteristic flat-top intensity distribution for phase-matched PDC emission varies periodically, while the width stays constant. As shown in Fig. 2 (a), the visibility of the interference pattern for a single pixel is , but even for the intensity integrated in two dimensions it is more than .
Another remarkable property of the interferometer presented here is the stability of the spatial spectrum at the output, and, in particular, of the OAM spectrum, as the phase changes. Indeed, for any kind of application, the operation of the interferometer needs to be the same for all spatial modes. Further, the change of the OAM spectrum due to an azimuthal phase perturbation can be sensitively detected. To obtain the OAM spectrum at the output, we use a method based on the measurement of the covariance of intensities at different far-field points [23], specified by the transverse wave-vectors , with modules and azimuthal angles . Under the condition , the covariance, formally defined as , can be shown to depend only on the difference [23]. Moreover, if the cross-correlations in the PDC radiation are removed by filtering a slightly non-degenerate wavelength, the covariance averaged over the variable is
| (1) |
Here, are the weights of modes with OAM , normalized as . They can be extracted by performing a Fourier decomposition on the square root of Eq. 1. In experiment, we removed the cross-correlations with a nm bandpass filter centered at nm, which is shifted with respect to the degenerate frequency nm. The covariance was measured from single-pulse intensity spectra acquired with the CCD camera.
Figure 2 (b) shows the OAM weights of the radiation at the output of the interferometer for three different optical phases, namely rad, rad and rad from the dark fringe respectively with blue, green and yellow bars. The weights remain the same as the phase is changed and this demonstrates that all OAM modes are uniformly amplified/de-amplified. The negative-OAM part is not shown here since it is symmetric with respect to . The effective number of OAM modes, given by the formula , is . For comparison, the number of OAM modes for the radiation in the first pass is theoretically estimated to be . The double-pass configuration reduces the number of modes since the effective gain is larger than the gain of the first pass [24]. We obtain the theoretical distribution of the OAM weights through the Schmidt decomposition of the two-photon amplitude of PDC for the double-pass configuration [24, 25]. The theory (red bars in Fig. 2 (b)) confirms the experimental results in the same range of phases. For the case , the theoretical distribution shows a slower decay and a increase in the effective number of modes.
Estimating the number of radial modes at the output of the interferometer to be from a similar experimental reconstruction in the radial degree of freedom, the total number of spatial modes is . The multimode feature is attractive for the realization of high-dimensional quantum spaces [26, 27], but also for imaging [28]. Indeed, the high-order modes are connected with fine details, because of their high spatial frequency, and represent a resource for the resolution in imaging experiments. We therefore characterize our interferometer as a ‘wide-field’ one: it provides both a relatively broad angle ( mrad) and a large number of angular modes within this range.
Finally, we show that the quadrature noise for the radiation inside the interferometer is below the shot noise. This is fundamental to achieve enhanced sensitivity with respect to a ‘classical’ interferometer with the same number of photons. Homodyne detection is not suitable in our case since the PDC emission is highly multimode and it requires the appropriate shaping of the local oscillator field for the measurement of the squeezing in particular eigenmodes (one at a time) [29, 30]. However, it was recently shown [14] that the second amplifier in an interferometer can be used for an ‘optical homodyne’ measurement of quadrature squeezing at the output of the first amplifier. In this approach, the variances of the input quadratures can be found by measuring the total intensity at the output:
| (2) |
with the calibration constant and the generic quadrature operator and the phase of the interferometer . Eq. 2 is valid only under the assumption , where is the squeezed quadrature. This holds true in our case because of the unbalanced gains and because cannot exceed . The constant can be calibrated by removing the input to the second-pass OPA, leaving only vacuum fluctuations. Any loss induced at the detection stage will not contribute because it is already included in the constant . This consideration is valid for single mode, but it can be generalized to the multimode scenario. In the measurement of the total intensity at the output, the contribution of each mode to the amplification/de-amplification depends on the relative phase between the modes and on the overlap of the modes of the input state with the modes generated in the second-pass OPA [31]. The shapes of the modes for PDC radiation change very little as the gain increases [32], therefore, the overlap can be reasonably high.

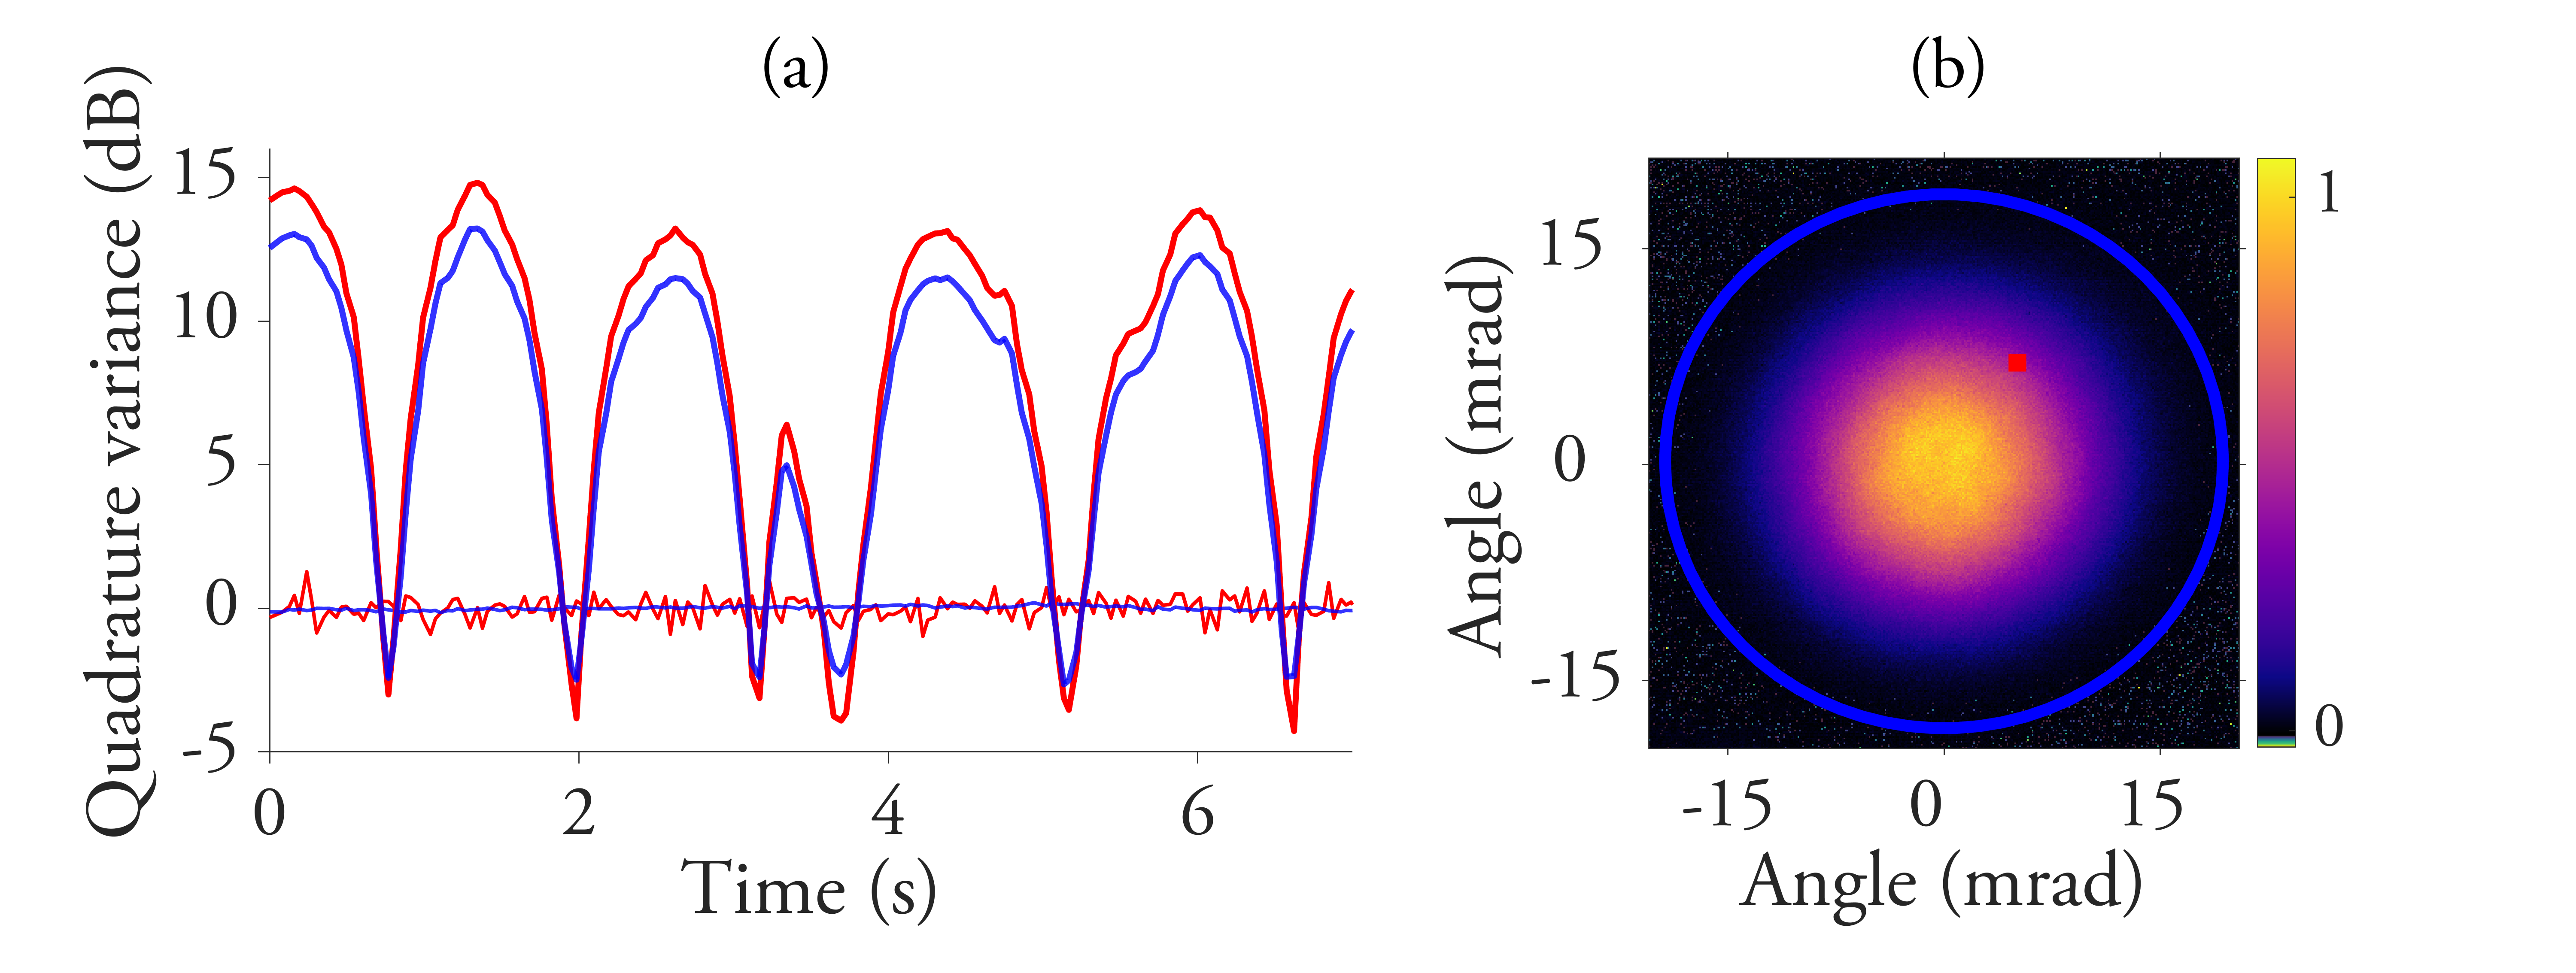
The level of amplification/de-amplification is measured by scanning the phase with a triangle-wave voltage applied to the PA and the result is shown in Fig. 3 (a). The measurement can be considered simultaneously for two different regions of interest (ROI) shown in panel (b): a single pixel (red) and the total frame (blue). The constant of Eq. 2 is obtained by blocking the radiation from the first pass at the curved mirror M1 (fluctuations are shown with the traces around zero). The small and large ROI give respectively the best squeezing level of dB, dB and the best anti-squeezing level of dB, dB. There is a good agreement between the anti-squeezing level (less sensitive to mode mismatch and losses) and the value expected from the independently measured gain . The measurement is made with the bandpass filter centered at nm, but the result is similar for nm.


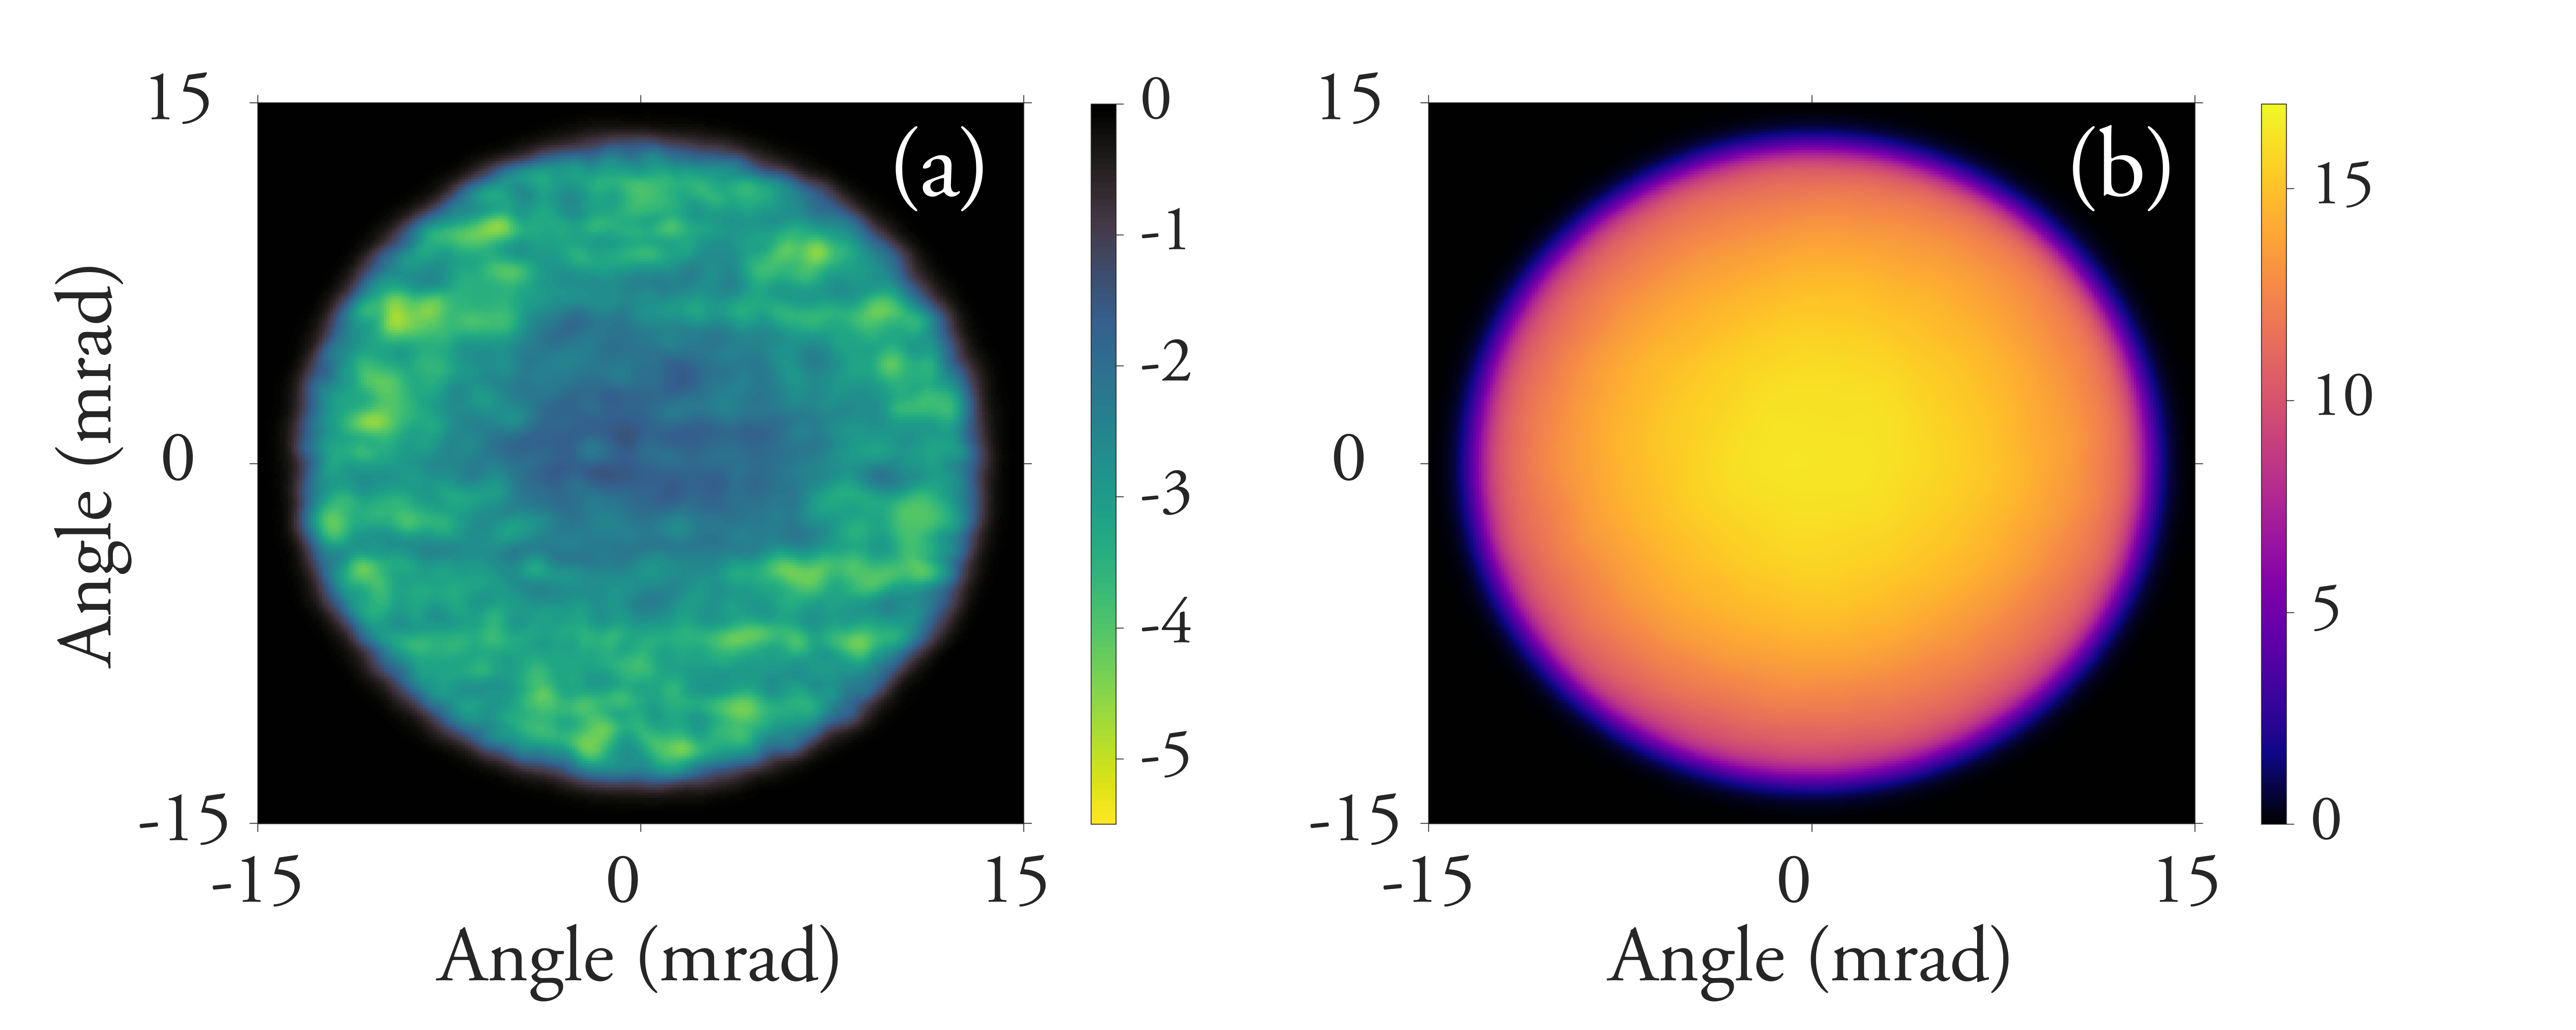
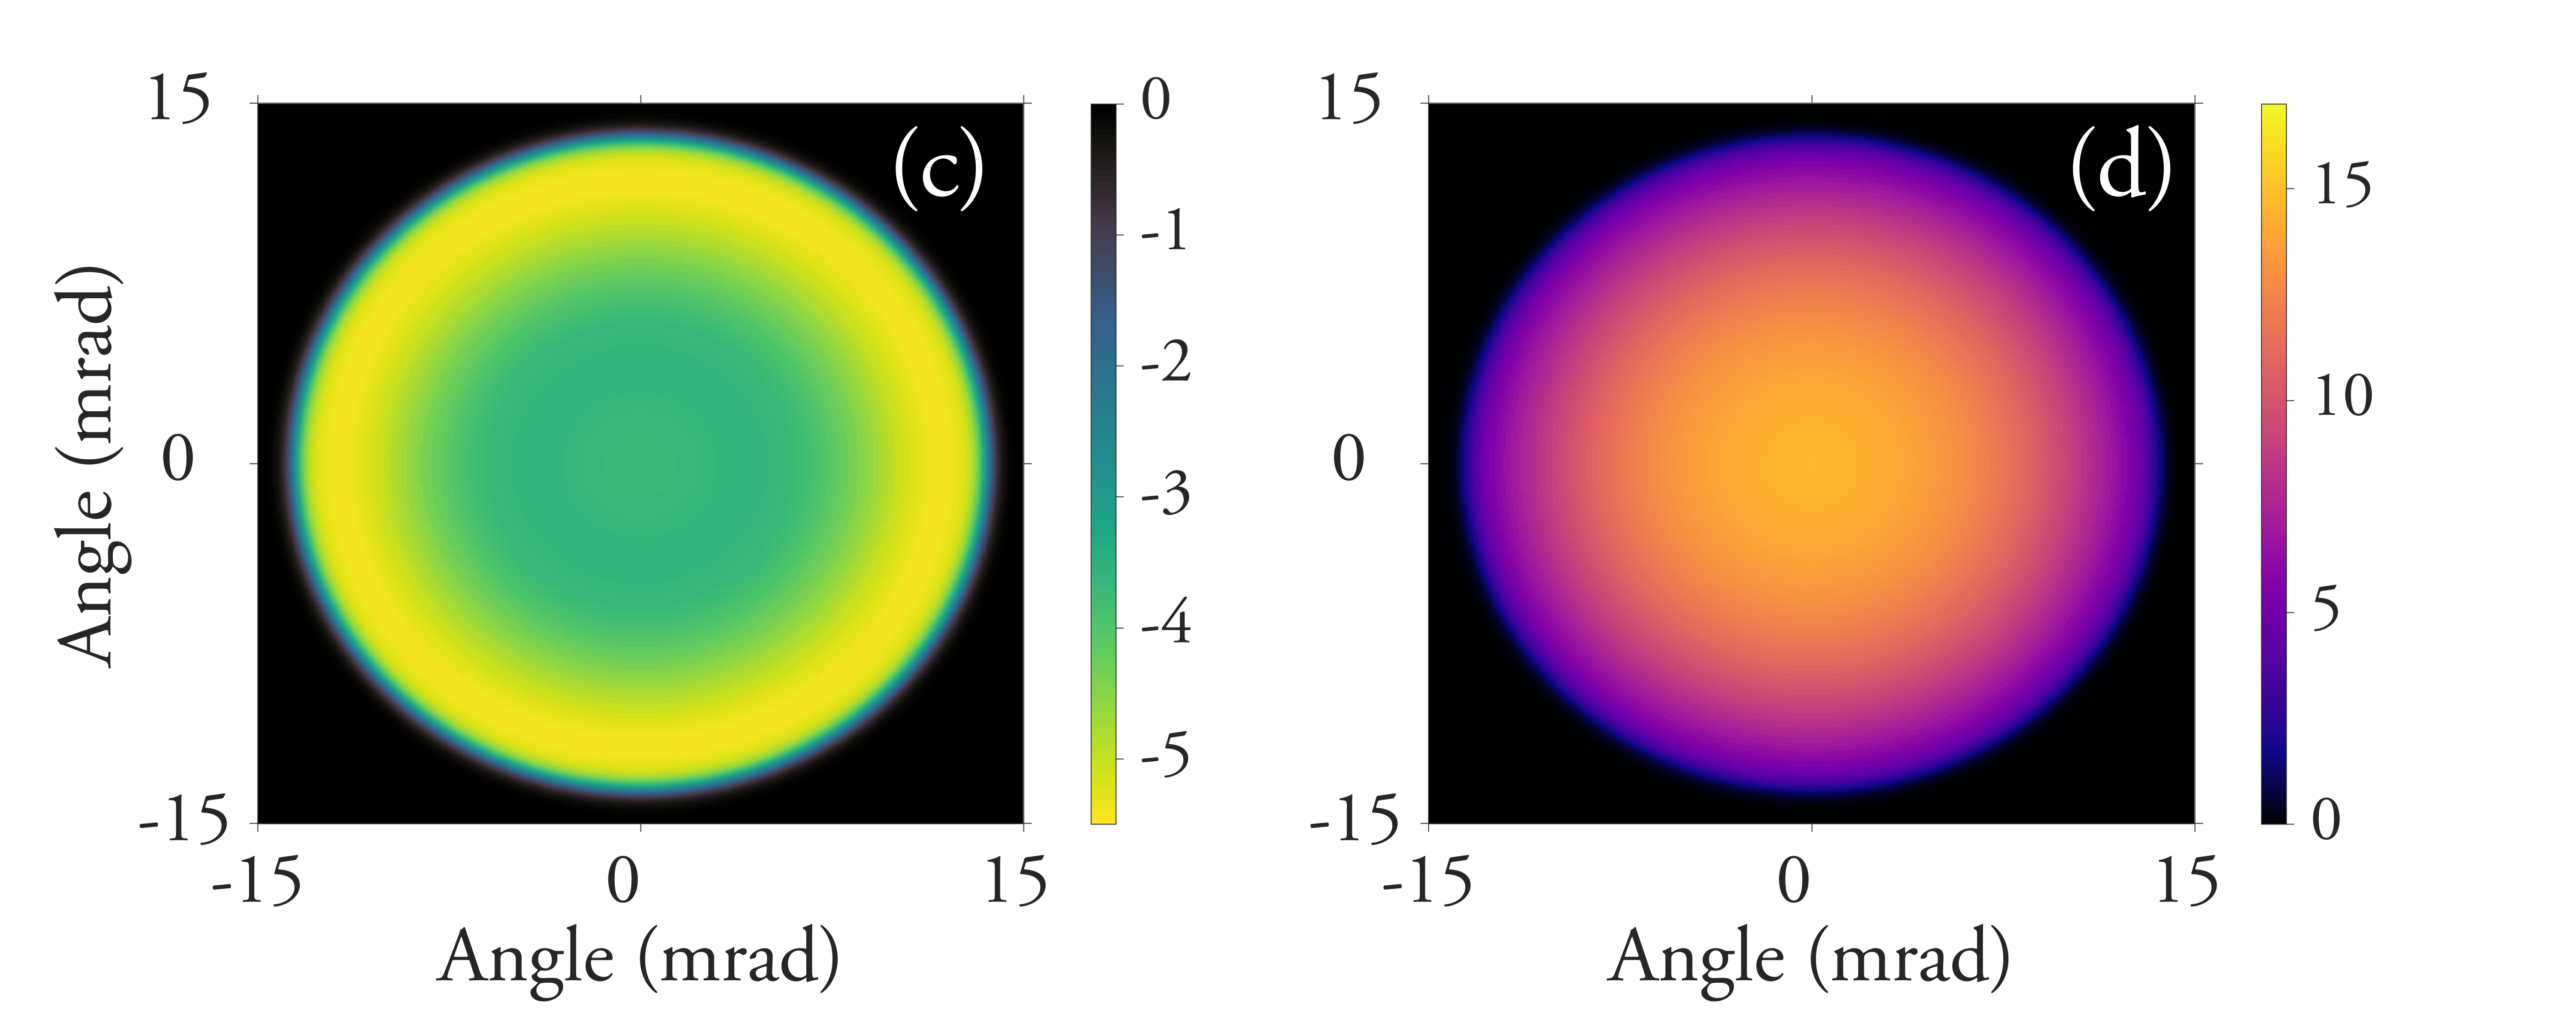
By considering every pixel of the CCD, we measure the quadrature variance for all plane-wave modes, as shown in Fig. 4. Panel (a) is the 2D distribution of the squeezing, while panel (b) shows the anti-squeezing. The sharp borders to zero are applied in both panels to remove artifacts caused by very low intensity. One should expect the distributions in Fig. 4 to be flat, but in our case, the slight difference in the phase-matching of PDC in the first and second passes leads to squeezing slightly changing towards the center. Indeed, the intensity distribution from the second pass is broader than the one from the first pass, because a slight misalignment of the pump beam at the mirror M2 modifies the phase-matching conditions. This effect leads to mode mismatch, which affects mainly the squeezing distribution. The theoretical simulation of this behaviour, shown in Fig. 4 (c) and (d) respectively for squeezing and anti-squeezing, is in good agreement with the experiment.
The wide-field interferometer can be expanded to place inside the interferometer an object, whose absorption or image can be detected with enhanced sub-shot-noise accuracy and tolerance to detection losses [21]. Further, the scheme presented here can be used in information processing as it provides a ‘quantum network’, i.e. a multimode (multipartite) quantum system, similarly to other realizations in space [33] and frequency [34]. Indeed, the multipartite entanglement depends on the allocation of the spatial modes specified by the user and should be readily available with the selection in the detection process. The important advantage introduced here is that detection losses do not contribute to the measurement of the quadrature noise. In our case, one could use a particular mode combination without worrying about the effect of losses and simulate a linear optical network with the change of basis.
In conclusion, we have constructed a spatially multimode interferometer by introducing a focusing component between the two OPAs. We have proved that the interferometer has the same multimode structure (around modes) as the phase changes. The quadrature noise for the radiation inside the interferometer has been proved to be below the shot noise (with the best squeezing level of dB), as required for the highly sensitive detection of phase shifts. The measurement of the 2D distribution of the amplification/de-amplification level for the plane-wave modes reveals the uniform amplification phase for the quadrature variance of such modes. Possible applications of such an interferometer are the detection of the disturbance in the OAM imparted by an object, imaging with sub-shot-noise precision, quantum information processing in a multidimensional space and quantum metrology in two dimensions.
Funding Information
We acknowledge financial support of the Russian Science Foundation Project No.19-42-04105 and of the Japan Society for the Promotion of Science, Overseas Challenge Program for Young Researchers.
See Supplement 1 for supporting content.
References
- [1] D. Li, C.-H. Yuan, Z. Y. Ou, and W. Zhang, \JournalTitleNew Journal of Physics 16, 073020 (2014).
- [2] F. Hudelist, J. Kong, C. Liu, J. Jing, Z. Y. Ou, and W. Zhang, \JournalTitleNature Communications 5, 3049 EP (2014).
- [3] M. V. Chekhova and Z. Y. Ou, \JournalTitleAdv. Opt. Photon. 8, 104 (2016).
- [4] S. Lemieux, M. Manceau, P. R. Sharapova, O. V. Tikhonova, R. W. Boyd, G. Leuchs, and M. V. Chekhova, \JournalTitlePhys. Rev. Lett. 117, 183601 (2016).
- [5] D. Linnemann, H. Strobel, W. Muessel, J. Schulz, R. J. Lewis-Swan, K. V. Kheruntsyan, and M. K. Oberthaler, \JournalTitlePhys. Rev. Lett. 117, 013001 (2016).
- [6] J. M. Lukens, N. A. Peters, and R. C. Pooser, \JournalTitleOpt. Lett. 41, 5438 (2016).
- [7] B. E. Anderson, P. Gupta, B. L. Schmittberger, T. Horrom, C. Hermann-Avigliano, K. M. Jones, and P. D. Lett, \JournalTitleOptica 4, 752 (2017).
- [8] Q.-K. Gong, X.-L. Hu, D. Li, C.-H. Yuan, Z. Y. Ou, and W. Zhang, \JournalTitlePhys. Rev. A 96, 033809 (2017).
- [9] M. Manceau, G. Leuchs, F. Khalili, and M. Chekhova, \JournalTitlePhys. Rev. Lett. 119, 223604 (2017).
- [10] W. Du, J. Jia, J. F. Chen, Z. Y. Ou, and W. Zhang, \JournalTitleOpt. Lett. 43, 1051 (2018).
- [11] J. Liu, S. Li, D. Wei, H. Gao, and F. Li, \JournalTitleJournal of Optics 20, 025201 (2018).
- [12] J. M. Lukens, R. C. Pooser, and N. A. Peters, \JournalTitleApplied Physics Letters 113, 091103 (2018).
- [13] Y. Liu, J. Li, L. Cui, N. Huo, S. M. Assad, X. Li, and Z. Y. Ou, \JournalTitleOpt. Express 26, 27705 (2018).
- [14] Y. Shaked, Y. Michael, R. Z. Vered, L. Bello, M. Rosenbluh, and A. Pe’er, \JournalTitleNature Communications 9, 609 (2018).
- [15] B. Yurke, S. L. McCall, and J. R. Klauder, \JournalTitlePhys. Rev. A 33, 4033 (1986).
- [16] C. Sparaciari, S. Olivares, and M. G. A. Paris, \JournalTitlePhys. Rev. A 93, 023810 (2016).
- [17] C. Gross, T. Zibold, E. Nicklas, J. Estève, and M. K. Oberthaler, \JournalTitleNature 464, 1165 (2010).
- [18] B. Chen, C. Qiu, S. Chen, J. Guo, L. Q. Chen, Z. Y. Ou, and W. Zhang, \JournalTitlePhys. Rev. Lett. 115, 043602 (2015).
- [19] M. Manceau, F. Khalili, and M. Chekhova, \JournalTitleNew Journal of Physics 19, 013014 (2017).
- [20] E. Giese, S. Lemieux, M. Manceau, R. Fickler, and R. W. Boyd, \JournalTitlePhys. Rev. A 96, 053863 (2017).
- [21] E. Knyazev, F. Y. Khalili, and M. V. Chekhova, \JournalTitleOpt. Express 27, 7868 (2019).
- [22] T. S. Iskhakov, A. M. Pérez, K. Y. Spasibko, M. V. Chekhova, and G. Leuchs, \JournalTitleOpt. Lett. 37, 1919 (2012).
- [23] L. Beltran, G. Frascella, A. M. Perez, R. Fickler, P. R. Sharapova, M. Manceau, O. V. Tikhonova, R. W. Boyd, G. Leuchs, and M. V. Chekhova, \JournalTitleJournal of Optics 19, 044005 (2017).
- [24] P. Sharapova, A. M. Pérez, O. V. Tikhonova, and M. V. Chekhova, \JournalTitlePhys. Rev. A 91, 043816 (2015).
- [25] R. V. Zakharov and O. V. Tikhonova, \JournalTitleLaser Physics Letters 15, 055205 (2018).
- [26] A. S. van de Nes, J. J. M. Braat, and S. F. Pereira, \JournalTitleReports on Progress in Physics 69, 2323 (2006).
- [27] G. Molina-Terriza, J. P. Torres, and L. Torner, \JournalTitleNature Physics 3, 305 EP (2007).
- [28] V. Boyer, A. M. Marino, R. C. Pooser, and P. D. Lett, \JournalTitleScience 321, 544 (2008).
- [29] R. S. Bennink and R. W. Boyd, \JournalTitlePhys. Rev. A 66, 053815 (2002).
- [30] C. S. Embrey, M. T. Turnbull, P. G. Petrov, and V. Boyer, \JournalTitlePhys. Rev. X 5, 031004 (2015).
- [31] W. Wasilewski, A. I. Lvovsky, K. Banaszek, and C. Radzewicz, \JournalTitlePhys. Rev. A 73, 063819 (2006).
- [32] P. Sharapova, G. Frascella, M. Riabinin, A. Perez, O. Tikhonova, S. Lemieux, R. Boyd, G. Leuchs, and M. Chekhova, \JournalTitlearXiv preprint arXiv:1905.10109 (2019).
- [33] S. Armstrong, J.-F. Morizur, J. Janousek, B. Hage, N. Treps, P. K. Lam, and H.-A. Bachor, \JournalTitleNature Communications 3, 1026 EP (2012).
- [34] Y. Cai, J. Roslund, G. Ferrini, F. Arzani, X. Xu, C. Fabre, and N. Treps, \JournalTitleNature Communications 8, 15645 EP (2017).
widefieldSu11