Feedback from supermassive black holes transforms centrals into passive galaxies by ejecting circumgalactic gas
Abstract
Davies et al. (2019) established that for galaxies the fraction of baryons in the circumgalactic medium (CGM) is inversely correlated with the mass of their central supermassive black holes (BHs) in the EAGLE hydrodynamic simulation. The interpretation is that, over time, a more massive BH has provided more energy to transport baryons beyond the virial radius, which additionally reduces gas accretion and star formation. We continue this research by focusing on the relationship between the 1) BH masses, 2) physical and observational properties of the CGM, and 3) galaxy colours for Milky Way-mass systems. The ratio of the cumulative BH feedback energy over the gaseous halo binding energy is a strong predictor of the CGM gas content, with BHs injecting the binding energy resulting in gas-poor haloes. Observable tracers of the CGM, including C iv, O vi, and H i absorption line measurements, are found to be effective tracers of the total CGM halo mass. We use high-cadence simulation outputs to demonstrate that BH feedback pushes baryons beyond the virial radius within Myr timescales, but that CGM metal tracers take longer ( Gyr) to respond. Secular evolution of galaxies results in blue, star-forming or red, passive populations depending on the cumulative feedback from BHs. The reddest quartile of galaxies with (median ) has a CGM mass that is lower than the bluest quartile (). We propose strategies for observing the predicted lower CGM column densities and covering fractions around galaxies hosting more massive BHs using the Cosmic Origins Spectrograph on Hubble.
keywords:
methods: numerical; galaxies: formation, intergalactic medium, supermassive black holes; cosmology: theory; quasars: absorption lines1 Introduction
Galaxies residing in Milky Way (MW)-mass haloes display great diversity. While the typical halo mass of hosts a central galaxy with a stellar mass of several times (e.g. Behroozi et al., 2013; Moster et al., 2013), the rate of present-day star formation (SF) varies by orders of magnitude (e.g. Somerville et al., 2008; Moustakas et al., 2013; Henriques et al., 2015). This is often discussed in terms of the “blue” SF cloud and the “red” passive sequence, and appears to indicate a process of galaxy transformation sometimes referred to as “quenching.” Revealing the process by which a galaxy’s star formation rate (SFR) is curtailed over a relatively narrow range of halo mass is a key motivation for exploring sophisticated models of galaxy formation and evolution, especially cosmologically-based hydrodynamic simulations that self-consistently follow the gas that fuels SF.
Cosmological hydrodynamic simulations that are now able to reproduce fundamental properties of galaxy populations and the morphological sequence of the Hubble Tuning Fork include EAGLE (Evolution and Assembly of GaLaxies and their Environments Schaye et al., 2015), Illustris-TNG (Pillepich et al., 2018), Horizon-AGN (Dubois et al., 2016), and MUFASA (Davé et al., 2016), the first of which we use here. Galaxy formation theory has long predicted a transition at the dark matter (DM) halo mass above which virial equilibrium achieves temperatures with lowered baryonic cooling efficiencies (Rees & Ostriker, 1977; Silk, 1977; White & Rees, 1978). Nevertheless, the cooling rate in gaseous haloes, now termed the circumgalactic medium (CGM), is over-efficient in forming stars compared to the stellar fraction observed in galaxies (White & Frenk, 1991; Balogh et al., 2001; Kereš et al., 2005). Simulations apply feedback mechanisms to reduce the efficiency of accretion onto and star formation within a galaxy to solve this over-cooling problem. Earlier hydrodynamic models applied forms of stellar superwind feedback to eject baryons from the galactic sites of star formation to overcome this over-cooling problem (Springel & Hernquist, 2003; Oppenheimer & Davé, 2006; Schaye et al., 2010). While these simulations often reproduced lower mass galaxy properties, their lack of feedback from super-massive black hole (BH) growth was considered a possible missing ingredient for preventing continued star formation and stellar assembly in galaxies at and above MW masses (e.g. Oppenheimer et al., 2010).
Since its earliest inclusions in cosmological models, BH feedback is required to become effective at the MW-mass scale to reproduce galaxy properties (e.g. Bower et al., 2006; Croton et al., 2006; Sijacki et al., 2007; Booth & Schaye, 2009). Hence, the halo mass at which cooling efficiencies decline is similar to the masses where significant BH feedback turns on. This may not be a coincidence as argued by Bower et al. (2017), who link the rapid phase of BH growth to the formation of a hot halo that prevents efficient ejective stellar feedback. Using the same EAGLE simulation we explore here, Bower et al. (2017) showed that buoyant thermal stellar feedback becomes inefficient upon the formation of a hot halo at halo mass , concentrating gas in the centre where it triggers non-linear BH growth and feedback. The BH feedback imparted to the surrounding halo effectively curtails star formation and can transition the galaxy from the blue cloud to the red sequence.
As already discussed, the central galaxies hosted by MW-mass haloes have diverse SFRs, colours, morphologies, and BH masses, . Davies et al. (2019, hereafter D19) used EAGLE to show that the diversity extends to their gaseous haloes with the primary astrophysical driver being , which can be thought of as proportional to the integral of BH feedback energy imparted over its growth history. The rapid BH growth phase during which multiplies by factors of several over a small fraction of the Hubble timescale, also clears out a significant fraction of the baryons in the CGM. D19 demonstrated that the scatter in gaseous baryon fractions, , at a given halo mass is highly anti-correlated with , indicating a causal relation between and . This conclusion was confirmed by comparing to a simulation without AGN feedback. They also showed that the greatest scatter of in EAGLE occurs at halo masses , where is the mass within a sphere within which the mean internal density is the critical overdensity. Following D19, we define
| (1) |
where indicates the radius of a spherical mass distribution. Here, includes all CGM gas regardless of temperature, but excludes ISM gas, which is in contrast with D19 and leads to only a small decrease. D19 also showed that is highly correlated with SFR, which they argue is a result of the BH removing CGM gas that provides fuel for further SF.
is not directly obtainable for galactic haloes with current observational facilities. While D19 determined that soft X-ray emission and thermal Sunyaev-Zel’dovich (S-Z) measurements serve as effective indicators of the baryon fraction within haloes, X-ray (e.g. Bogdán et al., 2013; Li et al., 2017) and S-Z (Planck Collaboration et al., 2013; Greco et al., 2015) measurements for a statistically significant sample of MW-mass galaxies are beyond the capabilities of current instrumentation. In contrast, the UV probes of the CGM afforded by the Cosmic Origins Spectrograph (COS) on the Hubble Space Telescope provide a growing database of gaseous halo measurements that can be correlated with galaxy properties (e.g. Stocke et al., 2013; Tumlinson et al., 2013; Burchett et al., 2015; Tumlinson et al., 2017). Studies that combine gas column density measurements from UV absorption-line spectra with ionization modelling have estimated for galaxies with M200 1012M⊙ to range from 25 - 100%, albeit subject to large systematic uncertainties (e.g. Werk et al., 2014; Prochaska et al., 2017). Our goal is to identify a more sensitive, empirical indicator of the baryonic content of gaseous haloes around nearby galaxies, for which we can also obtain an estimate of .
D19 demonstrated that it is the integral of BH feedback, not the instantaneous BH feedback, that ultimately ejects baryons beyond . Specifically, while strongly anti-correlates with , it does not correlate at a significant level with the BH accretion rate at . This is supported by the observational result that COS sightlines intersecting haloes hosting low-redshift AGN show little if any effect on CGM ion column densities (Berg et al., 2018).
Another of our goals is to explore the relations and timescales between BH feedback and the clearing of the gas from the CGM. We leverage high-cadence EAGLE “snipshot” outputs that track galaxies, BHs, and CGM absorption signatures on Myr timescales. Correa et al. (2019) used the same snipshots to determine a causal link between AGN activity and the transition of a central galaxy’s colour from the blue cloud into the “green valley” of intermediate galaxy colours, and to the red sequence (see also Trayford et al., 2016). We extend this type of investigation to the CGM to determine how rapidly baryons within respond, as well as UV absorption line indicators of .
The final goal of this study is to connect the baryonic content of the CGM to the processes by which a galaxy becomes a part of the red sequence or remains in the blue cloud. From the strong correlation between and galactic SFR (D19), we expect a galaxy’s colour to also change in response to the BH. Therefore we use the SKIRT radiative transfer scheme (Camps & Baes, 2015) that applies dust-reddening to EAGLE galaxies (Trayford et al., 2017) to consider the following questions: Can rapid BH growth not only lift the CGM, but change the colour of a galaxy by curtailing the fuel supply for SF? Is the CGM of a red galaxy substantially more diffuse and less massive than that of a blue galaxy in the MW halo mass range? What is the relationship between a galaxy’s colour, its CGM content probed in the UV, and its central BH?
The paper is laid out as follows. We introduce the EAGLE simulation, define our galaxy samples, and describe the methods to calculate physical and observational quantities in §2. In §3, we revisit the work of D19 linking the CGM gas fraction to and introduce the ratio of BH feedback energy relative to the binding energy of the CGM. We then discuss available UV indicators for , highlighting C iv covering fractions, around galaxies in the local Universe in §4. We access high-cadence outputs to track the CGM in response to the central BH in §5 and integrate galaxy colours into the analysis in §6. We discuss how the O vi ion traces the CGM baryon content in §7.1, how the efficiency of BH feedback determines galaxy properties in §7.2, and consider our Galaxy’s BH and CGM in §7.3. We summarize in §8.
2 Simulations
2.1 The EAGLE simulation and black hole energetics
We use the main EAGLE “Reference” simulation volume that is 100 comoving Mpc on a side, referred to as Ref-L100N1504. This DM and smooth particle hydrodynamic (SPH) particle run uses a heavily modified version of the N-body/Hydrodynamical code Gadget-3 (last described in Springel, 2005). The DM particle masses are and the initial SPH particle masses are . The simulation was originally published by Schaye et al. (2015) and Crain et al. (2015) (see McAlpine et al., 2016; Camps et al., 2018, for the public release). EAGLE applies the pressure-entropy SPH formulation of Hopkins (2013) with a series of additional SPH implementations referred to as ANARCHY (see Appendix A of Schaye et al., 2015). EAGLE assumes a Planck Collaboration et al. (2013) cosmology (, , , ).
The EAGLE code applies a number of subgrid physics modules, which include radiative cooling (Wiersma et al., 2009a), star formation (Schaye & Dalla Vecchia, 2008), stellar evolution and metal enrichment (Wiersma et al., 2009b), BH formation and accretion (Booth & Schaye, 2009; Schaye et al., 2015; Rosas-Guevara et al., 2016), stellar feedback (Dalla Vecchia & Schaye, 2012), and BH feedback (Booth & Schaye, 2009). The stellar and BH feedback schemes both use thermal prescriptions where the imparted feedback energy heats local SPH particles. The calibration of these schemes is described in Crain et al. (2015).
The BH (AGN) feedback scheme is critically important for our calculations of BH feedback energy. As in Springel et al. (2005), EAGLE follows BHs from seed particles that have an initial mass of , where . BH seeds are placed at the centre of every halo that exceeds . As described in Schaye et al. (2015), BH particles grow both by mergers with other BH particles and through gas accretion. The growth rate of a BH due to gas accretion is , where is the gas accretion rate based on the Bondi & Hoyle (1944) rate and , the radiative efficiency of the accretion disk, is assumed to be . The energy feedback rate imparted to the surrounding gas particles is where the thermal feedback efficiency (the other 85% is assumed to be radiated away with no coupling to the surrounding gas). Hence, we calculate a BH energy feedback efficiency based on the BH mass using
| (2) |
which translates to 1.67% of the rest mass of the BH with being the speed of light. Although seed particles do not contribute to the feedback energy in the above equation, their contributions to the mass assembly are small (e.g. Booth & Schaye, 2009), since the final mass of BHs in MW mass galaxies by is typically .
2.2 Central galaxy samples
We focus on a subset of MW-mass central galaxies. Our main sample is referred to as the “” sample, which has in haloes with and contains 514 galaxies in the comoving Mpc3 volume. These objects show great diversity in , , and SFR (D19, their fig. 2). We also consider all central galaxies that have regardless of in the “” sample, containing 1106 galaxies, because an observational determination of is often unavailable. We will show that this sample, which additionally contains 342 (250) galaxies with () , often produces similar trends as the sample.
Finally, we identify a sample of secularly evolving galaxies have not experienced a major merger since at least according to the EAGLE merger trees calculated from the snapshots between and . A major merger is defined as at least a 3:1 ratio merger with another galaxy of at least . This “secular” sample contains 246 galaxies. While this sample represents a biased sample of galaxies, these galaxies are used for high-cadence tracking with up to “snipshot” outputs going back to to capture the influence of the black hole on the galaxy and its CGM. This work is similar to Correa et al. (2019) who used snipshot outputs to determine the timescale of galaxy transformation to the red sequence, but our investigation focuses on our refined subset of galaxies and considers their CGM properties.
2.3 Descriptions of physical and observational quantities
2.3.1 Black hole masses
We report BH masses as that of the most massive BH within 50 kpc of the galaxy centre. Other black holes exist in the haloes, but their mass is usually far smaller than that of the central black hole in these haloes where one galaxy dominates the stellar mass. We also track for our secular sample at high time cadence in §5, where we correlate changes in with CGM properties. While we do not filter this sample for major BH mergers, we expect the BH growth for the secular sample to be dominated by gas accretion, given that we filter out galaxy (and their associated BH) major mergers by definition of this sample.
2.3.2 Absorber column densities
Ion column densities are calculated by projecting SPH particles onto a two-dimensional map as described by, e.g., Oppenheimer et al. (2018). Ionization fractions for a range of species, including H i, C iv, and O vi are calculated using CLOUDY-calculated lookup tables as a function of density, temperature, and redshift. Calculations assume ionization equilibrium, and include collisional ionization and photo-ionization from the time-evolving Haardt & Madau (2001) background that was also used for the calibration of the cooling rates during the simulation. We use the self-shielding prescription of Rahmati et al. (2013) for H i column densities, although this does not affect our covering fraction calculations. We include gas only within a radius of from the centre of the galaxy, which separates out contamination from the CGM of neighbouring galaxies (e.g. Oppenheimer et al., 2018). Three perpendicular projections are used to calculate covering fractions.
2.3.3 Galaxy colours
We use the SKIRT radiative transfer dust-attenuated colours, which are available in the data release of Camps et al. (2018). We use the Sloan Digital Sky Survey (SDSS) and -band absolute magnitudes to calculate colours for a random orientation of each galaxy. We report colours back to , using their rest-frame colours.
3 The dependence of the CGM on the central black hole
We begin this section by casting the large-scale physical parameters of galactic haloes in terms of integrated feedback energies compared to gaseous halo binding energies, and then focus on the variety of CGM and galactic properties of MW-mass haloes. We also discuss energy budgets of stellar and BH feedback in terms of CGM gas fractions.
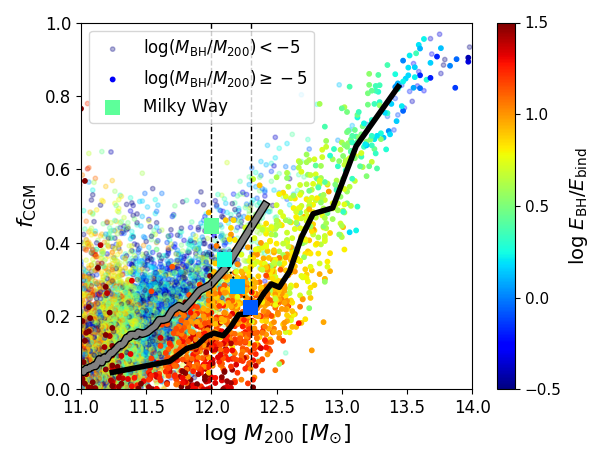
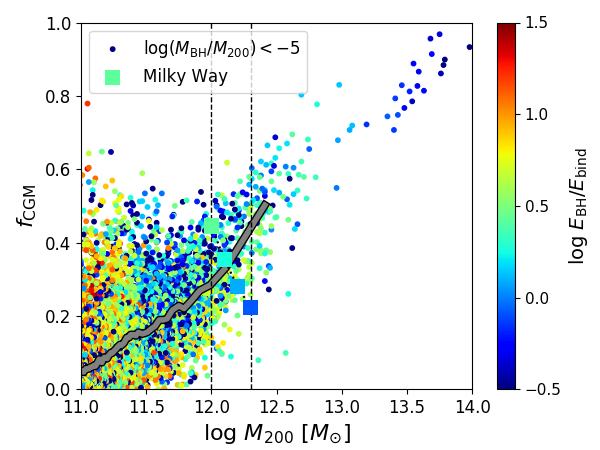
Figure 1 plots as a function of . This was the central plot in D19 (their Figs. 1 and 2), where they coloured the data points by the scatter in other parameters, finding a strong anti-correlation between and at fixed . In the left panel, we colour our data points by the ratio of the integrated feedback energy from the central BH, from Equation 2, to an estimate of the binding energy of the gaseous halo , where
| (3) |
and is the gravitational constant. Note that our is not the “intrinsic” binding energy of the halo used by D19, which was directly calculated from a paired DM-only simulation, but an approximation of the energy necessary to unbind a gaseous halo, hence the term. We use opaque (faded) circles to indicate whether is greater (less) than . The black line shows the running median value for the opaque points, while the grey line indicates the median for faded points having higher gas fractions. The nearly vertical colour gradient of opaque points indicates depends on at when . We bracket the haloes, because this slice shows the greatest diversity in , which we will later argue is related to the diverse set of galactic properties of their centrals.
In the left panel, the data points are difficult to see because they are underplotted, which is why we plot these haloes alone in the right panel. These haloes do not show a clear dependence of on , suggesting that BH feedback becomes efficient at ejecting CGM only above for MW-mass haloes, i.e. , as shown by Bower et al. (2017).
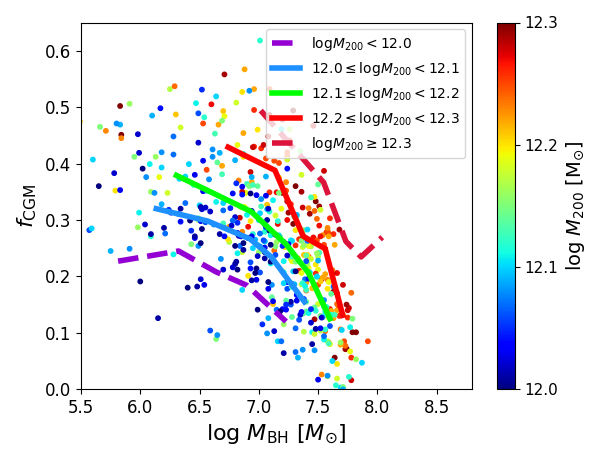
We now focus on our sample, showing data points of against in the left panel of Figure 2, where the three solid lines indicate running medians for -dex bins. We expand this analysis to the sample showing dashed lines for and . The link between and is muddled without knowledge of , because a small change in halo mass results in a different .
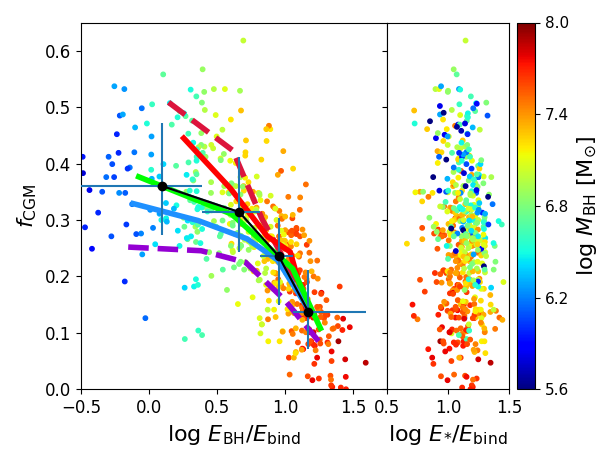
The right panel of Fig. 2 considers the halo potential, by plotting as a function in the left subpanel. The running medians for the same five halo mass bins show much more overlap than in the left panel, which indicates that CGM ejection depends on the ability of the integrated black hole energy to overcome the binding energy of the halo. is a more fundamental scaling that controls for the halo mass dependence of gravitational potential depth. The colour scale of the data points indicates closely tracks this quantity with the only difference being the in the denominator. Four quartiles are indicated by black dots with x-axis error bars indicating ranges and y-axis error bars indicating dispersions of for each quartile. These quartiles define our samples discussed starting in §5.
The running medians diverge at small , which indicates that more massive haloes with low-mass black holes retain more baryons. This suggests that stellar feedback likely plays a larger role in clearing lower mass haloes than AGN feedback. We consider the ratio of (right subpanel), where is the estimated integrated feedback energy from stars defined as
| (4) |
with erg represents the feedback energy return per unit mass of star formation as calculated by Crain et al. (2015). The values for usually exceed and are higher than the binding energy of the halo for the sample. Unlike for , there is not an obvious trend, although the values are limited to a smaller range by the definition of the sample’s stellar mass range.
Stellar feedback, which heats gas particles to K in EAGLE, is less efficient at clearing out the CGM than BH feedback. Stellar feedback leads to gas buoyantly rising into the CGM (e.g. Bower et al., 2017; Oppenheimer, 2018), but this gas often cools and recycles back onto the galaxy. This indicates a fundamental distinction with BH feedback, which delivers more energy per heating event. is delivered more steadily than , and a greater fraction of this energy is lost to radiative cooling. Stellar feedback materials can be cycled through a sequence of superwind outflows, re-accretion onto the galaxy, and further star formation and outflows in a sequence often termed the “baryon cycle.” The feedback, which heats gas to K, does not suffer as much radiative losses. Therefore, BH feedback can disrupt or at least significantly alter this baryon cycle by curtailing the supply of re-accreting gas available in the CGM.
4 Observational indicators of the CGM baryon fraction
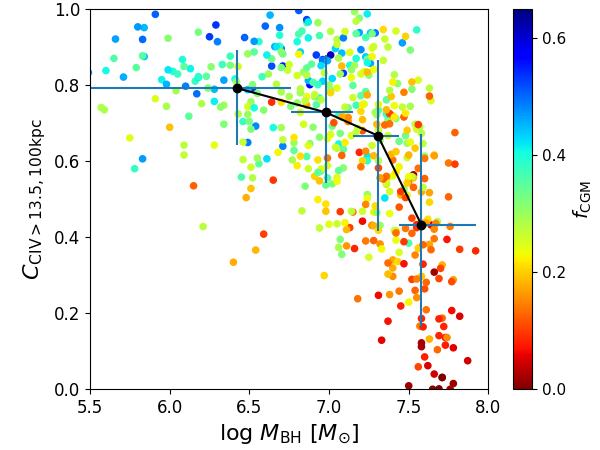
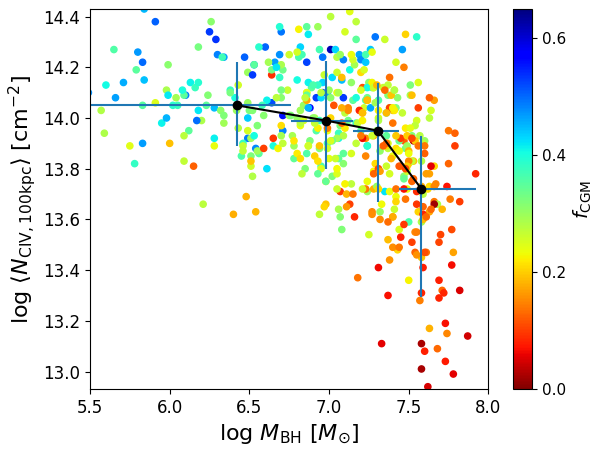
We have argued for a link between two physical quantities: the energy released by the BH relative to the halo binding energy and the fraction of a halo’s baryons in the CGM. While direct measurements of these quantities are impossible to obtain, we focus here on the latter quantity– observational proxies for the CGM baryon fraction accessible with current instrumentation. Before continuing, we note that we do not attempt to find observational proxies for beyond assuming a linear proportionality to . Because the very few existing measurements of for galaxies are all in the local Universe (Kormendy & Ho, 2013), we require that our proxy is also locally available.
We calculate median CGM observational measurements across four quartiles of in the sample to determine how each relates to . The median value of the lowest (highest) quartile of is () , where (). We consider several ions commonly observed with COS, including H i, C iv, and O vi. Our favoured proxy is the C iv covering fraction of absorbers with column densities within a circle of radius 100 kpc () plotted as a function of in Figure 3, left panel. We find that this quantity declines by nearly a factor of two from a median with scatter of to from the lowest to highest quartile in EAGLE. There are three main lines of reasoning we use in evaluating the different ions.
The first reason we favour C iv is because the 1548, 1551 Å doublet is available via COS in the very local Universe () and has been observed in many existing COS surveys, (e.g. Liang & Chen, 2014; Bordoloi et al., 2014; Borthakur et al., 2015; Burchett et al., 2015; Berg et al., 2018). These previous samples of galaxy-QSO pairs that cover C iv within the inner CGM (R 100 kpc) of galaxy haloes amount to approximately 90 sightlines in total. Future archival surveys of COS data combined with deep galaxy spectroscopic redshifts, including the CGM2 Survey (led by J. Werk), will expand the total number of sightlines within 100 kpc covering C iv at by at least a factor of two. We select as the column density threshold because this value is easily detectable in existing UV spectra probing the CGM. For reference, it corresponds to an equivalent width of mÅ for the strong line of the doublet at 1548 Å, which is detectable at 3 in a S/N COS sightline using the G160M grating.
The second reason we choose is that its decline mirrors for physically meaningful reasons. C iv is a tracer of metals for temperatures K and densities at (e.g. Schaye et al., 2003; Oppenheimer & Davé, 2006; Davé & Oppenheimer, 2007; Ford et al., 2013; Rahmati et al., 2016). C iv is photo-ionized by the UV background at K for lower densities and collisionally ionized at K for higher densities, but these two regimes are relatively close to each other in density-temperature phase space, which we argue make C iv a good tracer of a well-defined region of the phase space of the diffuse CGM. This ion still misses the majority of the CGM baryons, which typically have K and in MW-mass haloes.
A third reason for is that its decline in covering fraction roughly follows its decline in mean CGM column density within 100 kpc (Fig 3, right panel). The log declines from to from the lowest to highest quartiles. The similar decline in and (i.e. a factor of ) indicates that C iv is an effective tracer of the diffuse CGM.
The global C iv column density distributions reported in EAGLE (Rahmati et al., 2016) show reasonable agreement with observational surveys (Cooksey et al., 2010; Burchett et al., 2015; Danforth et al., 2016). For the CGM, EAGLE shows very good agreement for C iv observed around star-forming galaxies (Turner et al., 2017), but a comparison between and low- EAGLE galaxies has yet to be published. Chen et al. (2001) and Liang & Chen (2014) observe strong C iv inside 100 kpc for galaxies in the mass range, followed by a rather steep decline beyond kpc. Bordoloi et al. (2014) and Burchett et al. (2016) studied C iv in the haloes of galaxies over a wider mass range, finding similarly declining profiles. We note here that the average C iv profiles around low- galaxies reported in Oppenheimer et al. (2018) appear consistent with observations, and that the measurements by Burchett et al. (2016) for inside 100 kpc (their figs. 3 & 5) are in the range of values in Fig. 3.
We list CGM measures for the lowest and highest quartiles in Table 1, where we also consider O vi and H i values repeating our three lines of reasoning used for C iv. The O vi 1032, 1038 Å doublet is not locally available via COS; however the readily detectable covering fraction, , shows a significant decline, which is matched by a decline in indicating it is an effective tracer of the diffuse CGM. We discuss the prospects and interpretation of O vi further in §7.1.
H i is detected ubiquitously in the CGM of local galaxies via the 1216 Å Ly transition (e.g. Tumlinson et al., 2013; Borthakur et al., 2015; Keeney et al., 2017). While we find is a good metric for separating the lowest and highest quartiles in Table 1, becomes saturated in Ly. Furthermore, is 3-4 orders of magnitude higher than this limit, which implies a highly clumpy CGM tracer where most H i arises from gas with a small filling factor (Ford et al., 2014, Horton et al. in prep).
| Metric1 | Low | High | Difference |
| log | 6.42 | 7.58 | 1.16 dex |
| -0.39 dex | |||
| -0.26 dex | |||
| log | 14.05 | 13.72 | -0.33 dex |
| -0.40 dex | |||
| log | 14.03 | 13.67 | -0.36 dex |
| -0.29 dex | |||
| log | 18.76 | 17.92 | -0.84 dex |
| log | 19.84 | 19.55 | -0.29 dex |
| log | 16.27 | 15.87 | -0.40 dex |
| 12+log (O/H)100kpc | 8.43 | 8.32 | -0.11 dex |
1 Median values of all haloes in each quartile reported. One- scatter reported for halo covering factions.
Finally, we discuss the use of covering fractions calculated from a kpc cylinder to determine the baryon content of a sphere (). We calculate mean hydrogen and oxygen column densities using the cylinder and report median CGM and where we excise the ISM (any gas particles with non-zero SFR) for the quartiles in Table 1. declines by dex while declines by dex with increasing , which nicely reflects the decline in as well as C iv and O vi covering fraction indicators. We can also calculate the CGM metallicity, which declines by dex from to . Although the CGM metallicity declines as increases, it is a smaller decrease than the decline of baryons within the CGM and smaller than the baryons in a cylinder extending to on either side of the galaxy. We also check CGM metallicity excluding gas, and find the same decline in metallicity, with shifted by dex. The geometrical effect of tracing baryons in a 100 kpc radius cylinder versus a sphere of radius manifests itself in the respective values of versus , where the former declines by approximately one third less, because baryons pushed out beyond remain in the cylinder along one dimension.
5 The evolution of the CGM and central black holes
One of our central goals of this work is to catch the process of baryon ejection from the CGM in the act and determine if it is a direct result of BH feedback. To do this, we use the rich dataset of EAGLE snipshot outputs that follow galaxies, BHs, and the CGM in up to 155 outputs between and for our secular sample comprised of 246 galaxies. Figure 4 shows examples of the evolution of a blue, star-forming galaxy (left) and a red, passive (right) galaxy residing in similar mass haloes (), resulting in similar mass galaxies (). The plotting begins when exceeds . We also list the final colours in the upper panels.
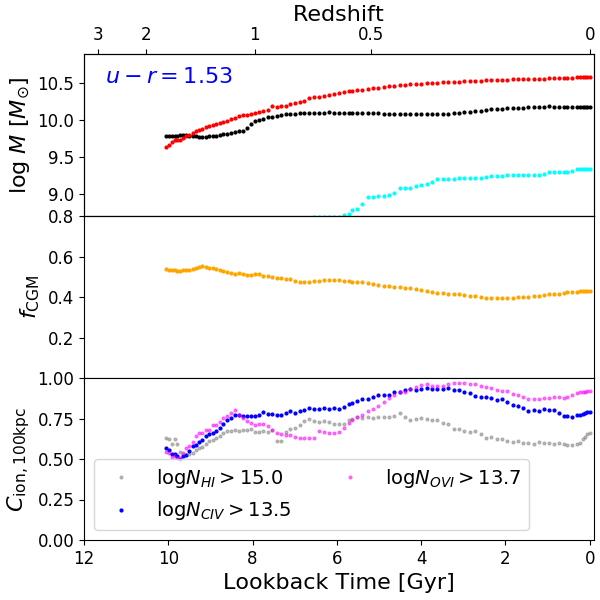
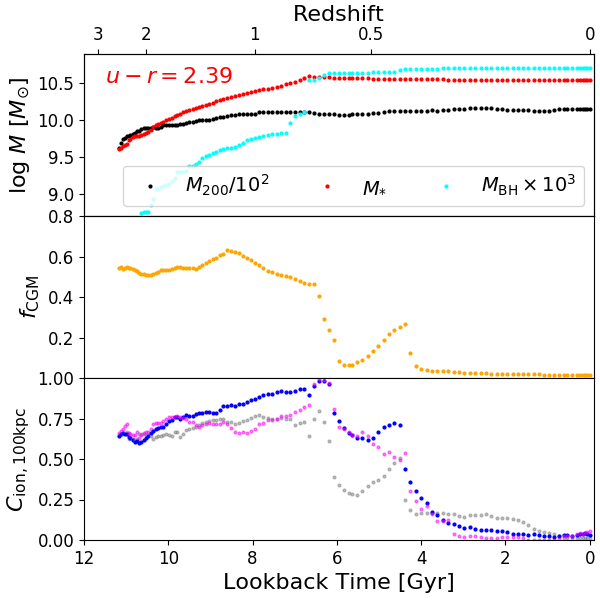
The upper panels show the halo mass (black), the stellar mass inside an aperture of 30 kpc (red), and the central BH mass (cyan), where the latter are selected to be very different ( vs. ). We have chosen examples in the lowest and highest quartiles of to focus on how rapid BH growth and the associated feedback transform the CGM, which for the right galaxy begins soon after . The middle panels show , which is relatively flat and slightly declining for the blue galaxy, but sharply dips for the eventual red galaxy first at as the BH grows by , and then again at as another episode of rapid BH growth increases the mass by .
The lower panels show the time-evolving C iv covering fractions in blue mirroring the decline in . The evolution of is due to several effects including 1) the metal enrichment of the CGM, 2) the changing ionization field assuming a Haardt & Madau (2001) background, and 3) the growth of the , which is smaller than 100 physical kpc at high- and more than twice as large at . We also show O vi and H i covering fractions within 100 kpc for these haloes in the lower panel, which also both respond to the rapid BH growth episodes for the passive galaxy.
Instead of focusing on two examples, we plot all galaxies in the secular sample in the lowest and highest quartiles of in Figure 5. Individual galaxies are shown with thin lines, but we show the median for each sample along with 16-84% shaded spreads. All galaxies (61 in each sample) are tracked back to (vertical dotted line), though the sample thins out at earlier times as lower mass galaxies fall out of the sample if . Additionally, major mergers can occur in our sample at this epoch, which also contributes to the sawtooth behaviour as new lower mass galaxies join the sample at snapshot outputs corresponding to 1.737, 2.012, 2.237, 2.478, 3.017, 3.528, and so on. Even though we identify galaxies between and without major mergers using 13 snapshots, mergers can slip into our sample when examining high-cadence snipshots, though at a level that does not alter the conclusions we draw.
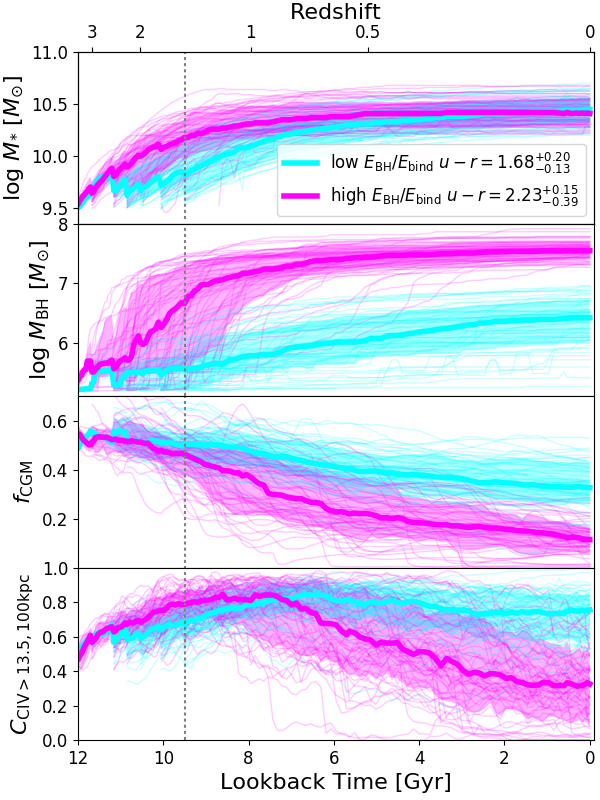
The stellar populations of the highest haloes assemble earlier than their lowest counterparts, resulting in a population of galaxies with much less late-time growth and redder colours ( vs. ). It is crucial to avoid the impression that these two sets of haloes are the same but for their BH masses, because D19 demonstrated that the haloes with higher mass BHs have 1) earlier formation times, 2) higher concentrations, and 3) greater intrinsic binding energies (calculated particle-by-particle using a matched DM-only simulation that is devoid of baryonic effects). Over the last 9.5 Gyr of evolution, the high- haloes increase their stellar masses by from , while the low- haloes increase from , a factor of more. Hence, while we are focusing on secular evolution, our two sets of haloes have fundamentally different evolutionary histories, which D19 emphasize by showing the counter-intuitive relationship that more tightly bound haloes end up with more evacuated CGMs through greater integrated BH feedback.
The second panel in Fig. 5 following central BH masses shows two very different tracks by design of our two samples. The BH masses are near the seed mass at for both samples, but the high- haloes have the highest rate of growth at . The medians jump around at as new galaxies are added to the sample, but some of the individual time histories of the low- haloes in cyan move up then down as more massive BHs can temporarily pass within 50 kpc of the galaxy. No BH masses overlap between the two samples at (by sample construction) and the median BH masses are versus .
Next we consider the evolution of the CGM, starting with , which begins just above and declines with time for both samples to their values ( versus ), which agree closely with the values reported for the two quartiles of the sample (Fig. 2, right panel). The CGM fractions appear to respond to the growth of with the greatest change in the high- haloes occurring at epochs around .
The C iv covering fraction (Fig. 5, lower panel) also shows a response to BH growth, but it appears delayed relative to for the high- haloes as declines between and . To better track how baryon clearing is linked to the BH, we shift a set of the high- time histories to the snipshot interval with the largest total BH growth, . Figure 6 plots these shifted time histories for galaxies with BH growth episodes at least between snipshots separated by Myr and at to allow at least 5 Gyr of subsequent evolution. The sample contains 31 galaxies, although the trends we now discuss are only slightly weaker if we include the other 30 galaxies.
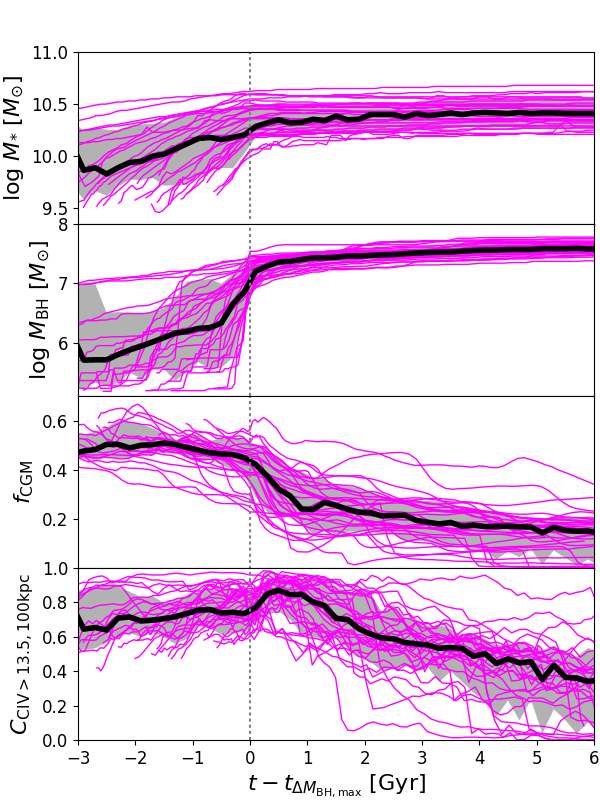
Very little stellar assembly occurs after (upper panel) as the galaxy’s essentially flatlines in response to the biggest BH growth episode in the galaxy’s history (second panel). The average increases by roughly -fold in the preceding 500 Myr, though our sample is not uniform further back as can occur at high redshifts with little further history. We see a clear decline in (third panel) at indicating that there is indeed a causal link with BH growth. This significant growth episode of the BH leads to a reduction of by a factor of nearly two (from to ) within 1 Gyr. This is the most clear indication that an active, rapid BH growth episode can clear much of the CGM.
However, as expected from Fig. 5, does not respond as dramatically to the BH growth, and in fact first jumps up from to in the 500 Myr after the BH growth episode. Despite the initial bump, the covering fraction has fallen to by Gyr. While we argue C iv is a good proxy for in §4, the pathway to get there is complicated. increases in response to BH feedback before declining, while declines straight away.
To disentangle the connection between BH growth, , and our covering fraction tracers, we apply a time series analysis where we correlate all tracked BH growth on inter-snipshot intervals ( Myr) with any change in CGM properties. For each halo time history in the high- secular sample, we calculate a series of Pearson correlation coefficients, , between and the change in either or a covering fraction using all available snipshots. If we take the time series of and calculate its with the time series, we expect a negative value if the BH nearly immediately ejects baryons from the CGM. This is seen in Figure 7 when we consider the correlation with at (thick orange line intersecting with vertical dotted grey line), which shows the mean for all high- haloes. This data point alone does not necessarily indicate that the current BH growth episode is responsible for the decline in , because BH growth episodes are clustered in time (Fig. 6) and previous BH feedback could drive baryons out of the CGM.
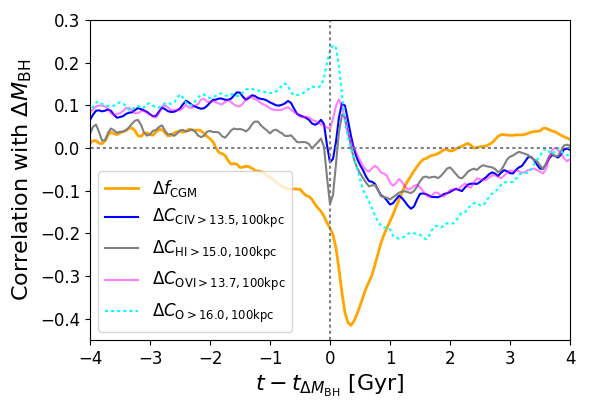
We wish to identify the evolution in the correlation between CGM quantities and BH growth, therefore we apply time lag shifts of a CGM quantity time series relative to the BH growth time series, and plot a series of correlation coefficients as a function of time lag in Fig. 7. For example, the curves crossing at Gyr indicate the correlation of the change in CGM quantities with the BH growth activity 1 Gyr earlier. We plot the mean values of all haloes at each time lag creating a continuous line, demonstrating the typical time-evolving relationship between a CGM variable and the BH growth. The time lag evolution of the correlation between and value reaches its nadir 300 Myr after , indicating that CGM ejection peaks at this timescale after BH growth. In fact, the correlation coefficient becomes sharply more negative right after indicating an immediate acceleration of baryon ejection, likely through shocks propagating through the CGM at supersonic speeds. The overall sharp dip in the orange line is the clearest indication that EAGLE BHs are responsible for ejecting their CGMs in short order ( Myr). The negative values before are due to BH growth episodes (AGN activity) being clustered in time. The absolute values of are less important than the relative values, but given that most values are very small, the mean Pearson at Myr is very strong.
We apply the same time series analysis to the covering fractions focusing on (solid blue line). The response to the the BH growth is more complicated. was growing before indicating CGM metal enrichment, but does respond with a sharp drop at . Yet, jumps up at 200 Myr, before turning around and declining after 400 Myr. The greatest decline of is between 500 Myr and 2.5 Gyr, showing a delayed response to the CGM ejection.
We also see the same general behaviour for and , but at differing strengths immediately after . While it is very clear that decreases in response to the BH, the three different ions have responses that depend on metallicity and ionization. To marginalise out ionization, we plot the total oxygen covering fraction above , (dotted cyan), in Fig. 7, which shows a rapid increase around due to enrichment of the CGM by AGN feedback, which ejects metal-rich ISM into the CGM. The enrichment continues but at a sharply decreasing rate until becomes negative after 300 Myr and remains negative for the next 3 Gyr. Hence, the decline in ions in this time interval is indicative of declining CGM metal content. Finally, we note that the dip at visible for the ion covering fraction is not present for , which indicates that the initial dip seen for the ions is due to AGN feedback changing the ionization state of the gas (likely via temporary heating of lower ions to higher states).
The trends here are general for all 246 galaxies of the secular sample, which show the same trends in average correlation coefficients, but on average rd as strong when adding in the three quartiles of galaxies with lower .
6 Galaxy transformation as a result of CGM ejection
The final goal of our exploration is to understand how the galaxy as a whole responds to CGM ejection driven by the black hole, since D19 demonstrated that SFR is highly correlated with at fixed halo mass. We report SKIRT radiative transfer-processed colours (Trayford et al., 2017), because it furthers our goal of providing the most readily available observable proxies. The colours are observed for local galaxies in the Sloan Digital Sky Survey.
We show our sample by plotting as a function of in Figure 8, which shows just how dependent galaxy colour is on CGM baryon content. The lowest (highest) quartile of galaxies with () have median (). Galaxy colours depend on their CGM baryon content, which we have argued relies on the BH ejecting baryons. Hence, the content of the CGM out to at least 200 kpc is a predictor of galaxy colour according to EAGLE. The dark points with error bars are shown for the sample (), but we also show the trend for all galaxies in the sample in grey points and error bars to show the result is nearly same when considering all central galaxies with .
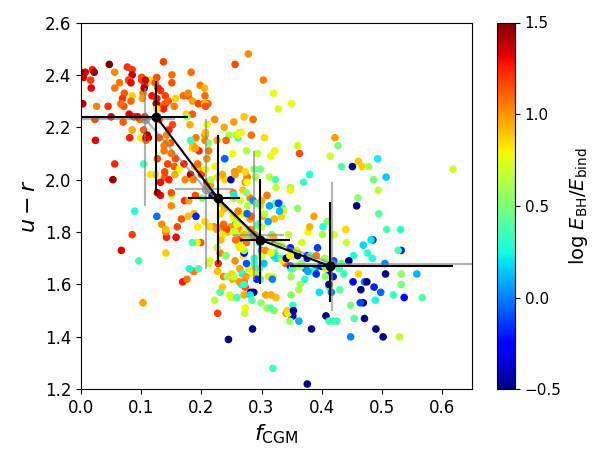
We argue that the result in Fig. 8 represents a new way to think about the origin of galaxy colours. Put another way, the bluest (reddest) quartile of galaxies with () have () according to EAGLE. For a more in-depth analysis of how red sequence galaxy colours arise in EAGLE, we refer the reader to Correa et al. (2019), who used the same snipshots to determine the timescale and cause of galaxies crossing the green valley to the red sequence (see also Wright et al., 2018). They looked at both centrals and satellites, and integrated high-cadence colour and morphology tracking considering environmental effects, AGN feedback, and morphological transformation as pathways for all red sequence galaxies above . The most relevant result for us is their calculation of the time between the last time a red sequence galaxy entered the green valley and the peak black hole growth timestep, . Their Figure 10 shows a practically instantaneous process ( Gyr centred on Gyr) of a central galaxy entering the green valley in response to the largest BH growth phase in a galaxy’s history. This agrees with our finding that the gas supply from the CGM is also disrupted nearly instantaneously through baryon clearing as shown in Figs. 6 and 7. Davies et al. (in prep) will consider the physical mechanisms of BH feedback impacting the CGM and transforming galaxy colours and SFRs.
We plot the median colour- evolutionary paths of the four quartiles of the secular sample sorted by in Figure 9. The paths are fundamentally different between the lowest and highest quartiles, for which we plot the individual values in cyan and magenta, respectively. First, the highest haloes, which predominantly end up on the red sequence, show a divergence in colour from the other three paths going back to . These galaxies are predominantly morphologically elliptical (Correa et al., 2017), have their most intense black hole growth stages centred at (Fig. 5), and form their stellar populations earlier at the centres of haloes that collapsed earlier (D19).
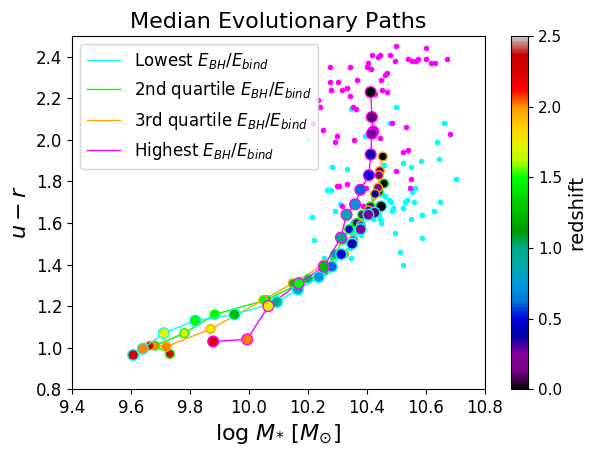
Second, the other three quartiles have comparatively similar median evolutionary paths resulting in colours that overlap more with the blue cloud. This is despite the fact that that each quartile of has progressively lower values for . This indicates that secular AGN transformation to the red sequence requires a threshold energy of for EAGLE MW-like haloes.
Finally, there exists significant scatter in colours across the different quartiles, which is also apparent in Figure 8. Even though colour is strongly correlated with BH feedback history, colours alone are not a direct predictor of the central black hole mass. We have not considered morphology, larger-scale environment, nor major mergers for our galaxies, which are essential for describing all pathways of galaxy transformation. We are also avoiding the use of dust-free, intrinsic colours, which while not directly observable would reduce the scatter and produce clearer trends compared to our use of colours that include the effects of dust (Trayford et al., 2016).
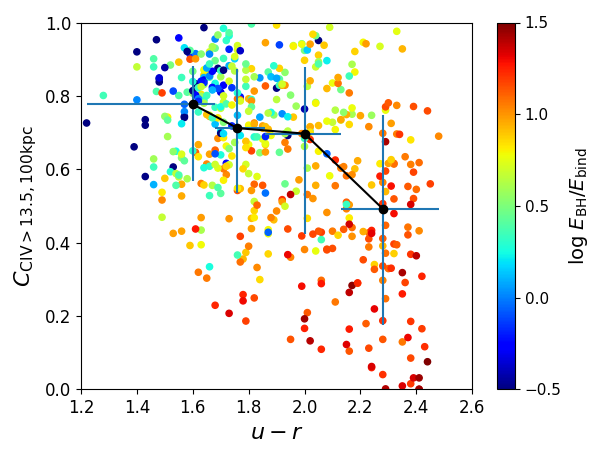
Our approach is to provide the most direct observables to create a plot like Figure 10 using observed galaxy-absorber pairs. Using the same format as Fig. 3, we show points coloured by and medians with spreads on and ranges for the sample. These two galaxy-CGM observables shows a weaker correlation than a similar plot with replacing (Fig. 3). The point of showing this plot is that 1) it can be created by combining existing observations (Burchett et al., 2015) with future archival COS surveys (CGM2, which would rely on using galaxies up to ), and 2) we predict that obtaining will result in a tighter correlation than colour. We are hopeful that the predicted link between the BH and the CGM can be tested in the near future by collecting C iv sight lines around nearby galaxies for which determinations exist.
7 Discussion
7.1 How O vi traces the CGM
In §4 we argued that C iv is the most promising proxy for . In this section we discuss O vi as a sensitive probe of CGM baryon content even if this ion is not currently locally available via COS. Considerable debate has emerged on the nature and origin of O vi in the COS-Halos Survey after it was shown to be strong around blue, star-forming and weaker around red, passive galaxies (Tumlinson et al., 2011). Oppenheimer et al. (2016) used EAGLE zooms to argue that O vi declined around passive galaxies, not due to baryon ejection, but instead owing to the ionization effect of these galaxies living in much more massive haloes () with virial temperatures K. Nelson et al. (2018b) used the Illustris-TNG simulations with an updated BH feedback scheme (Weinberger et al., 2017) to show that O vi is reduced significantly by BH feedback in the halo mass regime. Illustris-TNG also shows a stark decline in , falling from to for centrals with to (Nelson et al., 2018b, their fig. 20(ii)), which indicates baryon ejection by the BH.
Given that we are using the main EAGLE simulation, which shows the same trends as the zooms (Oppenheimer et al., 2016), we know that O vi declines for multiple reasons: BH feedback evacuating the halo (D19; this paper) at and the virial temperature effect at higher halo masses (Oppenheimer et al., 2016). For EAGLE, median increases monotonically with halo mass, while median declines as a function of increasing halo mass over the mass range in Illustris-TNG (Pillepich et al., 2018, their fig. 4, measured at a smaller radius). This indicates that BH ejection is not as aggressive in EAGLE, but it is still enough of a factor to reduce significantly at fixed halo mass. A COS observational survey targeting C iv or O vi around star-forming and passive galaxies at fixed halo mass could better isolate the effect of BH evacuation of the CGM. It remains unclear if COS-Halos passive galaxies live in similar mass haloes as their star-forming counterparts, but the passive galaxy stellar masses are mostly higher than (Werk et al., 2012).
7.2 Consequences of black hole feedback efficiency
The energy efficiency of BH feedback has important consequences for a galaxy and its CGM. In EAGLE, the efficiency of the conversion of rest-mass energy of material accreting onto the BH to feedback energy is (Booth & Schaye, 2009). The Illustris-TNG simulations use a two-mode BH feedback scheme where their thermal mode has and is used for high accretion rates, but their kinetic mode has and is used for low accretion rates (Weinberger et al., 2017). The kinetic mode operates primarily at later times and for later growth of the BH, and represents high efficiency jet feedback, which appears to be responsible for reducing O vi and for passive haloes in Illustris-TNG (Nelson et al., 2018b). The ROMULUS25 simulation uses a thermal BH feedback scheme with much lower efficiency, (Tremmel et al., 2017). Sanchez et al. (2018) demonstrated that the addition of BH feedback increases CGM metal enrichment, likely because it is not powerful enough to clear the CGM of baryons (their fig. 9), and may have more dynamical similarities to EAGLE’s stellar feedback scheme.
Galaxy colours for both the EAGLE and Illustris-TNG 100 Mpc volumes show good agreement with observational data, but there are inherent differences. The EAGLE SKIRT dust-processed colours, which we use in our analysis, display a colour bimodality for galaxies with slightly more blue peak galaxies than observed (Trayford et al., 2017, their fig. 7). The Illustris-TNG colours, applying ‘resolved’ dust attenuation based on the neutral gas and metal distributions within galaxies, display a colour bimodality with slightly more red peak galaxies for massive galaxies than observed (Nelson et al., 2018a, their fig. 1). The red colours of Illustris-TNG galaxies are likely more attributable to efficient BH feedback, while the red colours for EAGLE galaxies are likely more influenced by dust effects. The ROMULUS25 volume is far smaller, but it appears that their passive galaxy fraction is lower than for EAGLE and Illustris-TNG (Sanchez et al., 2018, fig. 1). Taken together, the feedback efficiency of the BH central engine appears to be linked to both the CGM gas content and the galaxy’s stellar assembly and colour across multiple simulations.
7.3 The Milky Way CGM-black hole connection
The most recent estimates of the MW halo mass are closer to (e.g. Eadie & Jurić, 2018), though we consider the range of possibilities to be (e.g. Battaglia et al., 2005). Sgr A* has a mass of (Boehle et al., 2016), which puts our galaxy below and suggests it is most similar to galaxies in the lowest quartile. We use the Bregman et al. (2018) estimates for the total CGM mass, and assume their values of and , and plot the MW’s for four assumed halo masses in Figure 1. The MW’s gaseous halo appears to agree with the EAGLE model, especially if its is indeed closer to than . The MW contains an under-massive BH and a higher compared to average MW-mass haloes. Further constraints on the MW CGM mass, especially its hot component at larger radii, will allow more accurate explorations of our halo’s BH-CGM link. While halo gas fractions of clusters appear over-estimated by the EAGLE model (Barnes et al., 2017, C-EAGLE), the gas fractions of MW-mass haloes are observationally unconstrained.
Our results suggest that the MW may be on the precipice of an epoch of rapid BH growth and CGM evacuation. Using the sequence that Bower et al. (2017) derived from EAGLE, the growth of the hot halo leads to a reduction in the efficiency of feedback from star formation. Ineffective stellar feedback results in gas collecting near the galaxy centre, leading to rapid BH growth and AGN feedback (see also Dubois et al., 2015; Anglés-Alcázar et al., 2017), which we argue can eject a large fraction of the baryons from our halo. However, it must be realised that similar mass haloes with massive BHs underwent the stage of rapid BH growth at much higher redshift, and that the MW halo is not interchangeable with a halo of the same mass hosting a passive galaxy. D19 showed that high- haloes had earlier formation times than low- haloes. This is also interesting for the MW, because metal abundance patterns of the MW disc (Mackereth et al., 2018) and the MW globular cluster age-metallicity distribution (Kruijssen et al., 2018) suggest an earlier formation history than typical disc galaxies occupying haloes. Combined with the later formation times implied by its under-massive BH, the MW system could be atypical.
8 Summary
We analyse the largest EAGLE simulation to understand how the baryonic content of Milky Way (MW)-mass galaxy haloes reacts to the growth of their central supermassive black holes and how the resulting evolution transforms the galaxies. Our investigation leverages the high-cadence tracking of a large sample of simulated galaxies to catch the act of “baryon lifting” where the BH feedback energy can eject most of the circumgalactic baryons from the halo and transform the galaxy across the green valley to the red sequence. We argue that the key physical quantity is the time integral of the total energy released by the BH divided by the binding energy of the gaseous halo (). We attempt to relate these physical characteristics to accessible observational proxies of 1) the cumulative BH feedback energy, through , 2) the gaseous content of the CGM, through ion column densities and covering fractions, and 3) the star formation history of the galaxy, through colours.
This work is an extension of Davies et al. (2019) who identified as being highly anti-correlated with the halo gas fractions, , in EAGLE. Here, we mainly focus on present-day -mass galaxies () residing in MW-mass haloes () that show a great diversity not only in galaxy colours, but also in and . The main results of our investigation connecting the scales of BHs, galaxies, and the CGM are as follows:
- •
-
•
We explore covering fractions for several ions observable (by COS), including H i, C iv, and O vi, and argue that the covering fraction within 100 kpc of the galaxy, , is most easily obtainable for local galaxies where BH mass estimates are most readily available. mirrors the trend of and declines from to from the lowest to the highest quartile. O vi is also an effective proxy, but is not locally available with COS. (§4, Fig. 3)
-
•
High-cadence tracking of a subset of our galaxies indicates a causal link between and . responds to BH growth on a cosmologically very short, Myr, timescale. Ion covering fractions take longer to decline in response to episodes of BH growth ( Gyr), which is in part due to AGN-driven metal transport from the ISM to the CGM. (§5, Figs. 5, 6, 7)
-
•
The colours, calculated using the SKIRT radiative transfer dust-reddening model, have values of and for the highest and lowest quartiles. Hence, haloes having undergone significant secular BH growth are more likely to be red sequence galaxies while their low- counterparts likely remain in the blue cloud. However, the significant dispersion in values indicates that alone is not a good predictor of colour. (§6, Figs. 8, 9, 10)
-
•
The MW itself has a low ratio, calculated using the mass of Sgr A*, which would indicate that it should have a high for its halo mass. Estimates for the observed gas mass of the MW, while highly uncertain (e.g. Bregman et al., 2018), suggest that it retains more gas than the average halo if its is . (Fig. 1)
-
•
Although the time-integrated stellar feedback energy released is greater than the BH feedback released in most EAGLE MW-like haloes, the more gradual release of stellar energy to the CGM does not clear the halo, but maintains a cycle of accretion, feedback, and re-accretion as the galaxy evolves along the star-forming sequence. The energy release due to rapid growth of the BH can disrupt and fundamentally change the cycle of baryons between the CGM and galaxies, leaving lasting impacts on both.
We put forth that a fundamental pathway for secular galaxy transformation involves a three-step sequence: 1) the formation of a hot halo, 2) the rapid growth of the BH, and 3) the lifting by AGN feedback of the baryonic halo curtailing the supply of fuel for star formation. The first two of these processes were linked in EAGLE by Bower et al. (2017), who argued that the hot halo prevents effective SF feedback from buoyantly rising into the CGM, leading to increased accretion onto and rapid growth of the central BH. Davies et al. (2019) revealed the inverse correlation between and in EAGLE, suggesting a causal link between the BH and the removal of a significant portion of the gas from the halo, which reduces CGM accretion and galactic star formation. We uncover this causal link in a set of galaxies that rapidly grow their BHs, eject baryons from their haloes, and transform their colours.
Our analysis contends that the efficiency with which a BH couples its feedback energy to the CGM is essential for understanding the process of secular galaxy transformation. The relationship between a galaxy’s stellar assembly, its halo gas supply, and its central BH should be a focus of CGM-oriented studies going forward. We emphasise the need for observational campaigns targeting local galaxies, where non-AGN BH masses and dynamical halo masses are or will become available.
acknowledgements
The authors would like to thank Akos Bogdan, Lars Hernquist, Ian McCarthy, Dylan Nelson, Erica Nelson, Nicole Sanchez, John Stocke, and Rainer Weinberger for stimulating conversations and exchanges that contributed to this manuscript. Support for BDO was provided through the NASA ATP grant NNX16AB31G and NASA Hubble grant HST-AR-14308. JJD acknowledges an STFC doctoral studentship. RAC is a Royal Society University Research Fellow. JKW acknowledges support from a 2018 Sloan Foundation Fellowship. The study made use of high performance computing facilities at Liverpool John Moores University, partly funded by the Royal Society and LJMU’s Faculty of Engineering and Technology, and the DiRAC Data Centric system at Durham University, managed by the Institute for Computational Cosmology on behalf of the STFC DiRAC HPC Facility (http://www.dirac.ac.uk). This equipment was funded by BEIS capital funding via STFC capital grants ST/K00042X/1, ST/P002293/1, ST/R002371/1 and ST/S002502/1, Durham University and STFC operations grant ST/R000832/1. DiRAC is part of the National e-Infrastructure.
References
- Anglés-Alcázar et al. (2017) Anglés-Alcázar D., Faucher-Giguère C.-A., Quataert E., Hopkins P. F., Feldmann R., Torrey P., Wetzel A., Kereš D., 2017, MNRAS, 472, L109
- Balogh et al. (2001) Balogh M. L., Pearce F. R., Bower R. G., Kay S. T., 2001, MNRAS, 326, 1228
- Barnes et al. (2017) Barnes D. J., et al., 2017, MNRAS, 471, 1088
- Battaglia et al. (2005) Battaglia G., et al., 2005, MNRAS, 364, 433
- Behroozi et al. (2013) Behroozi P. S., Wechsler R. H., Conroy C., 2013, ApJ, 770, 57
- Berg et al. (2018) Berg T. A. M., Ellison S. L., Tumlinson J., Oppenheimer B. D., Horton R., Bordoloi R., Schaye J., 2018, MNRAS, 478, 3890
- Boehle et al. (2016) Boehle A., et al., 2016, ApJ, 830, 17
- Bogdán et al. (2013) Bogdán Á., et al., 2013, ApJ, 772, 97
- Bondi & Hoyle (1944) Bondi H., Hoyle F., 1944, MNRAS, 104, 273
- Booth & Schaye (2009) Booth C. M., Schaye J., 2009, MNRAS, 398, 53
- Bordoloi et al. (2014) Bordoloi R., et al., 2014, ApJ, 796, 136
- Borthakur et al. (2015) Borthakur S., et al., 2015, ApJ, 813, 46
- Bower et al. (2006) Bower R. G., Benson A. J., Malbon R., Helly J. C., Frenk C. S., Baugh C. M., Cole S., Lacey C. G., 2006, MNRAS, 370, 645
- Bower et al. (2017) Bower R. G., Schaye J., Frenk C. S., Theuns T., Schaller M., Crain R. A., McAlpine S., 2017, MNRAS, 465, 32
- Bregman et al. (2018) Bregman J. N., Anderson M. E., Miller M. J., Hodges-Kluck E., Dai X., Li J.-T., Li Y., Qu Z., 2018, ApJ, 862, 3
- Burchett et al. (2015) Burchett J. N., et al., 2015, ApJ, 815, 91
- Burchett et al. (2016) Burchett J. N., et al., 2016, ApJ, 832, 124
- Camps & Baes (2015) Camps P., Baes M., 2015, Astronomy and Computing, 9, 20
- Camps et al. (2018) Camps P., et al., 2018, ApJS, 234, 20
- Chen et al. (2001) Chen H.-W., Lanzetta K. M., Webb J. K., 2001, ApJ, 556, 158
- Cooksey et al. (2010) Cooksey K. L., Thom C., Prochaska J. X., Chen H.-W., 2010, ApJ, 708, 868
- Correa et al. (2017) Correa C. A., Schaye J., Clauwens B., Bower R. G., Crain R. A., Schaller M., Theuns T., Thob A. C. R., 2017, MNRAS, 472, L45
- Correa et al. (2019) Correa C. A., Schaye J., Trayford J. W., 2019, MNRAS, 484, 4401
- Crain et al. (2015) Crain R. A., et al., 2015, MNRAS, 450, 1937
- Croton et al. (2006) Croton D. J., et al., 2006, MNRAS, 365, 11
- Dalla Vecchia & Schaye (2012) Dalla Vecchia C., Schaye J., 2012, MNRAS, 426, 140
- Danforth et al. (2016) Danforth C. W., et al., 2016, ApJ, 817, 111
- Davé & Oppenheimer (2007) Davé R., Oppenheimer B. D., 2007, MNRAS, 374, 427
- Davé et al. (2016) Davé R., Thompson R., Hopkins P. F., 2016, MNRAS, 462, 3265
- Davies et al. (2019) Davies J. J., Crain R. A., McCarthy I. G., Oppenheimer B. D., Schaye J., Schaller M., McAlpine S., 2019, MNRAS, 485, 3783
- Dubois et al. (2015) Dubois Y., Volonteri M., Silk J., Devriendt J., Slyz A., Teyssier R., 2015, MNRAS, 452, 1502
- Dubois et al. (2016) Dubois Y., Peirani S., Pichon C., Devriendt J., Gavazzi R., Welker C., Volonteri M., 2016, MNRAS, 463, 3948
- Eadie & Jurić (2018) Eadie G., Jurić M., 2018, arXiv e-prints,
- Ford et al. (2013) Ford A. B., Oppenheimer B. D., Davé R., Katz N., Kollmeier J. A., Weinberg D. H., 2013, MNRAS, 432, 89
- Ford et al. (2014) Ford A. B., Davé R., Oppenheimer B. D., Katz N., Kollmeier J. A., Thompson R., Weinberg D. H., 2014, MNRAS, 444, 1260
- Greco et al. (2015) Greco J. P., Hill J. C., Spergel D. N., Battaglia N., 2015, ApJ, 808, 151
- Haardt & Madau (2001) Haardt F., Madau P., 2001, in Neumann D. M., Tran J. T. V., eds, Clusters of Galaxies and the High Redshift Universe Observed in X-rays. p. 64 (arXiv:astro-ph/0106018)
- Henriques et al. (2015) Henriques B. M. B., White S. D. M., Thomas P. A., Angulo R., Guo Q., Lemson G., Springel V., Overzier R., 2015, MNRAS, 451, 2663
- Hopkins (2013) Hopkins P. F., 2013, MNRAS, 428, 2840
- Keeney et al. (2017) Keeney B. A., et al., 2017, ApJS, 230, 6
- Kereš et al. (2005) Kereš D., Katz N., Weinberg D. H., Davé R., 2005, MNRAS, 363, 2
- Kormendy & Ho (2013) Kormendy J., Ho L. C., 2013, ARA&A, 51, 511
- Kruijssen et al. (2018) Kruijssen J. M. D., Pfeffer J. L., Reina-Campos M., Crain R. A., Bastian N., 2018, MNRAS,
- Li et al. (2017) Li J.-T., Bregman J. N., Wang Q. D., Crain R. A., Anderson M. E., Zhang S., 2017, ApJS, 233, 20
- Liang & Chen (2014) Liang C. J., Chen H.-W., 2014, MNRAS, 445, 2061
- Mackereth et al. (2018) Mackereth J. T., Crain R. A., Schiavon R. P., Schaye J., Theuns T., Schaller M., 2018, MNRAS, 477, 5072
- McAlpine et al. (2016) McAlpine S., et al., 2016, Astronomy and Computing, 15, 72
- Moster et al. (2013) Moster B. P., Naab T., White S. D. M., 2013, MNRAS, 428, 3121
- Moustakas et al. (2013) Moustakas J., et al., 2013, ApJ, 767, 50
- Nelson et al. (2018a) Nelson D., et al., 2018a, MNRAS, 475, 624
- Nelson et al. (2018b) Nelson D., et al., 2018b, MNRAS, 477, 450
- Oppenheimer (2018) Oppenheimer B. D., 2018, MNRAS, 480, 2963
- Oppenheimer & Davé (2006) Oppenheimer B. D., Davé R., 2006, MNRAS, 373, 1265
- Oppenheimer et al. (2010) Oppenheimer B. D., Davé R., Kereš D., Fardal M., Katz N., Kollmeier J. A., Weinberg D. H., 2010, MNRAS, 406, 2325
- Oppenheimer et al. (2016) Oppenheimer B. D., et al., 2016, MNRAS, 460, 2157
- Oppenheimer et al. (2018) Oppenheimer B. D., Schaye J., Crain R. A., Werk J. K., Richings A. J., 2018, MNRAS, 481, 835
- Pillepich et al. (2018) Pillepich A., et al., 2018, MNRAS, 473, 4077
- Planck Collaboration et al. (2013) Planck Collaboration et al., 2013, A&A, 557, A52
- Prochaska et al. (2017) Prochaska J. X., et al., 2017, ApJ, 837, 169
- Rahmati et al. (2013) Rahmati A., Pawlik A. H., Raičević M., Schaye J., 2013, MNRAS, 430, 2427
- Rahmati et al. (2016) Rahmati A., Schaye J., Crain R. A., Oppenheimer B. D., Schaller M., Theuns T., 2016, MNRAS, 459, 310
- Rees & Ostriker (1977) Rees M. J., Ostriker J. P., 1977, MNRAS, 179, 541
- Rosas-Guevara et al. (2016) Rosas-Guevara Y., Bower R. G., Schaye J., McAlpine S., Dalla Vecchia C., Frenk C. S., Schaller M., Theuns T., 2016, MNRAS, 462, 190
- Sanchez et al. (2018) Sanchez N. N., Werk J. K., Tremmel M., Pontzen A., Christensen C., Quinn T., Cruz A., 2018, arXiv e-prints,
- Schaye & Dalla Vecchia (2008) Schaye J., Dalla Vecchia C., 2008, MNRAS, 383, 1210
- Schaye et al. (2003) Schaye J., Aguirre A., Kim T.-S., Theuns T., Rauch M., Sargent W. L. W., 2003, ApJ, 596, 768
- Schaye et al. (2010) Schaye J., et al., 2010, MNRAS, 402, 1536
- Schaye et al. (2015) Schaye J., et al., 2015, MNRAS, 446, 521
- Sijacki et al. (2007) Sijacki D., Springel V., Di Matteo T., Hernquist L., 2007, MNRAS, 380, 877
- Silk (1977) Silk J., 1977, ApJ, 211, 638
- Somerville et al. (2008) Somerville R. S., Hopkins P. F., Cox T. J., Robertson B. E., Hernquist L., 2008, MNRAS, 391, 481
- Springel (2005) Springel V., 2005, MNRAS, 364, 1105
- Springel & Hernquist (2003) Springel V., Hernquist L., 2003, MNRAS, 339, 312
- Springel et al. (2005) Springel V., Di Matteo T., Hernquist L., 2005, MNRAS, 361, 776
- Stocke et al. (2013) Stocke J. T., Keeney B. A., Danforth C. W., Shull J. M., Froning C. S., Green J. C., Penton S. V., Savage B. D., 2013, ApJ, 763, 148
- Trayford et al. (2016) Trayford J. W., Theuns T., Bower R. G., Crain R. A., Lagos C. d. P., Schaller M., Schaye J., 2016, MNRAS, 460, 3925
- Trayford et al. (2017) Trayford J. W., et al., 2017, MNRAS, 470, 771
- Tremmel et al. (2017) Tremmel M., Karcher M., Governato F., Volonteri M., Quinn T. R., Pontzen A., Anderson L., Bellovary J., 2017, MNRAS, 470, 1121
- Tumlinson et al. (2011) Tumlinson J., et al., 2011, Science, 334, 948
- Tumlinson et al. (2013) Tumlinson J., et al., 2013, ApJ, 777, 59
- Tumlinson et al. (2017) Tumlinson J., Peeples M. S., Werk J. K., 2017, ARA&A, 55, 389
- Turner et al. (2017) Turner M. L., Schaye J., Crain R. A., Rudie G., Steidel C. C., Strom A., Theuns T., 2017, preprint, (arXiv:1703.00086)
- Weinberger et al. (2017) Weinberger R., et al., 2017, MNRAS, 465, 3291
- Werk et al. (2012) Werk J. K., Prochaska J. X., Thom C., Tumlinson J., Tripp T. M., O’Meara J. M., Meiring J. D., 2012, ApJS, 198, 3
- Werk et al. (2014) Werk J. K., et al., 2014, ApJ, 792, 8
- White & Frenk (1991) White S. D. M., Frenk C. S., 1991, ApJ, 379, 52
- White & Rees (1978) White S. D. M., Rees M. J., 1978, MNRAS, 183, 341
- Wiersma et al. (2009a) Wiersma R. P. C., Schaye J., Smith B. D., 2009a, MNRAS, 393, 99
- Wiersma et al. (2009b) Wiersma R. P. C., Schaye J., Theuns T., Dalla Vecchia C., Tornatore L., 2009b, MNRAS, 399, 574
- Wright et al. (2018) Wright R. J., Lagos C. d. P., Davies L. J. M., Power C., Trayford J. W., Wong O. I., 2018, preprint, (arXiv:1810.07335)